Heterozygous expression of a Kcnt1 gain-of-function variant has differential effects on somatostatin- and parvalbumin-expressing cortical GABAergic neurons
- Fralin Biomedical Research Institute at Virginia Tech Carilion, Center for Neurobiology Research, United States
- Department of Neurological Sciences, University of Vermont, United States
- Translational Biology, Medicine, and Health Graduate Program, Fralin Biomedical Research Institute at Virginia Tech Carilion, United States
- Department of Pharmaceutical Sciences, UNT System College of Pharmacy, University of North Texas Health Science Center, United States
- School of Biomedical Sciences, University of North Texas Health Science Center, United States
- Department of Pharmacology, Vanderbilt University, United States
- Vanderbilt Institute of Chemical Biology, Vanderbilt University, United States
- Department of Chemistry, Vanderbilt University, United States
- Institute for Genomic Medicine, Columbia University, United States
- Department of Neurology, Columbia University, United States
- School of Neuroscience, Virginia Tech, United States
Figures
Figure 1
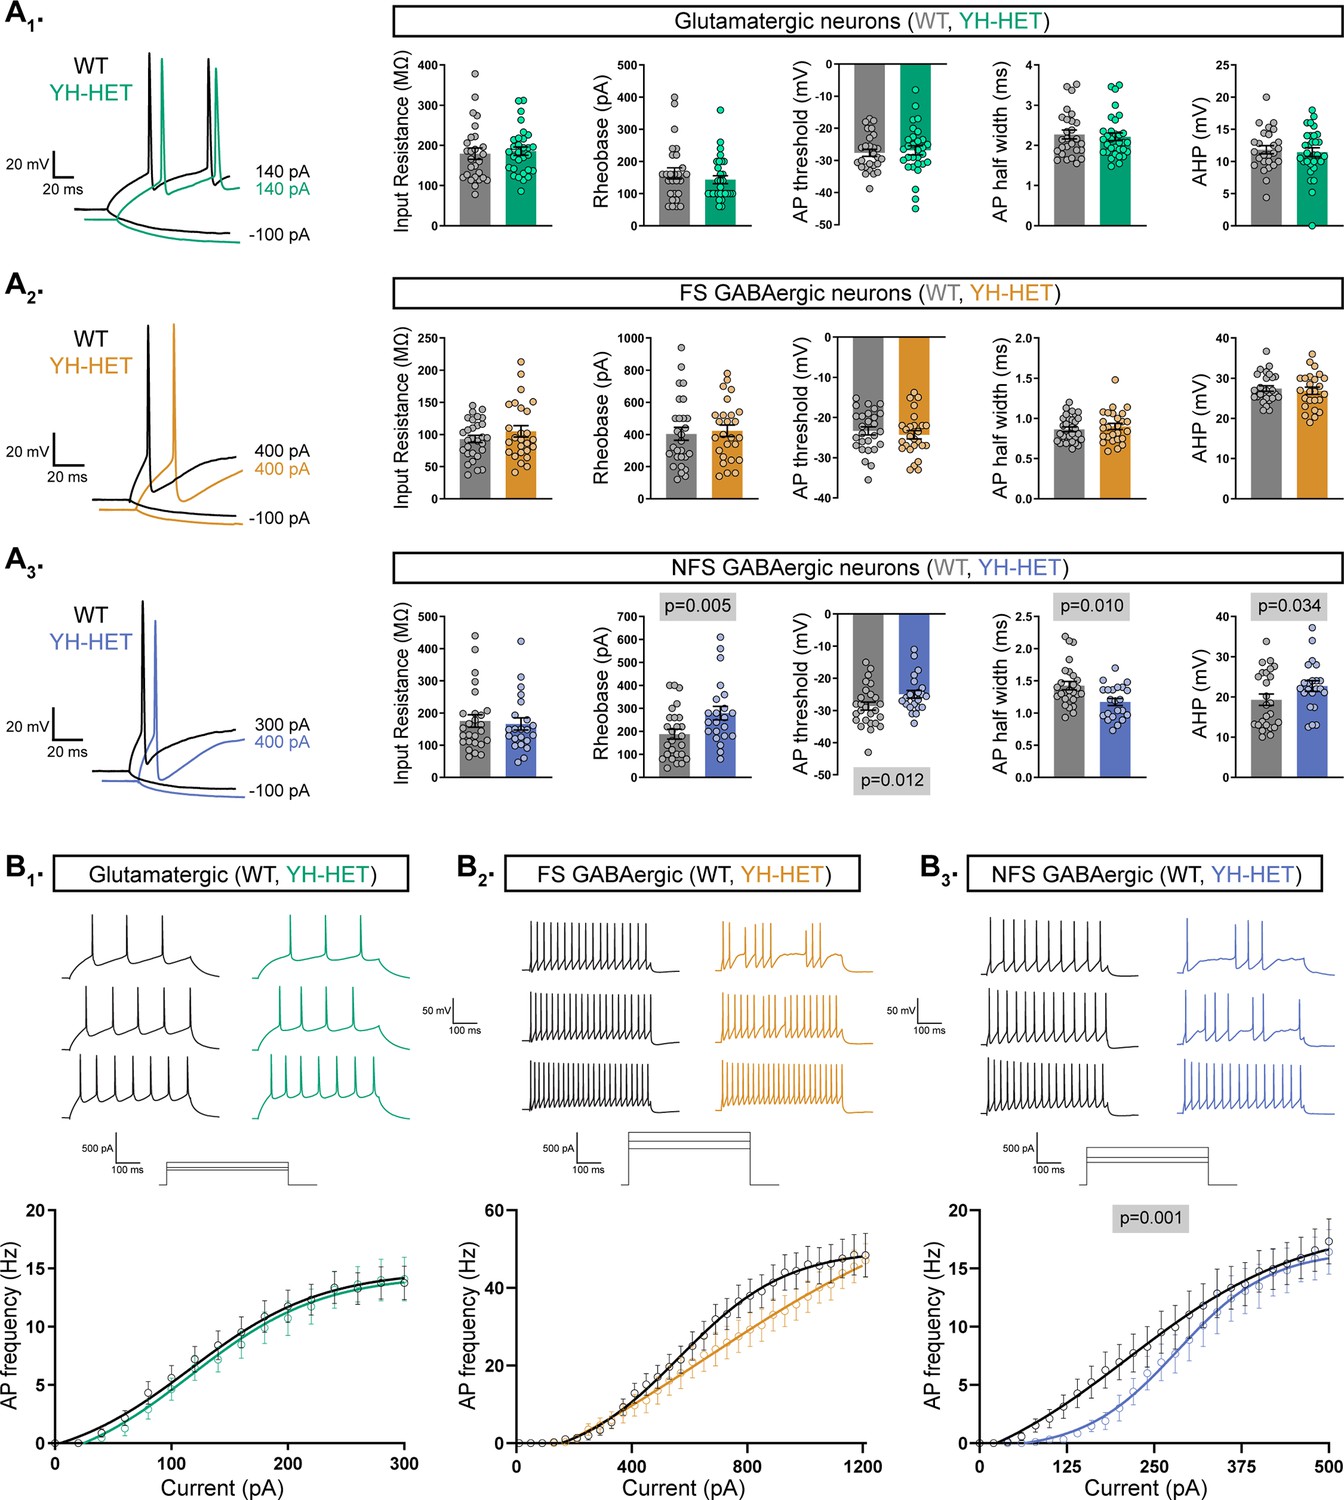
Heterozygous Kcnt1Y777H expression alters action potential (AP) shape and generation in non-fast spiking (NFS) GABAergic neurons.
(A1–A3) On the left, representative responses to step currents are shown for glutamatergic, and fast spiking (FS) and NFS GABAergic, wildtype (WT) (black) and YH-HET (colors) neurons (top to bottom), illustrating the input resistance (in response to a hyperpolarizing step) and the rheobase (the first trace with an AP in response to a depolarizing step) for each neuron type. On the right, bar graphs show quantification and mean ± standard error of the mean (SEM) of the membrane properties and AP parameters for each neuron type for WT (gray) and YH-HET (colors) groups, with individual neuron measurements overlaid in scatter plots. The p-values are shown on each graph where p < 0.05. (B1–B3) Representative traces are shown at low, medium, and high current steps for glutamatergic, and FS and NFS GABAergic, WT (black) and YH-HET (colors) neurons (left to right). The line graphs below show the number of APs (mean ± SEM) per current injection step in WT (black) and YH-HET (colors) neurons. Statistical significance was tested using generalized linear mixed models, and p-values are shown on each graph where p < 0.05. Data from this figure are from 9 WT and 9 YH-HET littermate pups, with the following neuron sample sizes: glutamatergic WT (n=27) and YH-HET (n=30), FS GABAergic WT (n=27) and YH-HET (n=29), and NFS GABAergic WT (n=26) and YH-HET (n=22).
-
Figure 1—source data 1
File containing data used to generate the graphs in Figure 1.
- https://cdn.elifesciences.org/articles/92915/elife-92915-fig1-data1-v1.xlsx
Figure 2 with 1 supplement
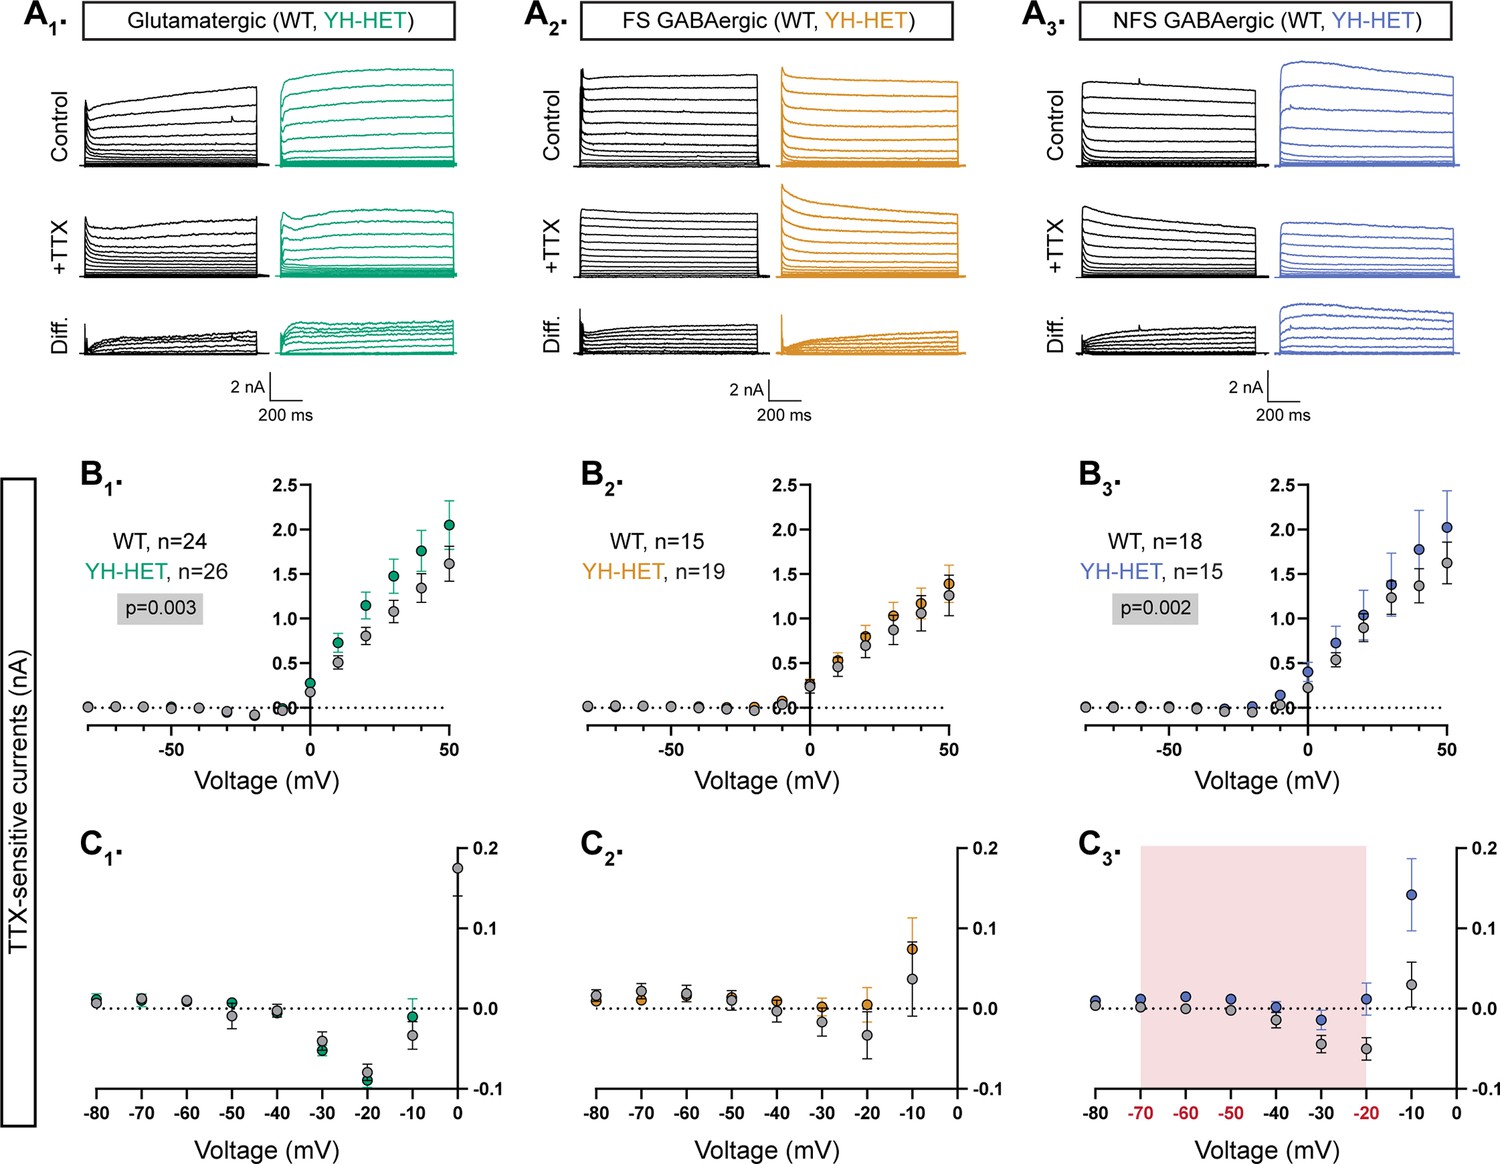
Heterozygous Kcnt1Y777H expression increases subthreshold KNa currents in non-fast spiking (NFS) GABAergic neurons.
(A1–A3) Representative traces in control (top), 0.5 µM tetrodotoxin (TTX) (middle), and the difference current (bottom) calculated by subtracting the membrane current response to voltage steps (−80 to +50 mV) from a holding potential of −70 mV in TTX from the response in control external solution in glutamatergic, and fast spiking (FS) and NFS GABAergic, wildtype (WT) (black) and YH-HET (colors) neurons. To include all of the representative traces in the figures, and prevent overlap of the traces, the large inward sodium currents were removed from each set of traces using the masking tool in Adobe Illustrator. (B1–B3) Summary data show the KNa current (mean ± SEM) for each voltage step in glutamatergic, and FS and NFS GABAergic, WT (black and gray) and YH-HET (colors) neurons. The p-values are shown on each graph where p < 0.05, and the n values are the number of neurons recorded for each group. (C1–C3) Plots of the KNa current (mean ± SEM) for each voltage step from −80 to 0 mV in WT (black and gray) and YH-HET (colors) neurons to illustrate the values that are too small to be seen on the graphs in B1–B3. The shaded red area in C3 indicates the subthreshold voltage range with significantly higher KNa currents (red voltages along x-axis indicate steps where p < 0.05) in YH-HET relative to WT neurons. Statistical significance for I–V plots was tested using generalized linear mixed models with genotype and voltage step as fixed effects followed by pairwise comparisons at each level.
-
Figure 2—source data 1
File containing data used to generate the graphs in Figure 2.
- https://cdn.elifesciences.org/articles/92915/elife-92915-fig2-data1-v1.xlsx
Figure 2—figure supplement 1
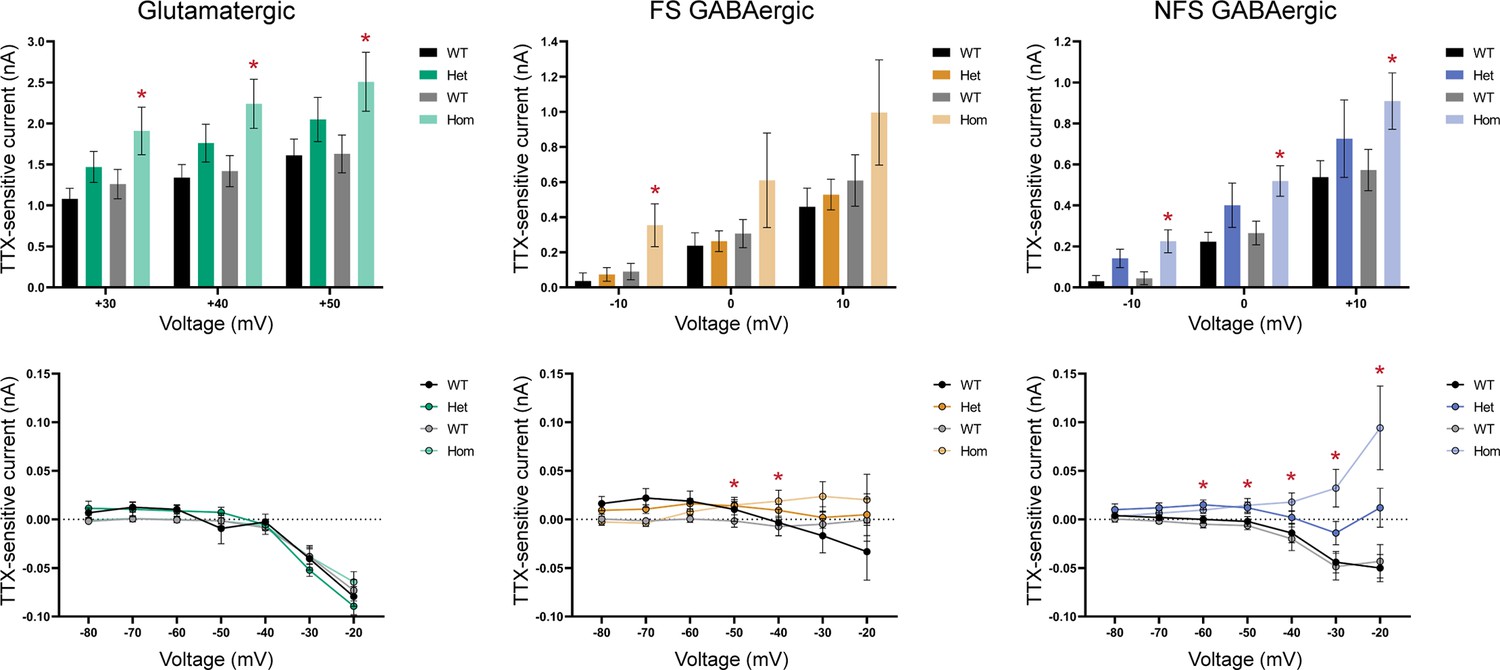
The magnitudes of the KNa current increases in YH-HET glutamatergic and non-fast spiking (NFS) GABAergic neurons are intermediate to those of wildtype (WT) and YH-HOM neurons.
Bar graphs (top three) illustrate differences in KNa current (mean ± SEM) between YH-HET [dark color; WT littermates (black)] and YH-HOM [light color; WT littermates (gray)] neurons for voltage steps where significant increases were previously observed (red asterisks where p < 0.05) in glutamatergic, and fast spiking (FS) and NFS GABAergic, YH-HOM neurons. Line graphs (bottom three) illustrate differences in KNa current (mean ± SEM) between YH-HET [dark color; WT littermates (black)] and YH-HOM [light color; WT littermates (gray)] neurons across negative voltage steps (−80 to −20 mV; red asterisks where p < 0.05 in YH-HOM compared with WT) in glutamatergic, and FS and NFS GABAergic, neurons.
-
Figure 2—figure supplement 1—source data 1
File containing data used to generate the graphs in Figure 2—figure supplement 1.
- https://cdn.elifesciences.org/articles/92915/elife-92915-fig2-figsupp1-data1-v1.xlsx
Figure 3
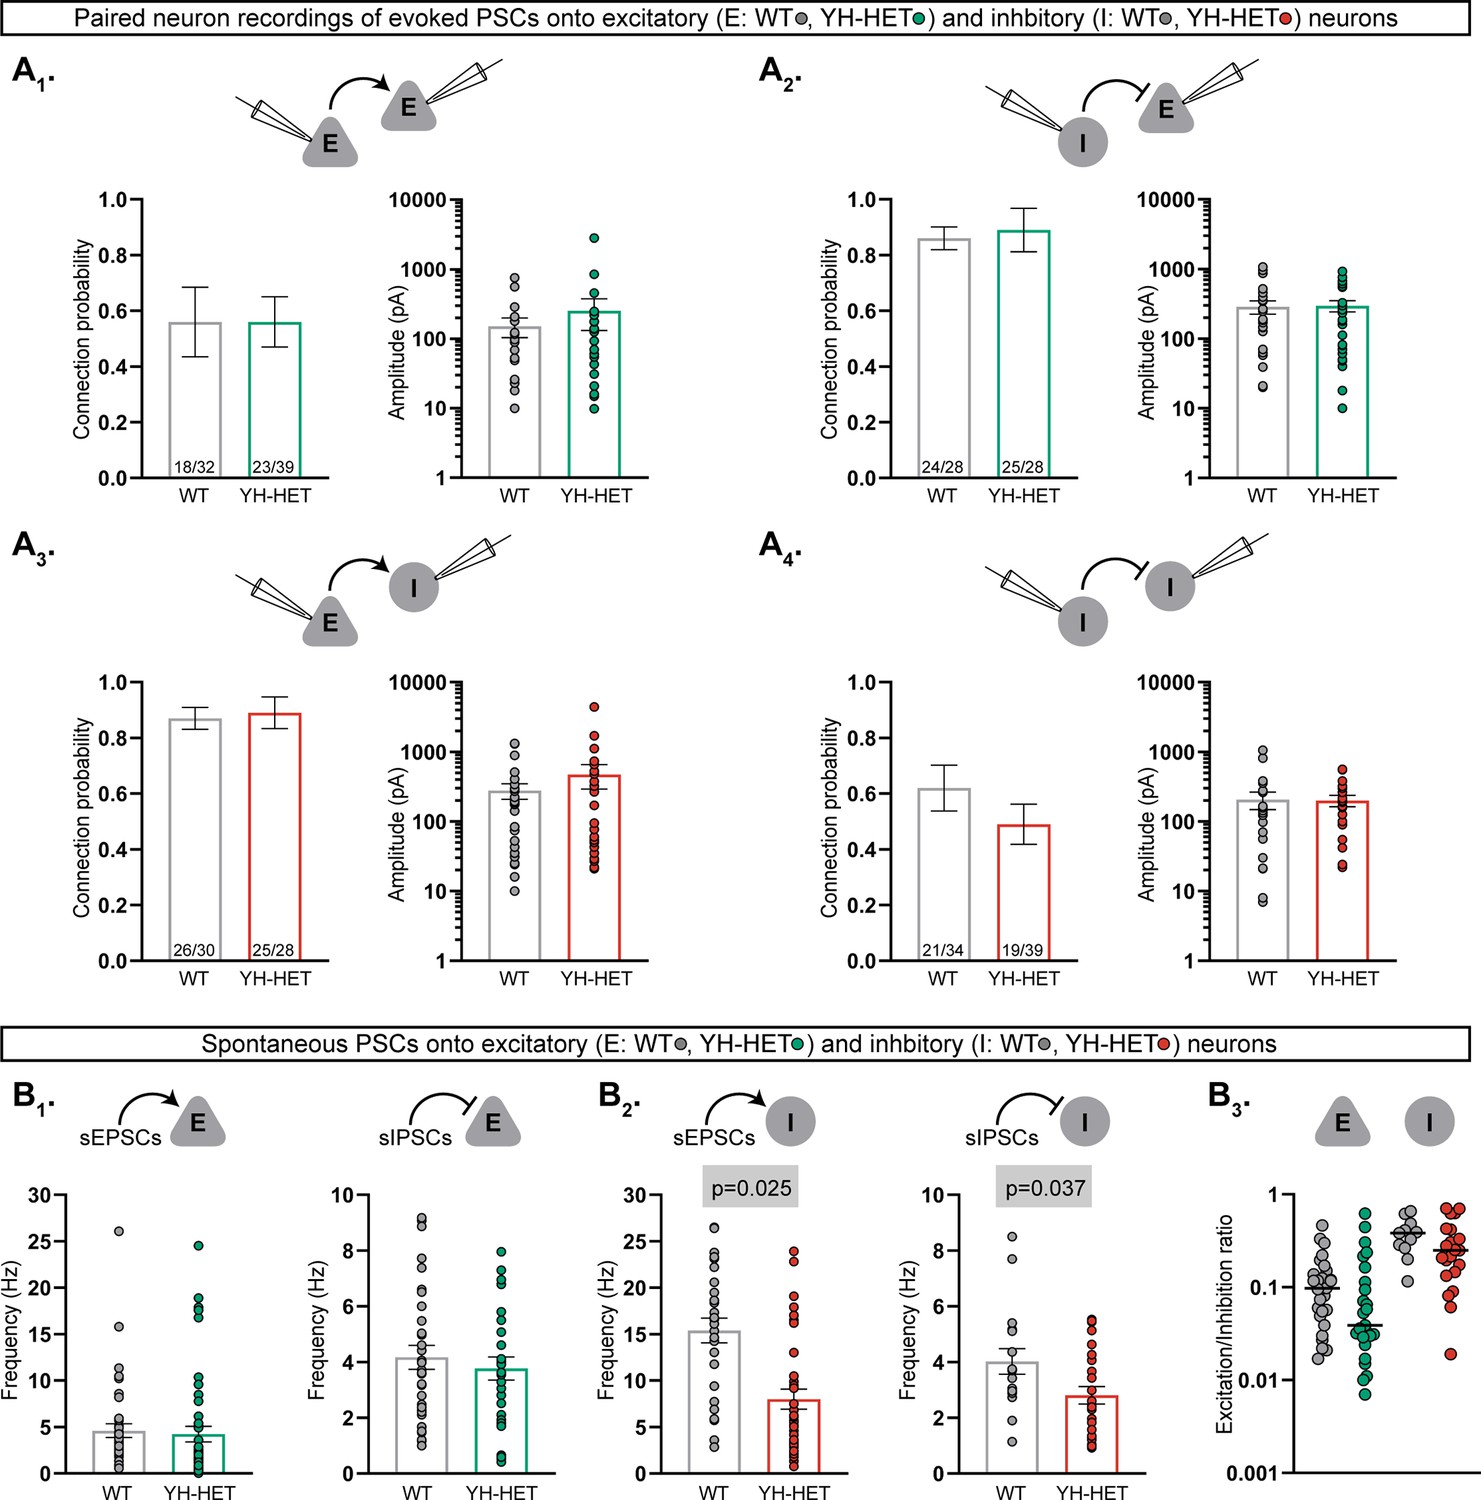
Heterozygous Kcnt1Y777H expression does not alter synaptic connectivity or the excitation–inhibition balance.
(A1–A4) Evoked postsynaptic currents (PSCs) were recorded from neuron pairs glutamatergic (excitatory, E) and GABAergic (inhibitory, I) by stimulating the neuron type indicated on the left and recording the response in the neuron type indicated on the right (wildtype [WT], gray; YH-HET E, green; YH-HET I, red). Bar graphs below each recorded neuron pair schematic show summary data (mean ± SEM) of the connection probability (left graph; numbers on bars represent connected pair number/recorded pair number) and peak evoked PSC amplitude (right graph; dots represent individual evoked responses) between each motif. (B1) Bar graphs with overlaid individual neuron measurements and mean ± SEM show the spontaneous EPSC (sEPSC) or IPSC (sIPSC) frequency onto E neurons (WT, gray; YH-HET, green). (B2) Bar graphs with overlaid individual neuron measurements and mean ± SEM show the sEPSC or sIPSC frequency onto I neurons (WT, gray; YH-HET, red). (B3) Scatter plots show individual E/I ratio measurements onto E neurons (WT, gray; YH-HET, green) and I neurons (WT, gray; YH-HET, red). The p-values are shown on each graph where p < 0.05.
-
Figure 3—source data 1
File containing data used to generate the graphs in Figure 3.
- https://cdn.elifesciences.org/articles/92915/elife-92915-fig3-data1-v1.xlsx
Figure 4 with 3 supplements
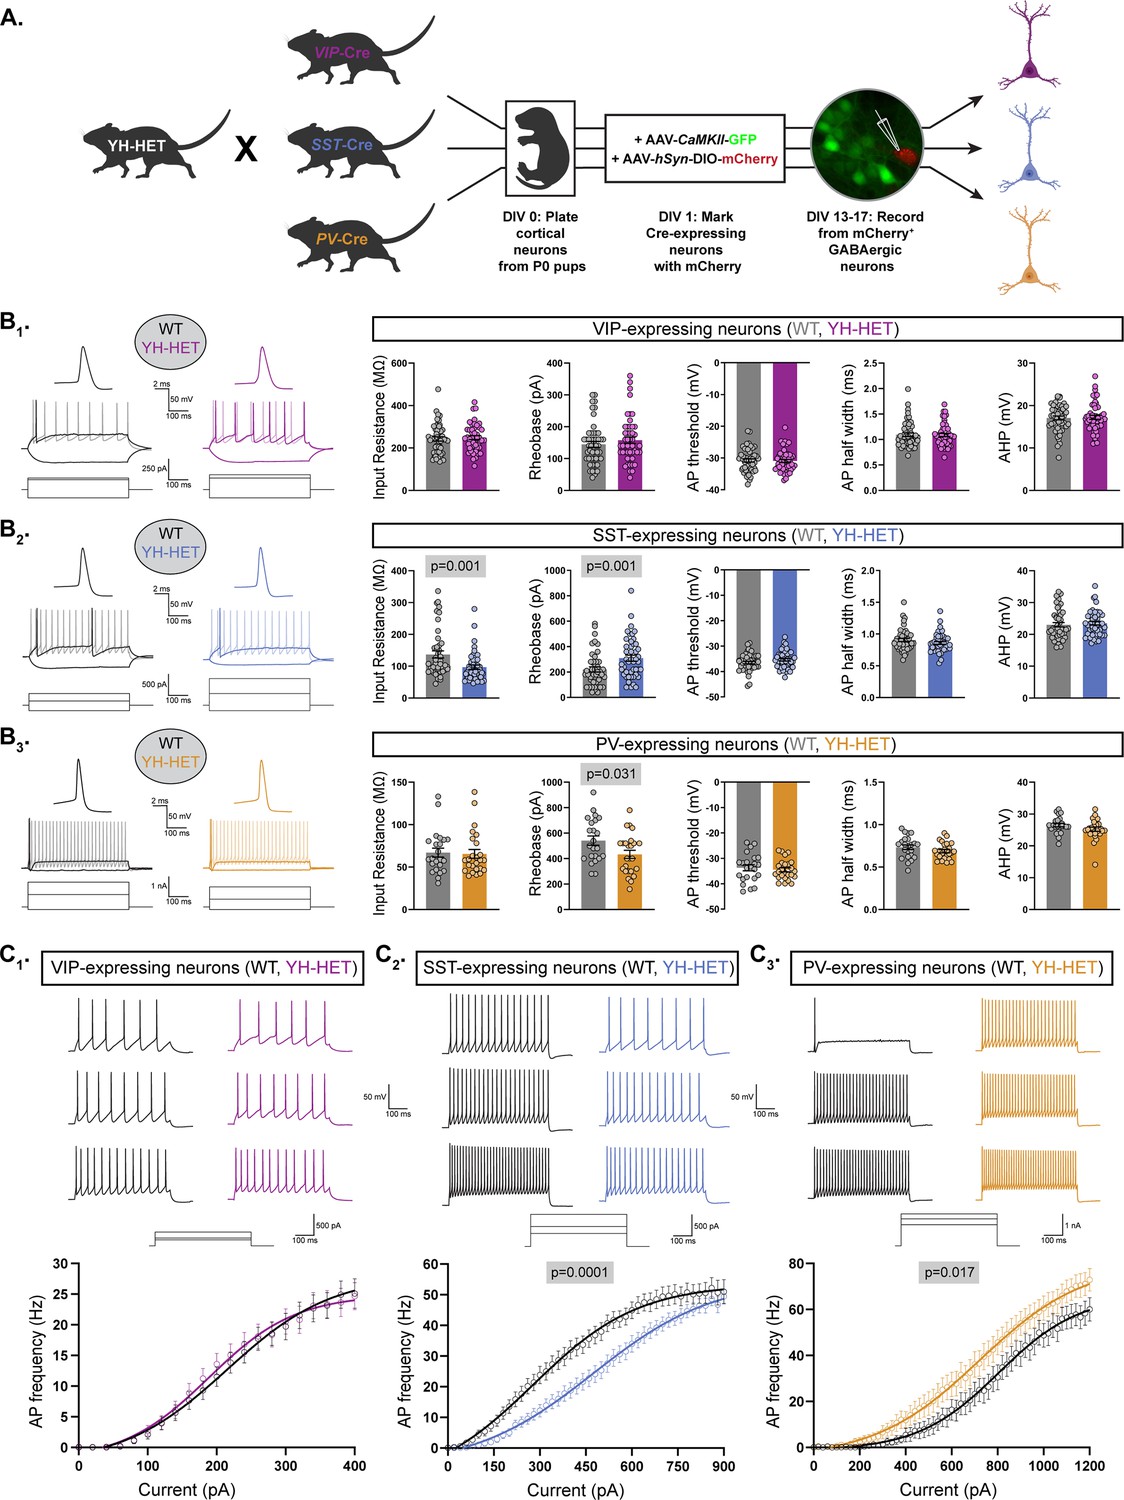
Heterozygous Kcnt1Y777H expression differentially affects the intrinsic excitability of somatostatin (SST)- and parvalbumin (PV)-expressing GABAergic neurons.
(A) A schematic diagram illustrates the strategy for generating fluorescently labeled GABAergic subtype-specific neurons. YH-HET mice were crossed to vasoactive intestinal polypeptide (VIP)-, SST-, or PV-Cre mice, and the resulting P0 wildtype (WT) and YH-HET littermate pups were used to isolate and culture cortical neurons. At DIV 1, neurons were infected with AAV-CamKIIa-GFP to label glutamatergic neurons, and AAV-hSyn-DIO-mCherry to label Cre-expressing neurons. At DIV 13–17, whole-cell, patch-clamp electrophysiology was performed on mCherry+/GFP− neurons. (B1–B3) On the left, representative responses to step currents are shown for VIP-, SST-, and PV-expressing WT (black) and YH-HET (colors) neurons (top to bottom). For each neuron type, the superimposed dark traces illustrate the input resistance (in response to a hyperpolarizing step) and the rheobase (the first trace with an action potential (AP) in response to a depolarizing step), and the light trace shows the first step current response to induce repetitive AP firing across the step. Above the superimposed traces, the first AP of each rheobase trace is shown (same vertical scale, increased horizontal scale). On the right, bar graphs show quantification of the membrane properties and AP parameters for each neuron type (VIP, SST, and PV, top to bottom) for WT (gray) and YH-HET (colors) groups, with individual neuron measurements overlaid in scatter plots. The p-values are shown above each graph where p < 0.05. (C1–C3) For VIP-, SST-, and PV-expressing neurons (left to right), representative traces are shown at low, medium, and high current steps, and the line graphs below show the number of APs (mean ± SEM) per current injection step in WT (black) and YH-HET (colors) neurons. Statistical significance was tested using generalized linear mixed models, and p-values are shown above each graph where p < 0.05. Data from this figure are from the following mouse pup (N) and neuron (n) sample sizes: VIP WT (N=3, n=50) and YH-HET (N=4, n=48), SST WT (N=4, n=45) and YH-HET (N=5, n=46), and PV WT (N=3, n=23) and YH-HET (N=4, n=25).
-
Figure 4—source data 1
File containing data used to generate the graphs in Figure 4.
- https://cdn.elifesciences.org/articles/92915/elife-92915-fig4-data1-v1.xlsx
Figure 4—figure supplement 1
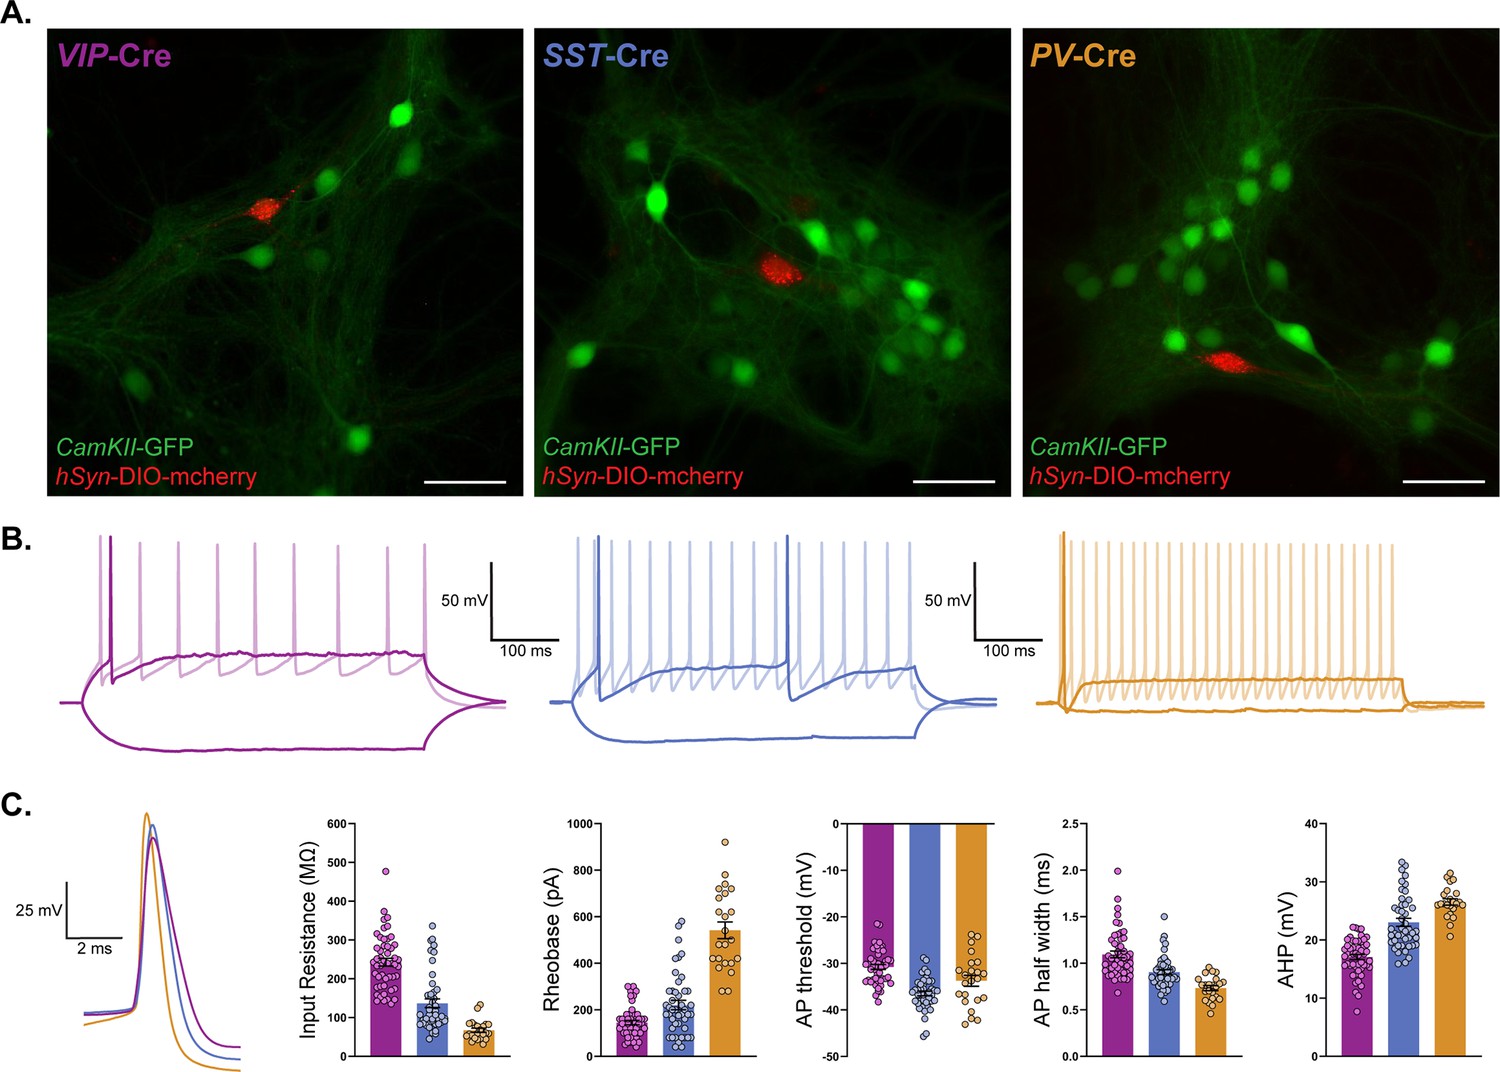
Cre recombinase-expressing, cortical GABAergic neuron subpopulations retain characteristic electrophysiological features in culture.
Cortical neurons isolated and cultured from P0 pups (Kcnt1+/+) from vasoactive intestinal polypeptide (VIP)-, somatostatin (SST)-, or parvalbumin (PV)-Cre mouse lines were infected with AAV-CamKIIa-GFP to label glutamatergic neurons, and AAV-hSyn-DIO-mCherry to label Cre-expressing neurons, at DIV 1. (A) Images show GFP+ glutamatergic neurons and mCherry+ VIP-, SST-, or PV-expressing neurons (left to right) at DIV 14 (VIP and SST) or DIV 16 (PV). The scale bars represent 50 µm. (B) Representative responses to step currents are shown for VIP (purple), SST (blue), and PV (orange) neurons (left to right). For each neuron type, the superimposed dark traces illustrate the input resistance (in response to a hyperpolarizing step) and the rheobase (the first trace with an action potential (AP) in response to a depolarizing step), and the light trace shows the first step current response to induce repetitive AP firing across the step. (C) On the left, the first AP of each rheobase trace is shown for VIP (purple), SST (blue), and PV (orange) neurons. On the right, bar graphs show quantification of the membrane properties and AP parameters for each neuron type (VIP, SST, and PV, left to right), with individual neuron measurements overlaid in scatter plots.
-
Figure 4—figure supplement 1—source data 1
File containing data used to generate the graphs in Figure 4—figure supplement 1.
- https://cdn.elifesciences.org/articles/92915/elife-92915-fig4-figsupp1-data1-v1.xlsx
Figure 4—figure supplement 2
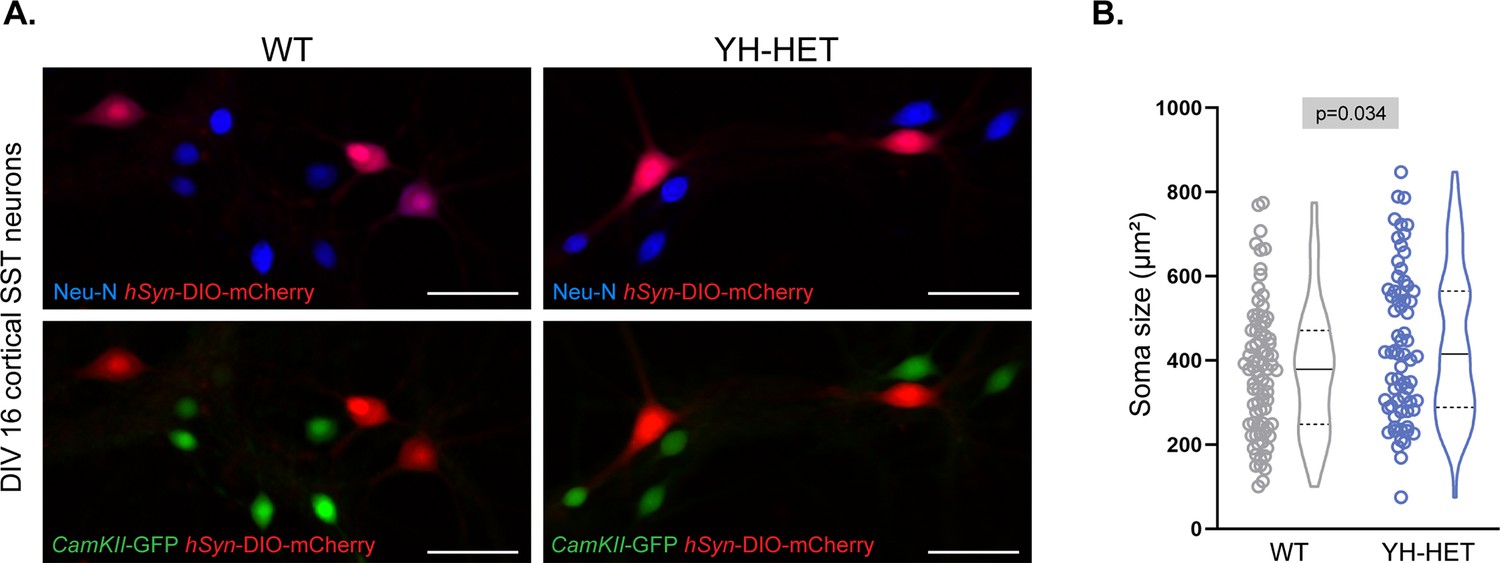
YH-HET somatostatin (SST) neurons have increased soma size compared with those of wildtype (WT).
Cortical neurons were isolated and cultured from P0 pup progeny (WT and YH-HET) of YH-HET mice crossed to SST-Cre mice. Neurons were infected with AAV-CamKIIa-GFP to label glutamatergic neurons, and AAV-hSyn-DIO-mCherry to label Cre-expressing neurons, at DIV 1, and immunostained using anti-Neu-N antibodies at DIV 16. (A) Top two images show mCherry+ SST-expressing neurons as a subpopulation of Neu-N+ cortical neurons, and bottom two images show GFP−, mCherry+ SST-expressing neurons intermingled with GFP+ glutamatergic neurons. The scale bars represent 50 µm. (B) A graph shows individual neuron measurements and summary violin plots of the mCherry+ neuron soma size (WT, gray; YH-HET, blue) with the p-value displayed at the top.
-
Figure 4—figure supplement 2—source data 1
File containing data used to generate the graphs in Figure 4—figure supplement 2.
- https://cdn.elifesciences.org/articles/92915/elife-92915-fig4-figsupp2-data1-v1.xlsx
Figure 4—figure supplement 3
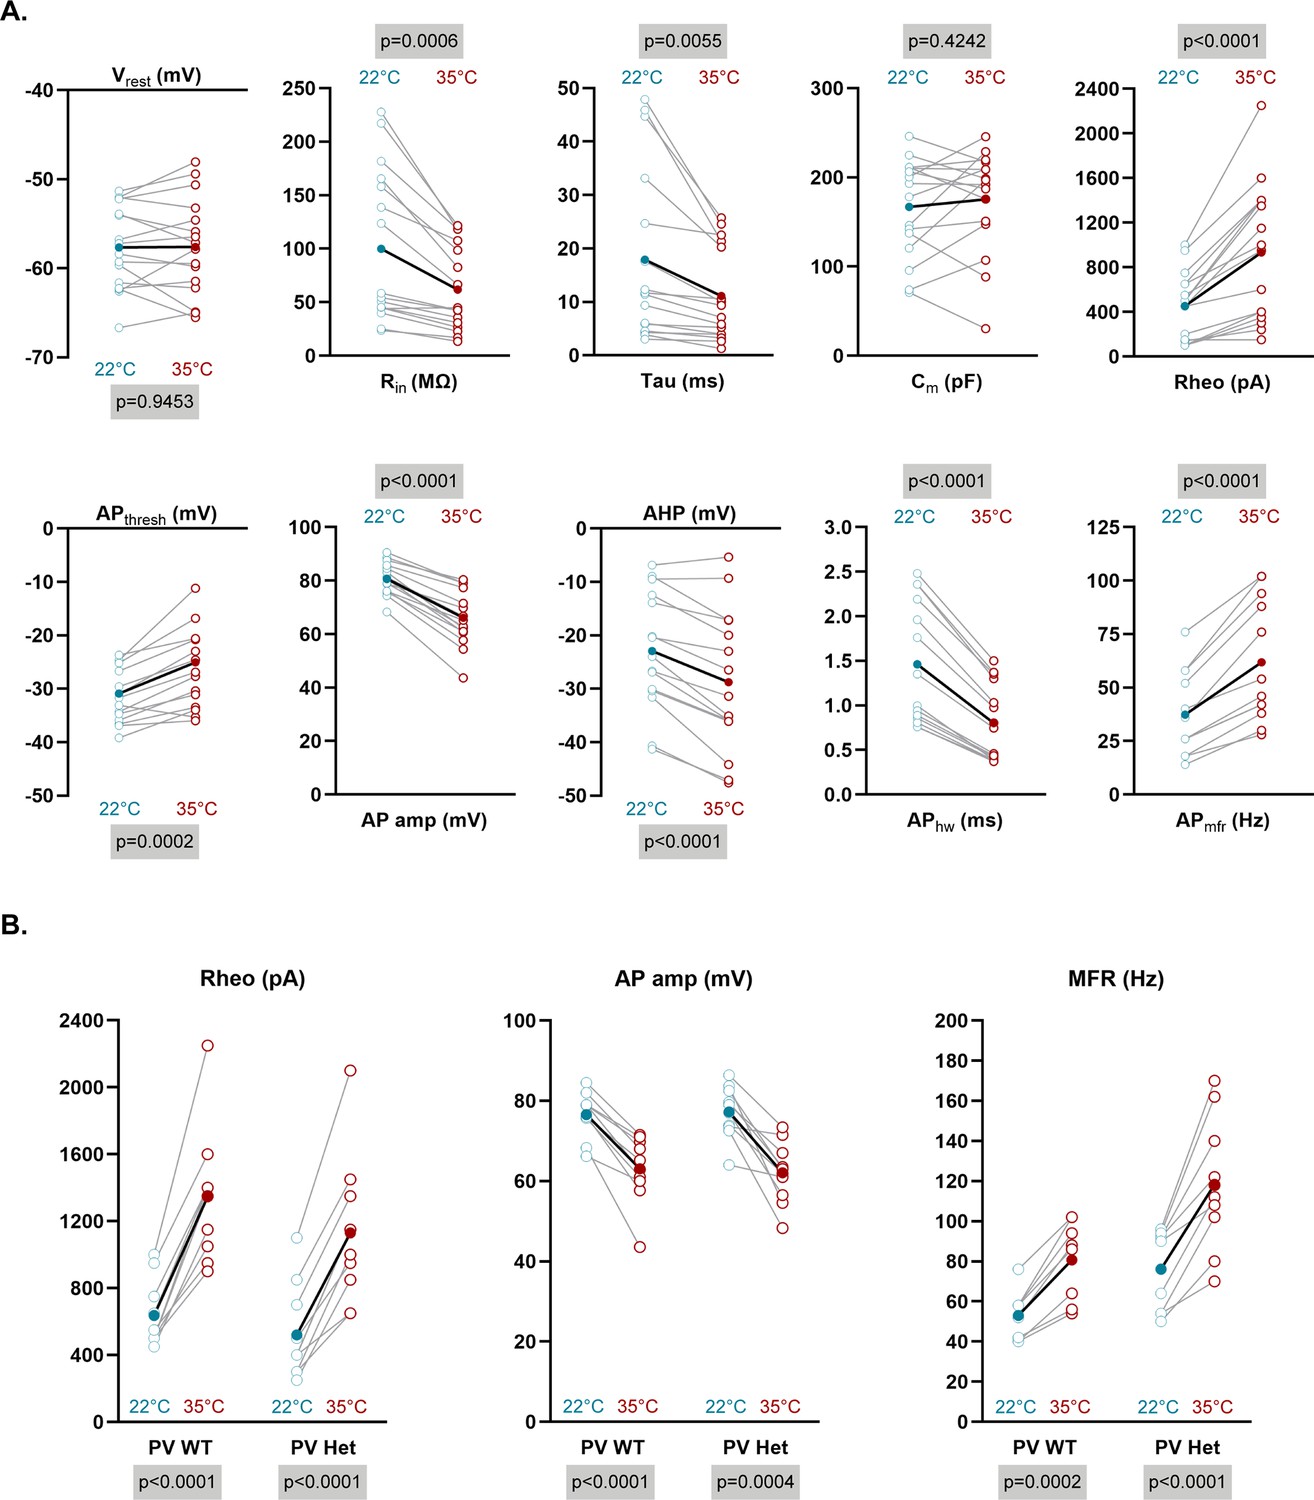
YH-HET and wildtype (WT) parvalbumin (PV) neurons show similar neurophysiological responses to increased temperature.
YH-HET mice were crossed to PV-Cre mice, and the resulting P0 WT and YH-HET littermate pups were used to isolate and culture cortical neurons. At DIV 1, neurons were infected with AAV-CamKIIa-GFP to label glutamatergic neurons, and AAV-hSyn-DIO-mCherry to label Cre-expressing neurons. At DIV 16 and 17, whole-cell, patch-clamp electrophysiology was performed on glutamatergic (mCherry−/GFP+), GABAergic (mCherry−/GFP−), or PV (mCherry+/GFP−) neurons at room temperature (~22°C). Then, the external solution was warmed to 35°C, and the measurements were repeated. (A) Before–after plots of glutamatergic and GABAergic WT neurons (n = 16) show alterations in all parameters measured with increased temperature, excluding the resting membrane potential (Vrest) and membrane capacitance (Cm). (B) Before–after plots show highly similar responses to temperature increases between WT (n = 11) and YH-HET (n = 10) PV neurons for rheobase, action potential (AP) amp, and maximal firing frequency (MFR). Empty circles represent individual neurons, and filled-in circles represent the averages for each group. Lines connect the before and after measurements for each neuron.
-
Figure 4—figure supplement 3—source data 1
File containing data used to generate the graphs in Figure 4—figure supplement 3.
- https://cdn.elifesciences.org/articles/92915/elife-92915-fig4-figsupp3-data1-v1.xlsx
Figure 5 with 2 supplements
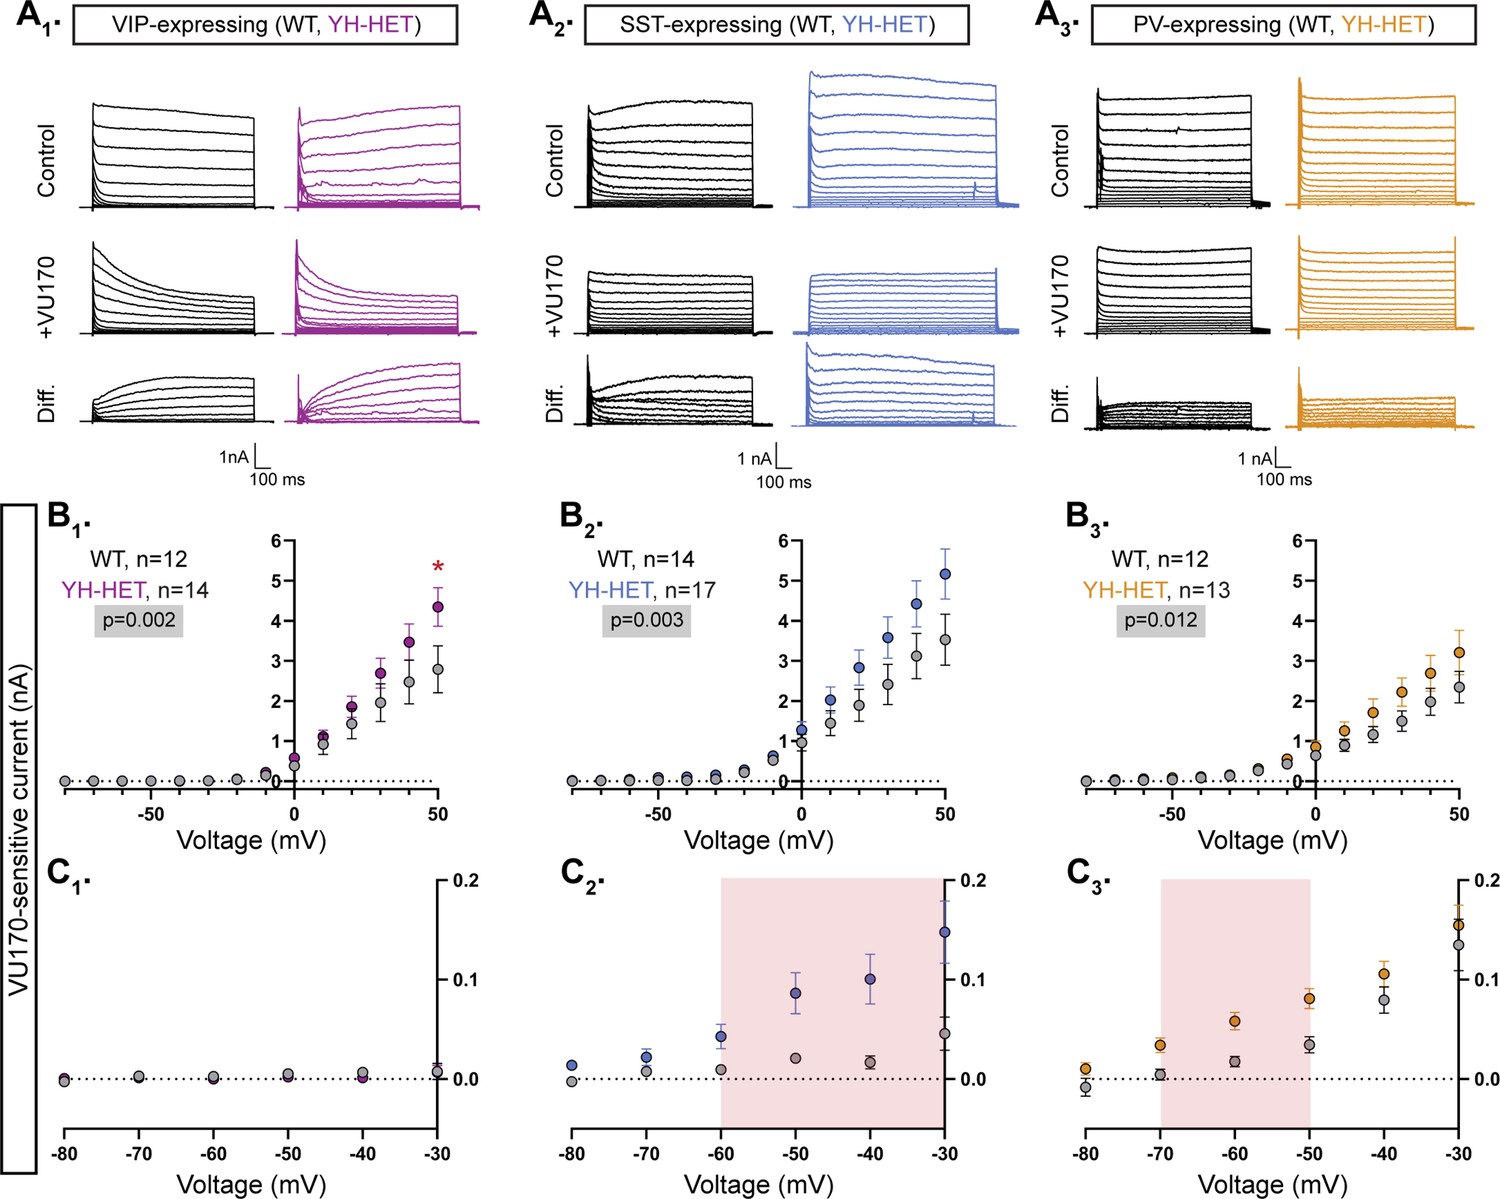
The Kcnt1Y777H variant increases KCNT1-mediated currents across subthreshold voltages in somatostatin (SST)- and parvalbumin (PV)-expressing GABAergic neurons.
(A1–A3) Representative traces in control (top), 10 µM VU170 (middle), and the difference current (bottom) calculated by subtracting the membrane current response to voltage steps (−80 to +50 mV) from a holding potential of −70 mV in VU170 from the response in control external solution in vasoactive intestinal polypeptide (VIP)-, SST-, and PV-expressing, wildtype (WT) (black) and YH-HET (colors) neurons. To include all of the representative traces in the figures, and prevent overlap of the traces, the large inward sodium currents were removed from each set of traces using the masking tool in Adobe Illustrator. (B1–B3) Summary data show the KCNT1 current (mean ± SEM) for each voltage step in VIP-, SST-, and PV-expressing, WT (black and gray) and YH-HET (colors) neurons. The p-values are shown on each graph where p < 0.05, and the n values are the number of neurons recorded for each group. (C1–C3) Plots of the KNa current (mean ± SEM) for each voltage step from −80 to 0 mV in WT (black and gray) and YH-HET (colors) neurons to illustrate the values that are too small to be seen on the graphs in B1–B3. The shaded red areas in C2 and C3 indicate the subthreshold voltage range with significantly higher KNa currents (p < 0.05) in YH-HET relative to WT neurons. Statistical significance for I–V plots was tested using generalized linear mixed models with genotype and voltage step as fixed effects followed by pairwise comparisons at each level. Asterisks indicate where p < 0.05 (*).
-
Figure 5—source data 1
File containing data used to generate the graphs in Figure 5.
- https://cdn.elifesciences.org/articles/92915/elife-92915-fig5-data1-v1.xlsx
Figure 5—figure supplement 1
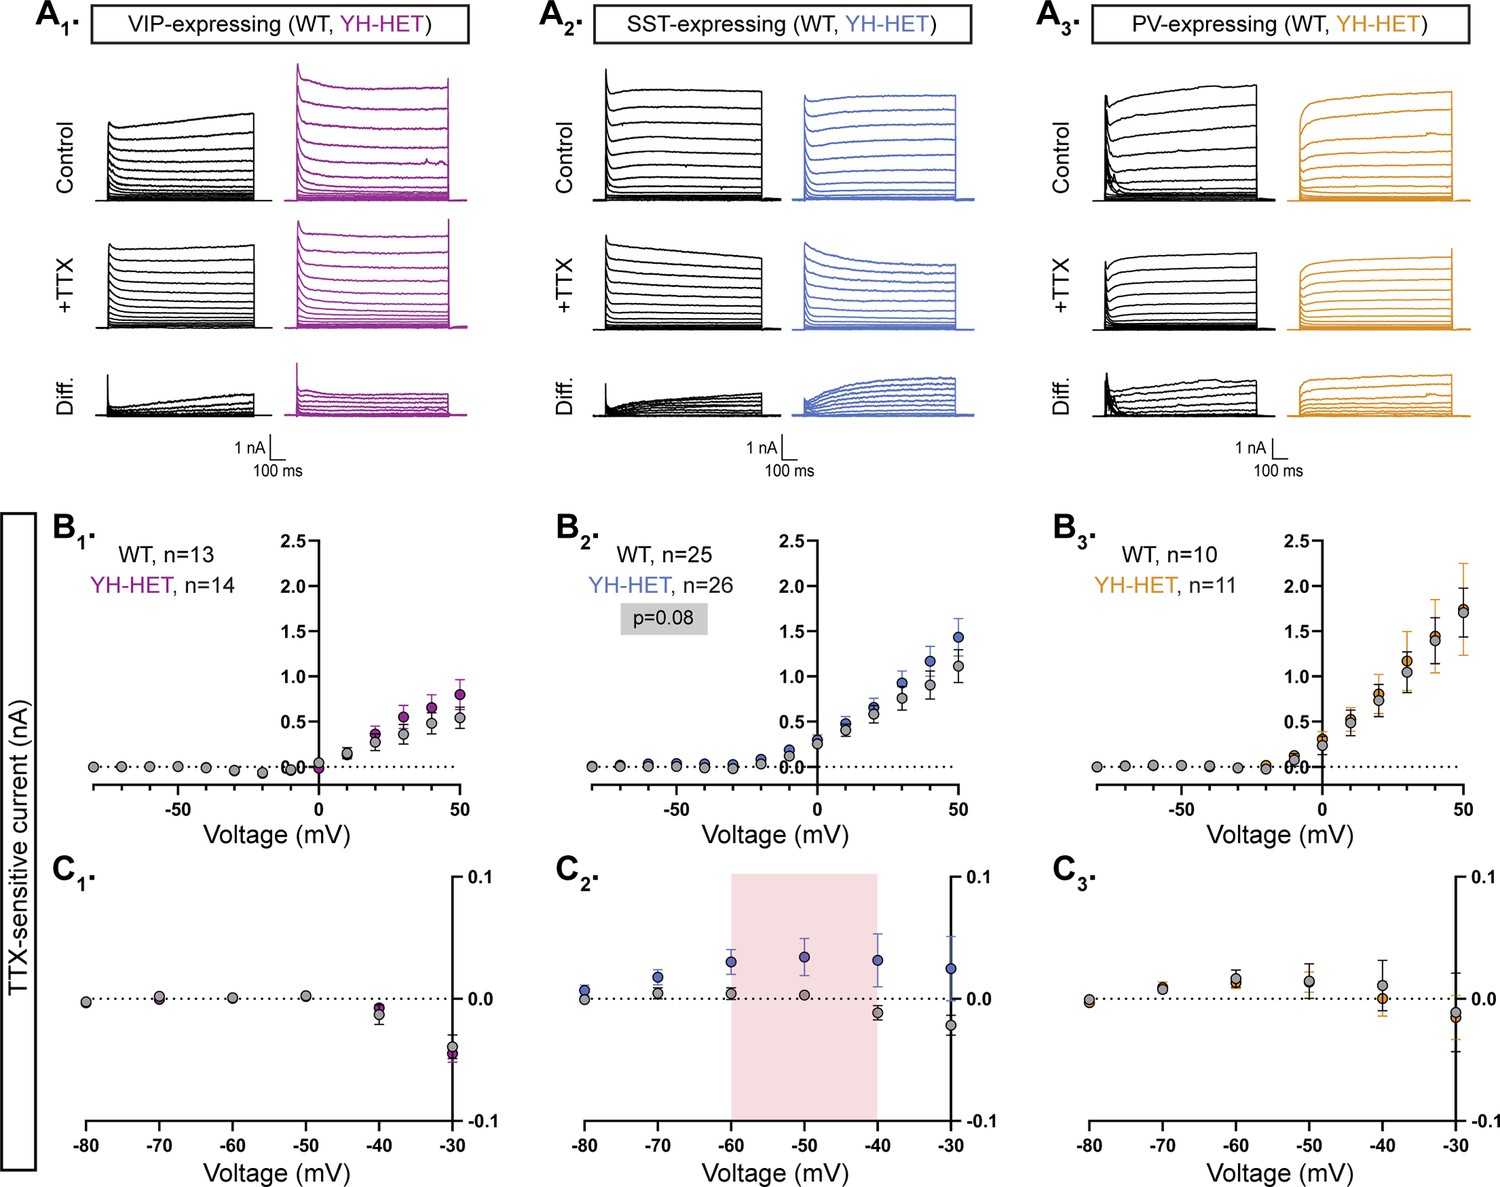
The Kcnt1Y777H variant increases KNa currents measured with tetrodotoxin (TTX) subtraction across subthreshold voltages in somatostatin (SST)-expressing GABAergic neurons.
(A1–A3) Representative traces in control (top), 0.5 µM TTX (middle), and the difference current (bottom) calculated by subtracting the membrane current response to voltage steps (−80 to +50 mV) from a holding potential of −70 mV in TTX from the response in control external solution in vasoactive intestinal polypeptide (VIP)-, SST-, and parvalbumin (PV)-expressing, wildtype (WT) (black) and YH-HET (colors) neurons. To include all of the representative traces in the figures, and prevent overlap of the traces, the large transient inward sodium currents were removed from each set of traces using the masking tool in Adobe Illustrator. (B1–B3) Summary data show the KNa current (mean ± SEM) for each voltage step in VIP-, SST-, and PV-expressing, WT (black and gray) and YH-HET (colors) neurons. The p-values are shown on each graph where p < 0.05, and the n values are the number of neurons recorded for each group. (C1–C3) Plots of the KNa current (mean ± SEM) for each voltage step from −80 to 0 mV in WT (black and gray) and YH-HET (colors) neurons to illustrate the values that are too small to be seen on the graphs in B1–B3. The shaded red area in C2 indicates the subthreshold voltage range with significantly higher KNa currents in YH-HET relative to WT neurons. Statistical significance for I–V plots was tested using generalized linear mixed models with genotype and voltage step as fixed effects followed by pairwise comparisons at each level.
-
Figure 5—figure supplement 1—source data 1
File containing data used to generate the graphs in Figure 5—figure supplement 1.
- https://cdn.elifesciences.org/articles/92915/elife-92915-fig5-figsupp1-data1-v1.xlsx
Figure 5—figure supplement 2
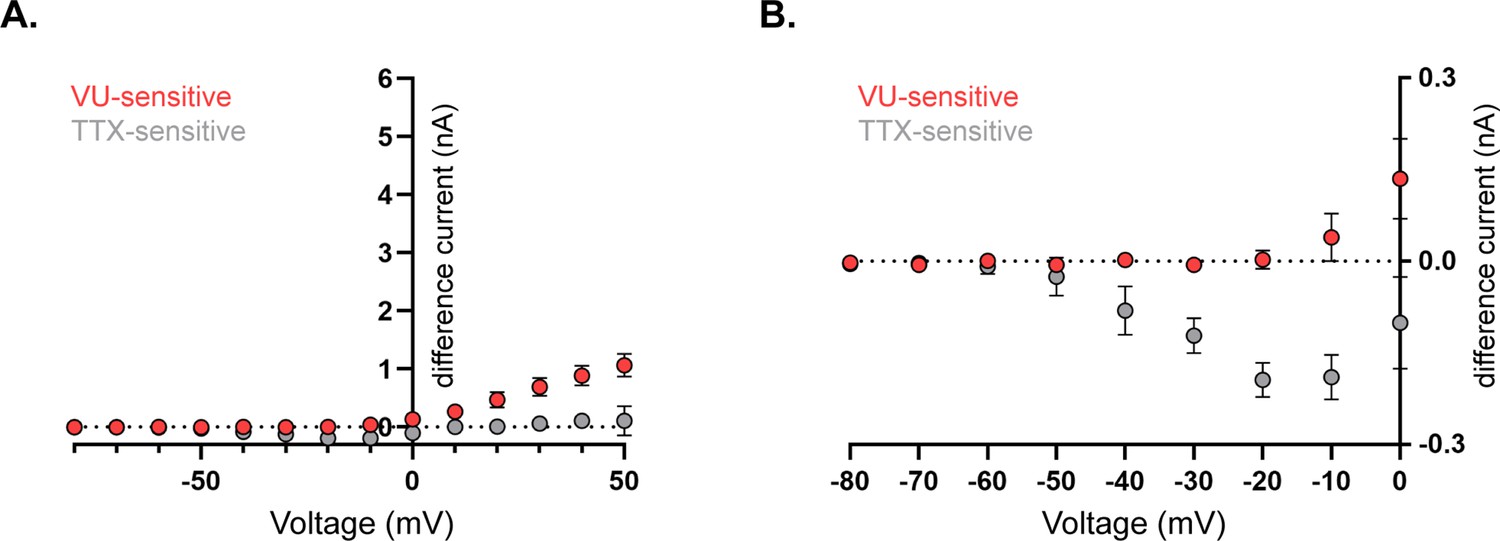
Isolation of KNa currents from neurons lacking KCNT1 and KCNT2 channels illustrates the specificity of VU170- vs. tetrodotoxin (TTX)-subtraction methods.
Voltage steps were applied to voltage-clamped neurons isolated and cultured from Kcnt1−/−; Kcnt2−/− double knockout mice to compare the delayed outward currents before and after the addition of either 10 µM VU170 or 0.5 µM TTX. (A) A summary plot shows the VU-sensitive (red) and TTX-sensitive (gray) difference currents (mean ± SEM) for each voltage step, which were calculated by subtracting the membrane current response to voltage steps (−80 to +50 mV) from a holding potential of −70 mV in VU170 or TTX from the response in control external solution. (B) A summary plot of the VU- (red) and TTX-sensitive (gray) difference currents (mean ± SEM) for each voltage step from −80 to 0 mV to illustrate the values that are too small to be seen on the graph in (A).
-
Figure 5—figure supplement 2—source data 1
File containing data used to generate the graphs in Figure 5—figure supplement 2.
- https://cdn.elifesciences.org/articles/92915/elife-92915-fig5-figsupp2-data1-v1.xlsx
Figure 6 with 2 supplements
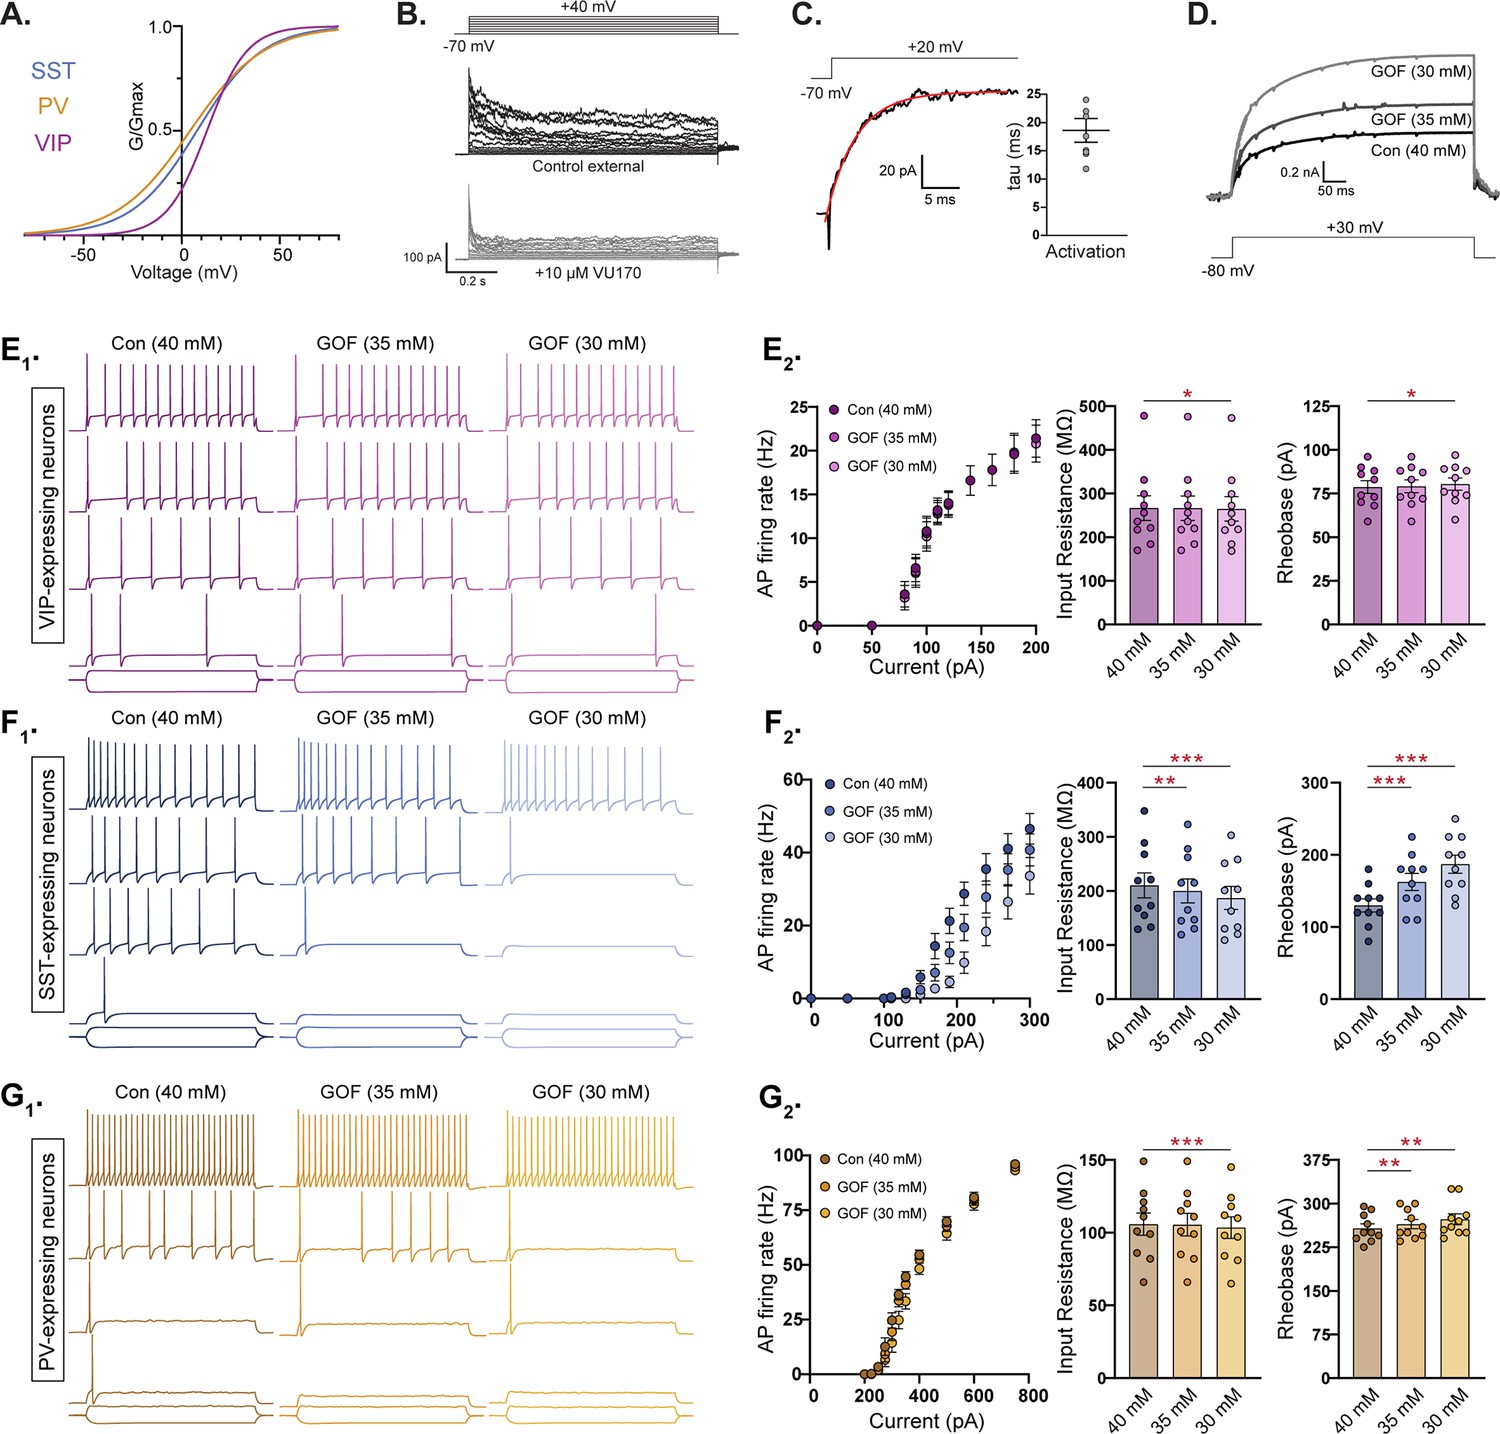
Compartmental models of KCNT1 gain-of-function (GOF) in somatostatin (SST), but not parvalbumin (PV), neurons are consistent with experimental data.
(A) Activation curves for vasoactive intestinal polypeptide (VIP), SST, and PV neurons used to model the KCNT1 channel in each neuron type. (B) Representative traces of the response of an outside-out membrane patch pulled from an SST neuron in control external solution (top) and after application of 10 µm VU170 (bottom). (C) Representative trace of the VU170-sensitive current in an outside-out patch pulled from an SST neuron with a single exponential fit (red curve) overlaid and summary data showing the time constant (mean ± SEM) obtained from these fits. (D) Simulated traces showing the KCNT1-mediated current in model neurons at three levels of Na+-sensitivity (Con-40 mM, GOF-35 mM, and GOF-30 mM). (E1, F1, and G1) Simulated traces from model VIP (E1; purple), SST (F1; blue), and PV (G1; yellow) neurons in response to 500 ms current injections at three levels of Na+ sensitivity [control (Con), and two levels of KCNT1 GOF]. Representative traces are shown at increasing current steps from bottom to top for each level. (E2, F2, and G2) Summary data from 10 model VIP (E2; purple), SST (F2; blue), and PV (G2; yellow) neurons showing (from left to right) the number of action potentials (APs) at different current steps (F–I plot), input resistance, and rheobase. The bar graphs (mean ± SEM) are overlaid with scatter plots of individual neuron measurements. Statistical significance was tested using a repeated measures analysis of variance (ANOVA). Asterisks indicate where p < 0.05 (*), p ≤ 0.01 (**), and p ≤ 0.001 (***).
-
Figure 6—source data 1
File containing data used to generate the graphs in Figure 6.
- https://cdn.elifesciences.org/articles/92915/elife-92915-fig6-data1-v1.xlsx
Figure 6—figure supplement 1
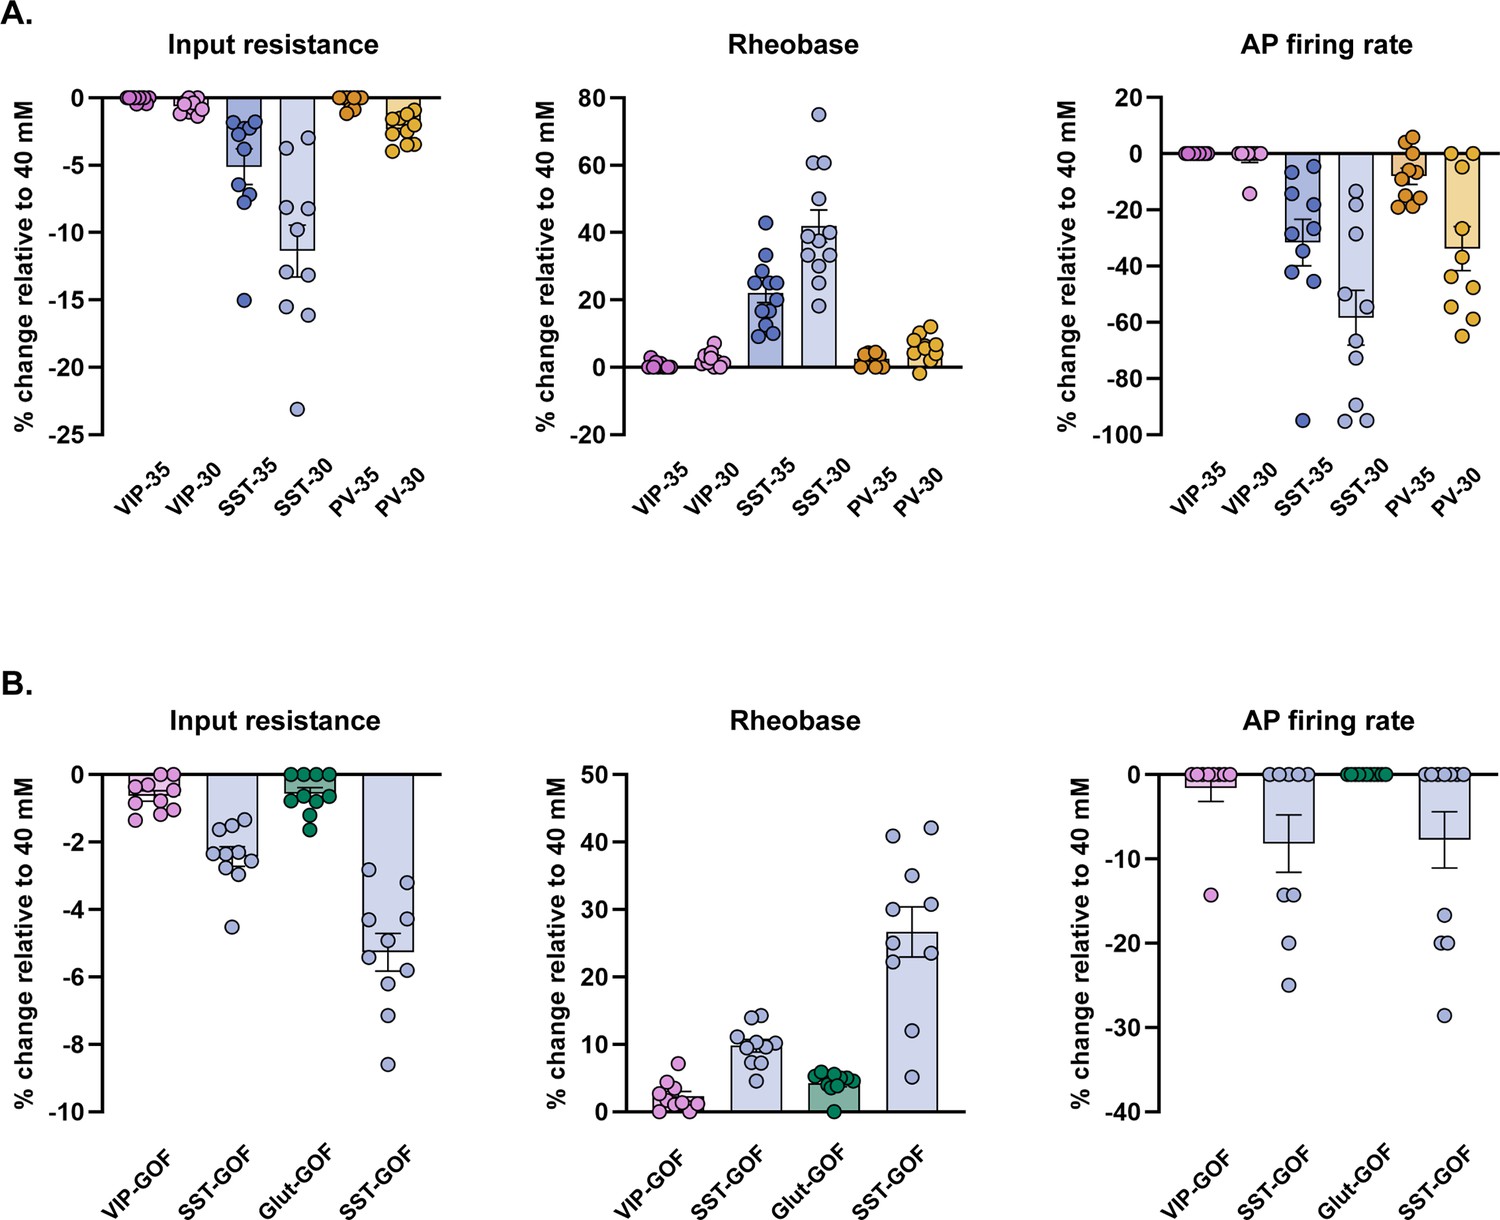
Model neurons show differential responses to KCNT1 gain-of-function (GOF).
(A) Bar graphs (mean ± SEM) with overlaid dot plots show the effects of two levels of KCNT1 GOF (Na+ EC50 = 35 or 30 mM) relative to those of control (EC50 = 40 mM) on input resistance, rheobase, and action potential (AP) firing rate at 1.5× rheobase for GABAergic subtypes (10 model neurons/group). (B) Bar graphs (mean ± SEM) with overlaid dot plots show the effects KCNT1 GOF (Na+ EC50 = 30 mM) on vasoactive intestinal polypeptide (VIP) GABAergic or glutamatergic model neurons (10/group) with their respective KCNT1 activation curve parameters (VIP-GOF and Glut-GOF) or somatostatin (SST) KCNT1 parameters (SST-GOF) relative to those of control (EC50 = 40 mM) on input resistance, rheobase, and AP firing rate at 1.5× rheobase.
-
Figure 6—figure supplement 1—source data 1
File containing data used to generate the graphs in Figure 6—figure supplement 1.
- https://cdn.elifesciences.org/articles/92915/elife-92915-fig6-figsupp1-data1-v1.xlsx
Figure 6—figure supplement 2
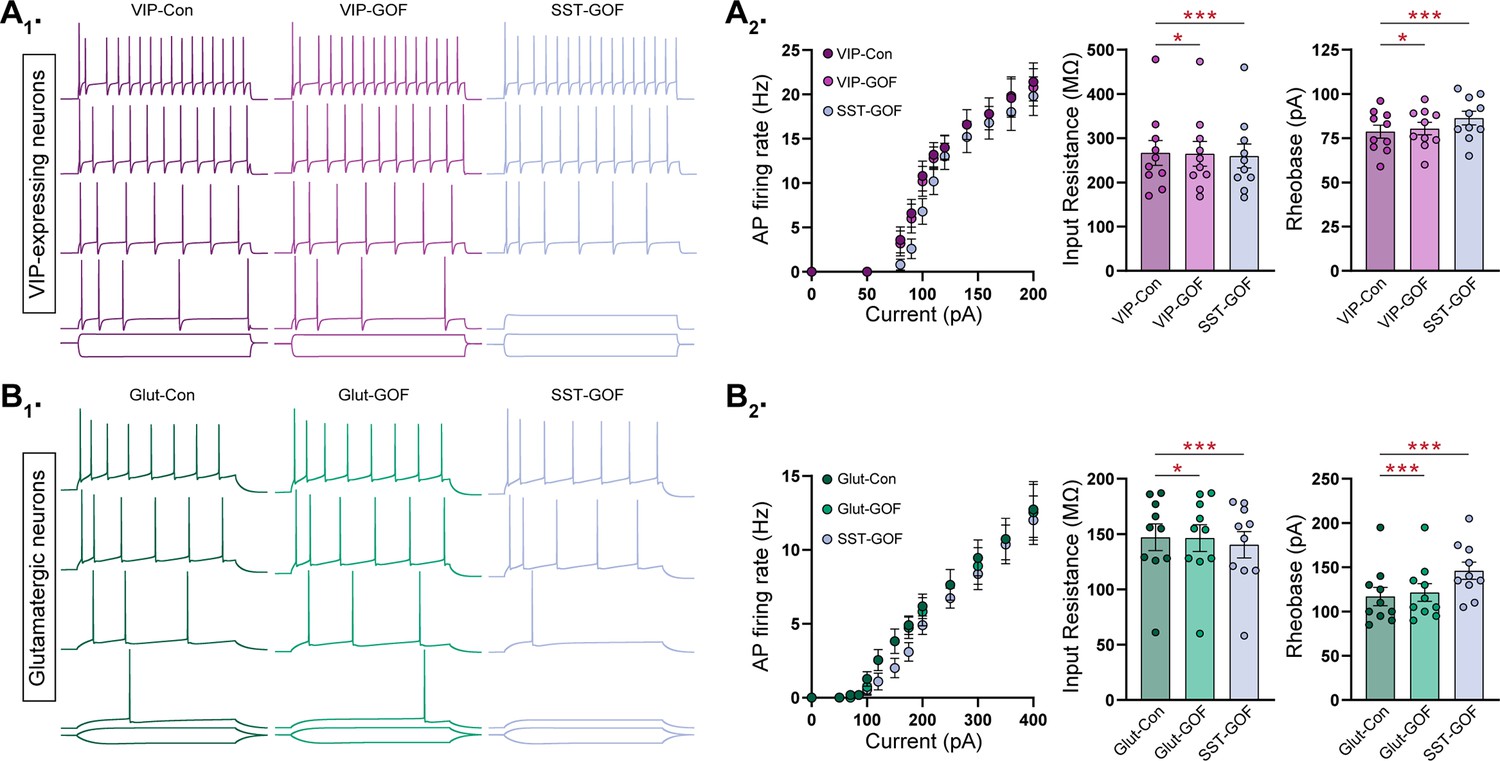
Model vasoactive intestinal polypeptide (VIP) and glutamatergic neurons with insertion of somatostatin (SST)-like, KCNT1 gain-of-function (GOF) kinetics show reduced excitability.
(A1) Simulated traces from model VIP neurons, using VIP KCNT1 activation curve parameters (purple) or SST KCNT activation curve parameters (blue), in response to 500 ms current injections at two levels of Na+ sensitivity (Con-40 mM and GOF-30 mM). Representative traces are shown at increasing current steps from bottom to top for each level. (A2) Summary data from 10 model VIP neurons, with VIP KCNT1 parameters (VIP-Con and VIP-GOF) or SST KCNT1 parameters (SST-GOF) showing (from left to right) the number of action potentials (APs) at different current steps (F–I plot), input resistance, and rheobase. The bar graphs (mean ± SEM) are overlaid with scatter plots of individual neuron measurements. (B1) Simulated traces from model glutamatergic neurons, using glutamatergic KCNT1 activation curve parameters (green) or SST KCNT activation curve parameters (blue), in response to 500 ms current injections at two levels of Na+ sensitivity (Con-40 mM and GOF-30 mM). Representative traces are shown at increasing current steps from bottom to top for each level. (B2) Summary data from 10 model glutamatergic neurons, with glutamatergic KCNT1 parameters (Glut-Con and Glut-GOF) or SST KCNT1 parameters (SST-GOF) showing (from left to right) the number of APs at different current steps (F–I plot), input resistance, and rheobase. The bar graphs (mean ± SEM) are overlaid with scatter plots of individual neuron measurements. Statistical significance was tested using a repeated measures ANOVA. Asterisks indicate where p < 0.05 (*) and p ≤ 0.001 (***).
-
Figure 6—figure supplement 2—source data 1
File containing data used to generate the graphs in Figure 6—figure supplement 2.
- https://cdn.elifesciences.org/articles/92915/elife-92915-fig6-figsupp2-data1-v1.xlsx
Figure 7 with 2 supplements
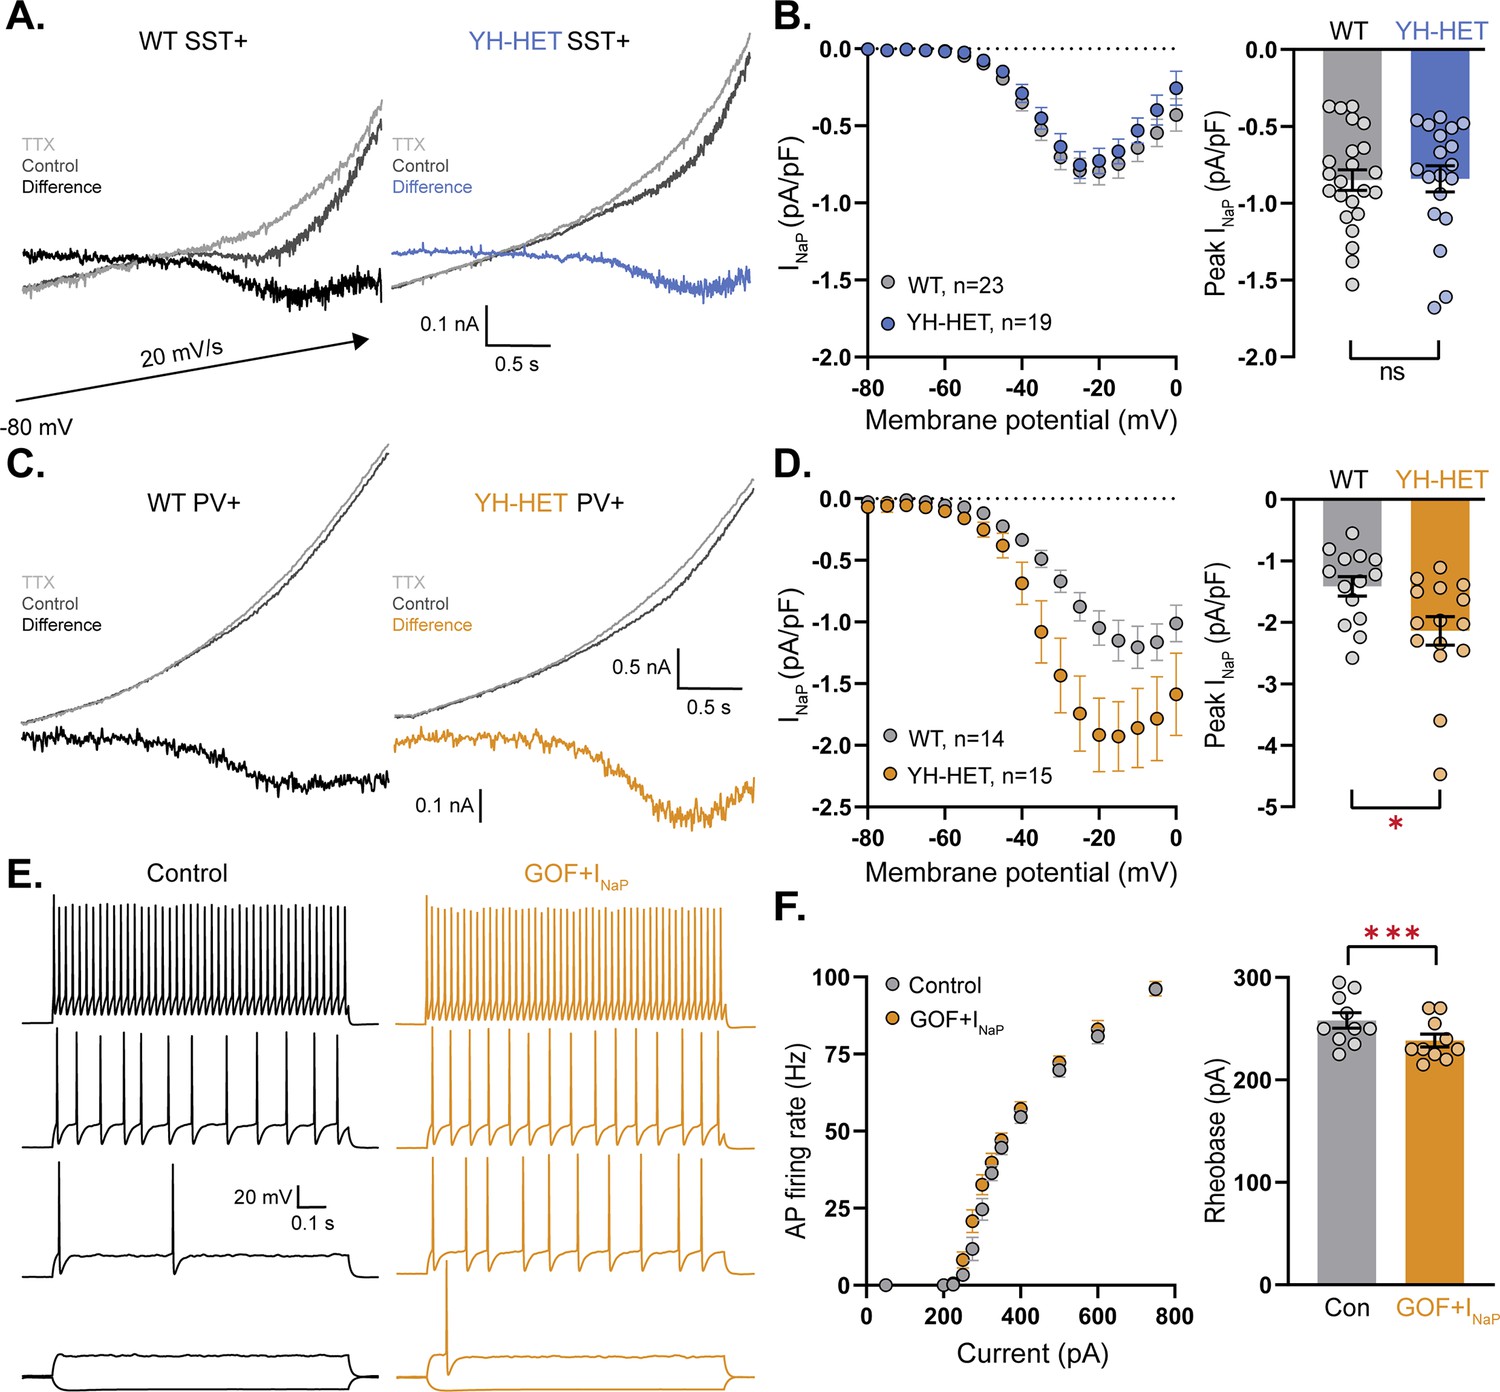
The persistent Na+ current is increased by the Kcnt1Y777H variant in parvalbumin (PV), but not somatostatin (SST), neurons.
(A) Representative traces of wildtype (WT) (left) and YH-HET (right) SST neurons in response to slow voltage ramp in control (dark gray) and 7 s after application of 0.5 nM tetrodotoxin (TTX) (light gray) with the difference current (INaP) plotted on the same scale. (B) INaP I–V curves of WT (gray) and YH-HET (blue) SST neurons constructed from averaging the ramp-evoked difference current (mean ± SEM) at 5 mV intervals (left), and a bar graph with overlaid scatter plot showing the peak negative value for each neuron (right). (C) Representative traces of WT (left) and YH-HET (right) PV neurons in response to slow voltage ramp in control (dark gray) and 7 s after application of 0.5 nM TTX (light gray) with the difference current (INaP) plotted on the same scale. The upper traces and difference currents are plotted on different scales. (D) INaP I–V curves of WT (gray) and YH-HET (orange) PV neurons constructed from averaging the ramp-evoked difference current (mean ± SEM) at 5 mV intervals (left), and a bar graph with overlaid scatter plot showing the peak negative value for each neuron (right). (E) Simulated traces from a model PV neuron in response to 500 ms current injections with control levels of KCNT1 (black traces) and KCNT1 gain-of-function (GOF) (Na+ EC50 = 35 mM) with a twofold increase in INaP (orange traces). Representative traces are shown at increasing current steps from bottom to top for each level. (F) F–I plot shows the increase in action potential (AP) firing (left), and a bar graph with overlaid scatter plot of individual neuron values shows the decrease in rheobase associated with modeling KCNT1 GOF (Na+ EC50 = 35 mM) together with the increase in INaP. For modeling data, statistical significance was tested using a repeated measures ANOVA. Asterisks indicate where p < 0.05 (*) and p ≤ 0.001 (***).
-
Figure 7—source data 1
File containing data used to generate the graphs in Figure 7.
- https://cdn.elifesciences.org/articles/92915/elife-92915-fig7-data1-v1.xlsx
Figure 7—figure supplement 1
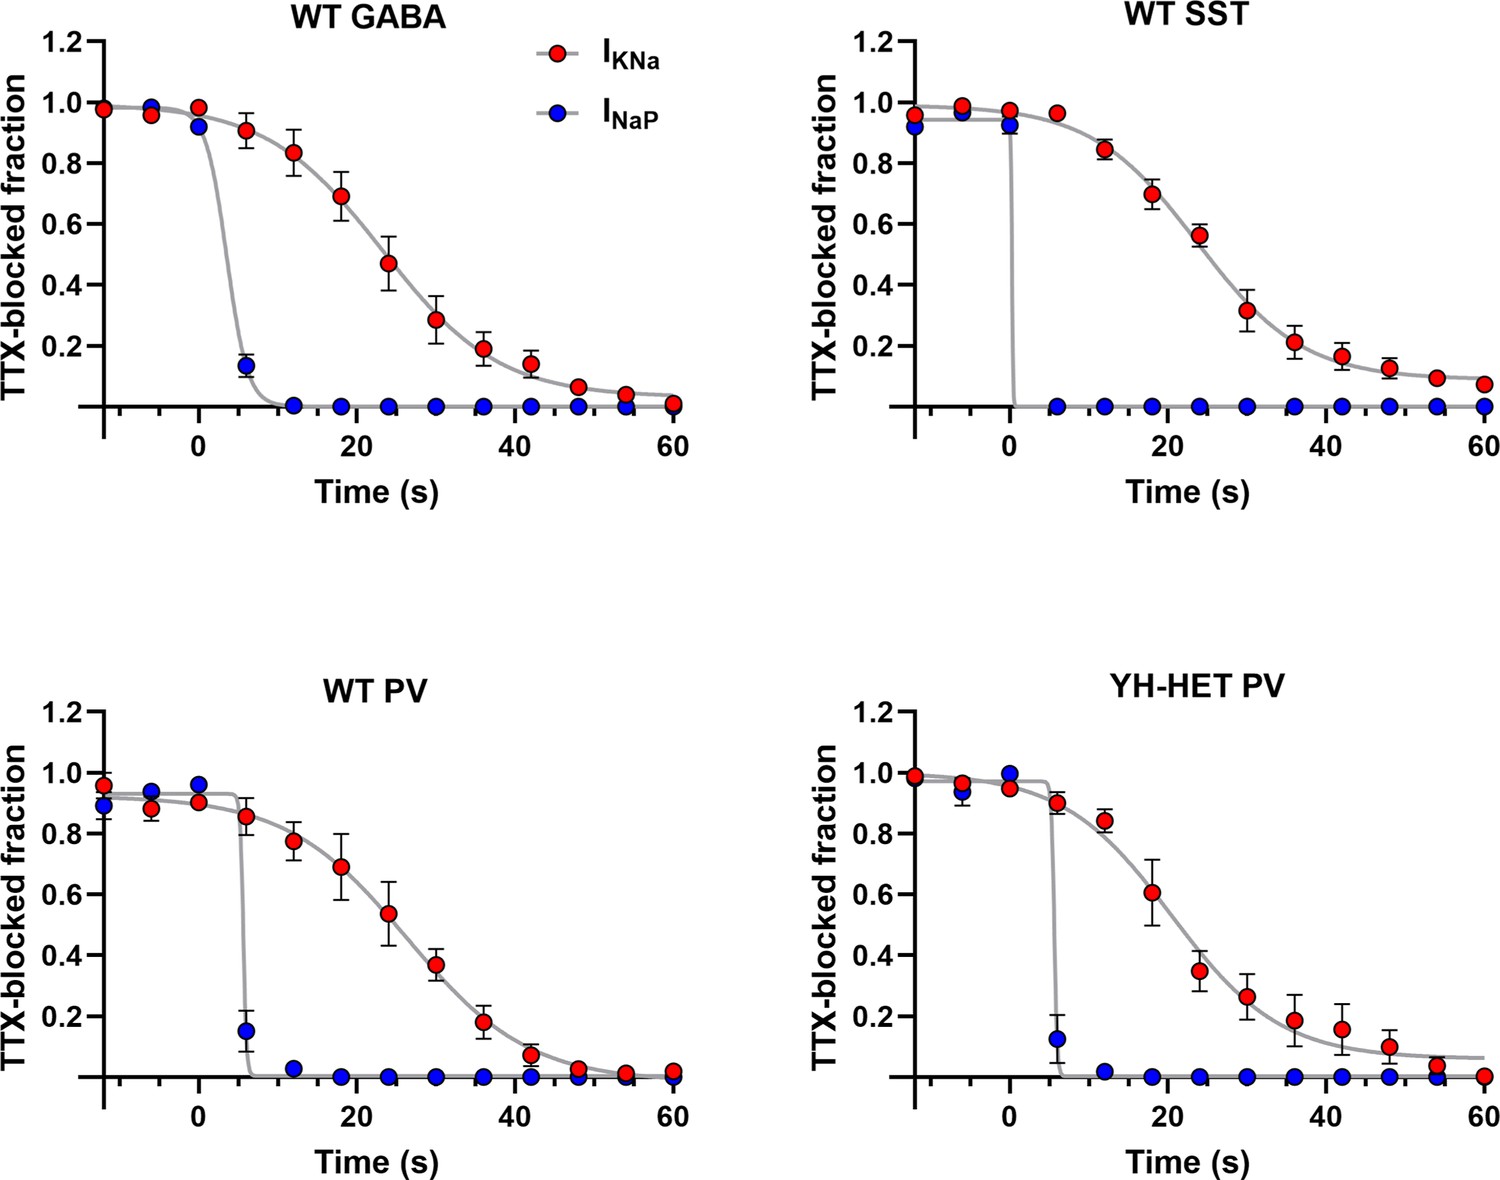
The rate of KNa current block after tetrodotoxin (TTX) application is slow relative to INaP block in GABAergic neurons.
Plots show the time course over which INaP and KNa currents are blocked following 0.5 µM TTX application. Neurons of the labeled type in each panel were voltage clamped and subjected to a slow voltage ramp protocol (20 mV/s over 5 s). TTX (0.5 µM) was applied at time 0 and KNa currents and INaP were measured on each successive sweep. The KNa current was measured as the normalized difference between each trace and the mean of the pre-TTX current between +20 and +30 mV. INaP was measured as the normalized difference between each trace and the mean of the pre-TTX current at the 10 mV bracketing the local peak inward current. Once the minimum value was reached for INaP, all subsequent values were considered zero.
-
Figure 7—figure supplement 1—source data 1
File containing data used to generate the graphs in Figure 7—figure supplement 1.
- https://cdn.elifesciences.org/articles/92915/elife-92915-fig7-figsupp1-data1-v1.xlsx
Figure 7—figure supplement 2
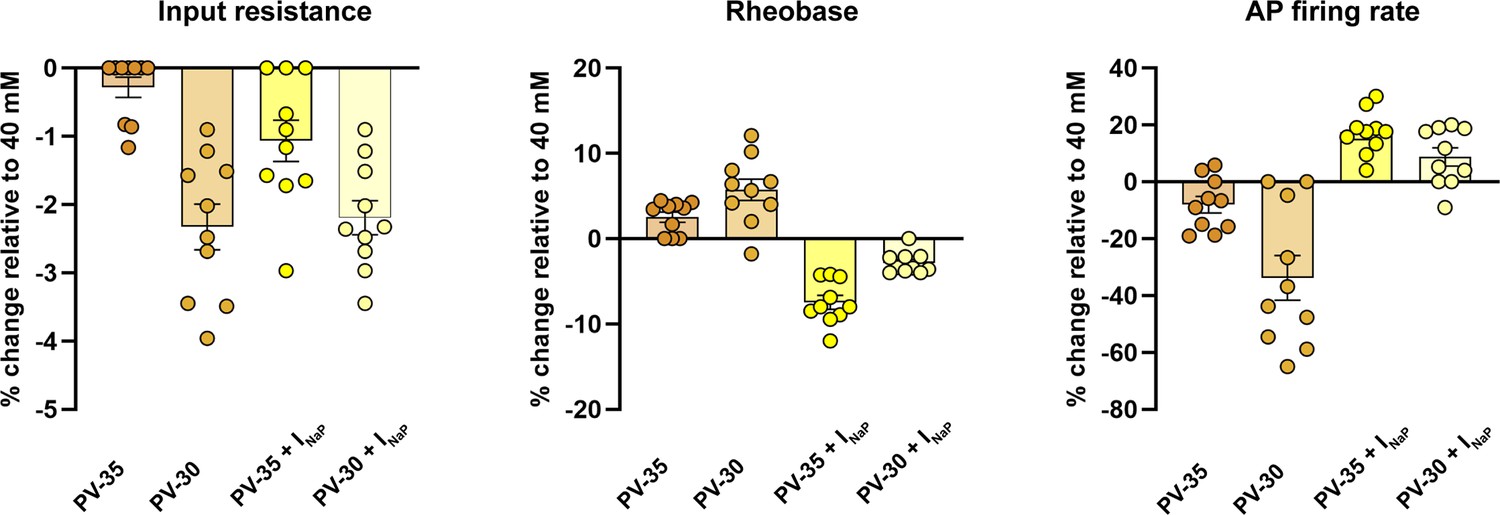
Model parvalbumin (PV) neurons show differential responses to KCNT1 gain-of-function (GOF) with increased INaP.
Bar graphs (mean ± SEM) with overlaid dot plots show the effects of two levels of KCNT1 GOF (Na+ EC50 = 35 or 30 mM), with or without additional INaP, relative to those of control (EC50 = 40 mM) on input resistance, rheobase, and action potential (AP) firing rate at 1.5× rheobase for PV neurons (10/group).
-
Figure 7—figure supplement 2—source data 1
File containing data used to generate the graphs in Figure 7—figure supplement 2.
- https://cdn.elifesciences.org/articles/92915/elife-92915-fig7-figsupp2-data1-v1.xlsx
Figure 8
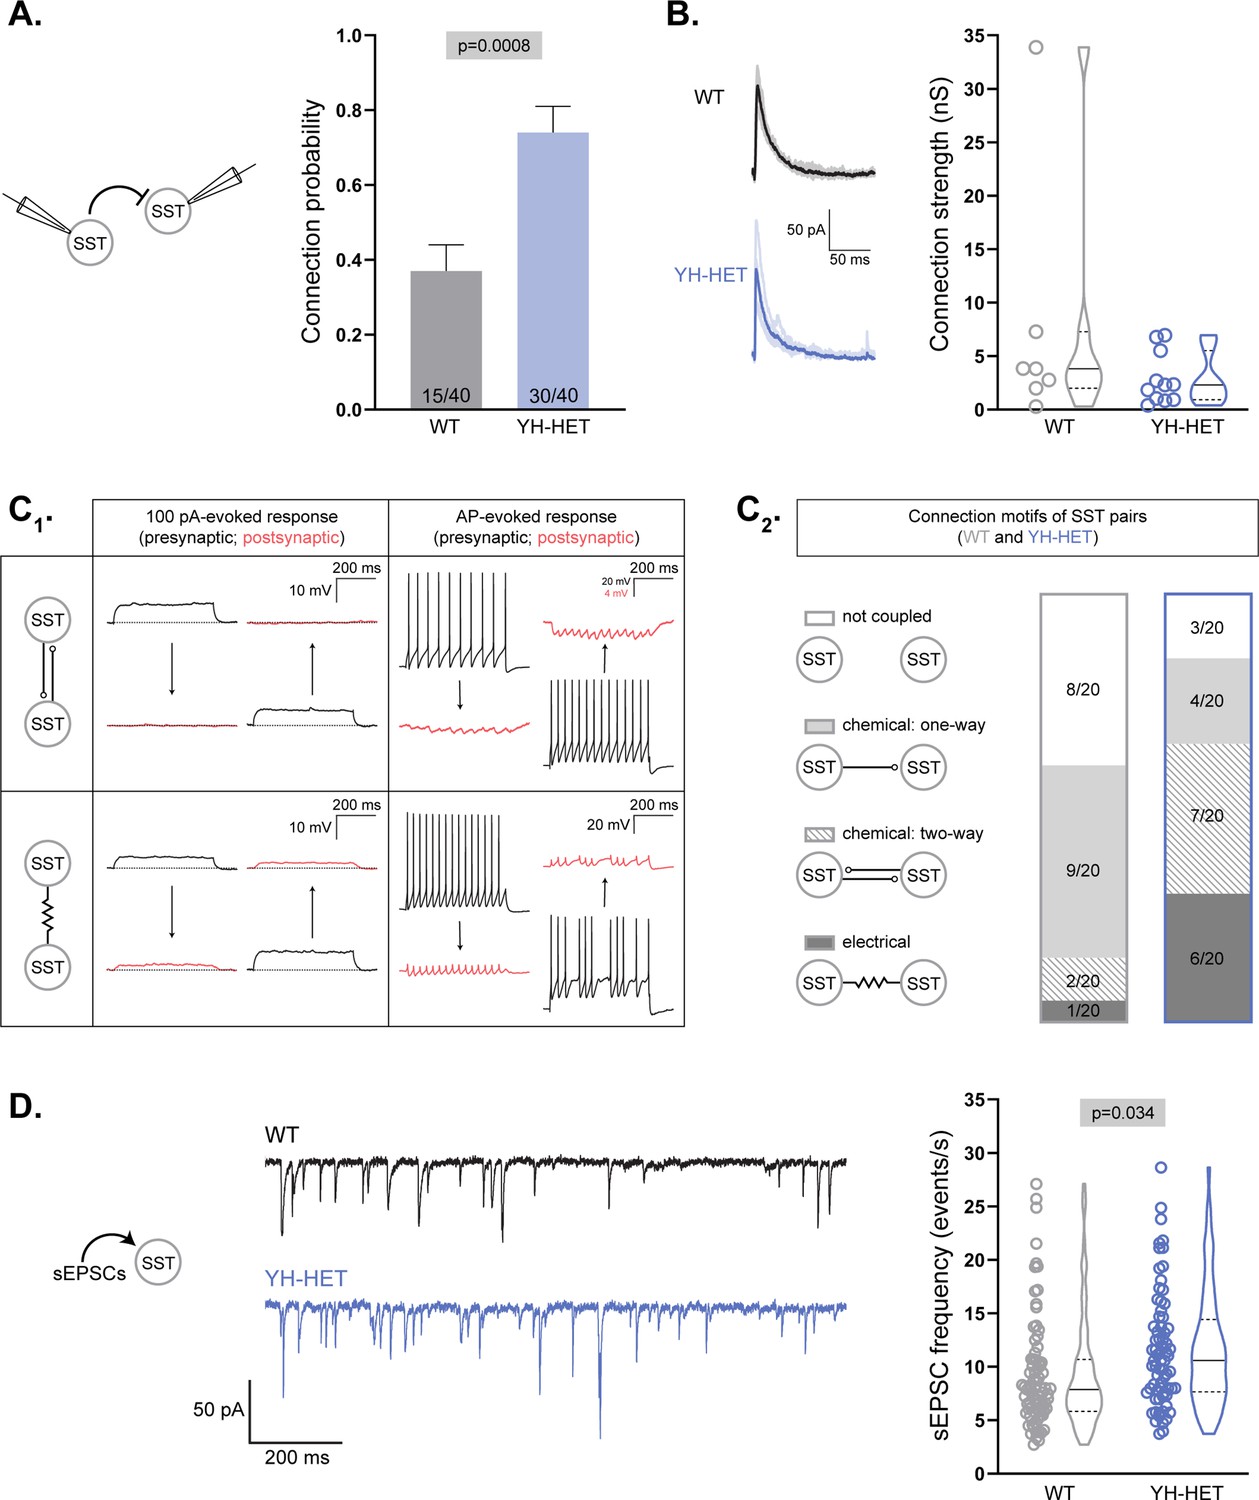
YH-HET somatostatin (SST) neurons show increased chemical and electrical coupling and receive increased excitatory input.
(A, B) Evoked postsynaptic currents (PSCs) were recorded from SST neuron pairs by stimulating each neuron at 0.1 Hz and recording the response onto the partner. (A) Bar graph shows the connection probability (mean + SEM) between SST neurons (wildtype [WT], gray; YH-HET, blue; numbers on bars represent connected pair number/recorded pair number). (B) On the left, example traces of evoked IPSCs [individual IPSCs (light) overlaid by averaged IPSCs (dark)], and on the right, a graph of connection strength between SST neurons (WT, gray; YH-HET, blue; individual measurements and summary violin plots). (C1) A schematic illustrates representative responses (presynaptic, black; postsynaptic, red) between chemically coupled (upper two panels) and electrically coupled (lower two panels) SST neurons following 100 pA (left two panels) and action potential (AP) (right two panels) stimulation. (C2) Summary data of four possible connection motifs (not coupled, chemical: one-way, chemical: two-way, and electrical) tested among WT (gray box) and YH-HET (blue box) SST neuron pairs (20 pairs/group). (D) On the left, example traces of spontaneous EPSCs (sEPSCs) recorded onto SST neurons (WT, black; YH-HET, blue). On the right, a graph shows individual neuron measurements and summary violin plots of the sEPSC frequency onto SST neurons (WT, gray; YH-HET, blue). All significant p-values are displayed at the top of each graph.
-
Figure 8—source data 1
File containing data used to generate the graphs in Figure 8.
- https://cdn.elifesciences.org/articles/92915/elife-92915-fig8-data1-v1.xlsx
Figure 9
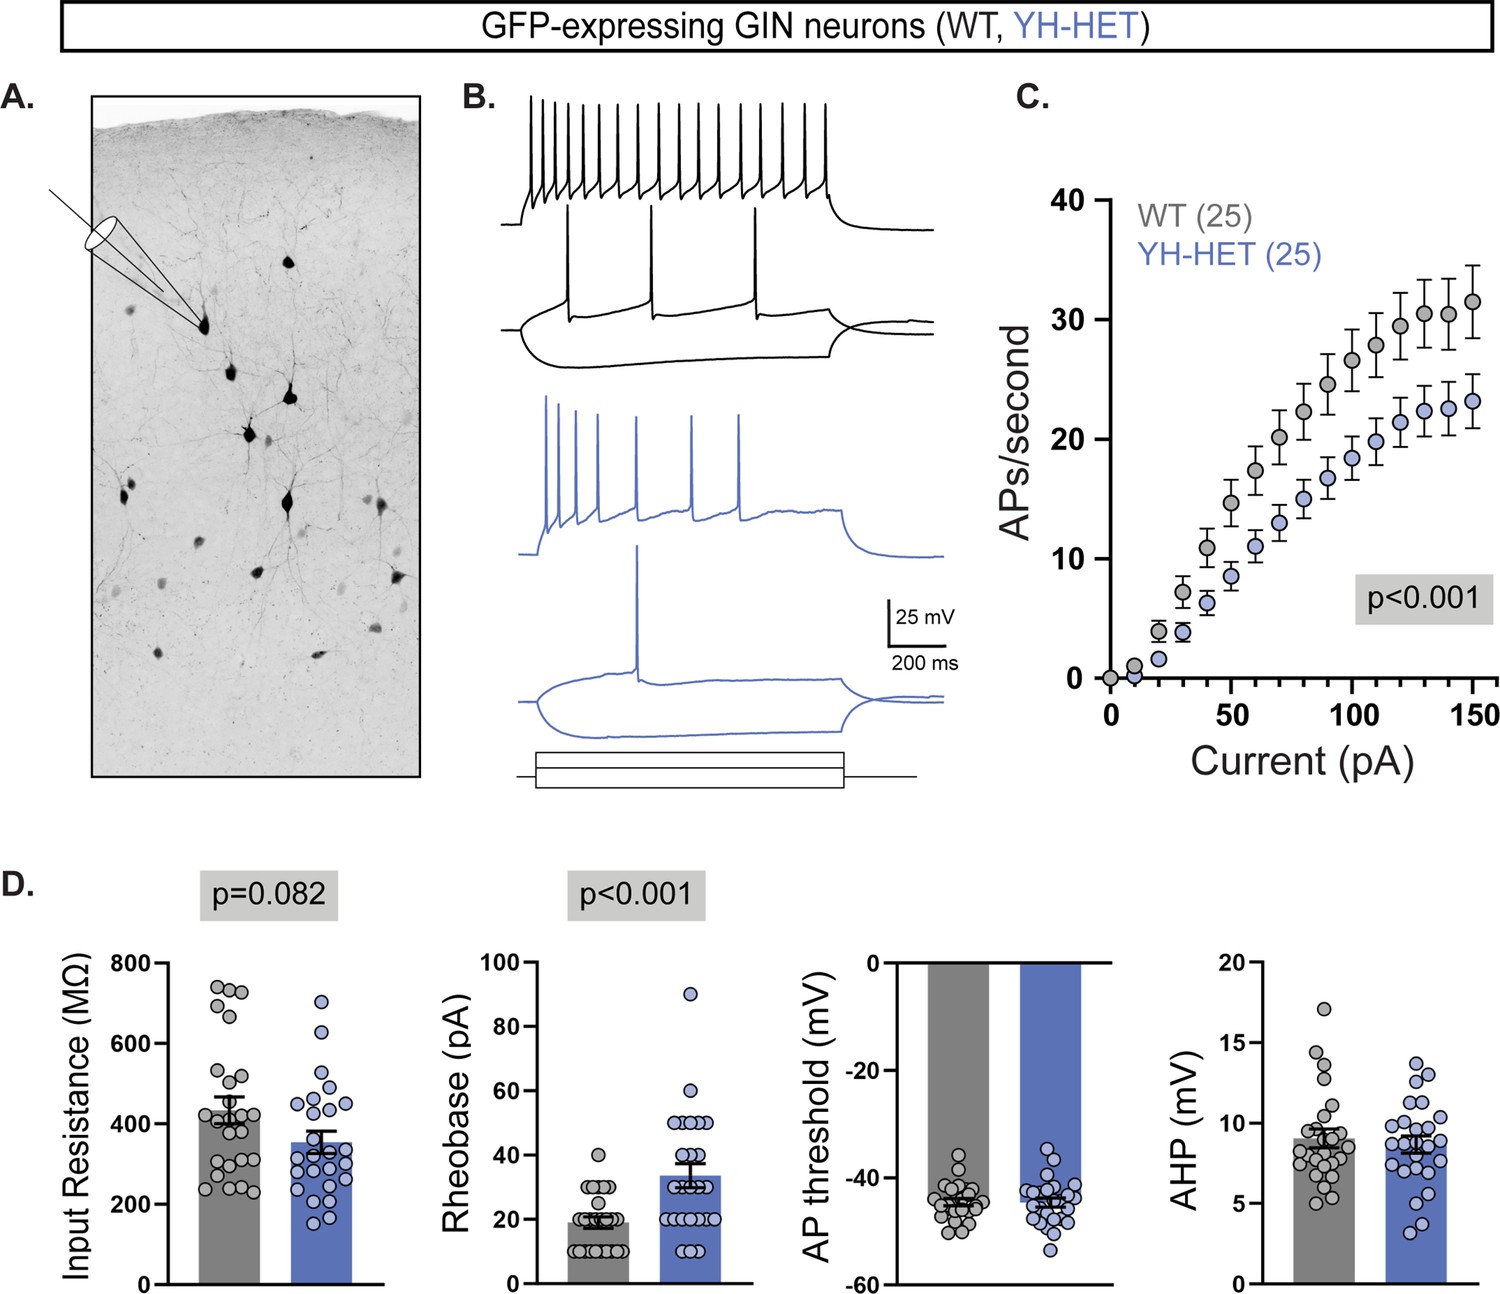
Acute cortical slice recordings confirm the reduced intrinsic excitability of YH-HET SST neurons.
(A) An inverted monochrome image illustrates the recording scheme from GFP-expressing neurons in acute slices from P21 to P30 GIN mice that express GFP in a subset of SST-positive neurons. (B) Representative responses to current steps are shown for wildtype (WT) (black) and YH-HET (blue) to three, equivalent 1 s current steps. (C) Plot of the action potential (AP) frequency (mean ± SEM; 25 neurons/group) per current injection step shows that YH-HET GFP-expressing neurons (blue) fire fewer APs than those of WT (gray) across a range of current inputs. (D) Bar graphs show quantification of the membrane properties and AP parameters for WT (gray) and YH-HET (blue) GFP-expressing neuron groups, with individual neuron measurements overlaid in scatter plots. Relevant p-values are shown in gray boxes on or above graphs.
-
Figure 9—source data 1
File containing data used to generate the graphs in Figure 9.
- https://cdn.elifesciences.org/articles/92915/elife-92915-fig9-data1-v1.xlsx
Tables
Key resources table
| Reagent type (species) or resource | Designation | Source or reference | Identifiers | Additional information |
|---|---|---|---|---|
| Genetic reagent (Mus musculus) | Kcnt1Y777H knockin mice | The Jackson Laboratory | Jackson Labs stock: 028830 | |
| Genetic reagent (Mus musculus) | Sst-IRES-Cre mice | The Jackson Laboratory | Jackson Labs stock: 013044 | |
| Genetic reagent (Mus musculus) | Vip-IRES-Cre mice | The Jackson Laboratory | Jackson Labs stock: 010908 | |
| Genetic reagent (Mus musculus) | Pvalb-IRES-Cre mice | The Jackson Laboratory | Jackson Labs stock: 017320 | |
| Genetic reagent (Mus musculus) | GIN mice | The Jackson Laboratory | Jackson Labs stock: 003718 | |
| Strain, strain background (Mus musculus) | C57BL/6J | The Jackson Laboratory | Jackson Labs stock: 000644 | |
| Sequence-based reagent | Kcnt1YH_F | This paper | IDT DNA | CTAGGGCTG CAAACACAACA |
| Sequence-based reagent | Kcnt1YH_R | This paper | IDT DNA | TCAAGCAGCA ACACGATAGG |
| Sequence-based reagent | Cre_F | This paper | IDT DNA | TCGCGATTATCT TCTATATCTTCAG |
| Sequence-based reagent | Cre_R | This paper | IDT DNA | GCTCGACCAG TTTAGTTACCC |
| Recombinant DNA reagent | AAV8-CaMKIIa-GFP | UNC Vector Core | ||
| Recombinant DNA reagent | AAV9-hSyn-DIO-mCherry | Addgene | 50459-AAV9 | |
| Chemical compound, drug | NBQX disodium salt | Tocris | 1044 | |
| Chemical compound, drug | Bicuculline methiodide | hello bio | HB0893 | |
| Chemical compound, drug | Tetrodotoxin citrate | abcam | ab120055 | |
| Software, algorithm | pClamp, Clampex 10.3 or 10.5, Clampfit 11.2 | Molecular Devices | RRID:SCR_011323 | |
| Software, algorithm | Axograph X | Axograph Scientific | RRID:SCR_014284 | |
| Software, algorithm | Blue Brain Project | EPFL | RRID:SCR_002994 | |
| Software, algorithm | NEURON 8.0 | The NEURON Simulator | RRID:SCR_005393 | |
| Software, algorithm | µManager 2.0-β | µManager | RRID:SCR_000415 | |
| Software, algorithm | Fiji | ImageJ, NIH | RRID:SCR_002285 | |
| Software, algorithm | Prism 10 | GraphPad Prism | RRID: SCR_002798 | |
| Software, algorithm | SPSS 28.0 | IBM | RRID:SCR_002865 | |
| Antibody | Neu-N | Synaptic Systems | 266-004 | 1:500 |
| Antibody | Alexa Fluor 647 | Invitrogen | A21450 | 1:1000 |
| Other | Fluoromount-G Mounting Medium, with DAPI | Thermo Fisher Scientific | 00-4959-52 | See Immunostaining, Imaging, and Quantification section for more information |
Additional files
-
Supplementary file 1
Table shows values (mean ± SEM) of all electrophysiological parameters measured from wildtype (WT) and YH-HET glutamatergic, and fast spiking (FS) and non-fast spiking (NFS) GABAergic, neurons.
For an explanation of the parameters, see Methods. Rin = input resistance, Tau = membrane time constant, Rheo = rheobase current, Cm = membrane capacitance, AP = action potential, thresh = threshold, amp = amplitude, hw = half width, AHP = afterhyperpolarization, and mfr = maximum firing rate. Values shown are estimated marginal means ±the standard error as determined by implementing a generalized linear mixed model. p-values less than 0.05 are in red, bold type. For each subgroup, N values are the number of mouse pups, and n values are the number of neurons.
- https://cdn.elifesciences.org/articles/92915/elife-92915-supp1-v1.docx
-
Supplementary file 2
Electrophysiological parameters of current clamp recordings from neuronal cultures of three major GABAergic subtypes.
Table shows values (mean ± SEM) of all electrophysiological parameters measured from WT and YH-HET, SST, VIP, and PV GABAergic neurons. For an explanation of the parameters, see Methods. Rin = input resistance, Tau = membrane time constant, Rheo = rheobase current, Cm = membrane capacitance, AP = action potential, thresh = threshold, amp = amplitude, hw = half width, AHP = afterhyperpolarization, and mfr = maximum firing rate. Values shown are estimated marginal means ± the standard error as determined by implementing a generalized linear mixed model. p values less than 0.05 are in red, bold type. For each subgroup, N values are the number of mouse pups, and n values are the number of neurons.
- https://cdn.elifesciences.org/articles/92915/elife-92915-supp2-v1.docx
-
Supplementary file 3
Electrophysiological parameters using compartmental model neurons.
Table shows values (mean ± SEM) of all electrophysiological parameters measured in silico from VIP, SST, and PV GABAergic neurons with varying levels of KCNT1 GOF (and, in some cases, INaP). For an explanation of the parameters, see Methods. AP = action potential. For each subgroup, 10 model neurons were used and simulations were repeated with the EC50 (in mM) for Na+ for the KCNT1 conductance set at the indicated levels. ‘+SST’ refers to the activation curve parameters (V50 and slope) for the KCNT1 conductance in that neuron type being replaced with those measured in SST neurons. Values shown are means ± the standard error. The statistical test is a repeated measures ANOVA.
- https://cdn.elifesciences.org/articles/92915/elife-92915-supp3-v1.docx
-
MDAR checklist
- https://cdn.elifesciences.org/articles/92915/elife-92915-mdarchecklist1-v1.docx
Download links
A two-part list of links to download the article, or parts of the article, in various formats.
Downloads (link to download the article as PDF)
Open citations (links to open the citations from this article in various online reference manager services)
Cite this article (links to download the citations from this article in formats compatible with various reference manager tools)
Heterozygous expression of a Kcnt1 gain-of-function variant has differential effects on somatostatin- and parvalbumin-expressing cortical GABAergic neurons
eLife 13:RP92915.
https://doi.org/10.7554/eLife.92915.4


