A population modification gene drive targeting both Saglin and Lipophorin impairs Plasmodium transmission in Anopheles mosquitoes
- Inserm U1257, CNRS UPR9022, University of Strasbourg, France
Figures
Figure 1
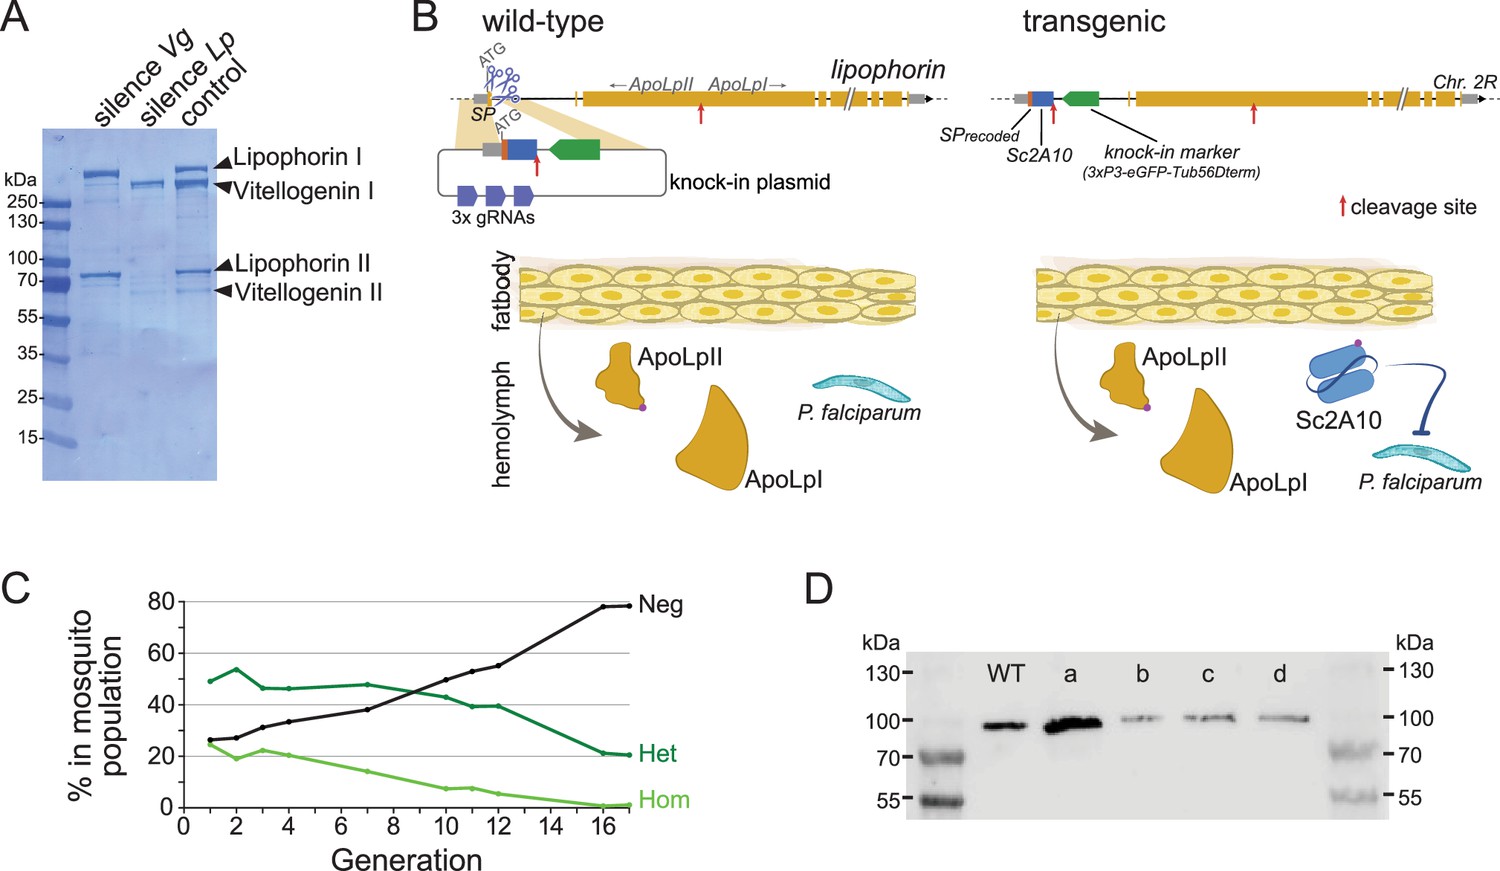
Characterization and modification of the endogenous Lipophorin gene.
(A) Coomassie staining of electrophoresed hemolymph proteins. Mosquitoes were injected with the indicated double-stranded RNA to silence either Vg or Lp as described (Rono et al., 2010) and offered a blood meal after 2 days. Hemolymph was collected 42 hr post blood feeding. (B) Scheme (not to scale) depicting the insertion of synthetic sequences into the Lp gene and secretion of the Sc2A10 single chain antibody from fat body cells. The Signal Peptide (SP) was recoded to remove gRNA target sites. Sc2A10 immediately follows the SP and ends with a RFRR furin cleavage site (red arrow) for separation from ApoLpII in the secretory pathway. This site is duplicated from the ApoLpI/II natural furin cleavage site found downstream. Fat body cells of mosquitoes bearing the Lp::Sc2A10 transgene are thus expected to constitutively secrete Sc2A10, ApoLpII and ApoLpI in the hemolymph. (C) Spontaneous dynamics of Lp::Sc2A10 transgene frequency over 17 generations. Between 1200 and 9100 neonate larvae in generations 1, 2, 3, 4, 7, 10, 11, 12, and 17, and 522 larvae in generation 16, were analysed by COPAS flow cytometry. The proportions of homozygotes (Hom, highest eGFP intensity), heterozygotes (Het, intermediate eGFP intensity) and eGFP negative (Neg) were estimated for each analyzed generation by gating each larval population in the COPAS software. Counts are provided in Supplementary file 2. (D) Western blot with anti-ApoLpII antibody on hemolymph samples from 10 female mosquitoes. First and last lanes: protein size ladder (molecular weights indicated), second lane: hemolymph from WT mosquitoes. Lanes c, d: hemolymph from homozygous Lp::Sc2A10 mosquitoes. Failed cleavage between scFv and ApoLpII would result in a 13 kDa molecular weight upshift compared to the control. Lanes a, b: hemolymph from mosquitoes expressing a distinct Lp::ScFv fusion not further discussed in this work.
-
Figure 1—source data 1
Coomassie staining of an SDS-PAGE gel with electrophoresed hemolymph proteins.
Mosquitoes were injected with the indicated double-stranded RNA to silence either Vg or Lp and offered a blood meal after 2 days. Hemolymph was collected 42 hr post blood feeding.
- https://cdn.elifesciences.org/articles/93142/elife-93142-fig1-data1-v3.pdf
-
Figure 1—source data 2
Coomassie staining of an SDS-PAGE gel with electrophoresed hemolymph proteins.
Unlabelled version of Figure 1—source data 1.
- https://cdn.elifesciences.org/articles/93142/elife-93142-fig1-data2-v3.pptx
-
Figure 1—source data 3
Western blot with anti-ApoLpII antibody on hemolymph samples from 10 female mosquitoes.
First and 7th lanes: protein size ladder, second lane: hemolymph from WT mosquitoes. Lanes c, d: hemolymph from homozygous Lp::Sc2A10 mosquitoes. Lanes a, b: hemolymph from mosquitoes expressing a distinct Lp::ScFv fusion not further discussed in this work.
- https://cdn.elifesciences.org/articles/93142/elife-93142-fig1-data3-v3.pdf
-
Figure 1—source data 4
Western blot with anti-ApoLpII antibody on hemolymph samples from 10 female mosquitoes.
Unlabelled version of Figure 1—source data 3.
- https://cdn.elifesciences.org/articles/93142/elife-93142-fig1-data4-v3.zip
Figure 2
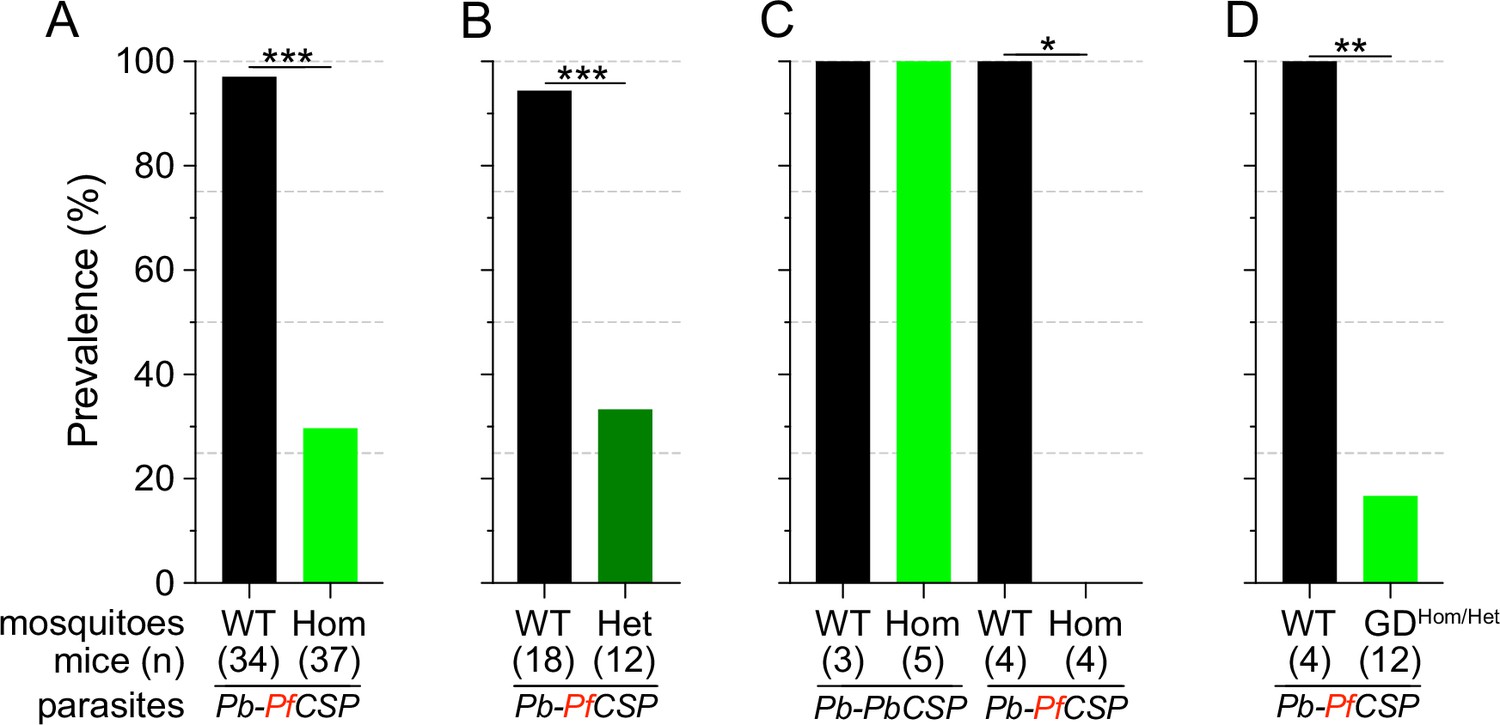
Infection status of mice bitten by Sc2A10-expressing vs. WT mosquitoes infected with Plasmodium.
Mosquito genotype and number of mice exposed to infectious mosquito bites is indicated below the bar for each condition. (A) Comparison of the percentages of infected mice after exposure to the bites of homozygous transgenic Lp::Sc2A10 mosquito females or their wild-type siblings, infected with a Plasmodium berghei strain expressing P. falciparum CSP. Aggregated data from 11 independent experiments performed over a period of two years were analyzed using Fisher’s exact test with a two-tailed p-value (p<0.0001). (B) Comparison of mouse infection upon exposure to heterozygous transgenic Lp::Sc2A10 mosquito females or their wild-type siblings, aggregated data from 5 independent experiments (p=0.0006). (C) Mice exposed to WT or homozygous Lp::Sc2A10 mosquitoes infected with either P. berghei expressing P. falciparum CSP or P. berghei expressing endogenous P. berghei CSP (single experiment, p=0.0286). (D) Mice exposed to WT or to SagGDvasa Gene Drive and Lp::Sc2A10 carrying mosquitoes, infected with a Plasmodium berghei strain expressing P. falciparum CSP (single experiment, p=0.0082).
Figure 3
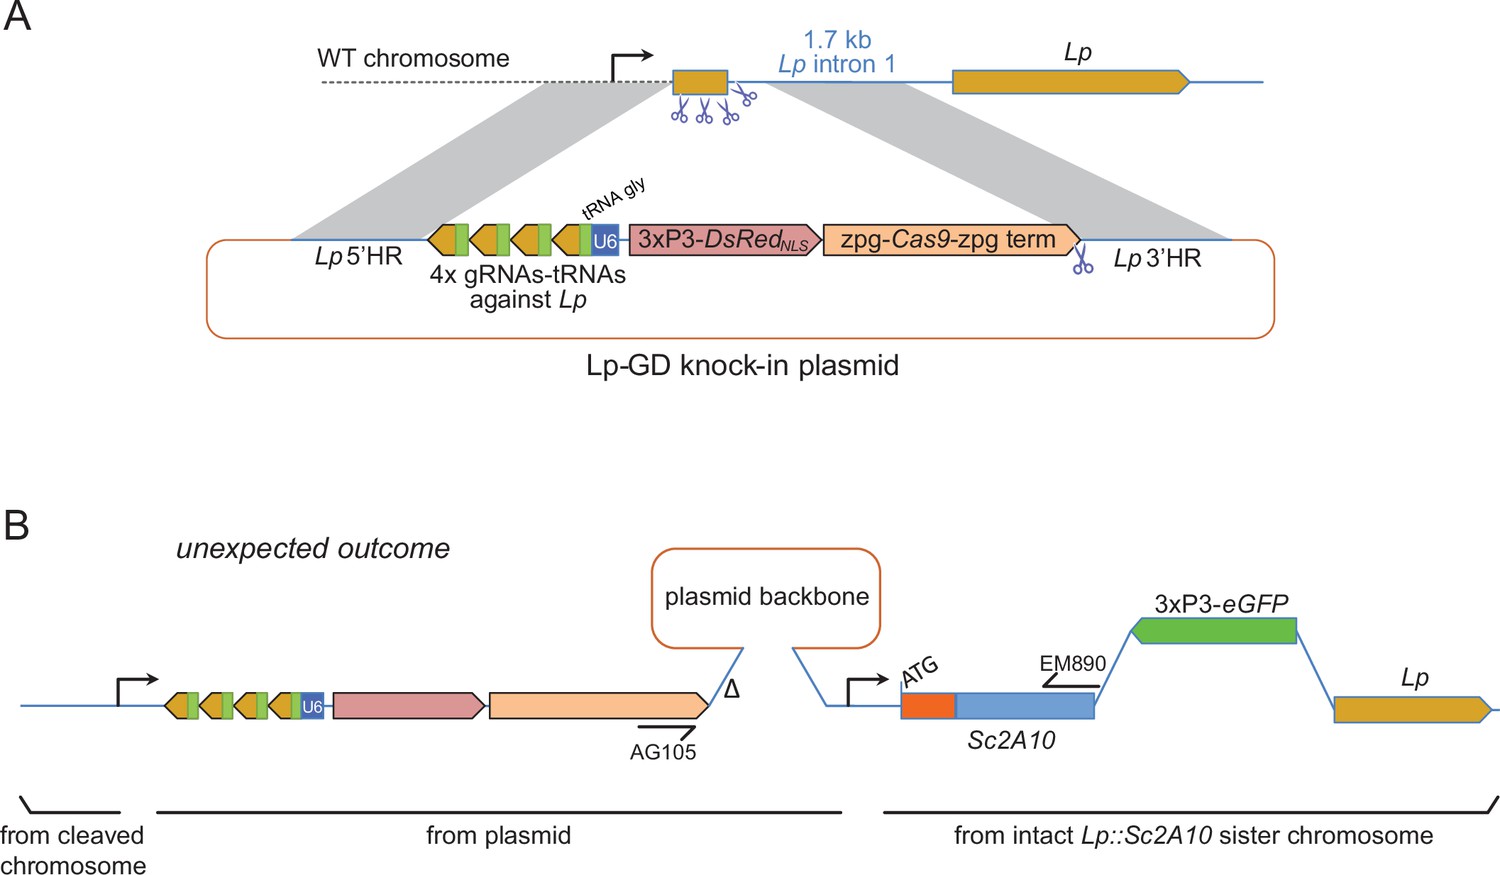
Insertion of a Lipophorin suppression gene drive and its expected and unexpected outcomes.
(A) Scheme of the suppression drive construct. Upon chromosome cleavage by Cas9 (shown by scissors), homologous recombination (gray shading) via 5’ and 3’ regions of homology (HR) is expected to insert the intervening elements (gRNA-encoding array, zpg-Cas9 expression cassette, DsRedNLS marker cassette) into the beginning of the Lp gene, disrupting its function. Note that this recombination event knocking out the essential Lp gene was designed to occur in the presence of an intact Lp::Sc2A10 sister chromosome, not shown in the scheme but that contributed to the unexpected outcome shown in B. (B) Most knock-in events unexpectedly arose from compound recombinations between the cleaved WT chromosome and both the repair template plasmid and the intact Lp::Sc2A10 sister chromosome, resulting in insertion of the gene drive elements genetically linked to the Lp::Sc2A10 transgene. A hypothetical scheme interpreting the compound insertion is shown. It was inferred from the genetic linkage observed between GFP and DsRedNLS, and from sequencing a PCR product obtained with primers AG105 and EM890 (indicated). ∆ indicates a 500 bp deletion in the cloned Lp 3’region, which arose following micro-injection of the plasmid because one of the gRNA target sites was retained by error in this part of the construct (indicated by scissors). Presence of the gRNA-tRNA array (green boxes +yellow arrows) was confirmed by drive activity in presence of a vasa-Cas9 transgene.
Figure 4
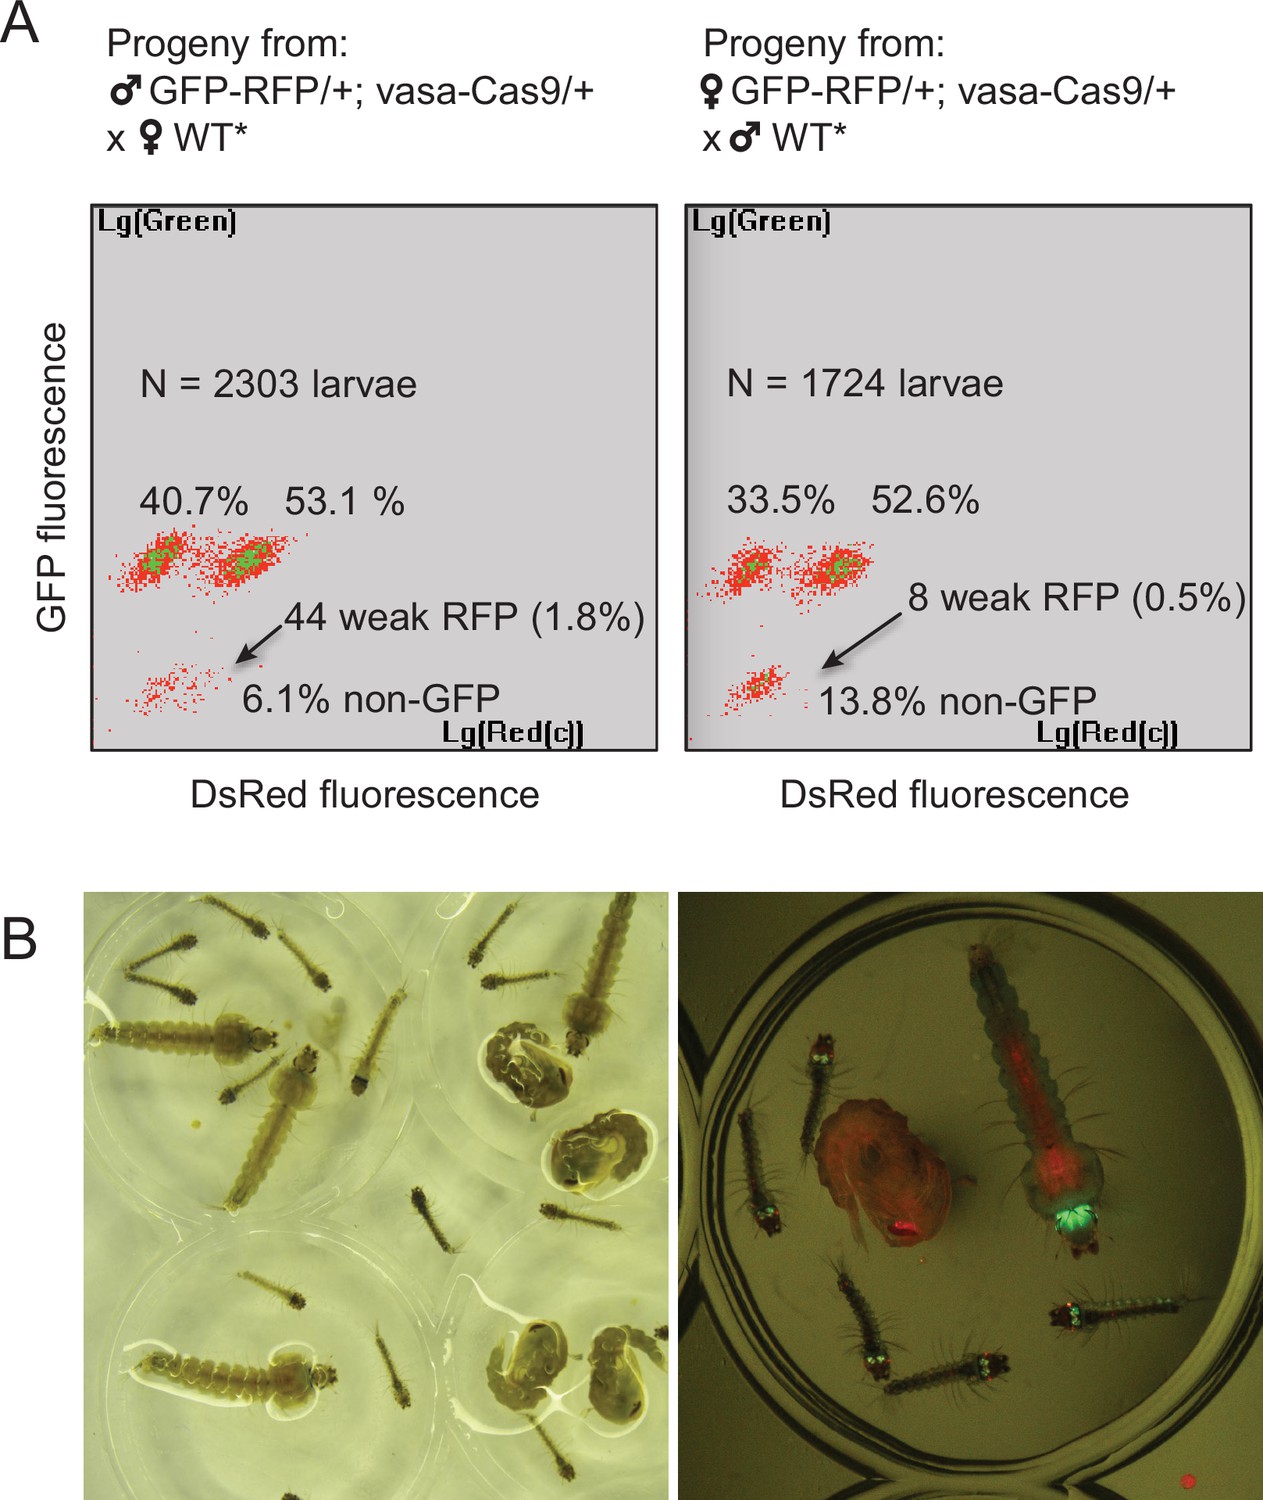
Characterization of the two types of Lp-GD integration events.
(A) The GFP-RFP line showed high homing rates when complemented with an independent vasa-Cas9 transgene. COPAS diagrams show the fluorescence of progeny neonate larvae from heterozygous GFP-RFP mosquitoes (third chromosome) that also carried a non-fluorescent, puromycin resistance-marked vasa-Cas9 transgene (second chromosome, heterozygous), crossed to non-fluorescent partners (WT* indicates non-fluorescent partners actually carrying one copy of the puromycin resistant vasa-Cas9 transgene, not influencing the crossing outcome). N indicates the total number of larvae analyzed in the diagrams; percentages of larvae of each fluorescence are indicated. Non-fluorescent progeny would amount to 50% in the absence of homing. Note that the percentage of GFP-RFP is close to 50%, mainly reflecting Mendelian inheritance of the parental transgene. Thus most homing events involved only a GFP-containing segment from the parental GFP-RFP transgene. Rarer instances of RFP-only segment homing (arrows) were accompanied by a decrease of DsRed fluorescence intensity, indicating that the 3xP3 promoter is less active than in the GFP-RFP context. Total homing amounts to ((40.7+53.1 + 1.8)–50) x2=91.2% in males, ((33.5+52.6 + 0.5)–50) x2=82.2% in females. (B) Haploinsufficiency at the Lipophorin locus. Photograph shows larval and pupal progeny from heterozygous Lp-GD crossed to heterozygous Lp::Sc2A10. Right panel focuses on a subset of larvae observed under fluorescent light. Larvae that inherited one copy of the Lp-GD loss-of-function allele (red eyes) and one copy of Lp::Sc2A10 (green eyes/brain) are developmentally delayed and will die before adulthood. Individuals that inherited a WT Lp copy and either modified allele will complete development, with strong loss of fitness for WT/Lp-GD individuals (red-eyed pupa).
Figure 5
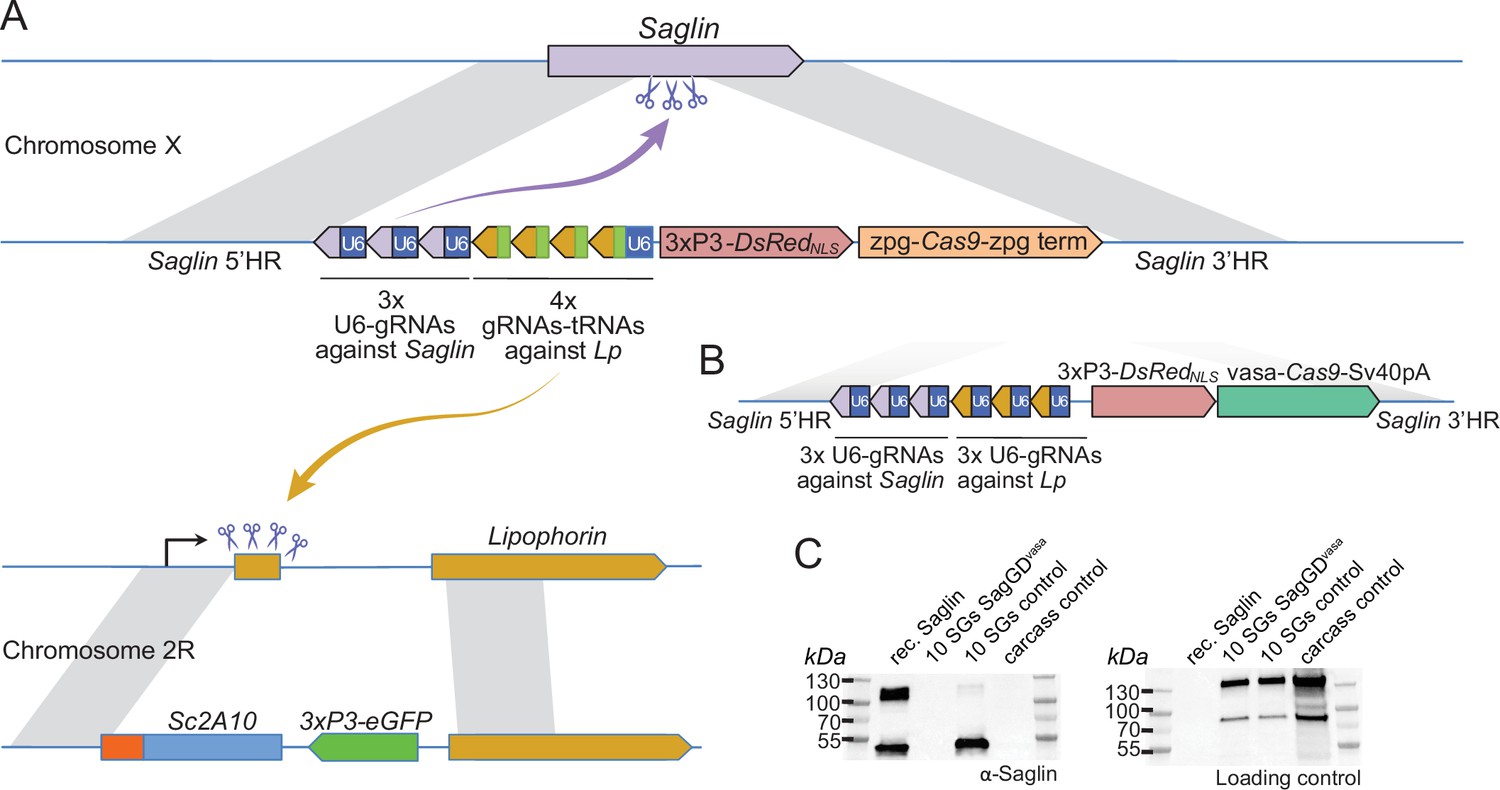
Designs of Saglin-based gene drives that also promote Lp locus modification and scheme of the chromosome conversion process.
(A) Gene drive cassette comprising Cas9 (under control of the zpg promoter) and an array of 7 gRNA-coding modules, inserted disruptively in the endogenous Saglin open reading frame on chromosome X along with a 3xP3-DsRedNLS fluorescence marker used to track the genetic modification. Three gRNAs, each expressed under control its own U6 promoter, target wild-type Saglin (purple arrow) and promote homing of the gene drive cassette. Four gRNAs separated by a repeated glycine tRNA are expressed under control of one U6 promoter, and target wild-type Lipophorin on chromosome 2 R (symbolized by yellow arrow) to promote Lp::Sc2A10 homing. (B) Updated SagGDvasa gene drive construct comprising six gRNAs, each under control of its own U6 promoter, and Cas9 under control of the vasa promoter and SV40 terminator sequences. (C) Western-blot using Saglin antibodies showing the absence of Saglin protein in the salivary glands of dissected SagGDvasa homozygous females. The same membrane was re-probed with serum from a human volunteer regularly bitten by mosquitoes, providing a loading control with salivary and carcass protein signals.
-
Figure 5—source data 1
Western-blot using Saglin antibodies showing the absence of Saglin protein in the salivary glands of dissected SagGDvasa homozygous females (left image).
The same membrane (right image) was re-probed with serum from a human volunteer regularly bitten by mosquitoes, providing a loading control with salivary and carcass protein signals.
- https://cdn.elifesciences.org/articles/93142/elife-93142-fig5-data1-v3.pdf
-
Figure 5—source data 2
Western-blot using Saglin antibodies showing the absence of Saglin protein in the salivary glands of dissected SagGDvasa homozygous females.
- https://cdn.elifesciences.org/articles/93142/elife-93142-fig5-data2-v3.zip
-
Figure 5—source data 3
Western blot using serum from a human volunteer regularly bitten by mosquitoes, providing a loading control with salivary and carcass protein signals.
- https://cdn.elifesciences.org/articles/93142/elife-93142-fig5-data3-v3.zip
Figure 6
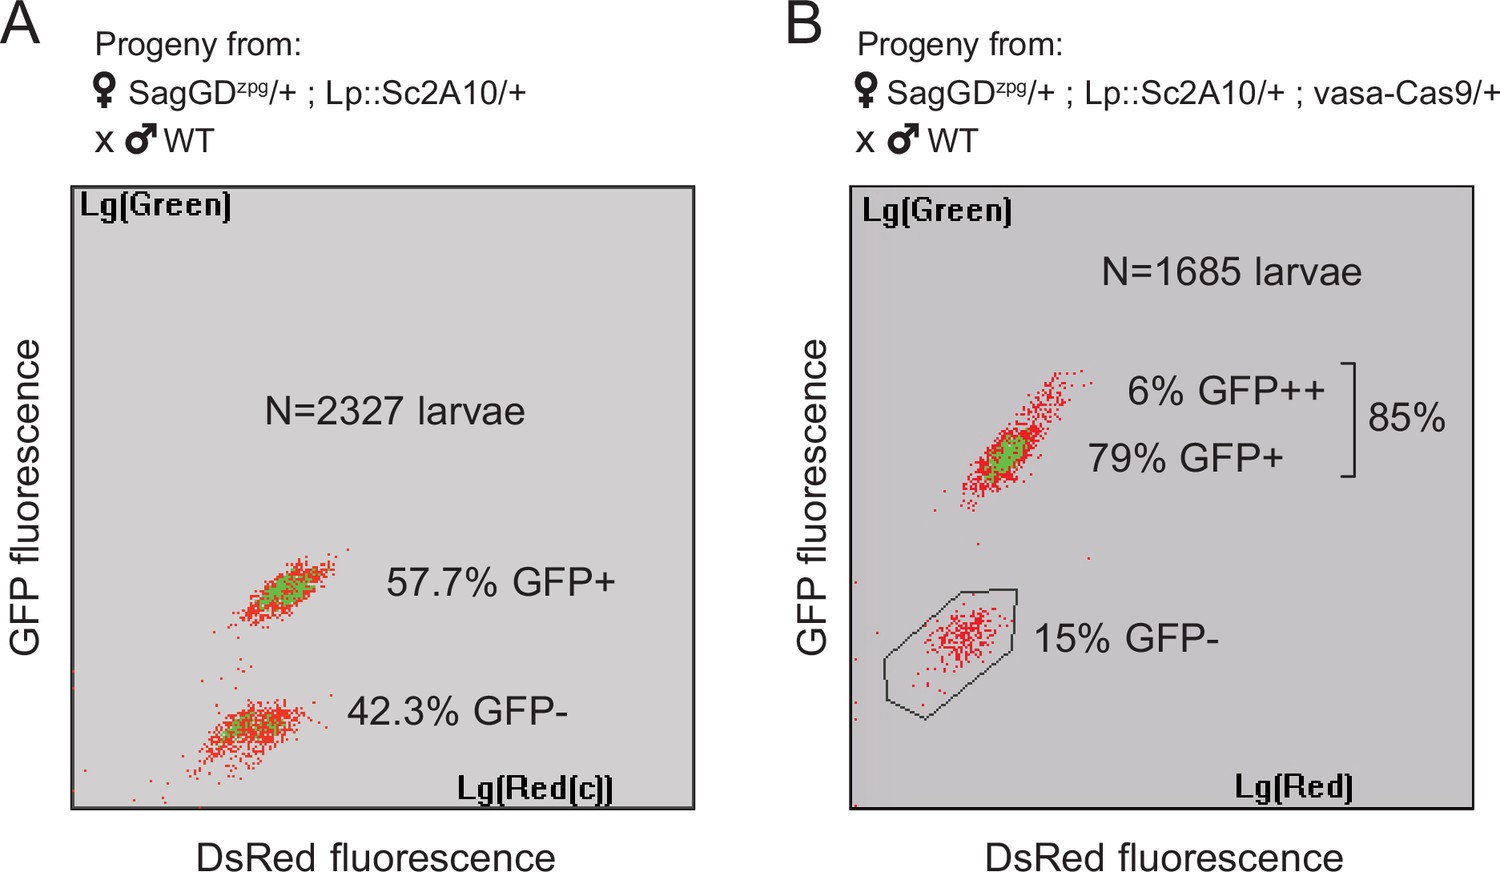
Sag-GDzpg triggers modest homing at the Lp locus, which can be rescued by vasa-Cas9.
(A) COPAS analysis of the progeny from [SagGDzpg/+; Lp::Sc2A10/+] females crossed to WT. Weak DsRed fluorescence does not allow accurate separation of DsRed +and DsRed- larvae. Note that GFP inheritance is only slightly higher than the 50% expected in the absence of homing. (B) COPAS analysis of the progeny from triple transgenic [SagGDzpg /+; Lp::Sc2A10/+; vasa-Cas9/+] females crossed to WT. Note the higher GFP homing rate. 6% of individuals appeared to be homozygous, revealing either unexpected homing in early embryos due to maternal Cas9 deposition, or accidental contamination of the cross with a few transgenic males. DsRed positive and negative larvae were indistinguishable with the COPAS settings used for this experiment.
Figure 7
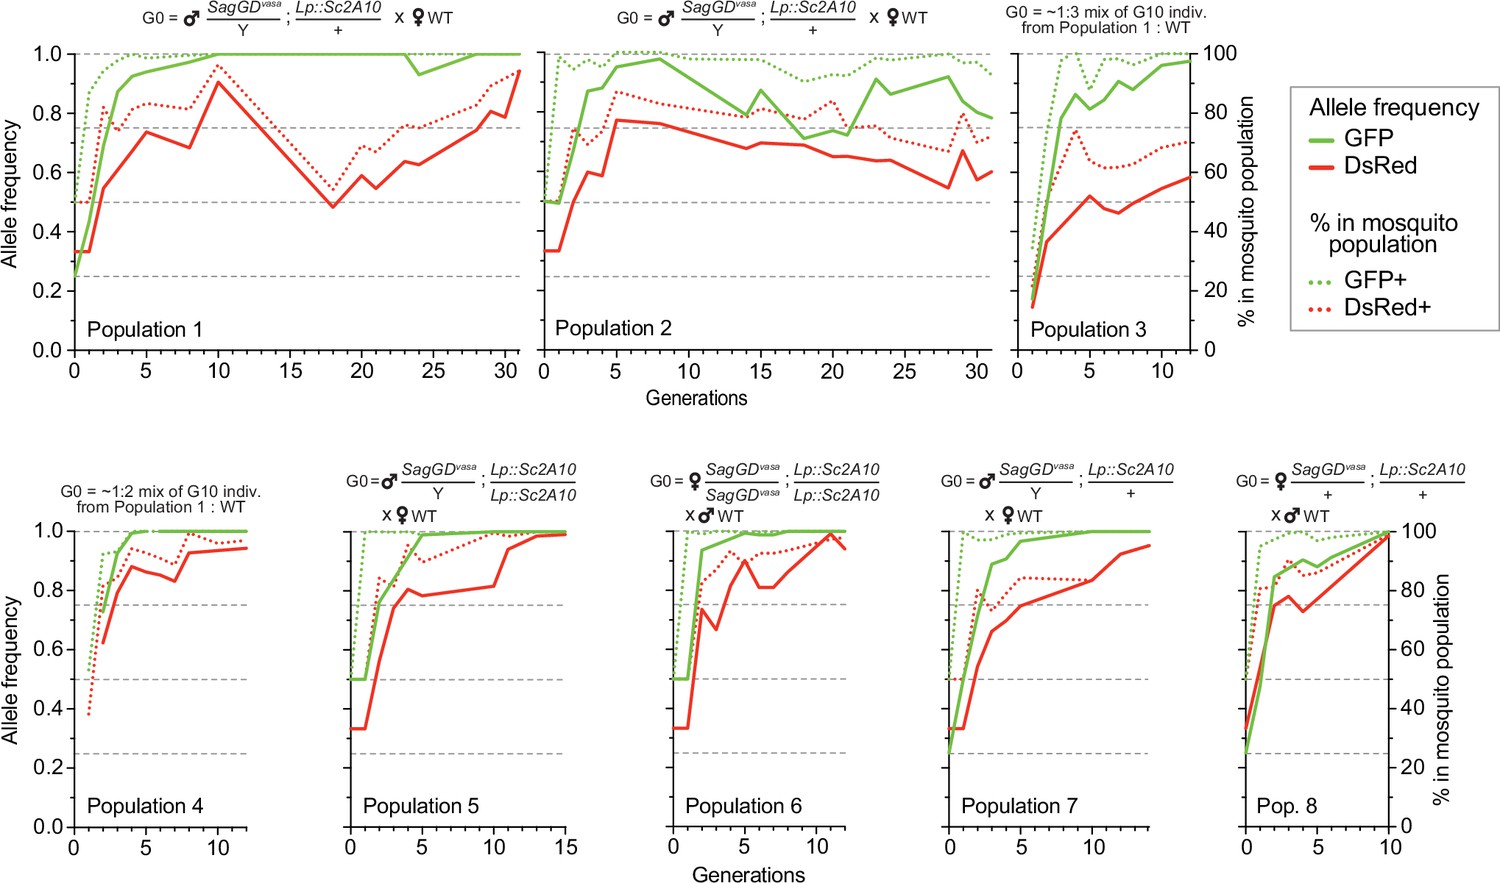
Temporal dynamics of the Sag-GDvasa and Lp::Sc2A10 transgenes in 8 mosquito populations.
Transgenic mosquitoes carrying both transgenes were crossed to wild-type of the other sex (populations 1, 2, 5, 6, 7, 8) or mixed with wild-types (populations 3, 4) as indicated above the diagrams, and the frequency of each transgene in 1000–4000 neonate larvae of successive generations was tracked by flow cytometry (COPAS) using the GFP fluorescent marker of Lp::Sc2A10 and the DsRed fluorescent marker of Sag-GDvasa. Calculated transgene frequency, taking homozygous and heterozygous larvae into account (continous lines), and percentage of fluorescent mosquitoes (dotted lines) are shown on the graphs. For the autosomal transgene, frequency of each genotype in the population was calculated as([2 x(number of homozygotes)+number of heterozygotes]/ 2 x(total number of larvae]). For the X-linked transgene, frequency was ([2 x(number of homozygotes)+number of heterozygotes]/ 1.5 x(total number of larvae]). Numbers of larvae were obtained by gating corresponding clouds of larvae on COPAS diagrams (see Supplementary file 5) and recording the associated percentage measured by COPAS software, or by opening COPAS files and gating in WinMDI software. Gating was approximate due to partial overlap between different clouds of larvae. Supplementary file 5 shows strips of all COPAS diagrams that served to extract this data, which provide a more accurate sense of transgene dynamics over generations.
Figure 8
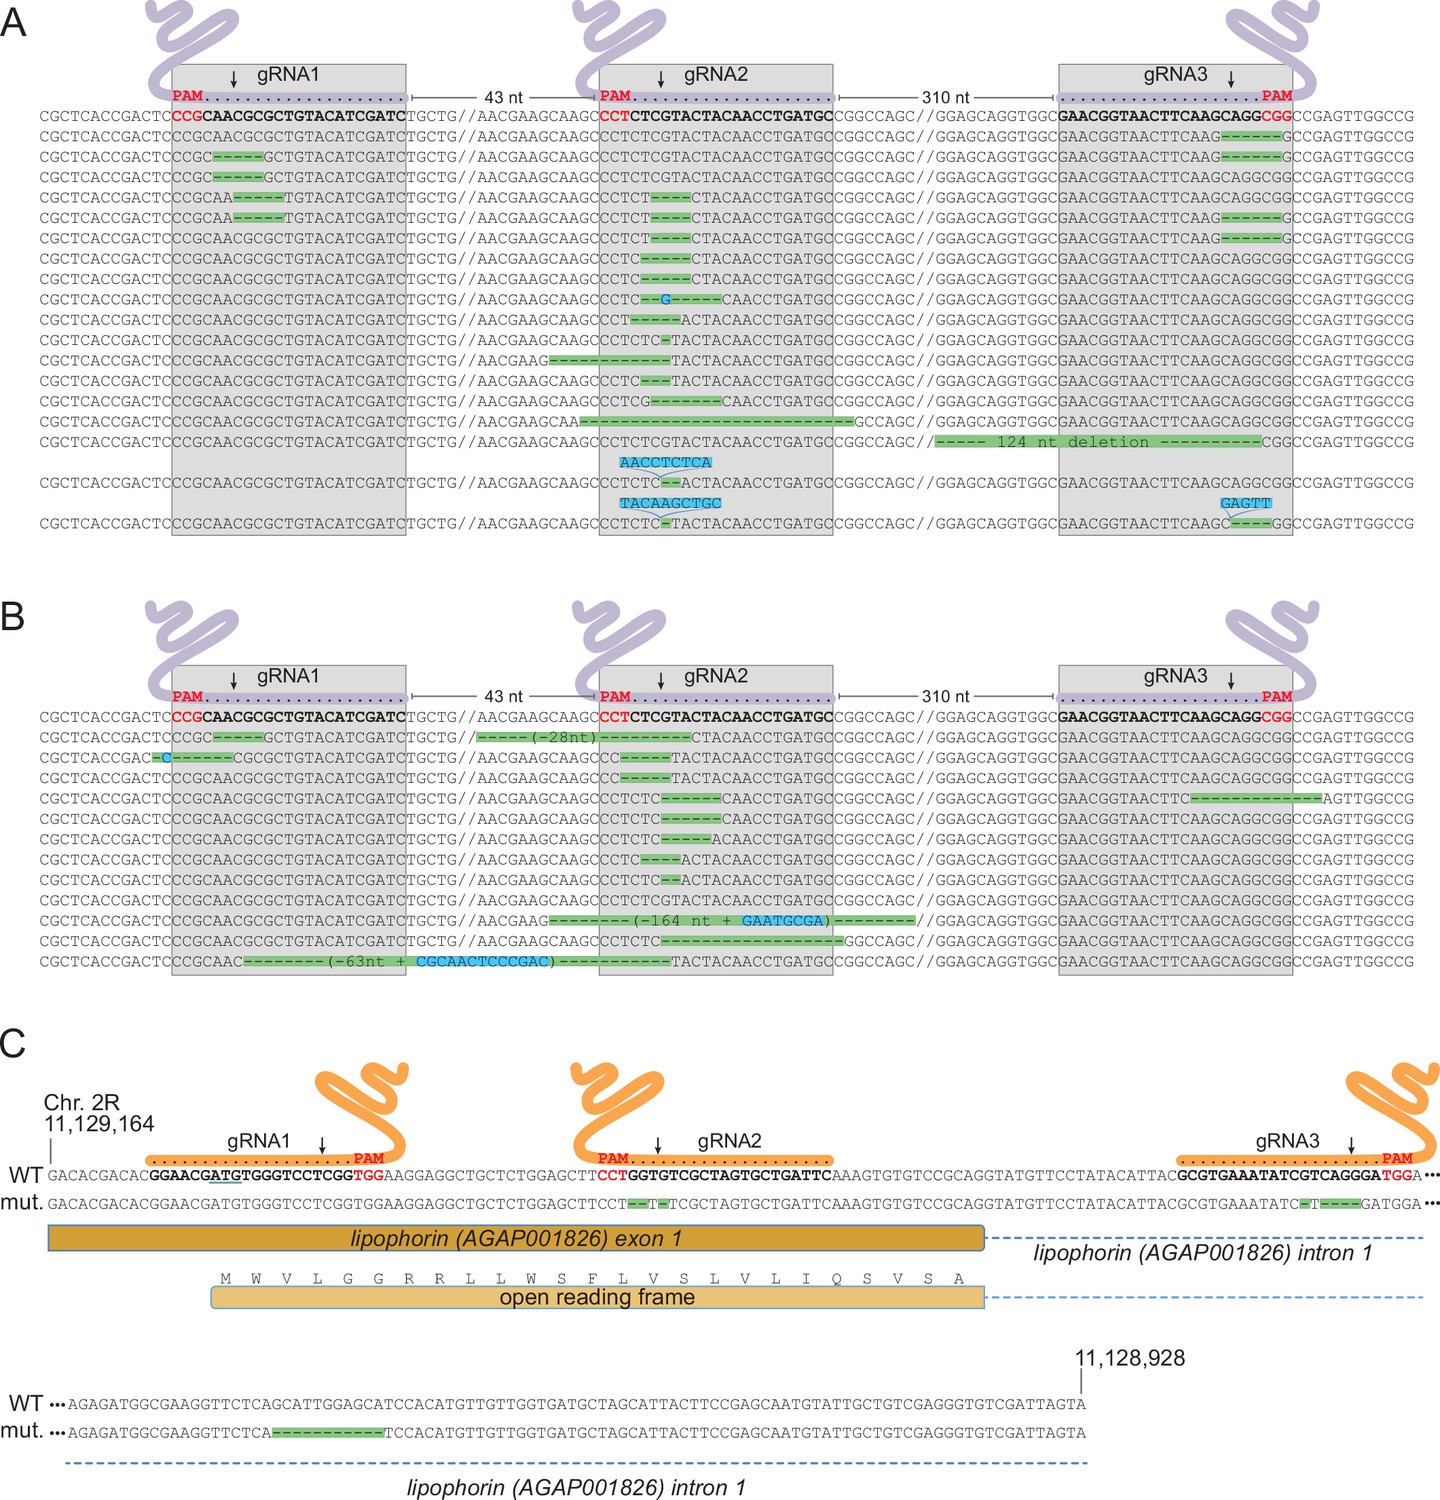
Characterization of mutations in target genes.
(A, B) Characterization of Saglin failed homing mutations. A PCR product spanning the three Saglin gRNA target sites was amplified from 150 DsRed-negative larvae from generation 4 of population 1 (A) or from 750 DsRed-negative larvae from generation 3 of population 2 (B) and subjected to high-throughput amplicon sequencing. The different Saglin mutant haplotypes discovered in each sample are aligned to the WT sequence (top) with target site and protospacer-adjacent motifs (PAMs) indicated. Arrows point to Cas9 cleavage sites. Deleted nucleotides are highlighted in green, inserted nucleotides in blue. // indicates portions of WT sequence not represented on the figure. The distance between two gRNA target sites (number of nucleotides) is indicated above the WT sequence. (C) gRNA target sites and failed homing-induced mutations in the Lp gene. The WT sequence of the 5’ region of the Lp gene shows exon and intron sequences, the position of gRNA target sites with PAMs (red), and the ATG initiator codon (underlined). Nucleotides shown in orange were deleted in twelve sequenced homozygous mutant mosquitoes. An additional, 11 bp deletion in the intron, distant from gRNA target sites (red) was unexpected.
Figure 9
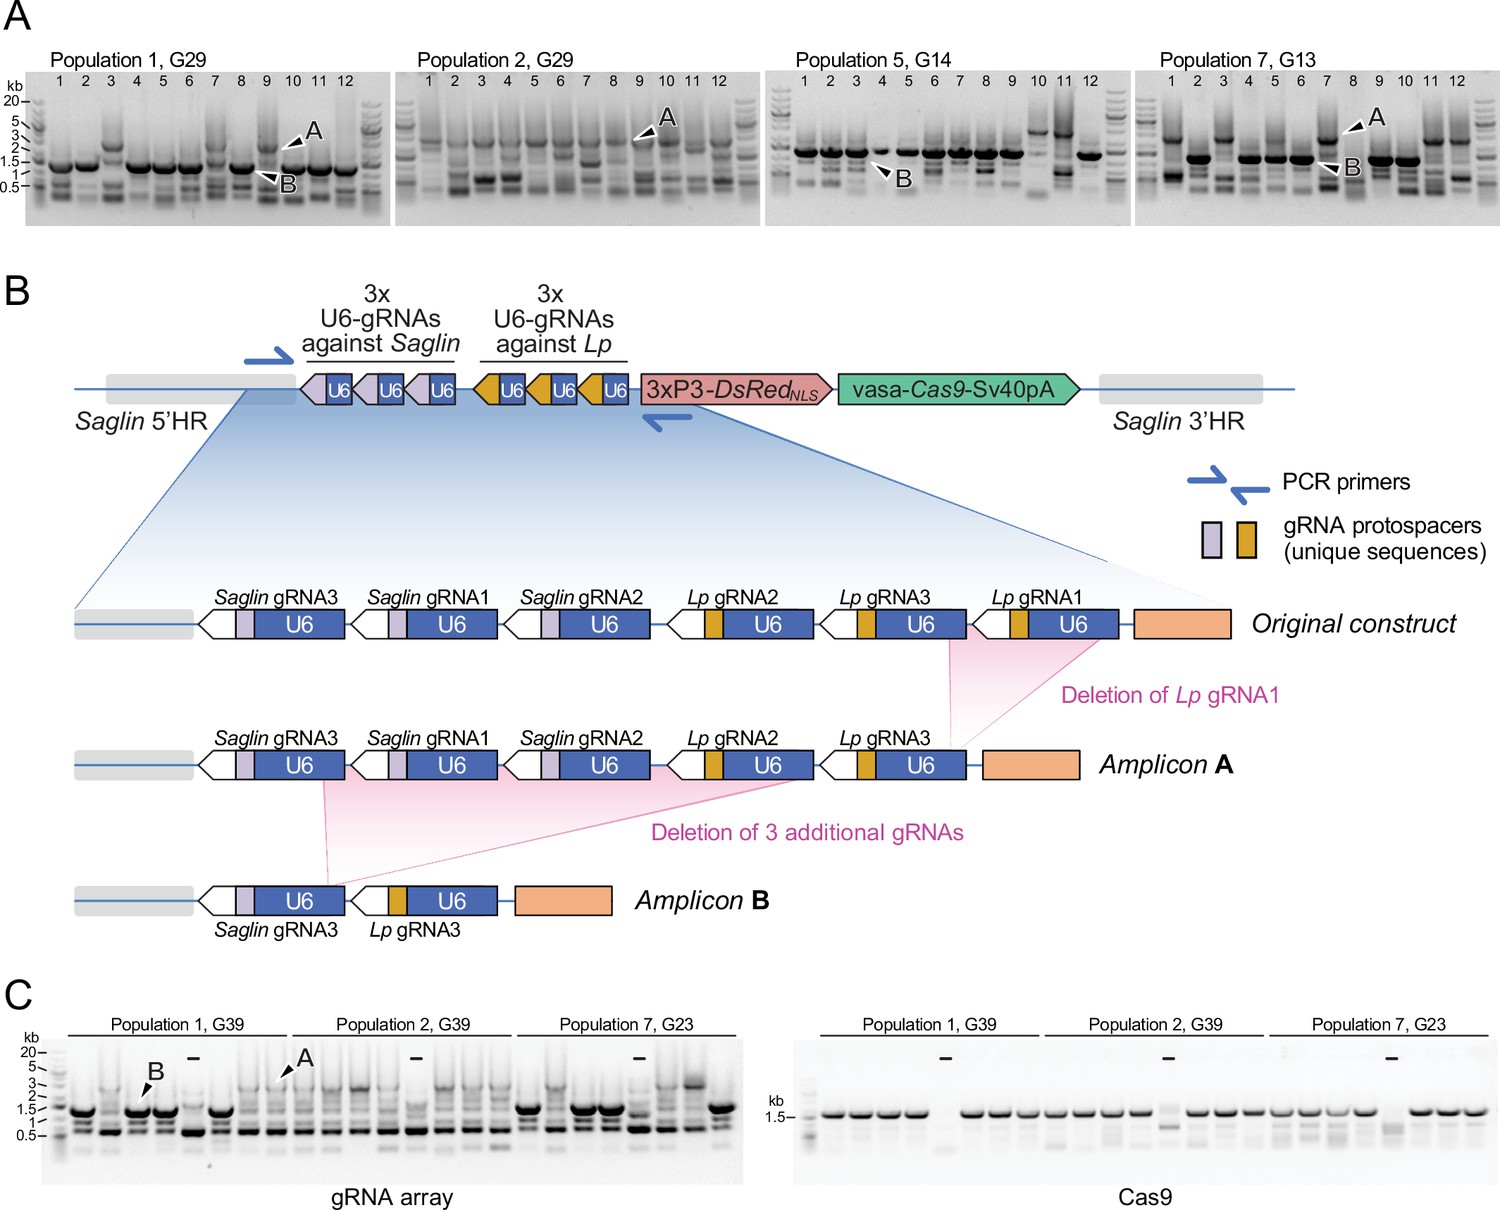
PCR genotyping of 31st generation individual Sag-GDvasa mosquitoes reveals deletions in the gRNA array.
(A) PCR amplicons spanning the six initial gRNAs in Sag-GDvasa were generated from 12 individual male mosquitoes (carrying a single transgene copy) from each of populations 1, 2, 5, and 7, 31 generations after initial transgene integration (corresponding to the indicated generation number for each tracked population) and resolved on agarose gels with 1 kb +DNA ladder (Thermofisher) as a size marker (upper panels). Arrows point to examples of PCR products specific of the transgene as confirmed by Sanger sequencing; other bands are PCR artefacts. Sanger sequencing of amplicons of types A and B showed that they contain only five and two residual gRNA coding units, respectively, as schematized in panel (B). (C) The same deletions were detected again 10 generations later (left panel). PCR primers amplifying Cas9 were used in parallel (right panel), to verify the presence of the Cas9 part of the transgene. ‘–‘ signs indicate control PCRs performed on wild-type genomic DNA. Sample loading order is identical in the two panels.
-
Figure 9—source data 1
The top part and the bottom part of each gel image was cropped to exclude empty space and re-arranged horizontally to generate Figure 9A.
For labels, see Figure 9A.
- https://cdn.elifesciences.org/articles/93142/elife-93142-fig9-data1-v3.pdf
-
Figure 9—source data 2
The top part and the bottom part of each gel image was cropped to exclude empty space and re-arranged horizontally to generate Figure 9A.
For labels, see Figure 9A.
- https://cdn.elifesciences.org/articles/93142/elife-93142-fig9-data2-v3.zip
-
Figure 9—source data 3
The top part and the bottom part of each gel image was cropped to exclude empty space and re-arranged horizontally to generate Figure 9A.
- https://cdn.elifesciences.org/articles/93142/elife-93142-fig9-data3-v3.zip
-
Figure 9—source data 4
The bottom parts of these gel images was cropped to constitute the left and right panels of Figure 9C.
For labels, see Figure 9C.
- https://cdn.elifesciences.org/articles/93142/elife-93142-fig9-data4-v3.pdf
-
Figure 9—source data 5
The bottom part this gel image was cropped to constitute the left panel of Figure 9C.
For labels, see Figure 9C.
- https://cdn.elifesciences.org/articles/93142/elife-93142-fig9-data5-v3.zip
-
Figure 9—source data 6
The bottom part this gel image was cropped to constitute the right panel of Figure 9C.
- https://cdn.elifesciences.org/articles/93142/elife-93142-fig9-data6-v3.zip
Tables
Table 1
Mass spectrometry identification of peptides from Lipophorin and Sc2A10 in hemolymph from transgenic mosquitoes and wild-type sibling controls.
The table shows the total number of peptide spectra detected in each hemolymph sample for the two Lp subunits and for Sc2A10. Hemolymph was collected from homozygous (hom) and heterozygous (het) transgenic mosquitoes. Relative, normalized abundance of these peptides in the protein sample, calculated by dividing their spectral count by the respective protein’s molecular weight (kDa) and by the total spectral counts from known abundant hemolymph proteins found in the sample (ApoLpIII, APL1C, LRIM1, Nimrod, Phenoloxidase, and TEP1), is indicated in parentheses. Resulting values were multiplied by a constant factor equal to the average number of spectra from these control proteins across samples.
| Sample | ApoLpI | ApoLpII | Sc2A10 |
|---|---|---|---|
| WT control | 2075 (5.8) | 486 (5.1) | 0 (0) |
| hom Sc2A10, sample 1 | 1627 (5.1) | 405 (4.8) | 11 (0.4) |
| hom Sc2A10, sample 2 | 1002 (4.4) | 267 (4.4) | 7 (0.3) |
| het Sc2A10, sample 1 | 1557 (10.1) | 351 (8.7) | 2 (0.1) |
| het Sc2A10, sample 2 | 2290 (6.0) | 664 (6.7) | 2 (0.1) |
Table 2
The SagGDvasa GD shows high homing rates in the G2 generation at both the Lp and Saglin loci.
Six individual SagGDvasa G1 females mated to WT males oviposited in individual tubes and their larval progeny was scored visually for GFP and DsRed fluorescence. Homing rates are calculated as the percentage of WT chromosomes converted to transgenic, i.e.: ((inheritance rate)–50%)x2.
| Female # | Total larvae | Negatives | GFP + only | DsRed + only | GFP + DsRed + | GFP inheritance and homing rate(Lp locus) | DsRed inheritance rate, homing rate(Saglin locus) |
|---|---|---|---|---|---|---|---|
| 1 | 89 | 0 | 0 | 0 | 89 | 100 % | 100 %, 100% |
| 2 | 52 | 0 | 4 | 0 | 48 | 100 % | 92.3%, 84.6 % |
| 3 | 59 | 0 | 0 | 0 | 59 | 100 % | 100%, 100 % |
| 4 | 59 | 0 | 6 | 0 | 53 | 100 % | 89.8%, 79.6 % |
| 5 | 50 | 0 | 5 | 0 | 45 | 100 % | 90%, 80 % |
| 6 | 57 | 0 | 3 | 0 | 54 | 100 % | 94,7%, 89.4 % |
Additional files
-
Supplementary file 1
DNA sequences of constructs used in this study.
- https://cdn.elifesciences.org/articles/93142/elife-93142-supp1-v3.docx
-
Supplementary file 2
Tracking the evolution dynamics of Lp::Sc2A10 transgene frequency.
A parental cage was assembled containing only heterozygous transgenic mosquitoes (G0, transgene frequency = 50%). Neonate larvae of subsequent generations except G5, 6, 8, 9 (N indicates the number of larvae analysed) were analyzed using COPAS flow cytometry. Gates were drawn on COPAS diagrams around clouds of larvae corresponding to homozygous, heterozygous and negative individuals according to the intensity of GFP fluorescence, and the corresponding percentage of objects in each gate was recorded. Percentages were corrected to exclude objects not corresponding to larvae. Transgene frequency per 100 chromosomes dropped from 50% in G0 to 11.35% in G17, an average loss of 2.3% per generation.
- https://cdn.elifesciences.org/articles/93142/elife-93142-supp2-v3.docx
-
Supplementary file 3
Fertility tests comparing the number of progeny produced by homozygous Lp::Sc2A10 female versus WT female mosquitoes.
Indicated identical numbers of virgin transgenic and WT females were mixed in cages with WT males. After blood feeding, neonate larvae produced by each cage were analyzed by flow cytometry (COPAS) and the numbers of GFP fluorescent and negative larvae were counted using WinMDI software on COPAS files. Identical fertility of the two categories of females would produce 50% of GFP positive progeny. a, b after the replicate number indicate the first and second egg batch, respectively, from the same mosquitoes. Replicate 1 was composed of smaller mosquitoes, due to higher density larval rearing. All other replicates were performed with mosquitoes of standard size. Replicate 4b was performed with older mosquitoes, with >50% of females already dead.
- https://cdn.elifesciences.org/articles/93142/elife-93142-supp3-v3.docx
-
Supplementary file 4
Mouse parasitemia after infection by mosquito bites.
Mice are grouped by categories according to the genotype of the Plasmodium-carrying mosquitoes biting them or by the strain of parasite infecting them. Groups of 10 infected mosquito females (transgenic or their wild-type siblings grown in the same culture), were allowed to bite a mouse. Colored cells indicate the stage at which infected mice were sacrificed to prevent the appearance of malaria symptoms. n.d=not determined. ‘D’ in the third column indicates a mouse bitten by transgenic mosquitoes that showed a clearly delayed parasitemia compared to the controls. In two cases (indicated in third column), the mouse was bitten by fewer than 6 WT mosquitoes.
- https://cdn.elifesciences.org/articles/93142/elife-93142-supp4-v3.xlsx
-
Supplementary file 5
Temporal dynamics of the Sag-GDvasa and Lp::Sc2A10 transgenes in 8 mosquito populations.
Each strip of panels on successive pages corresponds to an independent caged mosquito population. Each panel is a COPAS analysis snapshot of neonate larvae at the indicated generation, obtained as shown on the first page. Successive panels provide a global view of each transgene’s evolution on samples of 1000–4000 neonate larvae at each generation, with fluorescence intensity correlating with transgene copy number (GFP marks the Lp::Sc2A10 transgene on the Y axis, DsRed marks Sag-GDvasa on the X axis). Up to 9 partially overlapping distinct larval populations corresponding to the 9 possible genotypes (0, 1, or 2 copies of each fluorescence, sketched on page 1 and on selected panels duplicated below the original panel) can be resolved on COPAS diagrams. Dots indicated in population 1 panels correspond to debris (dead larvae, egg shells) and are difficult to distinguish from non-fluorescent larvae unless sorting them for verification under the microscope. Yellow arrow in population 2, G14 indicates the appearance of GFP negative larvae that represent a Lp homing refractory mutant (see text). Tracking Populations 1 and 2 started shortly after initial transgenesis, by crossing G2 [Sag-GDvasa / Y; Lp::Sc2A10 / +] males to WT females (considered the G0 cross for temporal tracking of genotypes). Population 3 was assembled by mixing 20 transgenics from generation 12 of population 2 with 190 WT. Population 4 was assembled by mixing 60 transgenics from generation 12 of population 2 with 189 WT. In these new G0 mixes reproductive success of transgenics proved higher than that of the WT (due to differences in the quality of the parental mosquitoes), as G1 pupae consisted of 189 GFP transgenics for 358 negatives = 34.5% instead of expected 10% (population 3) or 346 GFP transgenics for 304 negatives = 53.2% instead of expected 24.1% (population 4). In all populations, note the initial rapid convergence of genotypes towards Lp::Sc2A10 (GFP) homozygosity, the rapid initial disappearance of Sag-GDvasa (DsRed) positives lacking GFP, and the persistence of a fraction of DsRed negative larvae.
- https://cdn.elifesciences.org/articles/93142/elife-93142-supp5-v3.pdf
-
MDAR checklist
- https://cdn.elifesciences.org/articles/93142/elife-93142-mdarchecklist1-v3.pdf
Download links
A two-part list of links to download the article, or parts of the article, in various formats.
Downloads (link to download the article as PDF)
Open citations (links to open the citations from this article in various online reference manager services)
Cite this article (links to download the citations from this article in formats compatible with various reference manager tools)
A population modification gene drive targeting both Saglin and Lipophorin impairs Plasmodium transmission in Anopheles mosquitoes
eLife 12:e93142.
https://doi.org/10.7554/eLife.93142


