A high-throughput platform for single-molecule tracking identifies drug interaction and cellular mechanisms
- Eikon Therapeutics Inc, United States
- University of California, Berkeley, United States
Figures
Figure 1 with 3 supplements
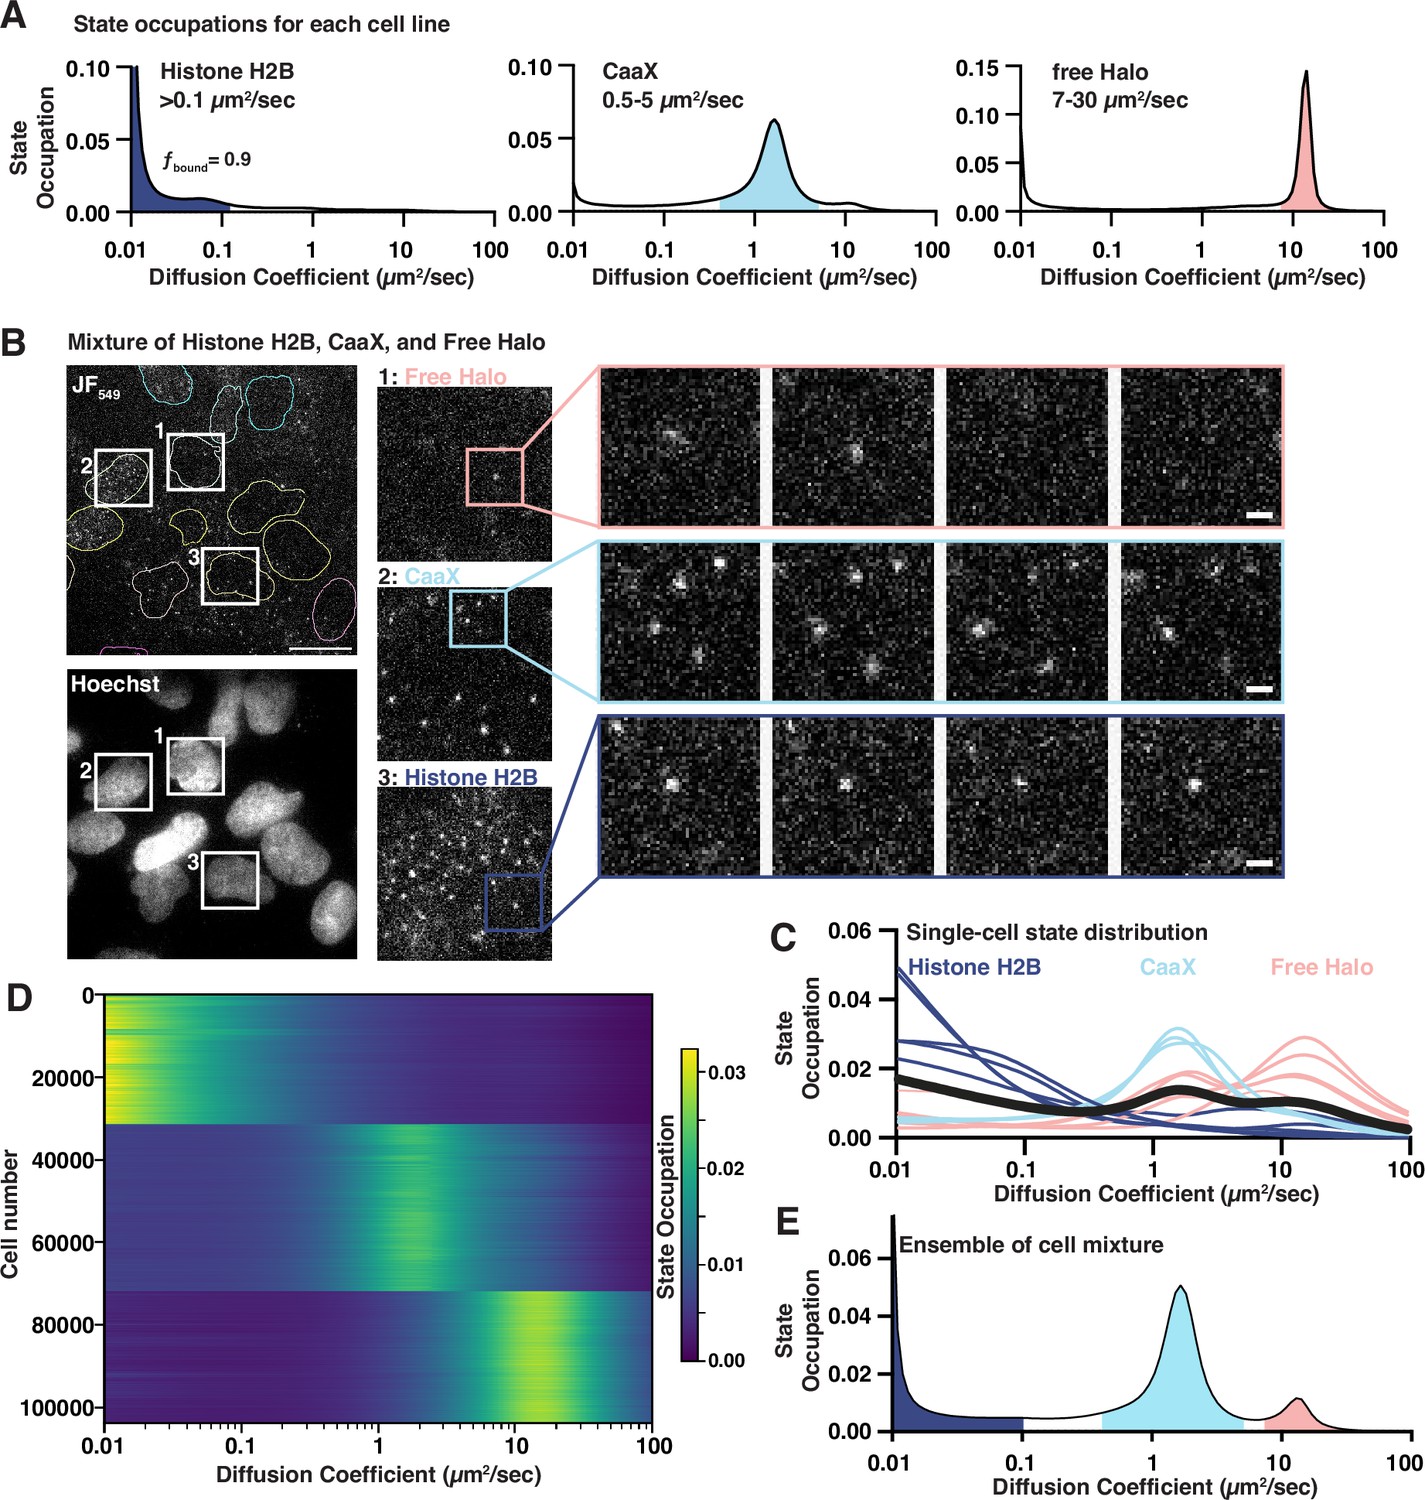
Benchmarking a high-throughput single-molecule tracking platform.
(A) Diffusion state probability distributions from three cell lines expressing Histone H2B-Halo, Halo-CaaX, or Halo alone. Shaded bins represent the diffusive states characteristic of each cell line. (B) Example field of view. Equal mixture of H2B-Halo, Halo-CaaX, and free Halo cell line single-molecule images (top) and reference Hoechst image (bottom). Insets show zoom-ins to individual cells and to sequential frames of individual molecules. Image intensities are equivalently scaled across panels. (C) Single-cell diffusive states extracted from, colored based on similarity to the H2B-, CaaX-, or free-Halo dynamics reported in (B). (D) Heatmap representation of 103757 cell nuclei measured from a mixture of Halo-H2B, Halo-CaaX, or free Halo mixed within each well over 1540 unique wells in five 384-well plates. Each horizontal line represents a nucleus. Cells were clustered using k-means clustering and labels assigned based on the diffusive profiles determined in (B). (E) Ensemble state occupation of all trajectories recovered from a mixture of Halo-H2B, Halo-CaaX, and free Halo cells. Mean state occupation from 308 assay wells.
-
Figure 1—source data 1
TIFF versions of the images in Figure 1.
- https://cdn.elifesciences.org/articles/93183/elife-93183-fig1-data1-v1.xlsx
Figure 1—figure supplement 1
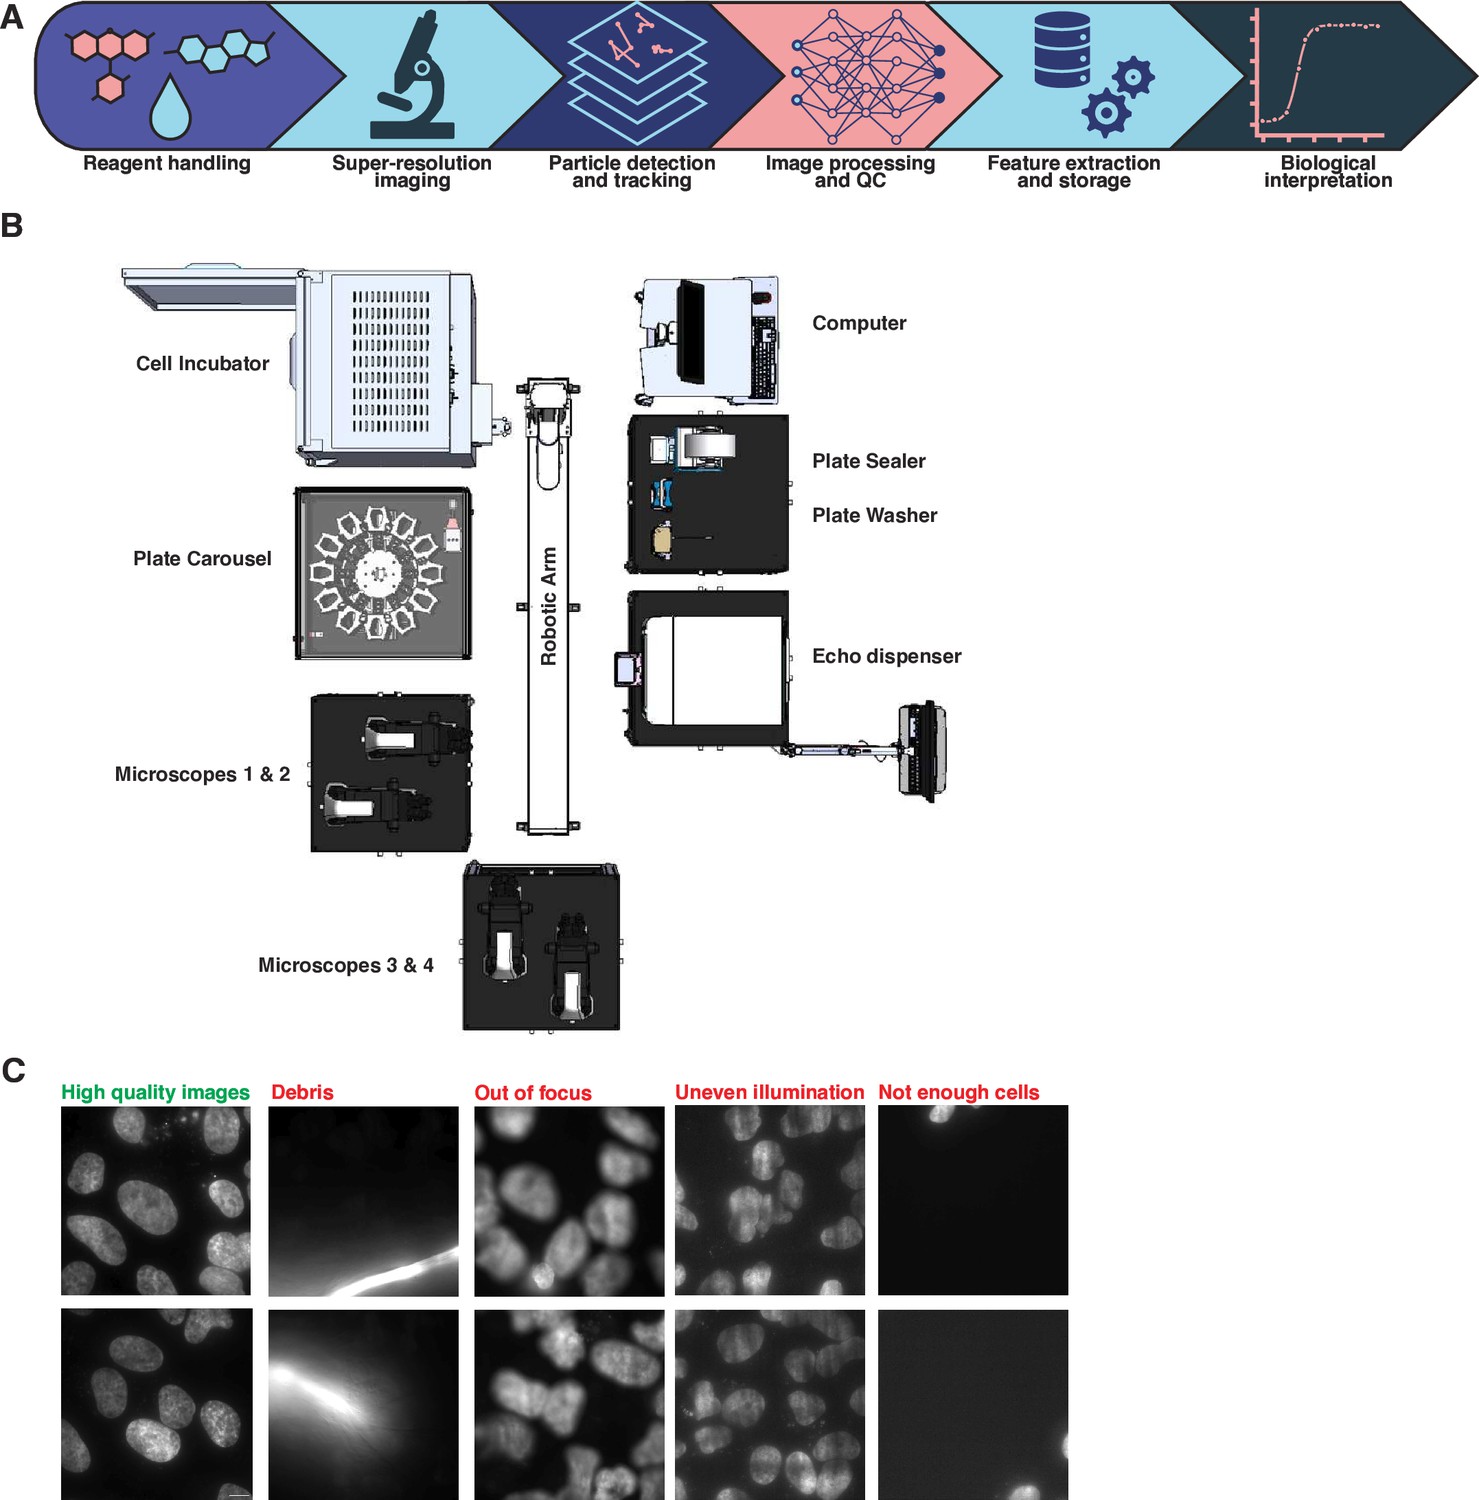
Overview of the high-throughput single-molecule tracking (htSMT) workflow.
(A) Schematic representation of the end-to-end automated htSMT process, beginning with the physical preparation of the sample; image collection on a custom-assembled super-resolution microscope; detection of fluorescent spots and subsequent trajectory reconstruction; image processing and QC; extraction of relevant features by combining trajectories with cellular image data; and finally interpretation by a biologist. (B) Schematic view of the automated htSMT platform. (C) Example Hoechst images to be detected and removed during the data QC phase. Debris, incorrect focus, uneven illumination, and empty field of views (FOVs) which can contaminate screening data are are removed using a deep-learning based classifier of the Hoechst image.
Figure 1—figure supplement 2
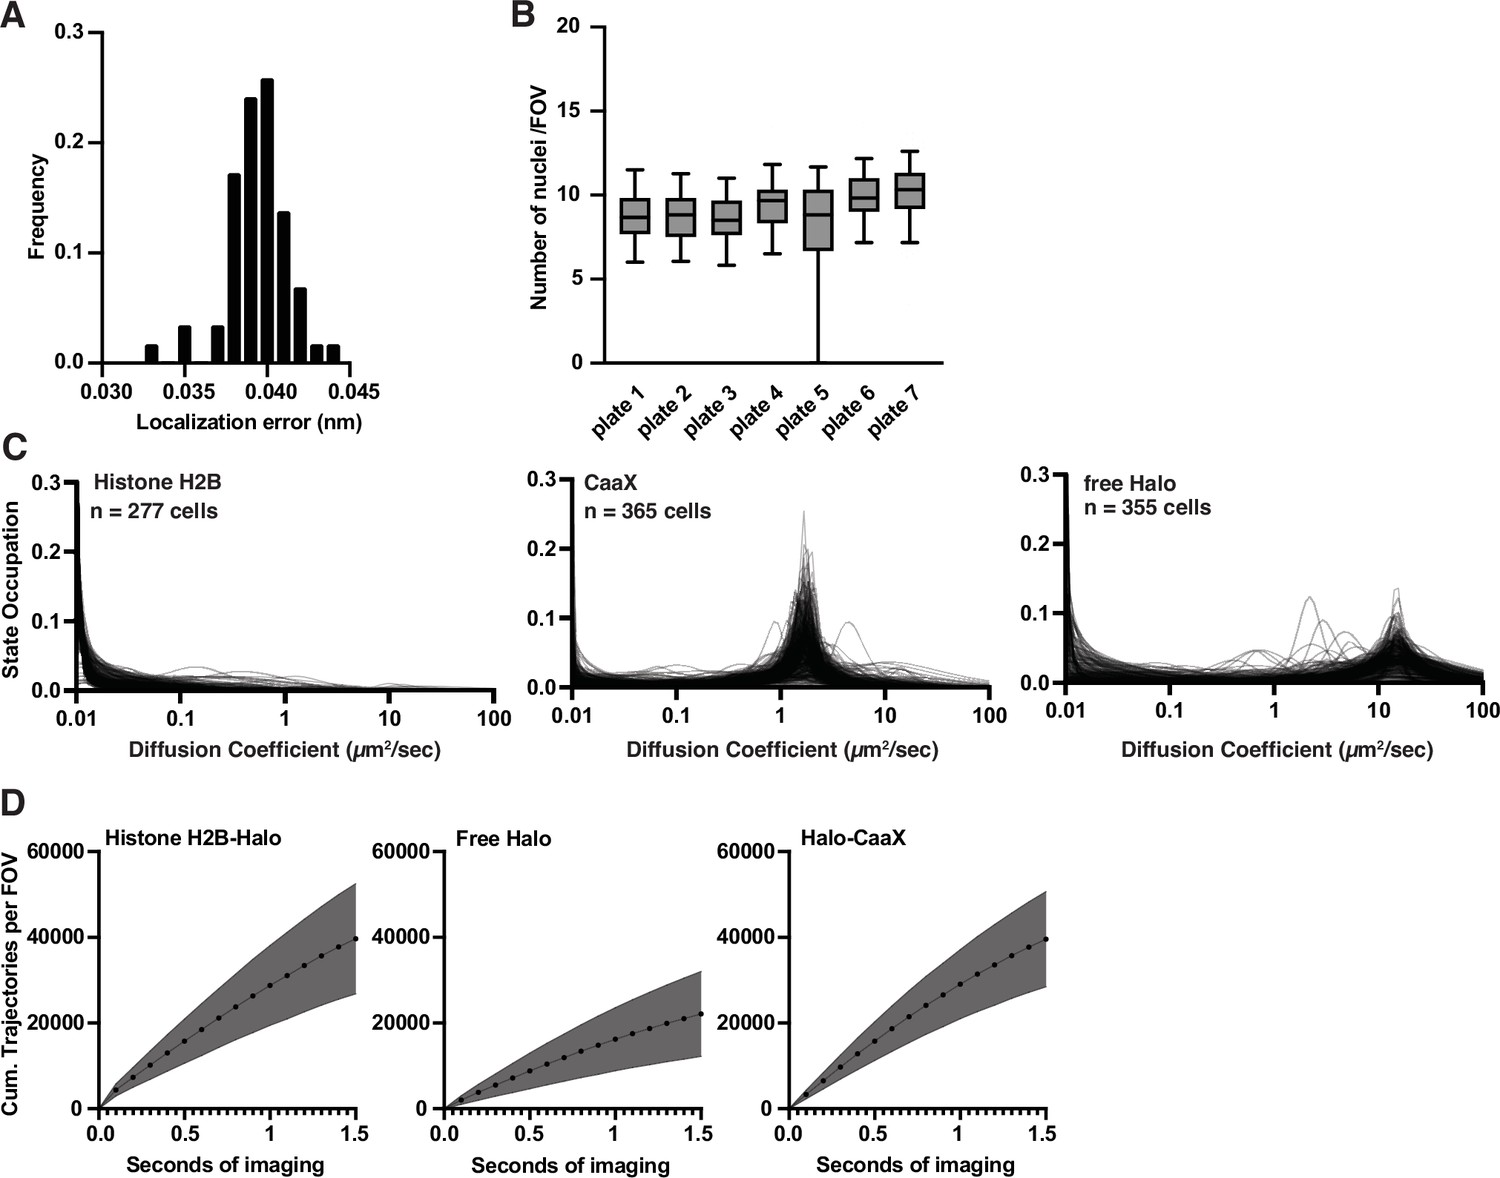
Characterization of high-throughput single-molecule tracking (htSMT) system performance.
(A) Distribution of localization error measured across multiple independent wells using Histone H2B-Halo cells. Median localization error of 39 nm. (B) Number of measurable nuclei in a 94 µm by 94 µm field of view (FOV). Each box plot is the distribution over wells in one 384-well plate. (C) Single-cell state distributions for Histone H2B, CaaX, and free HaloTag cell lines. (D) Cumulative number of trajectories as a function of imaging time for each individual cell type for cells labeled with 10 pM JF549. Shaded error bars are 1 SD.
Figure 1—video 1
Example SMT field of view as shown in Figure 1.
A representative mixture of H2B-Halo, Halo-CaaX, and free Halo expressing cells. Video is played back at 10 frames per second, 10× slower than real time.
Figure 2 with 1 supplement
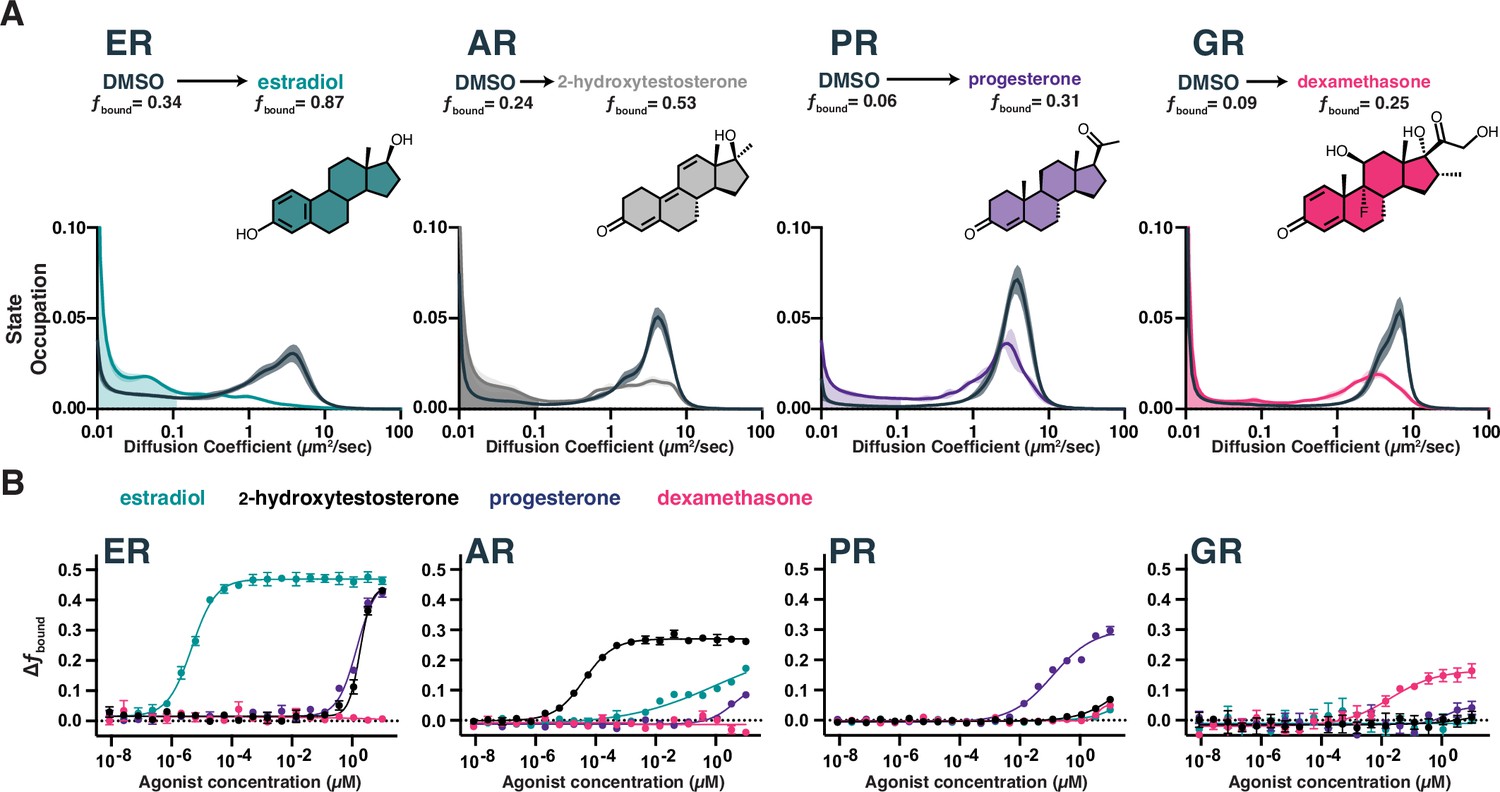
Chromatin binding by steroid hormone receptors (SHRs) is affected by compound treatment.
(A) Distribution of diffusive states for Halo-AR, Halo-ER, Halo-GR, and Halo-PR in U2OS cells before and after stimulation with an activating ligand. The area in the shaded region is fbound. Shaded error bands represent SD. (B) Selectivity of individual SHRs to their cognate ligand compared with other steroids, as determined by fbound. Error bars represent SEM across three biological replicates.
-
Figure 2—source data 1
Tabular data to generate plots from Figure 2 and related figure supplements.
- https://cdn.elifesciences.org/articles/93183/elife-93183-fig2-data1-v1.xlsx
Figure 2—figure supplement 1
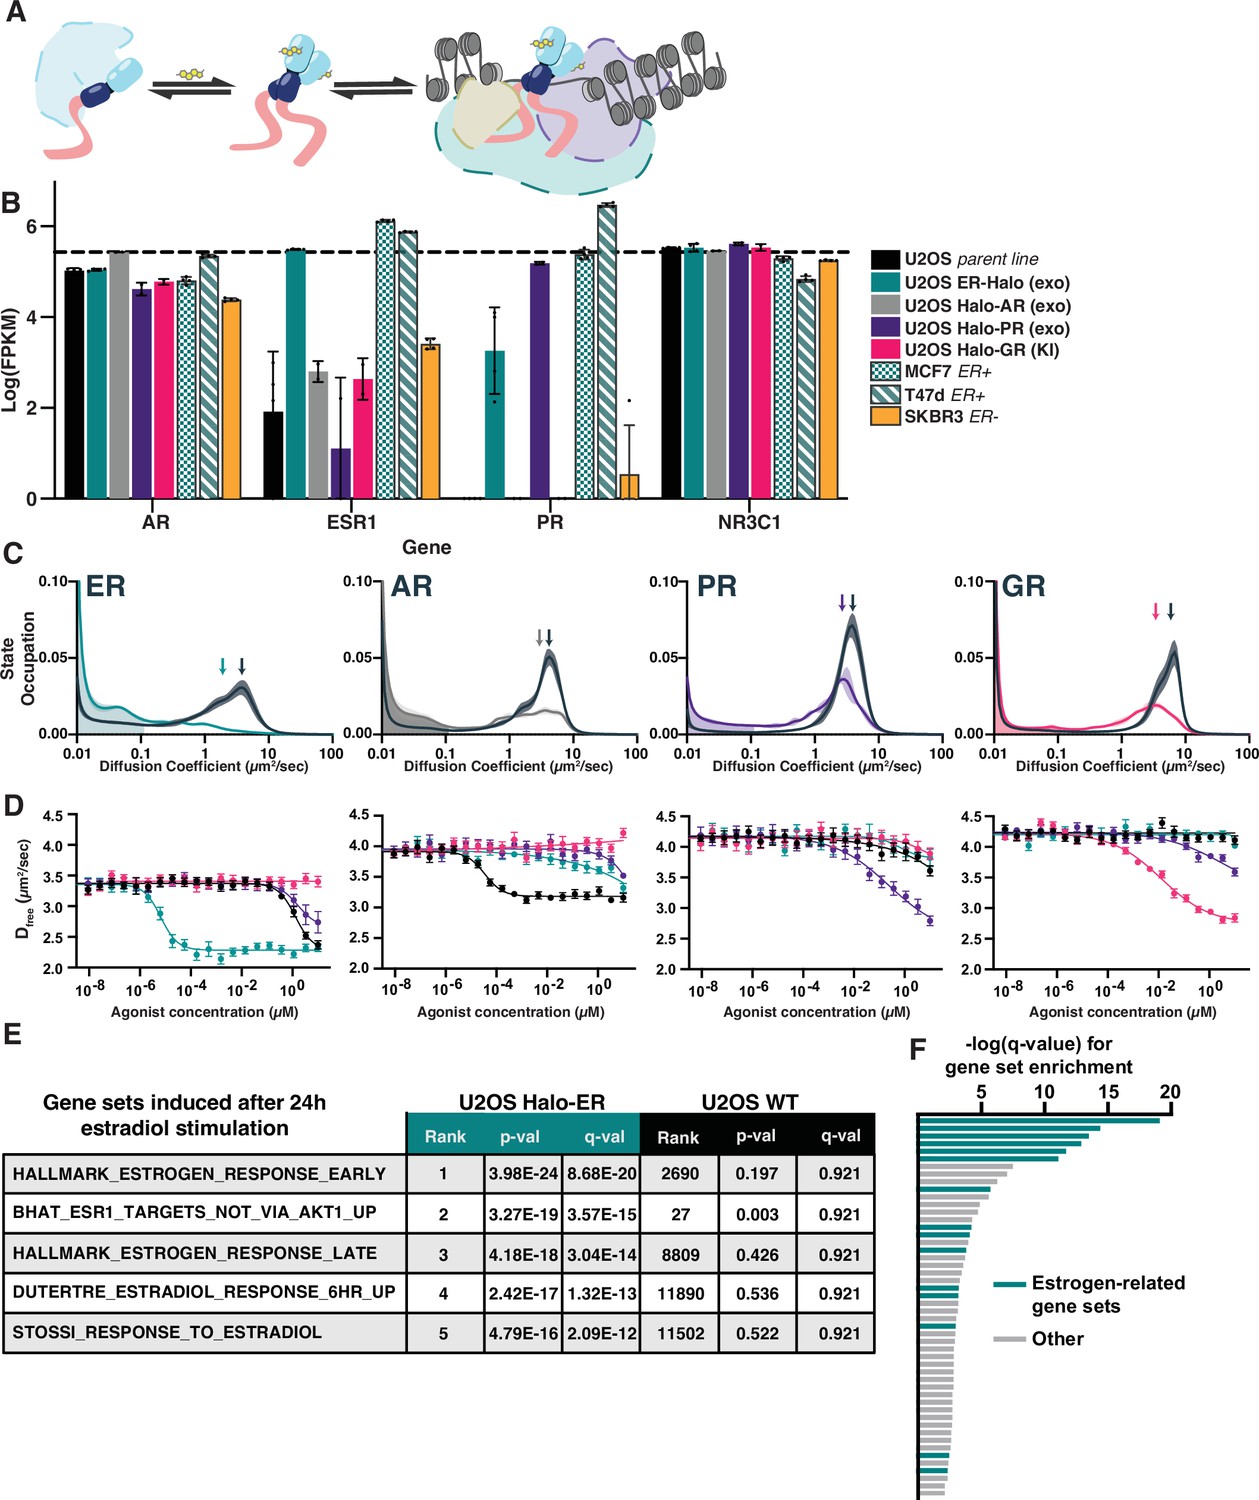
Activation of steroid hormone receptors (SHRs) changes free diffusion and impacts downstream gene expression.
(A) Cartoon illustration of SHR function. Under basal conditions, SHRs are sequestered in complex with HSP90 and other co-factors. Upon ligand binding, the receptor dissociates from the inactive complex, dimerizes, and binds to DNA. (B) mRNA transcript levels in log(FPKM) of AR, ESR1, PR, and NR3C1 for the engineered U2OS cell lines compared to the parental U2OS line as well as three reference breast cancer cell lines. (C) Distribution of diffusive states for Halo-AR, Halo-ER, Halo-GR, and Halo-PR in U2OS cells before and after stimulation with an activating ligand. Arrows indicate the mean Dfree. Shaded error bands represent 1 SD. (D) Selectivity of individual SHRs to their cognate ligand compared with other steroids, as determined by Dfree. Error bars represent SEM. (E) Reference gene sets induced after 24 hr of stimulation with 25 nM estradiol. The top 5 induced gene sets for Halo-ER ectopic expression increases were not significantly induced in the parental U2OS line. (F) Bar plot showing the −log(q value) from the top 50 most significantly induced gene sets after estradiol stimulation. Gene sets characteristic of ESR1 or the estrogen response are colored green.
Figure 3 with 4 supplements
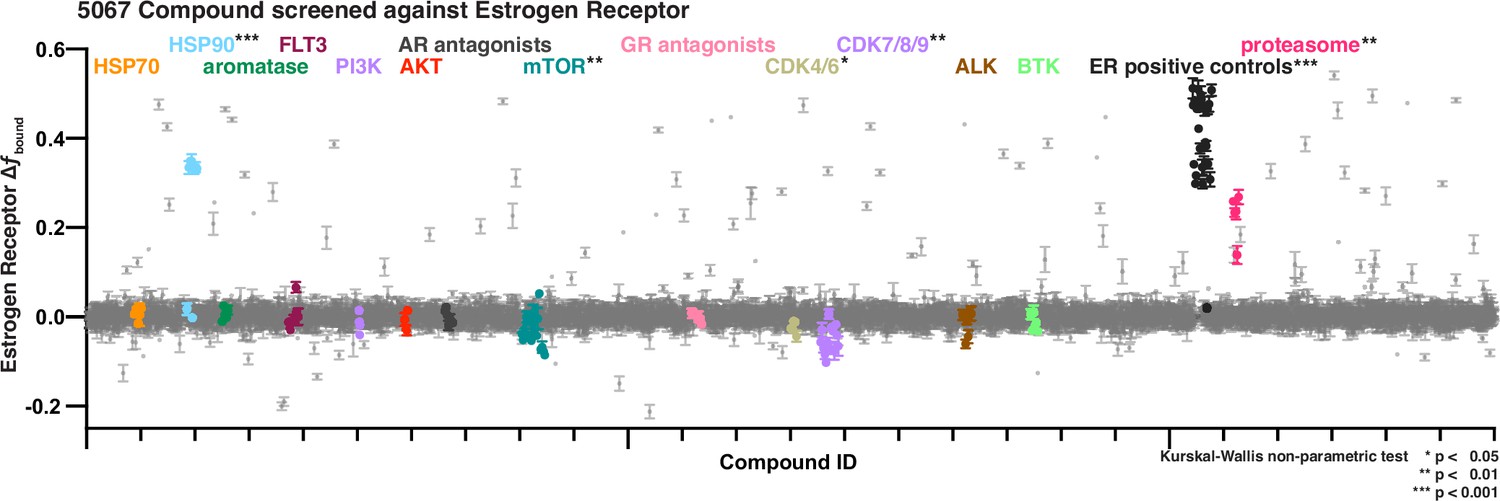
Bioactive screen results of change in estrogen receptor fbound for two biological replicates, each with 2 well replicates per compound of 5067 compounds.
Select inhibitors are grouped and uniquely colored by pathway or target. Error bars are SEM of all replicates.
-
Figure 3—source data 1
List of compounds as part of the Sellek L-1700 bioactive set along with the ‘Target’ and ‘Pathway’ annotations as identified by Selleck.
- https://cdn.elifesciences.org/articles/93183/elife-93183-fig3-data1-v1.csv
-
Figure 3—source data 2
Tabular data to generate plots from Figure 3 and related figure supplements.
- https://cdn.elifesciences.org/articles/93183/elife-93183-fig3-data2-v1.xlsx
Figure 3—figure supplement 1
Experimental design for bioactive molecule screen.
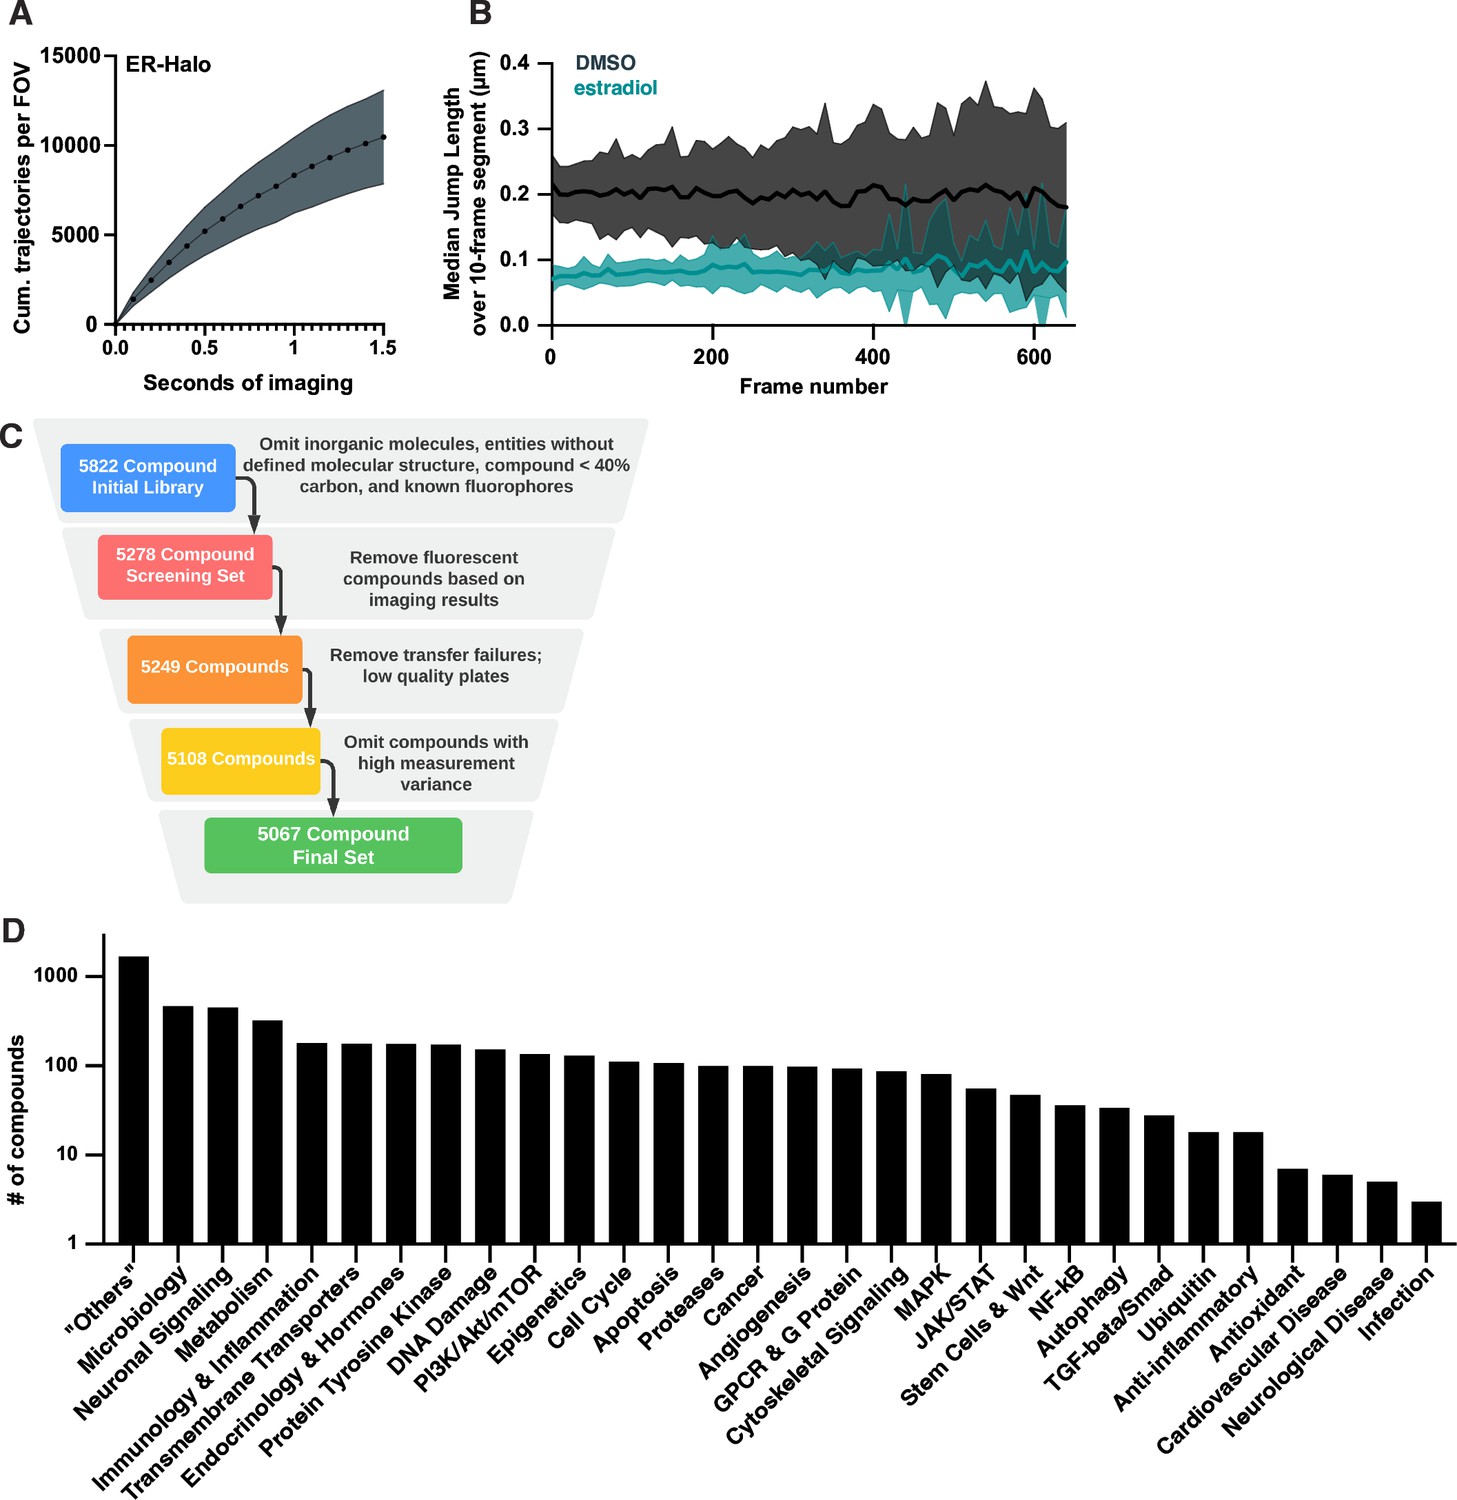
(A) Cumulative number of trajectories as a function of imaging time for DMSO-treated cells labeled with 20 pM JF549. Shaded error bars are 1 SD. (B) Median of the jump length distribution, reported as a function of frame number and calculated in 10-frame increments comparing DMSO- and estradiol-treated wells. Curves are the mean, shaded error bands are 1 SD. (C) Filtering criteria for bioactive compounds in the screen: compounds without SMILES data; compounds with a molecular weight less than 226 Da or more than 800 Da; heavy metals and compounds with more than 60% non-carbon atoms; and compounds with known fluorescent structures (e.g. fluorescein) were removed before screening. During and after screening additional compounds were removed if they were observed to be fluorescent or if they failed to meet data quality criteria. (D) Composition of the bioactive screening set based on the biological pathway targeted as provided by the manufacturer.
Figure 3—figure supplement 2
Screen of bioactive molecules produces robust data with good assay performance.
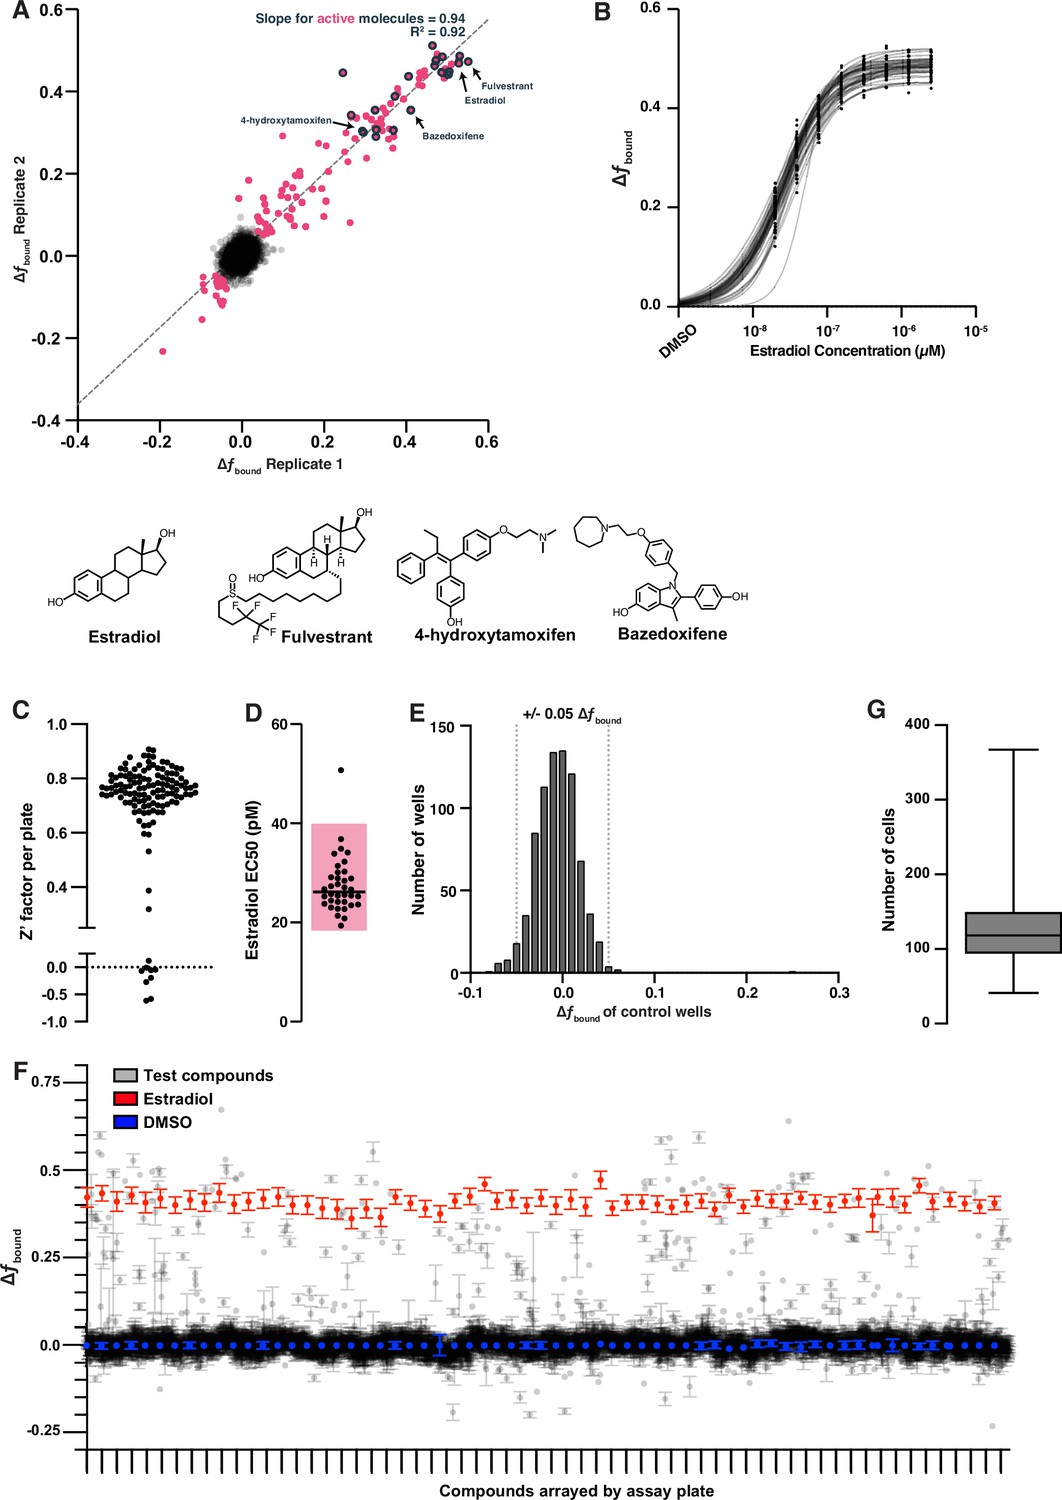
(A) Change in fbound repeatability of screening results assessed over two biological replicates. Compounds in magenta were identified as active if their magnitude of change in fbound when averaged across both replicates was greater than 0.05. Of the expected 30 positive control compounds, 26 significantly increased fbound in both replicates (gray outline). Three compounds increased fbound but were only present in one replicate after filtering. Exemplified positive controls including the agonist estradiol (1) and the antagonists fulvestrant (5), 4-hydroxytamoxifen (4-OHT) (6), and bazedoxifene (7) are exemplified. A linear regression was fit to the magenta compounds to determine slope and correlation. (B) Dose titration of estradiol for each plate in the bioactive molecules screen fit with a logistic regression to determine potency. (C) Z′-factor analysis for the bioactive screen. Each point represents the Z′-factor of a single 384-well plate, measuring the difference between DMSO and 25 nM estradiol treatment. Plates with very low Z′-factors were removed from further analysis. (D) EC50 values extracted from each curve fit in (C). Shaded region is a threefold range in potency. (E) Distribution of change in fbound for control DMSO wells. (F) Change in fbound for unfiltered screening results plotted per assay plate with the negative control (DMSO, blue) and positive control (Estradiol, red) highlighted. Each tick mark on the x-axis is a separate assay plate. Each point is the mean per compound per assay plate, error bars are the SEM. (G) Boxplot showing the number of cell nuclei measured for each compound tested. Whiskers are the 1st and 99th percentiles.
Figure 3—figure supplement 3
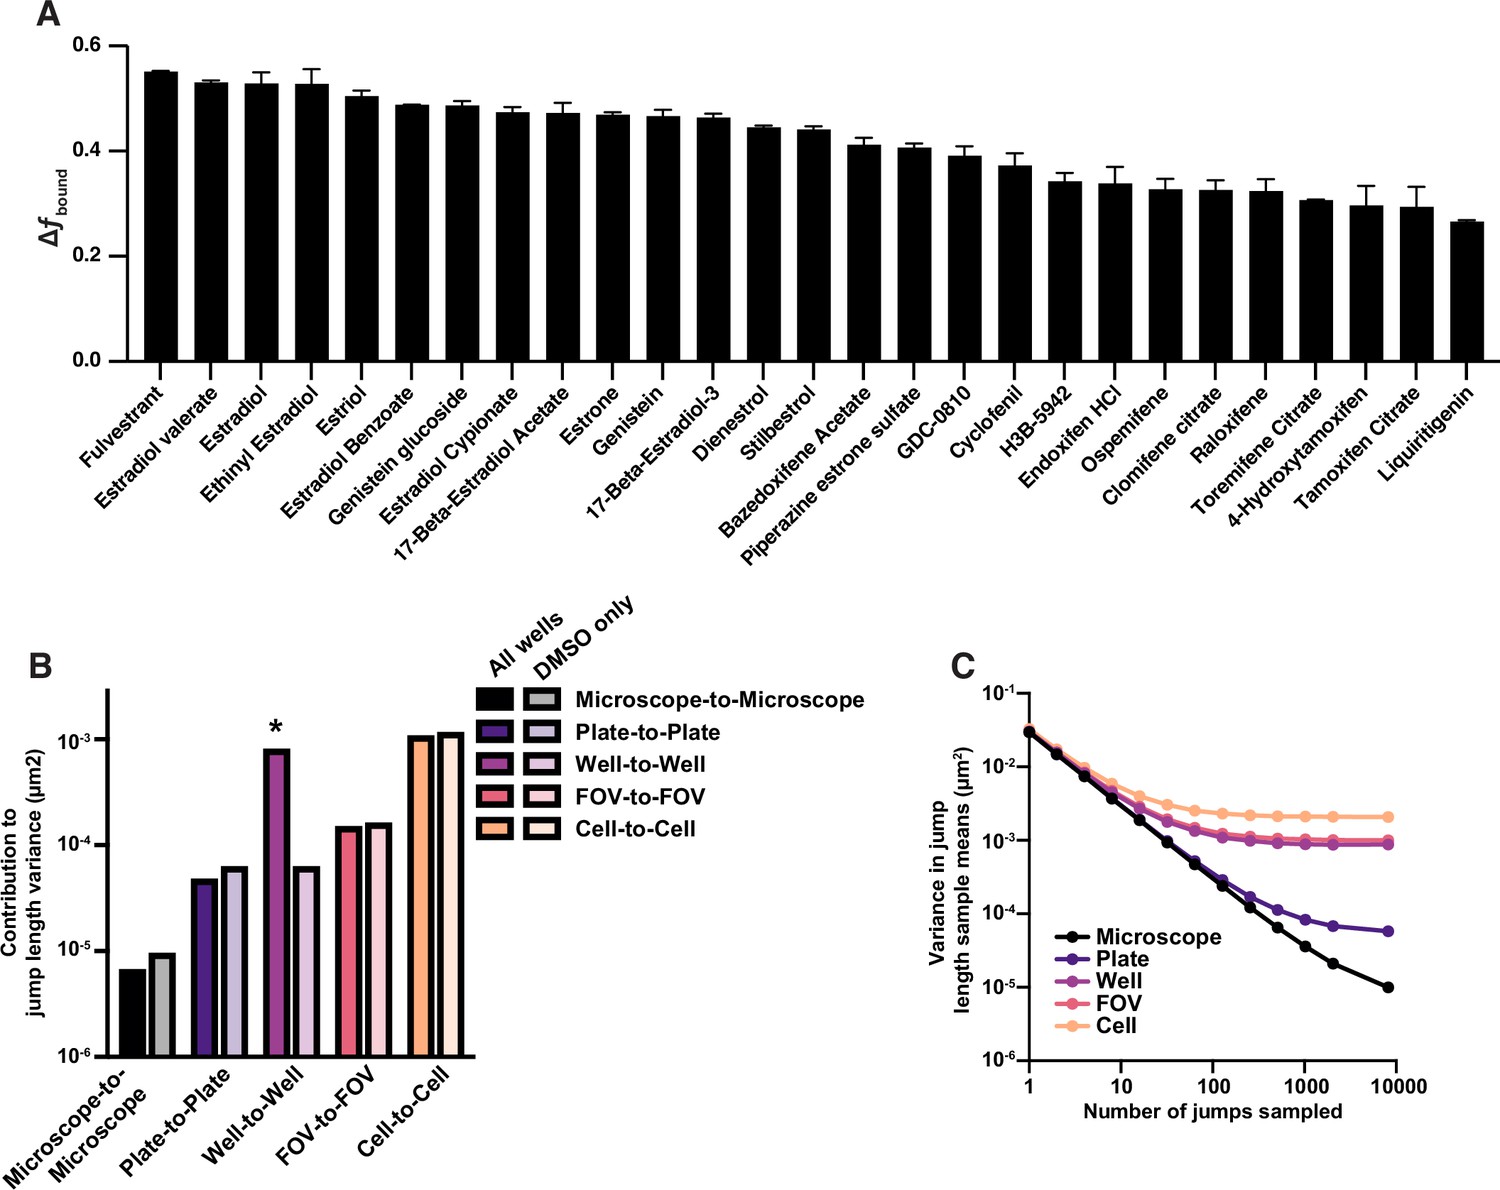
Contributions of different sources of variability of jump length in the high-throughput single-molecule tracking (htSMT) bioactive compound screen against ER.
(A) Change in fbound for 30 known estrogen receptor (ER) interaction molecules circled in (B), ordered by the magnitude of effect. Error bars are the SEM. (B) Variance in mean jump length after subsampling increasing numbers of jumps from the bioactive screen, resampling at different levels of aggregation (microscope, plate, well, etc.). Law of large numbers scaling would result in a line with slope –1, and deviations from linearity are the result of intrinsic sources of variance over microscopes, plates, etc. (C) Sources of variance attributed to differences between microscopes, plates, sample wells, fields of view (FOV), and cells. Solid bars are analyzed from all wells in the bioactive screen, half-tone bars are assessing DMSO wells only. The asterisk highlights the expected well-to-well variability introduced when assaying compounds.
Figure 3—figure supplement 4
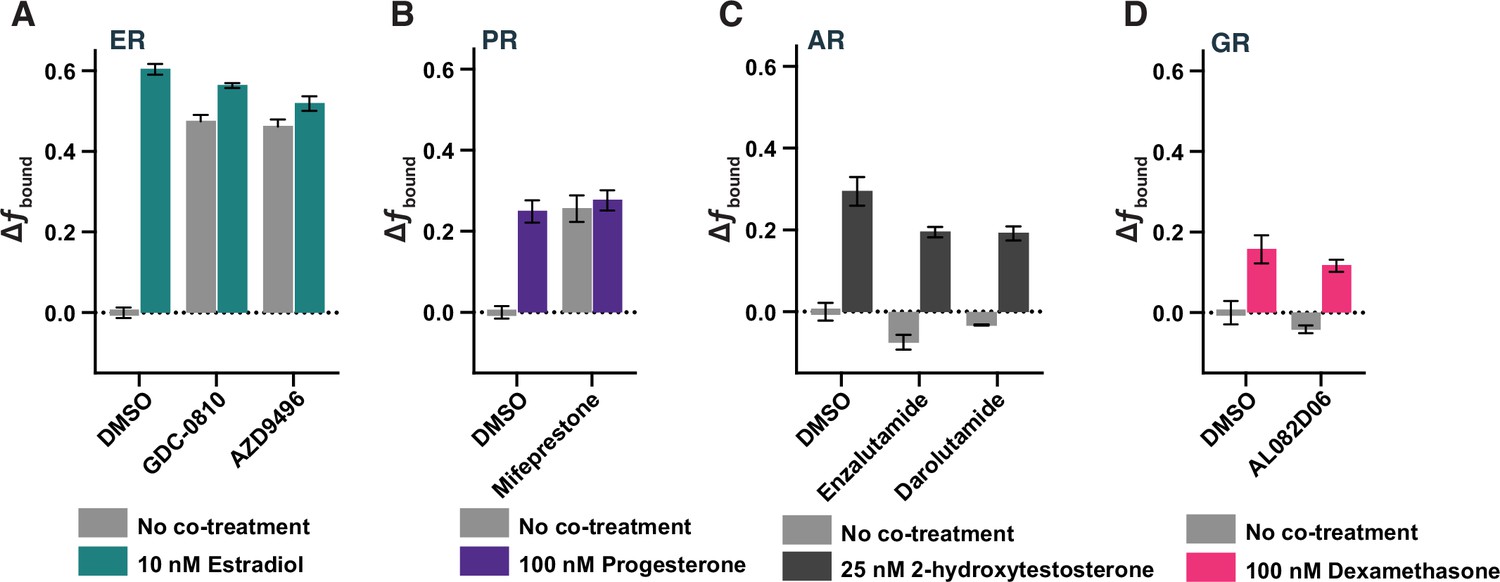
Antagonists of estrogen receptor (ER).
(A), progesterone receptor (PR) (B), androgen receptor (AR) (C), and glucocorticoid receptor (GR) (D) show distinct effects on target protein dynamics. Change in fbound after addition of 1 µM antagonist either in the absence or presence of the cognate agonist.
Figure 4 with 1 supplement
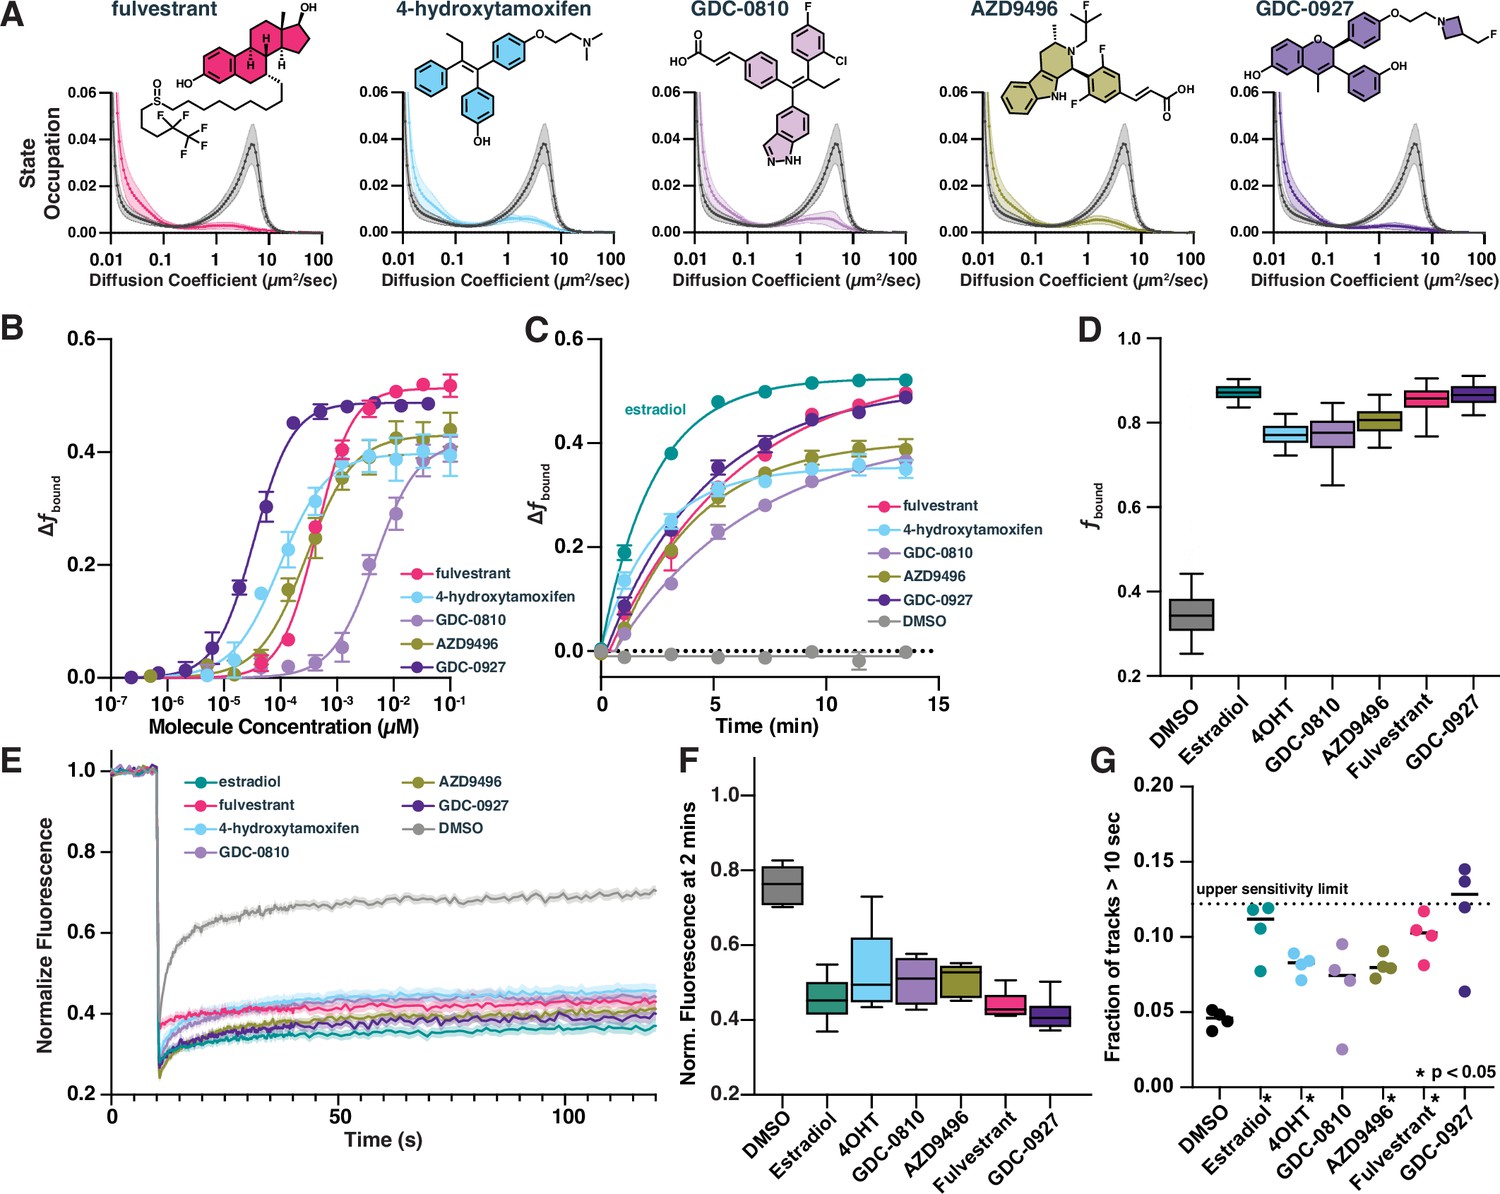
Selective estrogen receptor (ER) modulators and degraders induce DNA-binding measurable through high-throughput single-molecule tracking (htSMT).
(A) Diffusion state probability distribution for ER treated with 100 nM of exemplified selective ER modulators (SERMs) and selective ER degraders (SERDs). Each state distribution is generated from 10,000 randomly sampled nuclear trajectories per assay well. Shaded regions represent the SD. (B) Change in fbound as a function of a 12-point dose titration of fulvestrant (5), 4-hydroxytamoxifen (4-OHT) (6), GDC-0810 (8), AZD9496 (9), or GDC-0927 (10) with fitted curve. Compounds colored as in (A). Error bars represent the SEM across three biological replicates. (C) Change in fbound as a function of time after agonist or antagonist addition, fitted with a single exponential. Compounds colored as in (A). Estradiol (1, green) and DMSO added for comparison. Error bars represent SEM across three biological replicates. (D) Maximum effect of SERMs and SERDs on fbound. Each box represents quartiles while whiskers denote the 5–95th percentiles of single well measurements, measured over a minimum of 4 days with at least 8 wells per compound per day. (E) Fluorescence recovery after photobleaching (FRAP) of ER-Halo cells, treated either with DMSO alone or with 100 nM SERM/D. Curves are the mean ± SEM for 18–24 cells, colored as in (A). (F) Quantification of FRAP recovery curves to measure recovery 2 min after photobleaching. Whiskers denote the 5–95th percentiles of single cell measurements. (G) Quantification long-lived tracks, each point representing the fraction of trajectories greater than 10 s for a single biological replicate consisting of 3–10 wells per condition. Dashed line represents the median fraction of trajectories lasting longer than 10 s for Histone H2B-Halo, which is the upper limit of measurement sensitivity. * indicates sample with p < 0.05 as measured by t-test.
-
Figure 4—source data 1
Tabular data to generate plots from Figure 4 and related figure supplements.
- https://cdn.elifesciences.org/articles/93183/elife-93183-fig4-data1-v1.xlsx
Figure 4—figure supplement 1
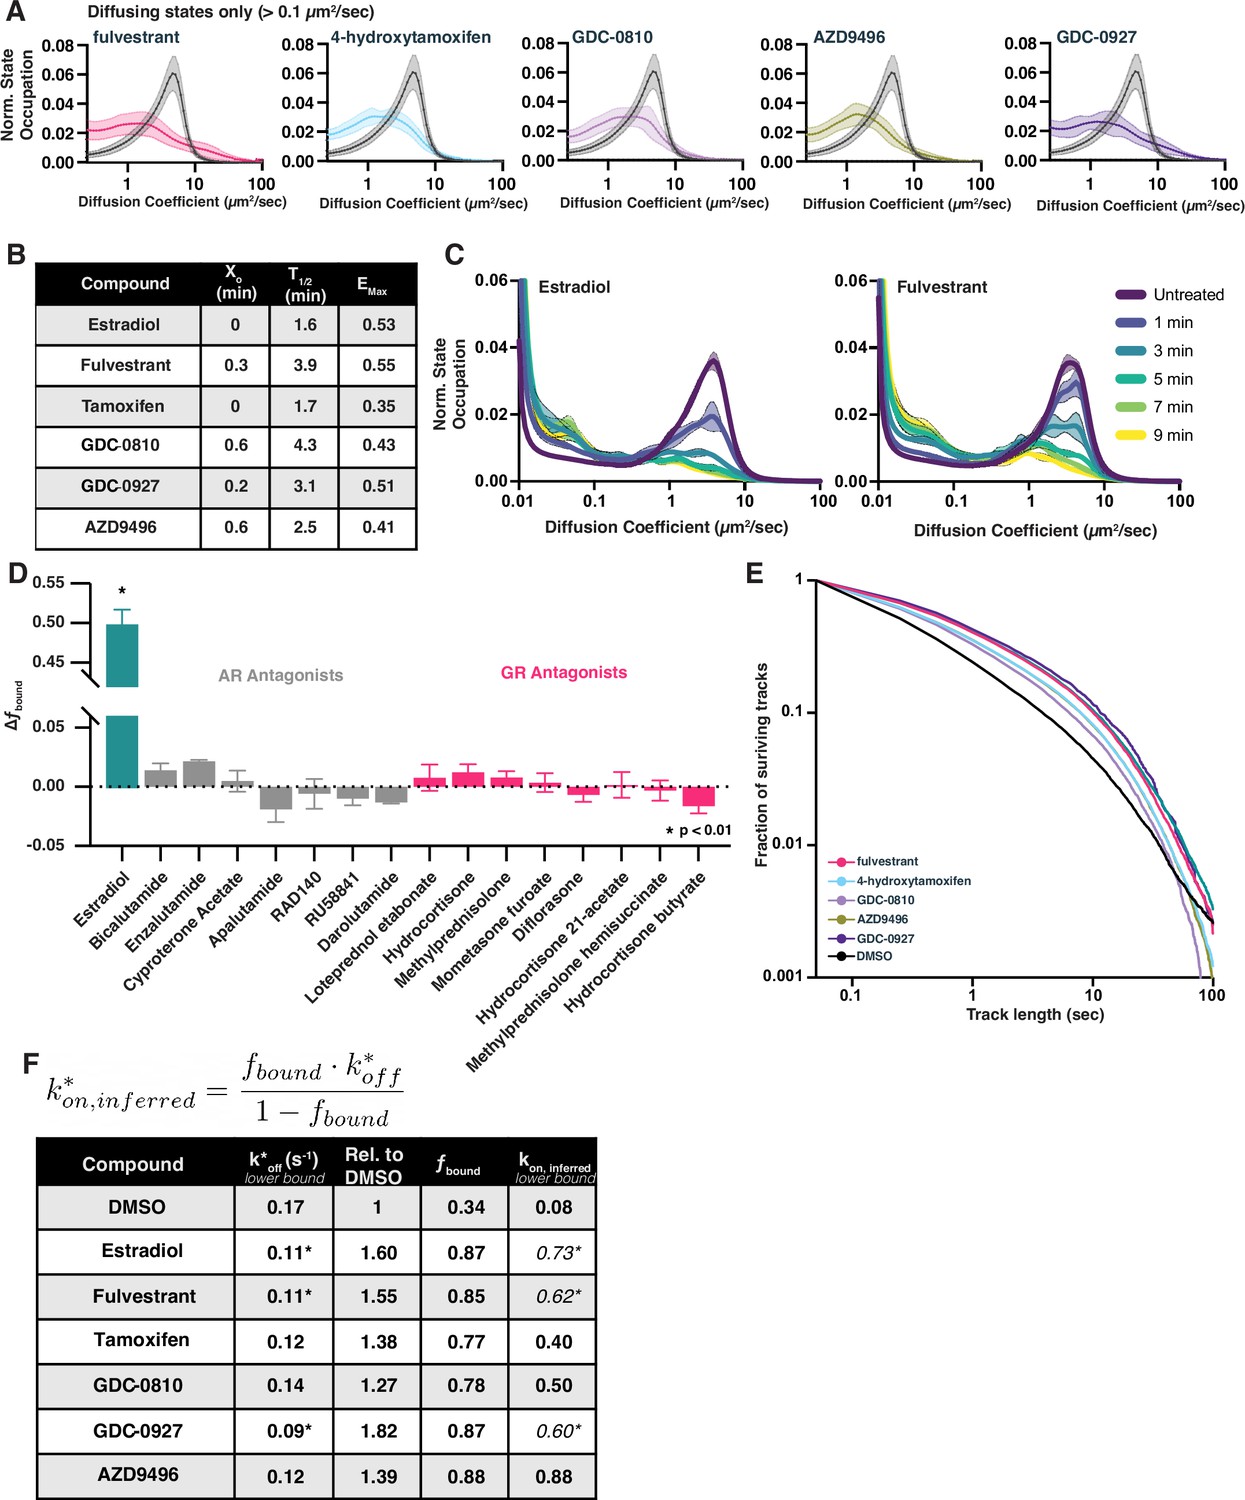
Selective estrogen receptor modulators (SERMs) and selective estrogen receptor degraders (SERDs) decrease free diffusion and increase fbound rapidly after addition.
(A) Normalized occupation of diffusive states (diffusion coefficient 0.2–100 µm2/s) for 100 nM SERD- or SERM-treated samples compared with DMSO. Histograms are normalized to integrate to 1. Shaded regions represent bin-wise standard deviations. Curves are the average of 3–4 biological replicates, with 8 well replicates per condition (>1200 cells total). (B) Results from a single-exponential association fit to the data in Figure 4C. (C) Change in diffusive state distribution as a function of time after compound addition for estradiol and fulvestrant. Each curve represents the mean of three biological replicates. Shaded regions are the bin-wise standard deviation. (D) Change in fbound of selective AR or glucocorticoid receptor (GR) antagonists from the bioactive screening set. (E) Track length survival curve of ER-Halo cells treated either with DMSO alone or with SERM/D. Track survival is plotted as the 1-CDF of the trajectory length distribution; faster decay means shorter binding times. (F) Table of results of the slow decay rate constant (kslow) from residence time SMT curve fits. Fits were performed on the aggregate of three biological replicates. Taken together with the fbound determined in (D), an upper limit of the inferred kon can be calculated from the equation assuming all bound molecules will have k*off = kslow. Cells marked with an asterisk are ones in which kslow could not reliably be distinguished from photobleaching.
Figure 5 with 1 supplement
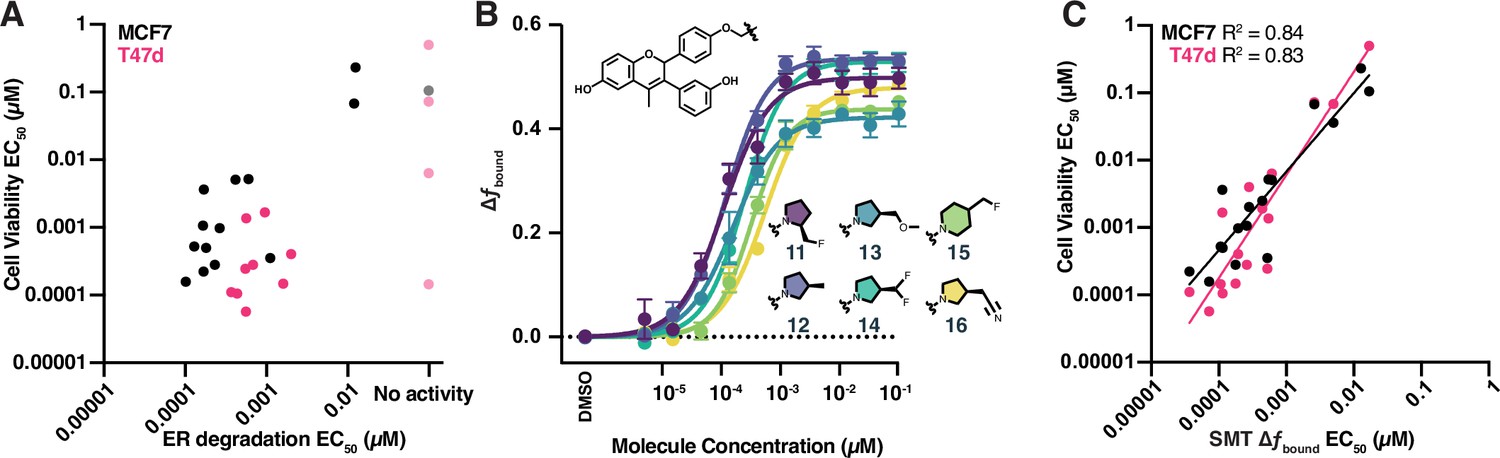
High-throughput single-molecule tracking (htSMT) can be used to determine chemical structure–activity relationships.
(A) Correlation of potency measured by estrogen receptor (ER) degradation and cell proliferation in MCF7 cells (black) and T47d cells (magenta) for compounds in the GDC-0927 structural series. Cell proliferation and ER degradation-derived potencies are the mean of four and three biological replicates, respectively. (B) Change in fbound across a 12-point dose titration of compounds 11 through 16, colored by structure. Points are the mean ± SEM across three biological replicates. (C) Correlation of potency measured by change in fbound and cell proliferation in MCF7 cells (black) and T47d cells (magenta) for compounds in the GDC-0927 structural series. Cell proliferation and SMT-derived potencies are the mean of four and three biological replicates, respectively.
-
Figure 5—source data 1
PDF report of western blot produced by Jess system (Protein Simple).
- https://cdn.elifesciences.org/articles/93183/elife-93183-fig5-data1-v1.zip
-
Figure 5—source data 2
TIFF versions of the images in Figure 5.
- https://cdn.elifesciences.org/articles/93183/elife-93183-fig5-data2-v1.csv
-
Figure 5—source data 3
Images to generate plots from Figure 5 and related figure supplements.
- https://cdn.elifesciences.org/articles/93183/elife-93183-fig5-data3-v1.zip
-
Figure 5—source data 4
Tabular data to generate plots from Figure 5 and related figure supplements.
- https://cdn.elifesciences.org/articles/93183/elife-93183-fig5-data4-v1.xlsx
Figure 5—figure supplement 1
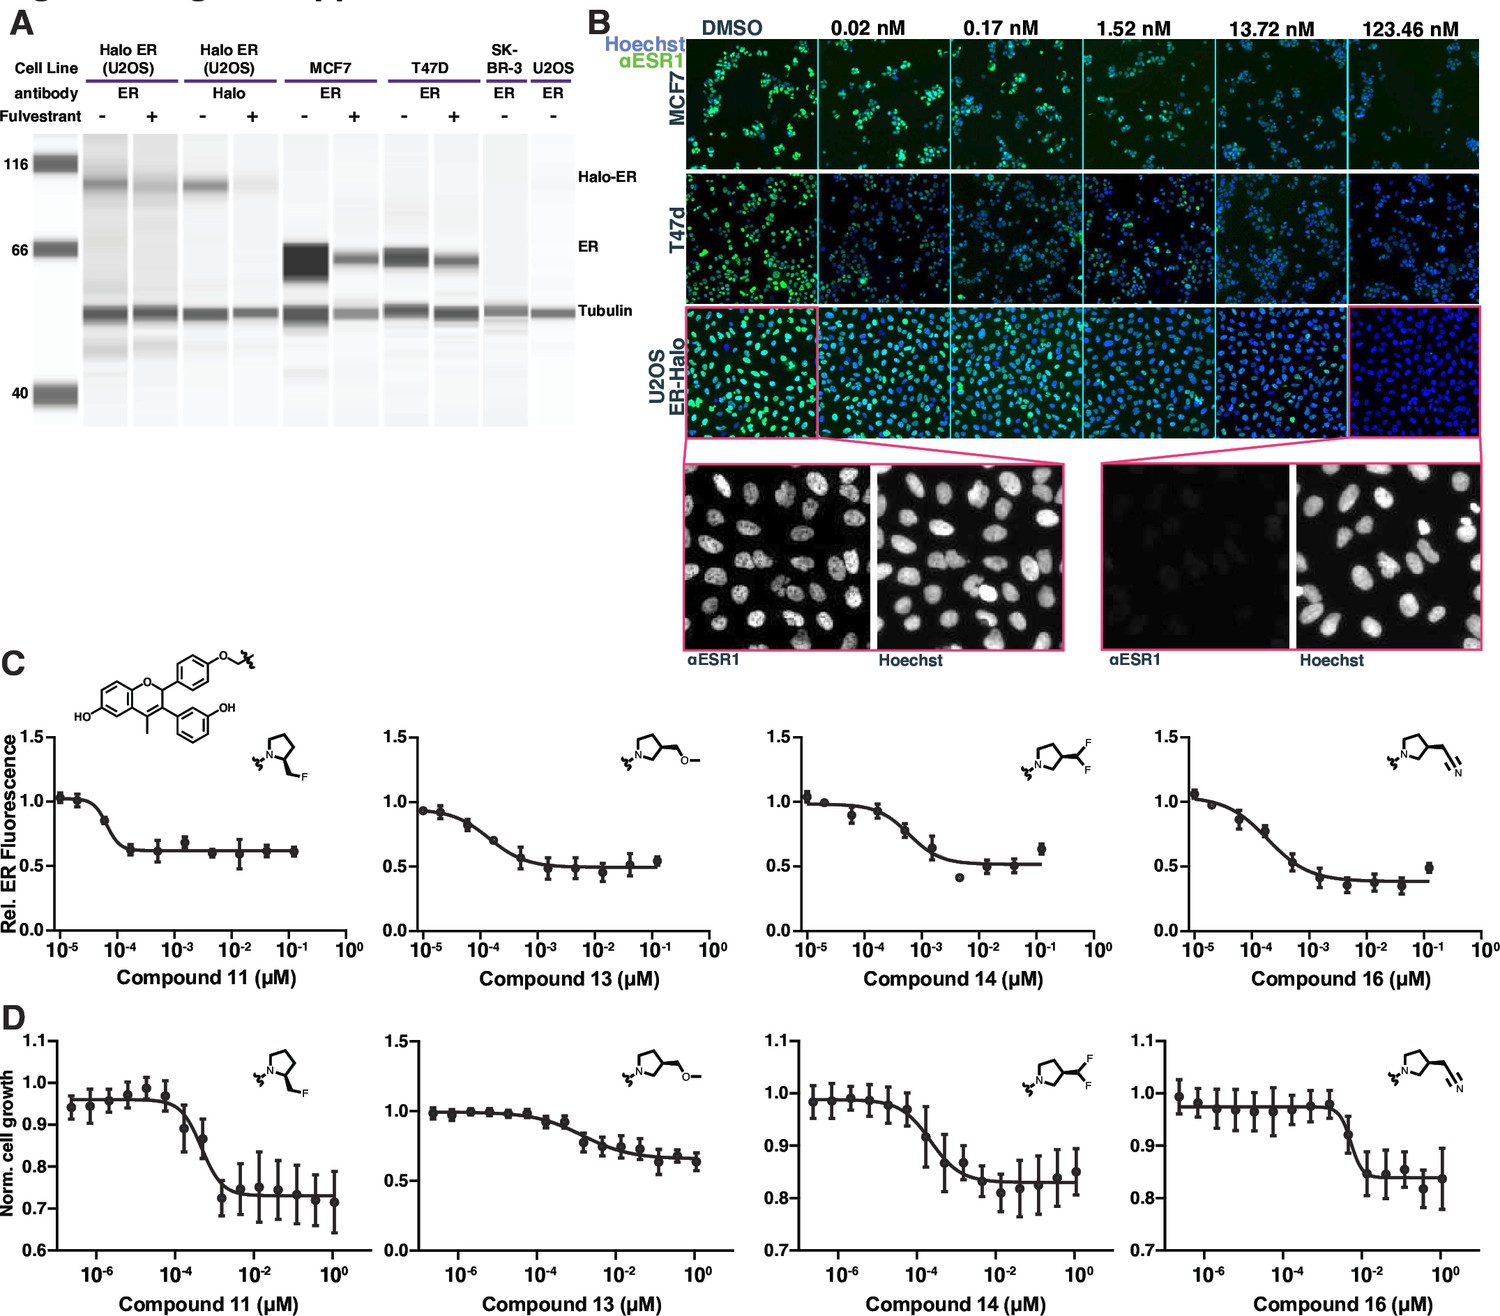
GDC-0927 structural variants characterized by estrogen receptorER degradation or cell proliferation assays.
(A) Western blot of the ER-expressing breast cancer cell lines MCF7 and T47d compared to ER expression in ER-null lines SK-BR-3 or U2OS. Samples were treated with fulvestrant for 24 hr prior to lysis. Fulvestrant treatment leads to the degradation of ER, even when fused to HaloTag. (B) Example of GDC-0927-induced degradation of ER in different cell lines measured by immunofluorescence against ER. Cells were exposed to compound for 24 hr prior to fixation. Image pixel intensities are equivalently scaled. (C) Example compound dose titrations showing change in mean nuclear intensity as a function of compound concentration. (D) Example compound dose titrations measuring cell proliferation, normalized to DMSO-treated cells, of cells treated with analogs of GDC-0927.
Figure 6 with 3 supplements
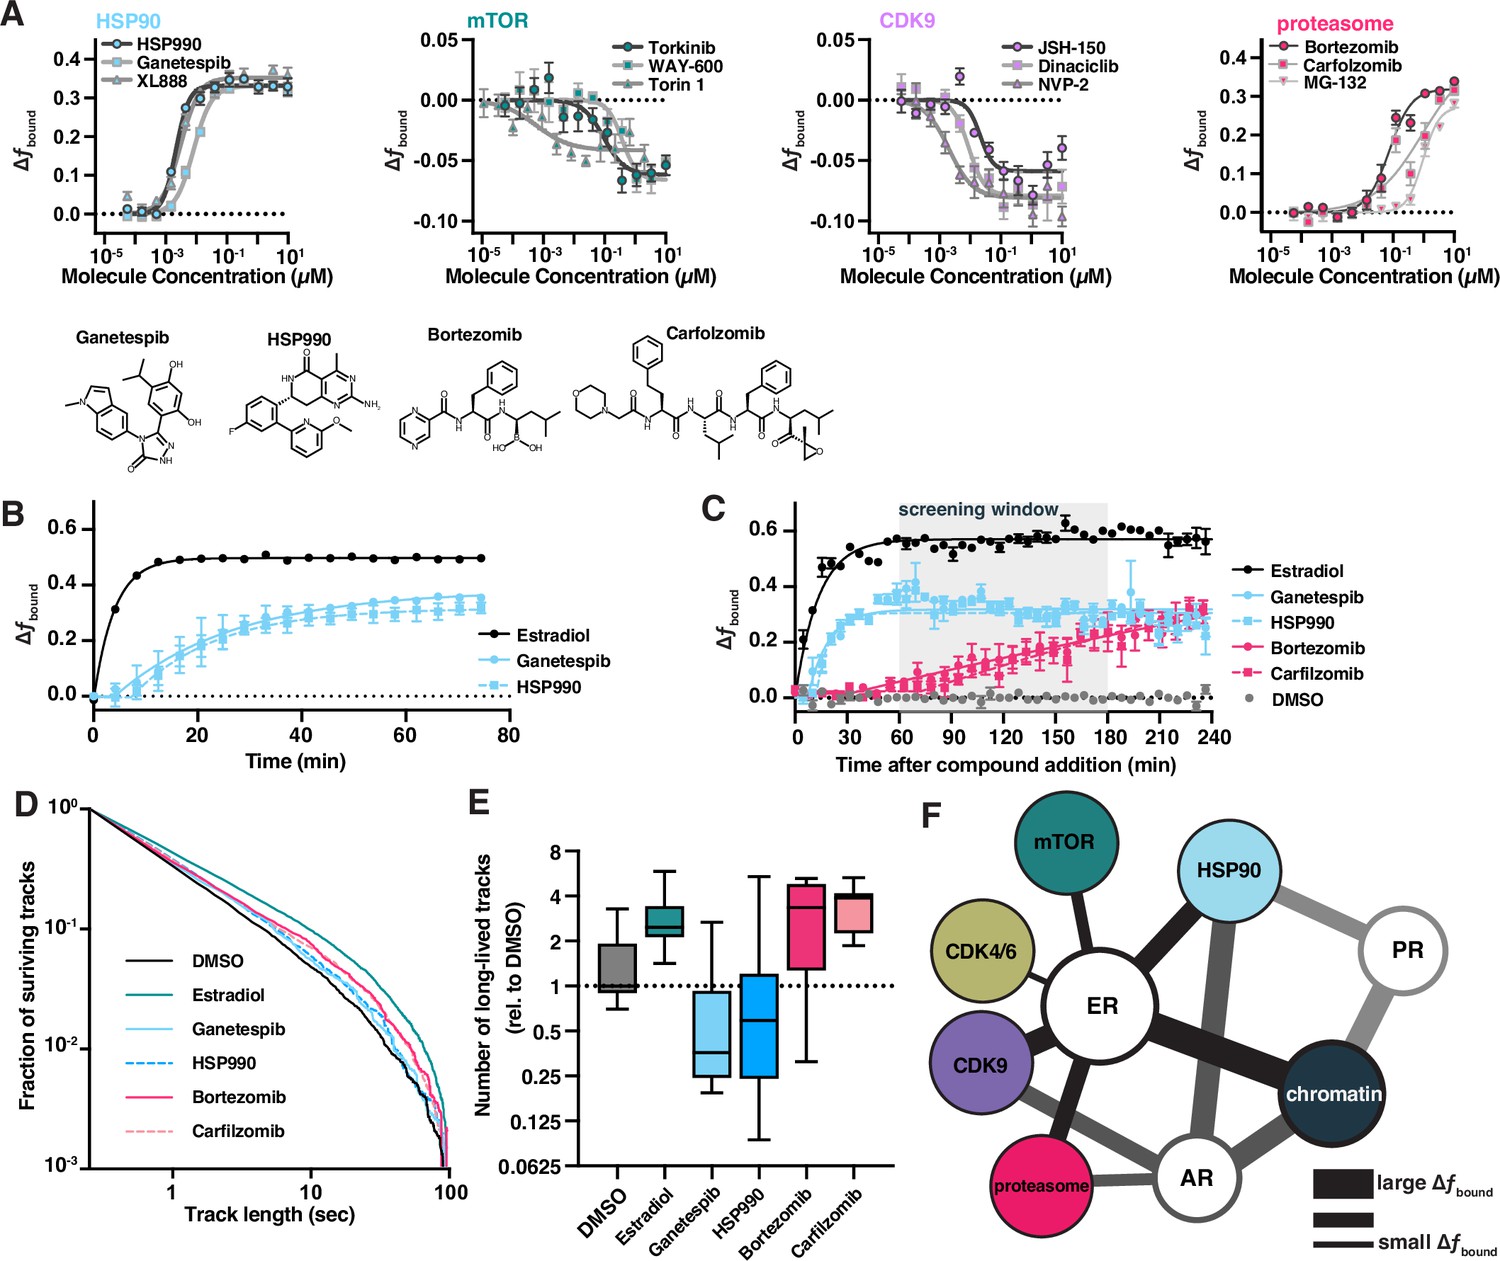
Bioactive molecules targeting pathways associated with estrogen receptor (ER) affect its dynamics.
(A) Bioactive screen results with select inhibitors grouped and uniquely colored by pathway. Change in fbound across a 12-point dose titration of three representative compounds targeting each of HSP90, mTOR, CDK9, and the proteasome. Individual molecules are denoted by specific shapes. Error bars represent SEM across three biological replicates. (B) Change in fbound as a function of time after compound addition. Estradiol treatment (black) is compared to ganetespib (blue circles) and HSP990 (blue squares). Points are bins of 4 min. Error bars represent SEM across three biological replicates. (C) Change in fbound as a function of time after compound addition. Estradiol treatment (black) is compared to HSP90 inhibitors ganetespib (blue circles) and HSP990 (blue squares); proteasome inhibitors bortezomib (red circles) and carfilzomib (red squares). Points are bins of 7.5 min of high-throughput single-molecule tracking (htSMT) data, marking the mean ± SEM. The shaded region denotes the window of time used during htSMT screening. (D) Track length survival curve of ER-Halo cells treated either with DMSO alone, with estradiol stimulation, or with 100 nM HSP90 or proteasome inhibition. Track survival is plotted as the 1-CDF of the track length distribution; faster decay means shorter binding times. (E) Quantification of the number of long-lived trajectories as a function of treatment condition. All conditions were normalized to the median number of trajectories in DMSO. (F) Diagram summarizing pathway interactions based on htSMT results for ER, AR, and PR.
-
Figure 6—source data 1
Tabular data to generate plots from Figure 6 and related figure supplements.
- https://cdn.elifesciences.org/articles/93183/elife-93183-fig6-data1-v1.xlsx
Figure 6—figure supplement 1
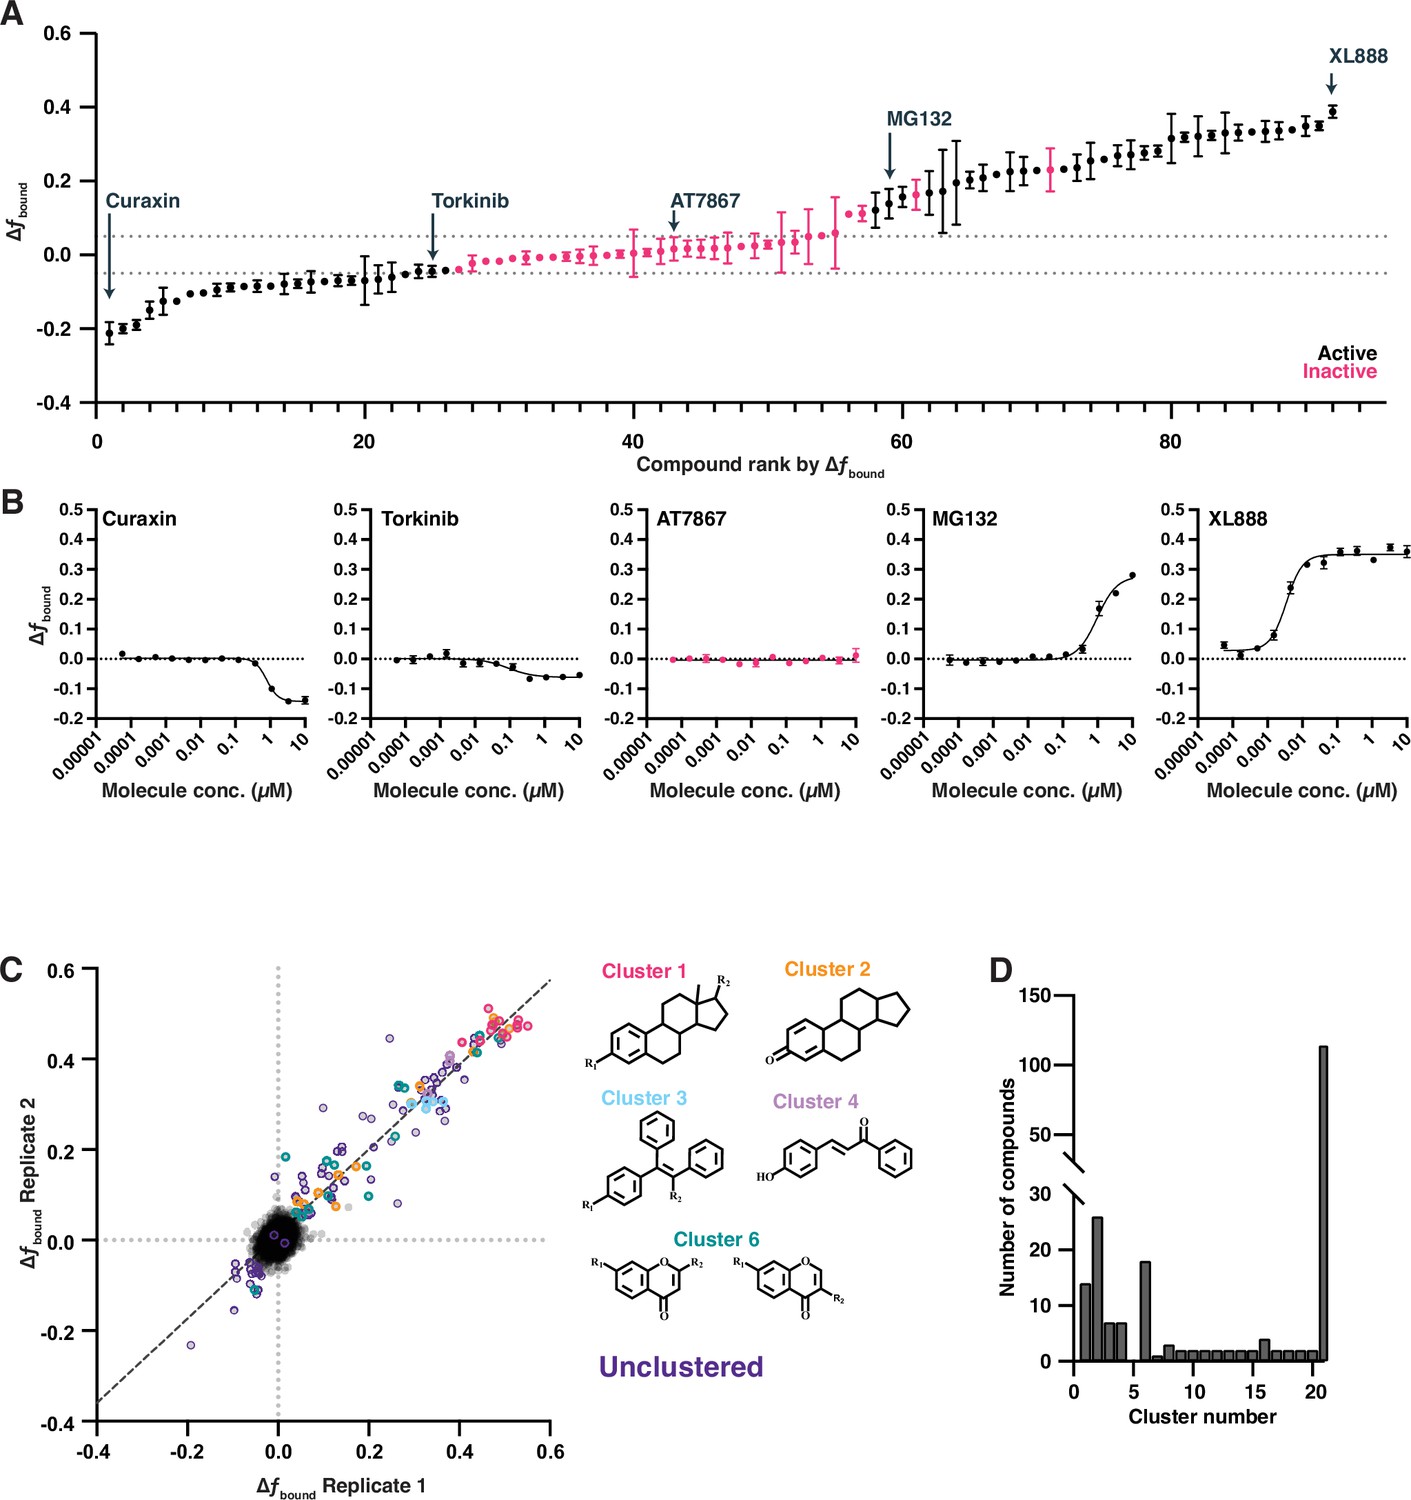
Deeper investigation of bioactive screening data identifies cutoff for active molecules.
(A) Examples of compound effects on estrogen receptor (ER) fbound from a dose titration experiment. Ninety-two compounds from the primary screen are ranked based on the magnitude of their effect. Compounds colored in black repeatably showed dose-dependent changes; magenta compounds were inactive in a dose titration. (B) Example dose titration of compounds of increasing overall change in ER fbound. (C) Two replicates of the bioactive screen as in Figure 3. Active compounds are colored based on structural scaffold. (D) A quantification of the number of compounds associated with any given cluster. Singletons (cluster 21) represent the majority of active compounds.
Figure 6—figure supplement 2
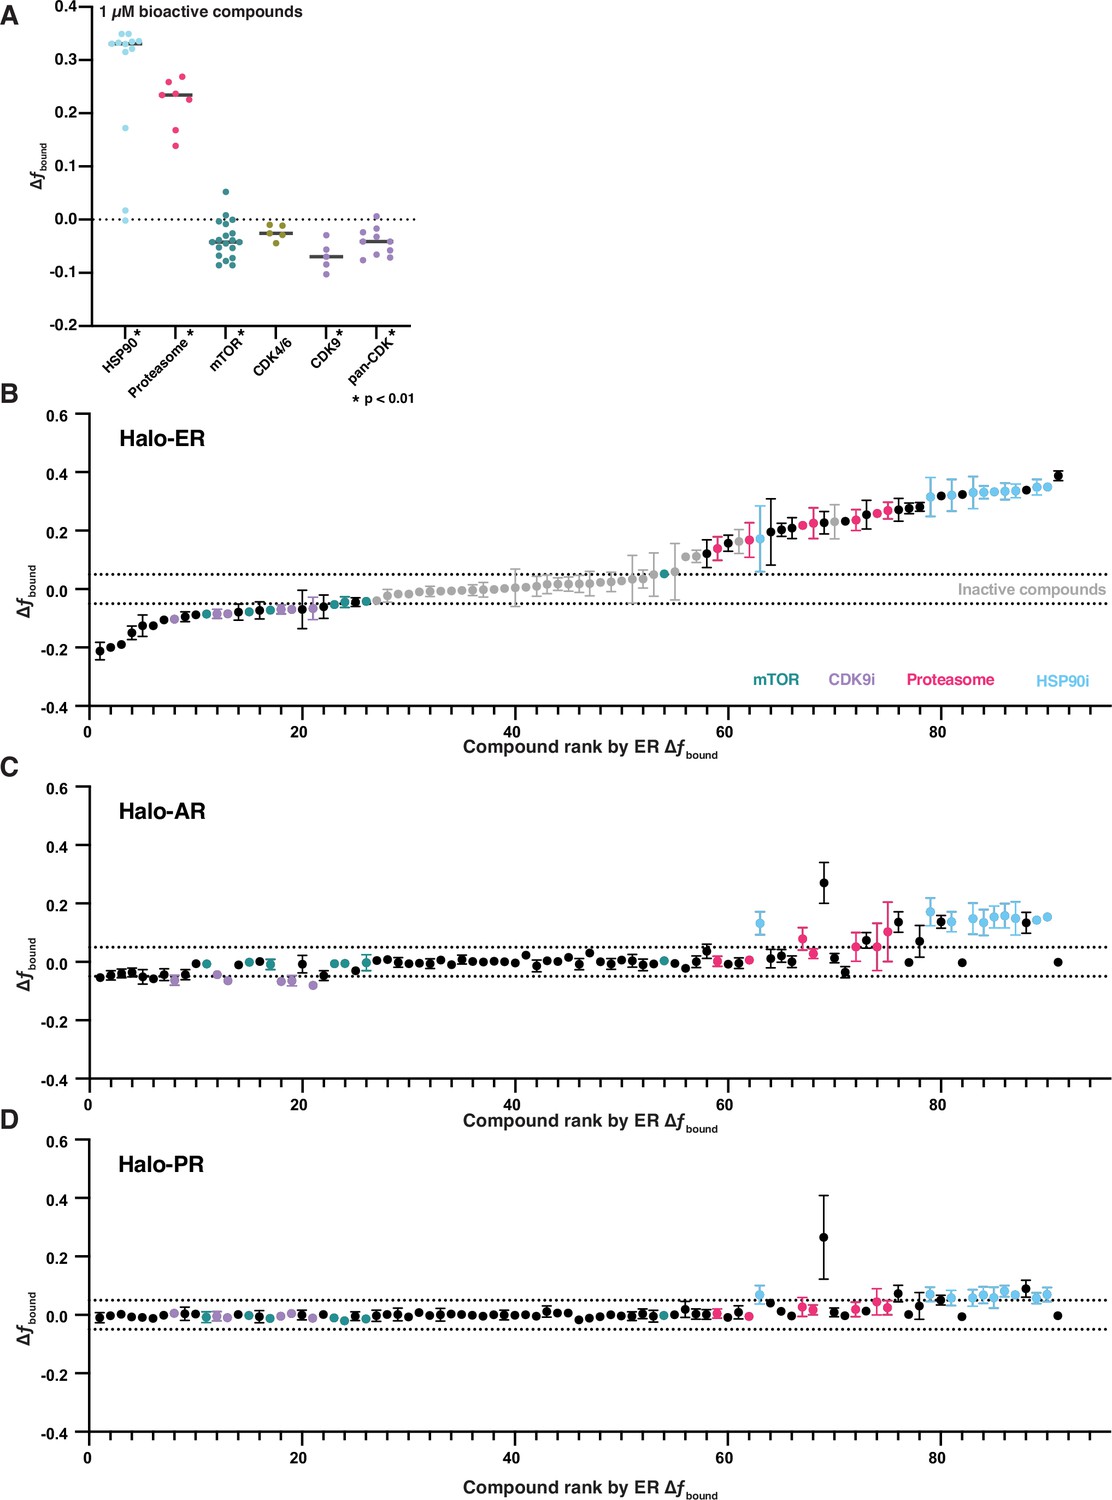
Some pathway inhibitors modulating estrogen receptor (ER) dynamics are specific to ER.
(A) Change in fbound of ER following treatment with inhibitors of HSP90, the proteasome, mTOR, and cyclin-dependent kinase (CDK) from the initial bioactive screen. CDK inhibitors were further stratified into CDK4/6 inhibitors, CDK9 inhibitors, or inhibitors without strong selectivity for a particular family (pan-CDK). Line represents the median for each target. * indicates sample with p < 0.05 as measured by t-test. (B) Change in fbound of ER for 97 bioactive molecules, colored by their pathway annotation. Compounds are plotted in their rank order based on their effect in ER. Error bars are the SEM of three biological replicates. (C) Change in fbound of AR for the same molecules from (B). Compounds are plotted in their rank order based on their effect in ER. Error bars are the SEM of three biological replicates. (D) Change in fbound of progesterone receptor (PR) for the same molecules from (B). Compounds are plotted in their rank order based on their effect in ER. Error bars are the SEM of three biological replicates.
Figure 6—figure supplement 3

Dose titration plots of ER(S104A/S106A/S118A) with mTOR and CDK9 compounds.
Each point represents the mean and SEM of three biological replicates.
Videos
Video 1
Example field of view of single-molecule tracking (SMT) from Halo-ER cells.
Video is played back at 10 frames per second, 10× slower than real time.
Video 2
Example field of view of single-molecule tracking (SMT) from Halo-ER cells treated with 25 nM estradiol for 1 hr prior to imaging.
Video is played back at 10 frames per second, 10× slower than real time.
Additional files
Download links
A two-part list of links to download the article, or parts of the article, in various formats.
Downloads (link to download the article as PDF)
Open citations (links to open the citations from this article in various online reference manager services)
Cite this article (links to download the citations from this article in formats compatible with various reference manager tools)
A high-throughput platform for single-molecule tracking identifies drug interaction and cellular mechanisms
eLife 12:RP93183.
https://doi.org/10.7554/eLife.93183.3


