Refining the resolution of the yeast genotype–phenotype map using single-cell RNA-sequencing
- Department of Cell and Systems Biology, University of Toronto, Ramsay Wright Laboratories, Canada
- Department of Biology, University of Toronto at Mississauga, Canada
- Department of Molecular Genetics, University of Toronto, Canada
- Donnelly Centre for Cellular and Biomolecular Research, University of Toronto, Canada
Figures
Figure 1 with 3 supplements
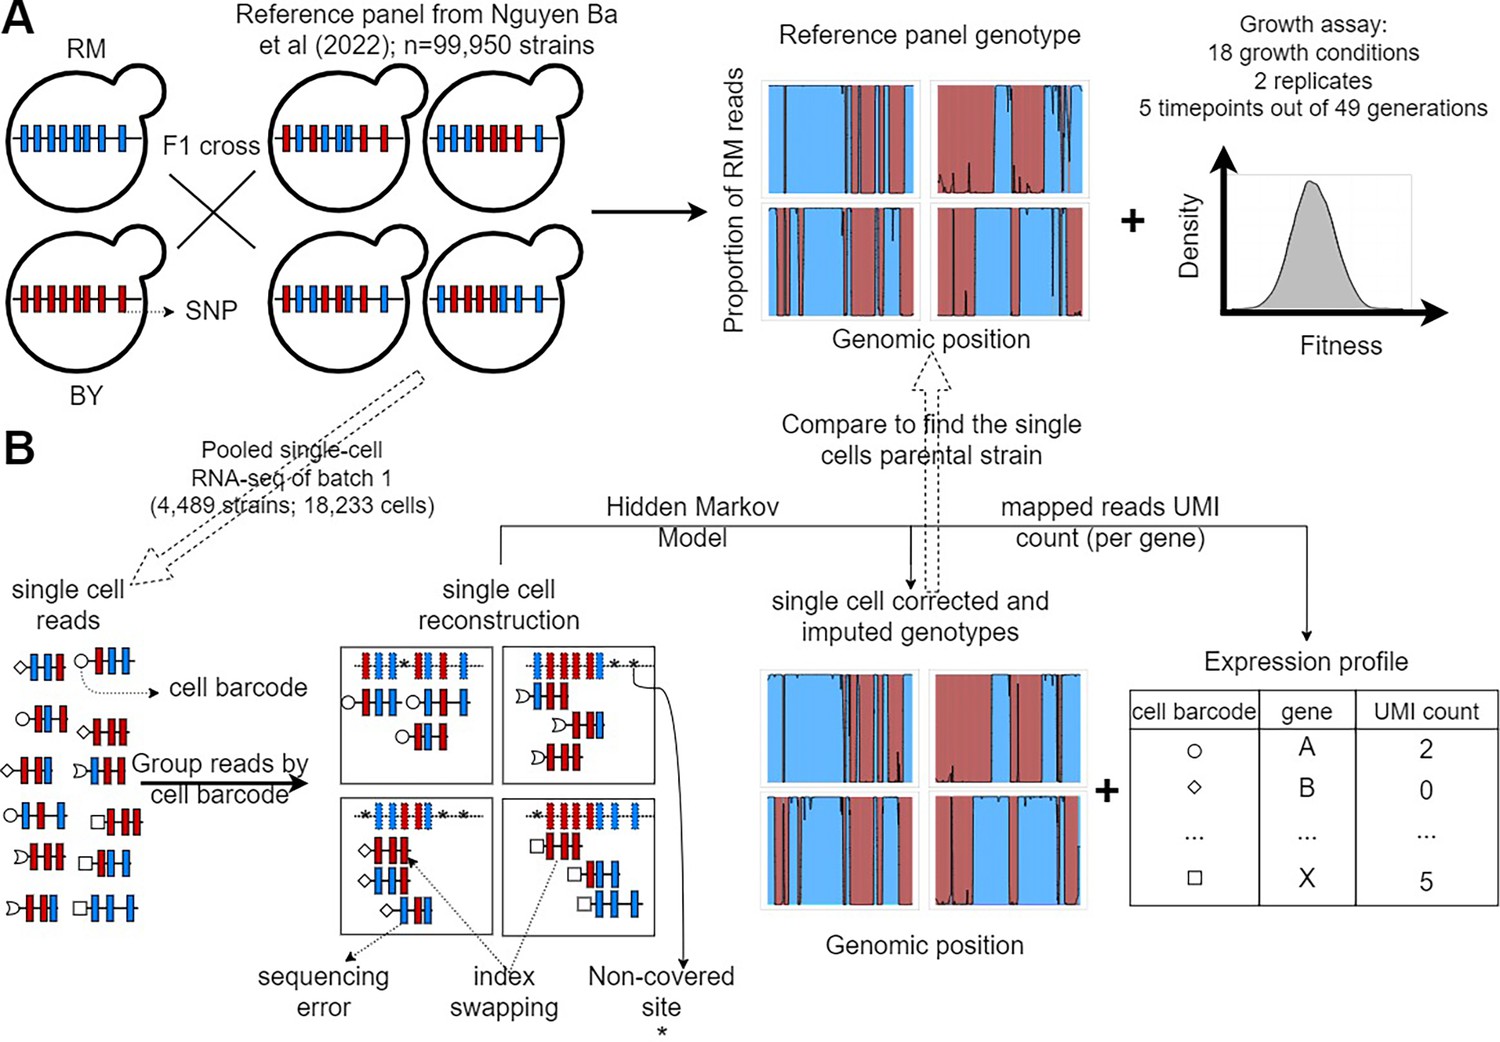
F2 yeast segregants datasets.
(A) Reference panel and experiments from the barcoded bulk sequencing previously described in Nguyen Ba et al., 2022. The 99,995 F2 yeast segregants in the reference panel were derived from an F1 cross between a laboratory strain of yeast (BY) and a natural vineyard strain (RM). Thus, they only have two possible alleles at each of the 41,594 polymorphic sites. The lineage barcodes enabled fitness estimation from competition assays in 18 environments recapitulating the adaptation to temperature gradients, the ability to process different sources of carbon and the resistance to antifungal compounds. (B) Pooled scRNA-seq dataset from a single batch. We performed scRNA-seq of the first batch of F2 segregants (n=4489) to obtain genotypes that are similar to the reference panel and cell’s expression profiles. The F2 segregant barcodes are typically not expressed, so single cells have their own cell barcode, which is included in all amplified reads of the same droplet. Non-covered sites, sequencing errors, and the presence of reads in the wrong library (index swapping) are corrected for using the Hidden Markov Models (HMM) described in Figure 1—figure supplement 1. Each single-cell barcode association to a reference panel strain is validated using a permutation test (Figure 1—figure supplement 2), and poor association was assessed using regression (Figure 1—figure supplement 3).
Figure 1—figure supplement 1
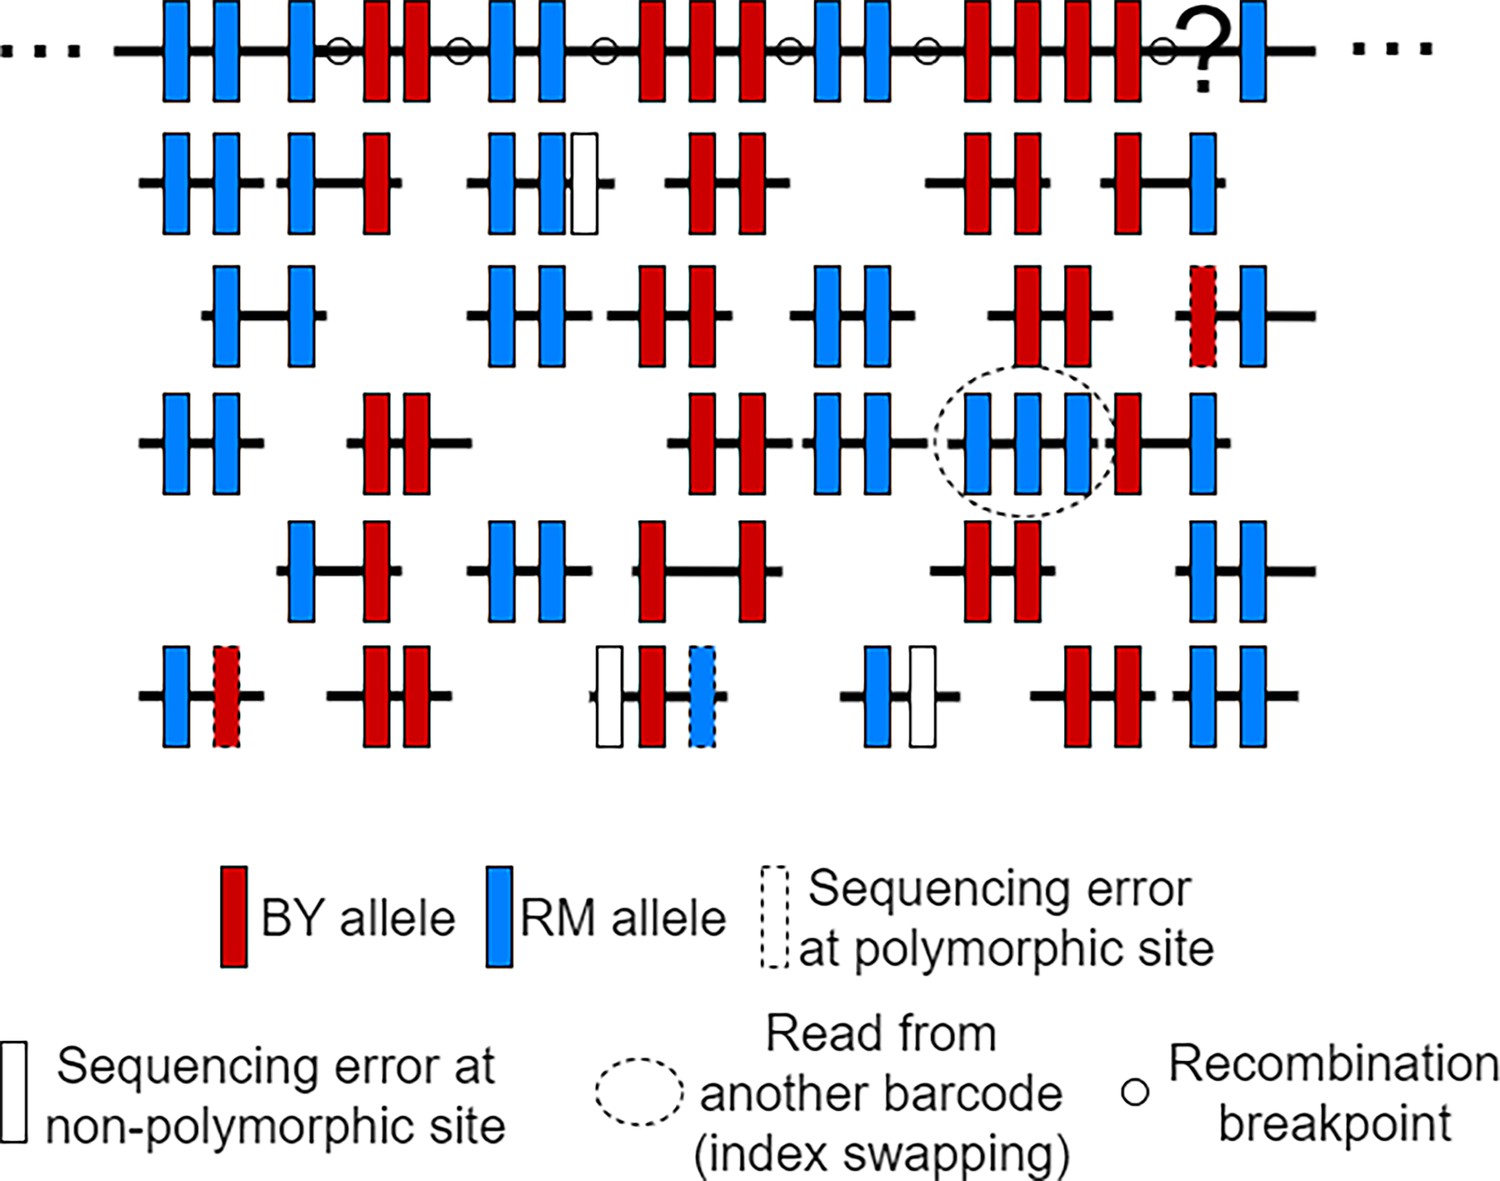
Illustration of scRNA-seq reads used to estimate the Hidden Markov Models (HMM) error rate parameters.
Reads from a single cell are being mapped to the RM parent reference sequence to obtain a reconstructed genome, that is, the large black-filled rectangle at the top. The polymorphic sites represented on the reconstructed sequence either represent the RM allele (blue rectangle) or the BY allele (red rectangle). Although it is not possible to distinguish true sequencing errors at polymorphic sites (dashed line rectangle) from true mutations observed at a low frequency in a population, the sequencing error rate can be inferred by counting the proportion of non-polymorphic sites being mutated in the reads (white-filled rectangle). As for the rates at which reads come from other cells (index swapping), it can be inferred by the number of reads with at least two mismatches, that is, a different allele than the rest of the reads mapping at common sites. After inferring the error rates, we can use the HMM to infer the most likely genotypes at each polymorphic site, for example, the interrogation point is probably a RM allele as supported by the reads.
Figure 1—figure supplement 2
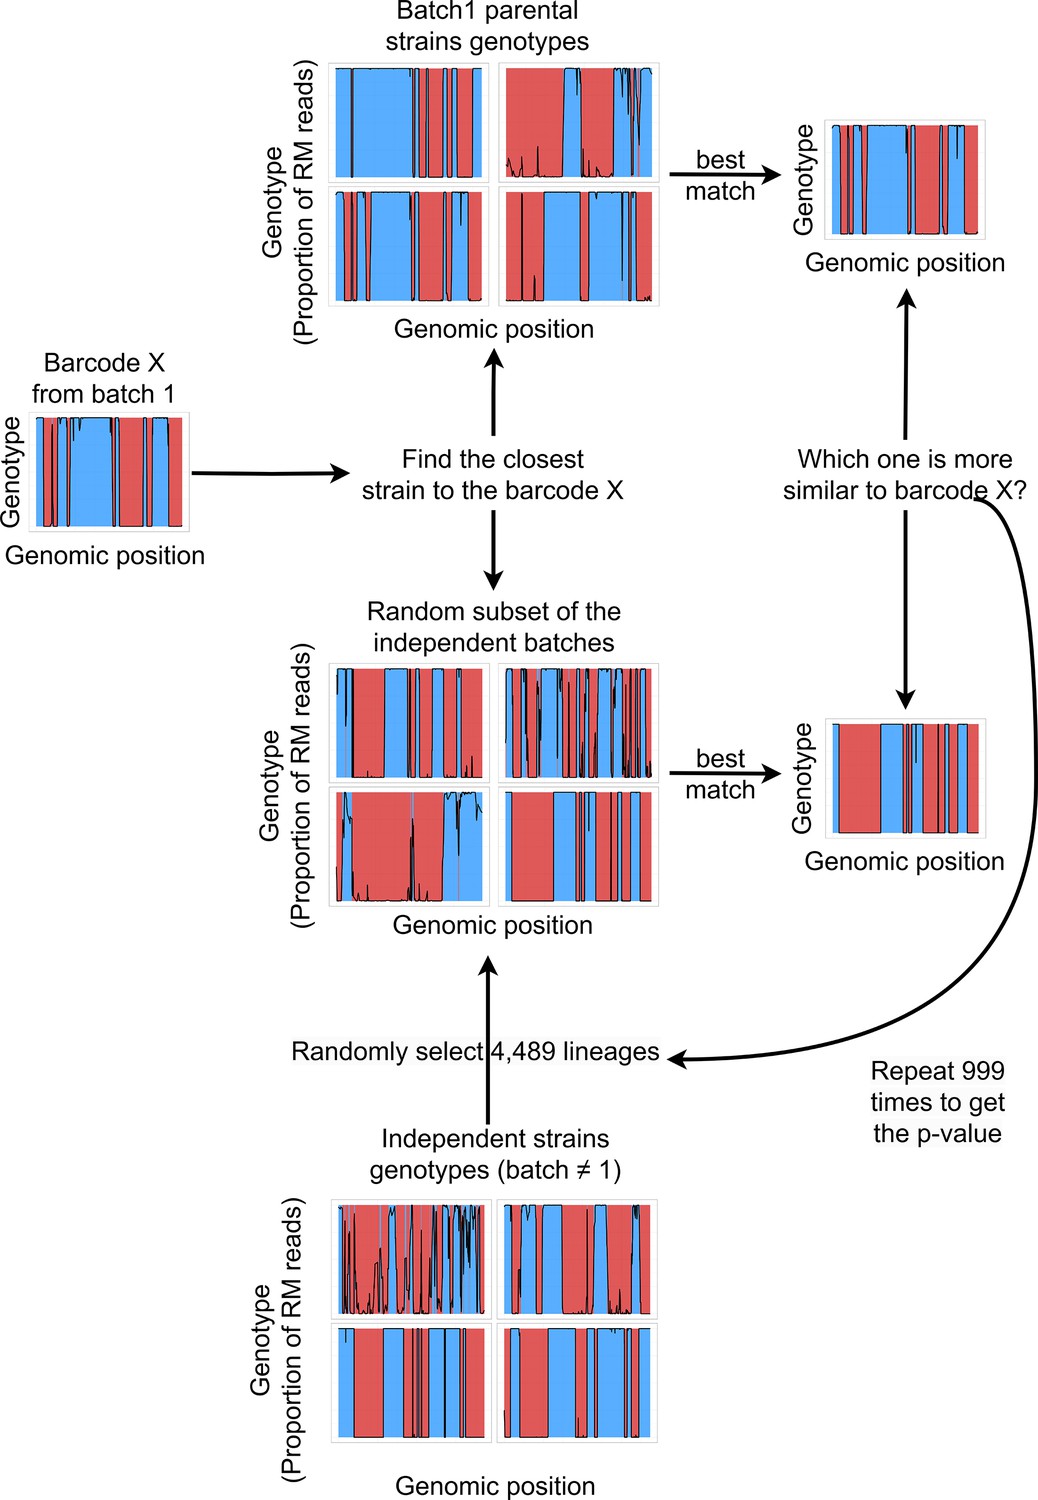
Barcodes lineage assignment.
For every single cell barcode, the closest lineages in the batch 1 and in a random batch of the same size are selected based on the minimal expected distance. The random batch is generated by pooling 4,489 random lineages from the 22 batches that are independent from batch 1. Next, the distance between the barcode genotype and its best match in batch 1 is compared to the distance with the best match in the random batch. This procedure was repeated 999 times, and the p-value was then estimated by the proportion of random subsamples from other batches that contained a better match to the single cell genotype than batch 1.
Figure 1—figure supplement 3
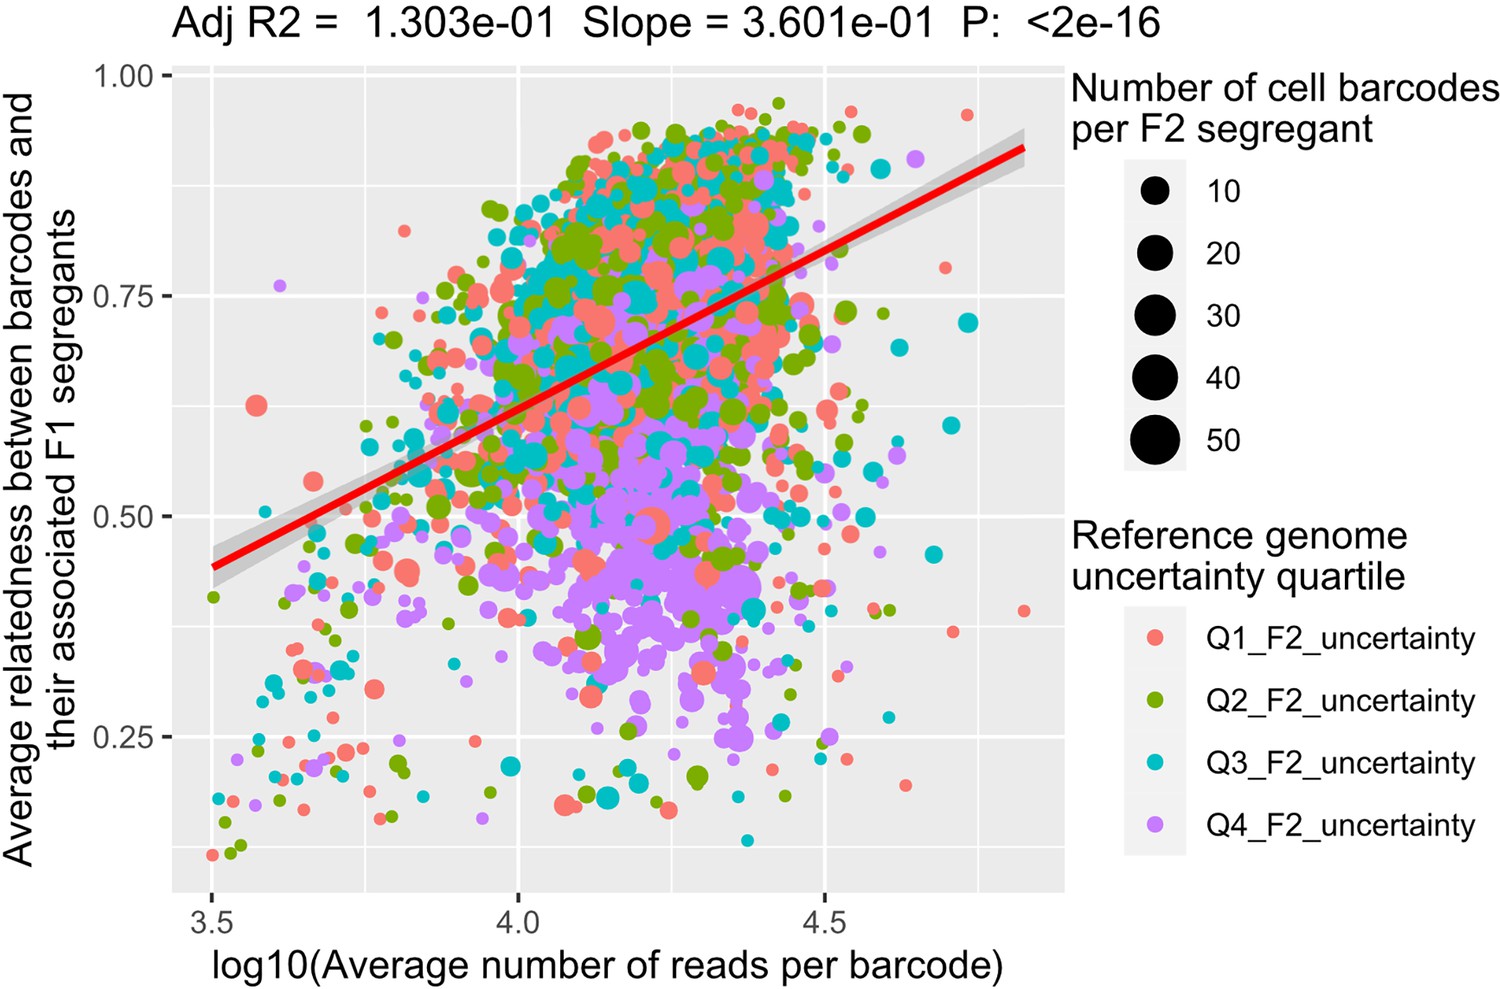
Factors explaining the relatedness between scRNA-seq barcodes and their associated F2 segregant.
The relatedness between the barcodes and the F2 segregant is measured with the adjusted R2 between the genotypes. The linear regression model is performed after a log10-transformation of the coverage (number of reads per barcode). Each dot represents an F2 segregant. The number of scRNA-seq barcodes associated to each segregant is represented by the dot size while its color represents the quartile of the F2 segregant genome uncertainty.
Figure 2 with 3 supplements
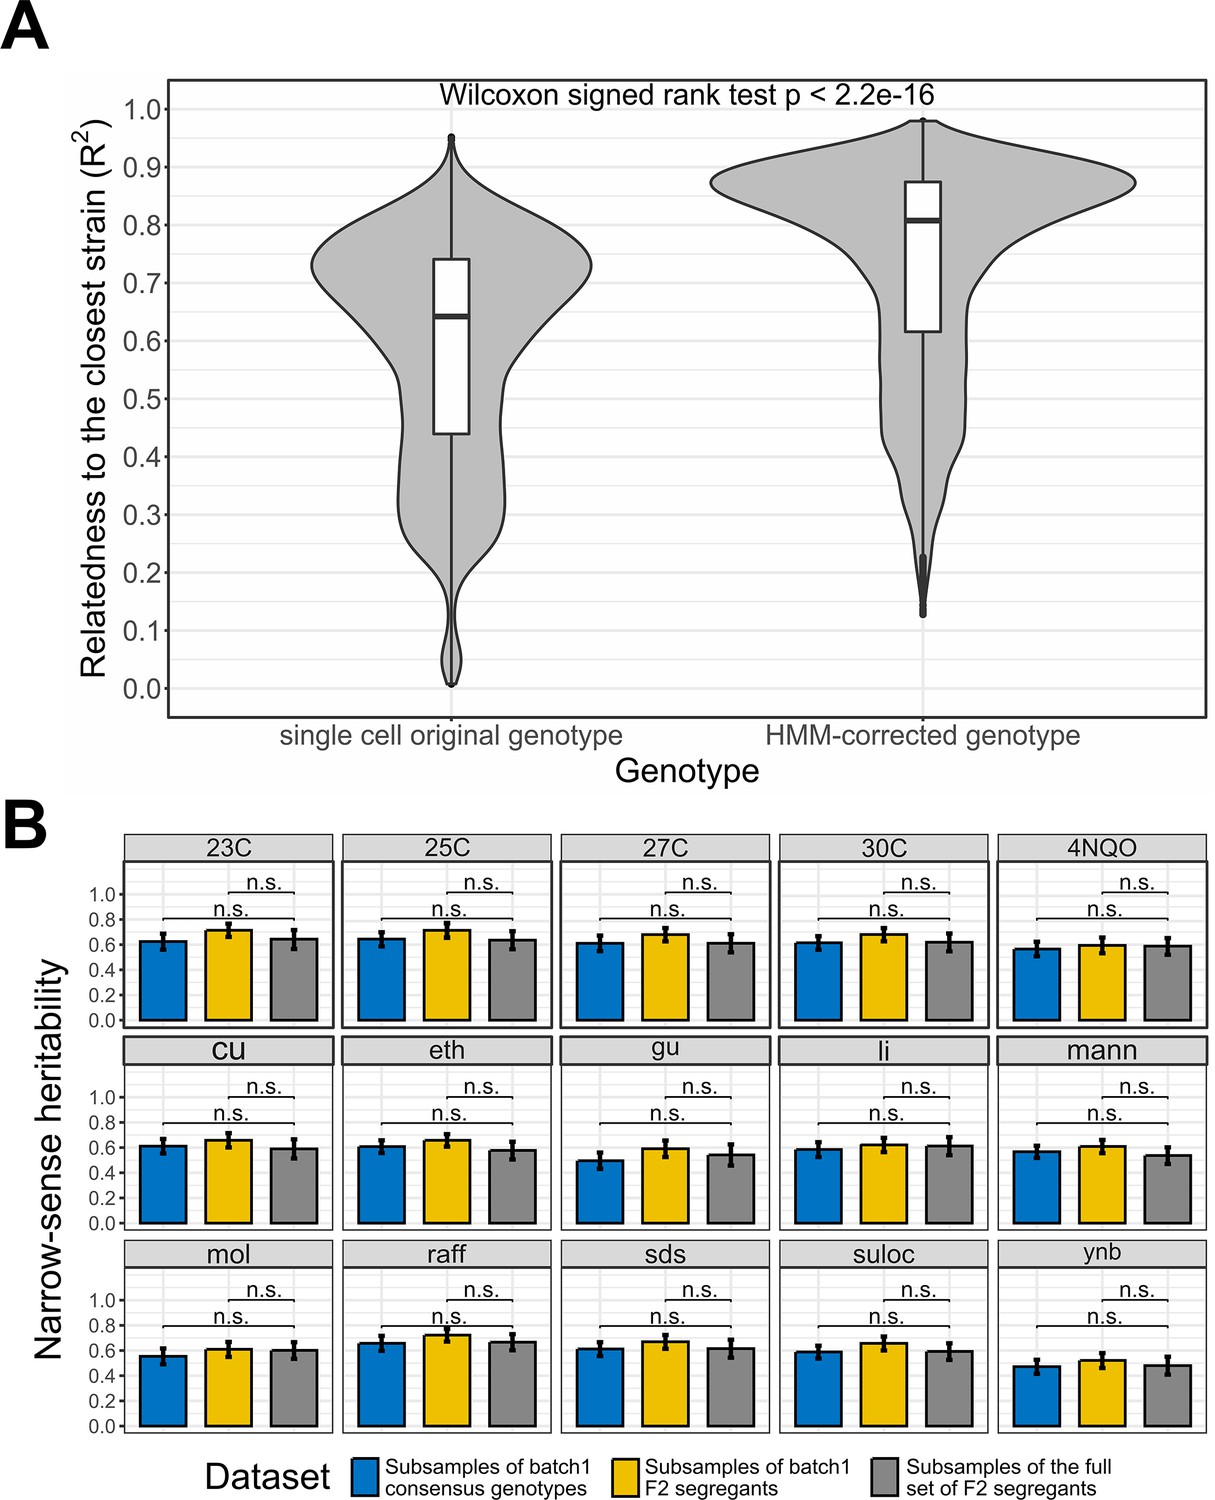
Single-cell RNA-seq data recapitulate bulk DNA and RNA assays results.
(A) Effect of the Hidden Markov Models (HMM) on the relatedness between single-cell genotypes and their closest reference lineage. The single-cell original genotype represents the genotype of the cells before the correction with the HMM. The relatedness to the closest lineage in batch 1 has been measured with the adjusted R2. To control for genotype uncertainty, only the 13,069 barcodes with a significant lineage assignment (lineage-barcode genotype correlation false discovery rate [FDR]<0.05) and a reference lineage with lower uncertainty than the single cell HMM are selected, which represents 72.2% of the barcodes. We then rounded the genotypes to remove the uncertainty during the comparison. Wilcoxon signed test p-value is indicated above the violin plots. (B) Narrow-sense heritability measured with scRNA-seq consensus genotypes and non-multiplexed DNA sequencing. Three datasets are compared through a t-test on the bootstrap narrow-sense heritabilities. The consensus genotypes of the batch 1 F2 segregants obtained from the associated scRNA-seq data (Figure 2—figure supplement 1) are represented in blue, the batch 1 F2 segregant genotypes in the reference dataset (bulk sequencing) are represented in yellow and the whole reference dataset of F2 segregants is represented in gray. For each dataset, the narrow-sense heritability has been measured from 500 random subsamples of 1000 F2 segregants. The bars represent the mean narrow-sense heritability, and the error bar length represents the 95% CI. The results are illustrated for the 15 environmental conditions where a minority of batch 1 F2 segregants have missing fitness data. The 23C-30C represents the temperature for the competition assay in YPD media while the other phenotypes represent growth on YNB, molasses (mol), mannose (Mann) or raffinose (raff) and chemical resistance to copper sulfate (Cu), ethanol (eth), guanidinium chloride (gu), lithium acetate (Li), sodium dodecyl sulfate (SDS), and suloctidil (suloc) (Nguyen Ba et al., 2022).
Figure 2—figure supplement 1
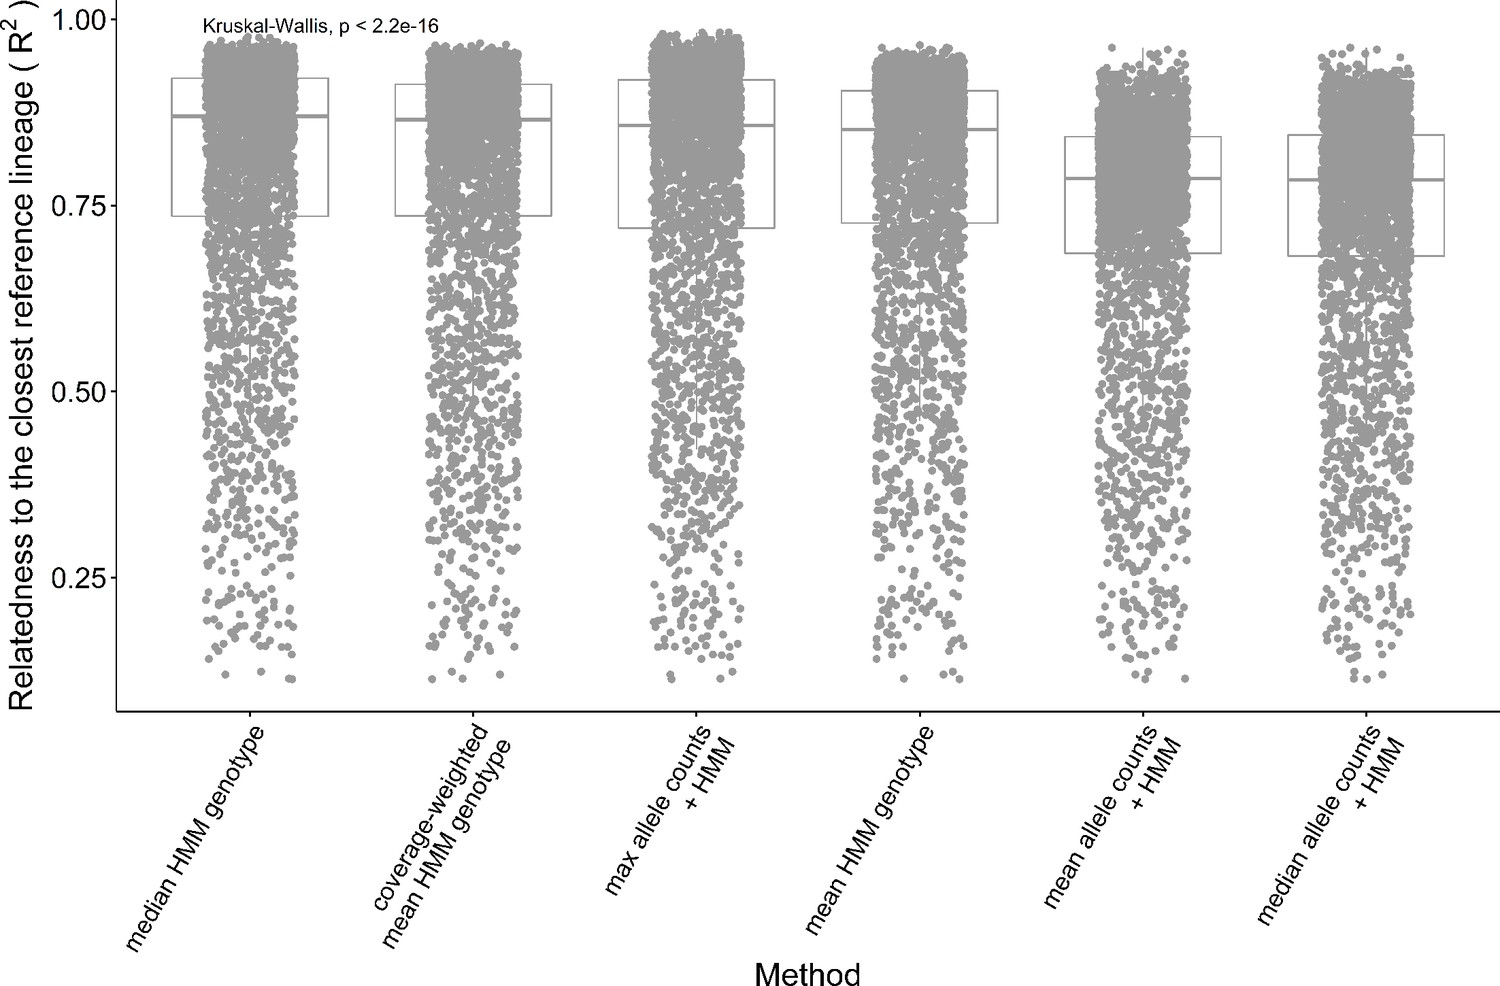
Performance of the consensus genotype methods.
The relatedness between the consensus genotypes and the closest lineage in batch 1 is measured with the adjusted R2 between the genotypes. The consensus genotype of each lineage is either obtained by calculating a summary statistic with the single-cell genotypes assigned to that lineage or by performing a Hidden Markov Models (HMM) inference after combining the single cells' allele counts using the summary statistics. The three summary statistics applied are the max, the mean, and the median. The lineage assigned to a group of single cells is the one with the closest genotype across batch 1 F2 segregants.
Figure 2—figure supplement 2
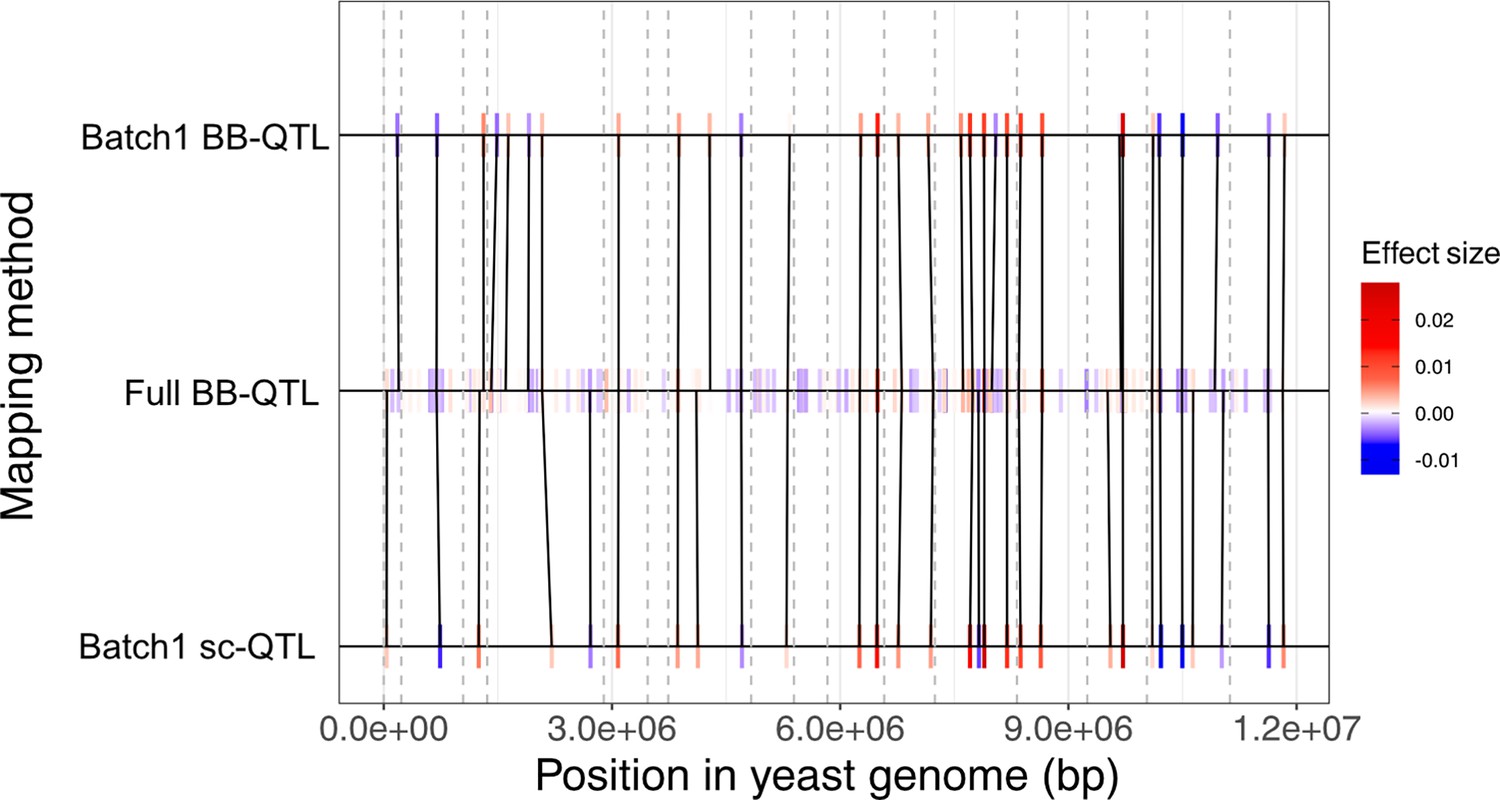
Comparison of the quantitative trait loci (QTL) mapping models for the 30C phenotype.
The black lines connect the QTL that are shared between two models. These shared QTL are identified by the Needleman–Wunsch algorithm which is based on the minimization of recombination distance, effect size difference, and allele frequency weighting as described by Nguyen Ba et al., 2022. QTL effect size is represented by a color gradient where negative effects are represented in blue while positive effects are represented in red. The gray dashed lines represent the start position of each of the 16 chromosomes in the yeast genome.
Figure 2—figure supplement 3
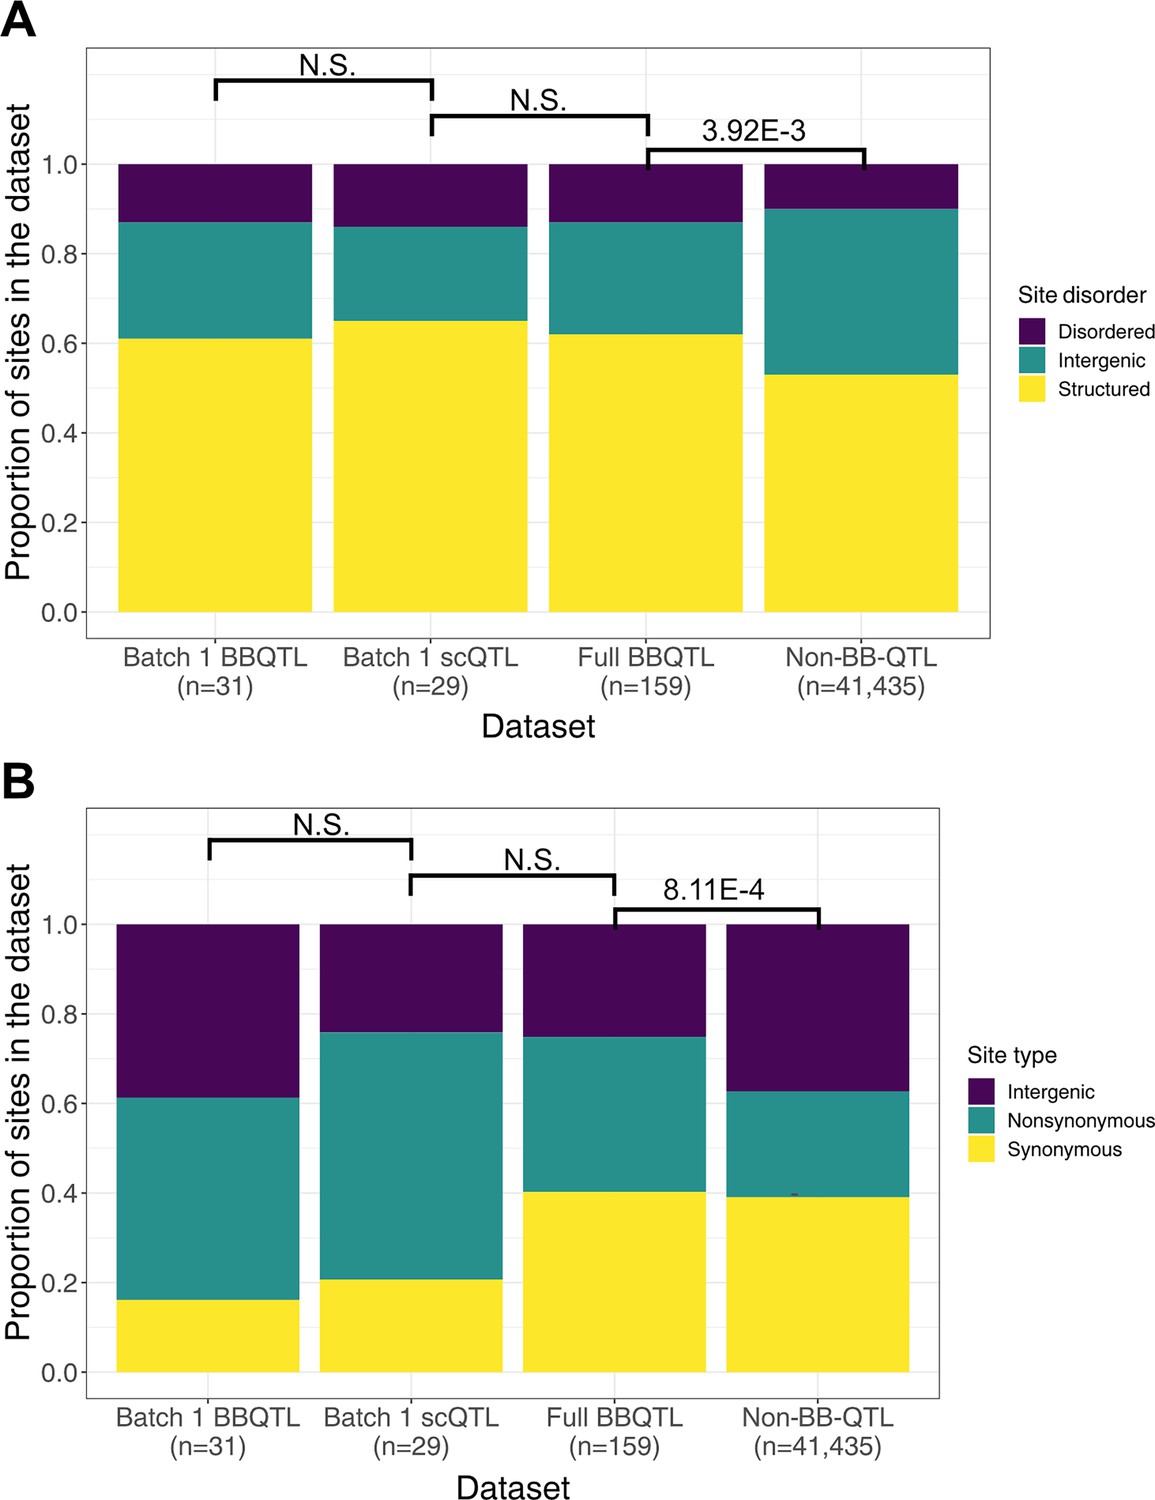
Comparison of site features distribution across quantitative trait loci (QTL) models.
(A) Site disorder distributions. (B) Site type distributions. For both panels, the non-BB-QTL set represents polymorphic sites that are not identified as QTL in the model performed on the full dataset of ~100,000 segregants. The size of each set of polymorphic sites is indicated below its name on the x-axis. Fisher’s exact test p-values are indicated above the boxplots where N.S. represents a p-value ≥ 0.05.
Figure 3 with 1 supplement
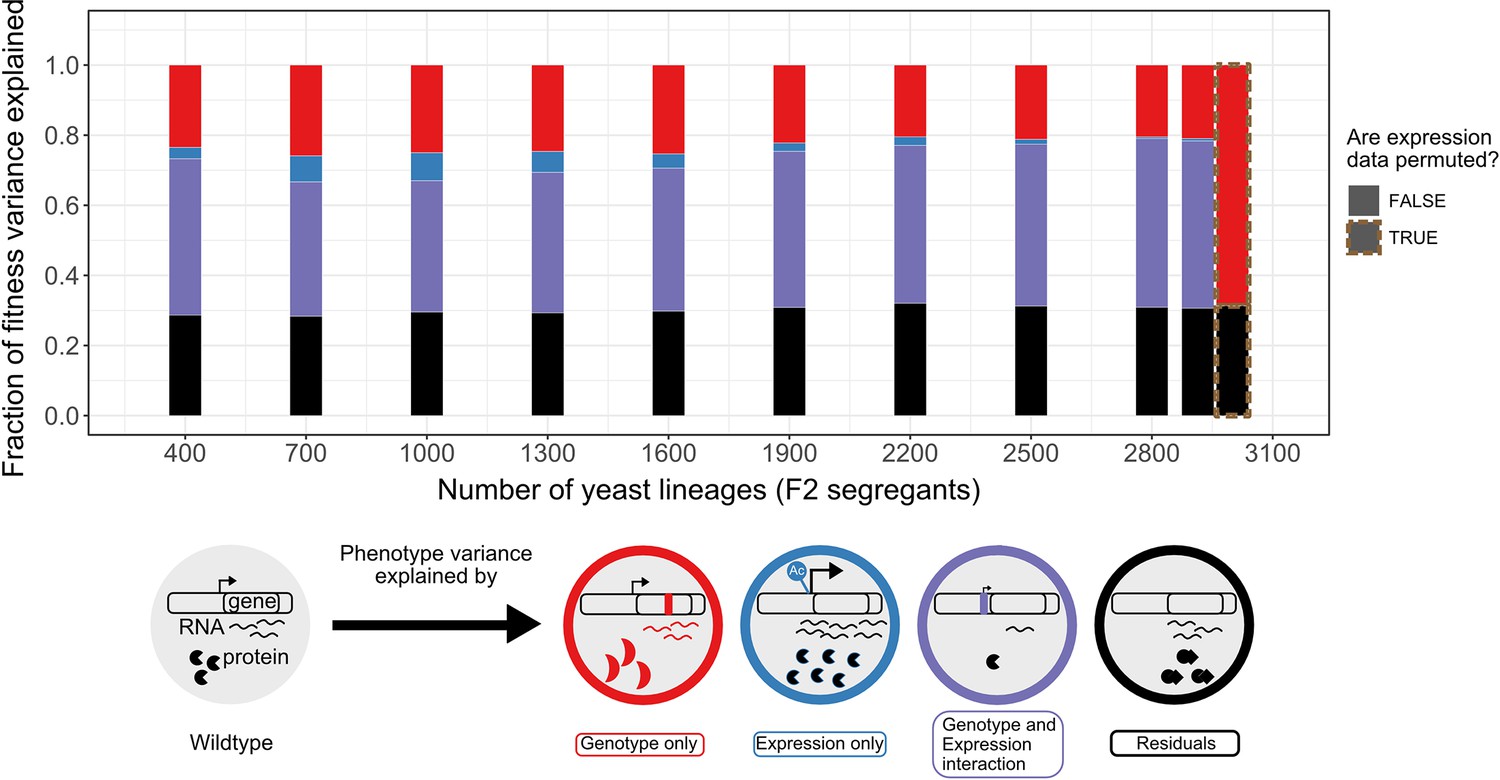
Variance partitioning of the 30C phenotype from scRNA-seq.
We fitted F2 segregant fitness data to their cells' consensus genotype and expression profiles using GTCA-GREML at different sample sizes. Because each segregant had multiple representatives/cells in the scRNA-seq data, the consensus profile of these lineages has been obtained from the cell with the highest transcript level. The bars represent the proportion of the fitness/phenotype variance across F2 segregants (whole rectangle area) explained by each model component. The size of the red genotype-exclusive component is obtained by subtracting the size of the shared component from the variance explained by the model in Equation 2. The red cell illustrates this effect as a mutation changes its fitness by modifying the structure of the transcript product. The size of the blue expression-exclusive component is obtained by subtracting the size of the shared component from the variance explained by the model in Equation 3. An epigenetic modification increasing the transcript level of the gene in the blue cell illustrates this effect. The purple area represents the effect of the interaction of mutation and expression on fitness variation observed across the segregants. In the example shown, a mutation in the promoter changes the fitness of the purple cell through a down-regulation of the gene expression. This component is obtained by subtracting the variance explained by the model in Equations 1 or 2 from the one in Equation 4, as there is a shared component of trait variation explained by genotype and expression variation. Finally, the black bar represents the model’s residual, which includes any phenomenon that causes fitness variation that we did not explicitly measure and include in the model. The size of the residuals is obtained by subtracting the sum of the size of all the defined components (red + blue + purple) from 1.
Figure 3—figure supplement 1
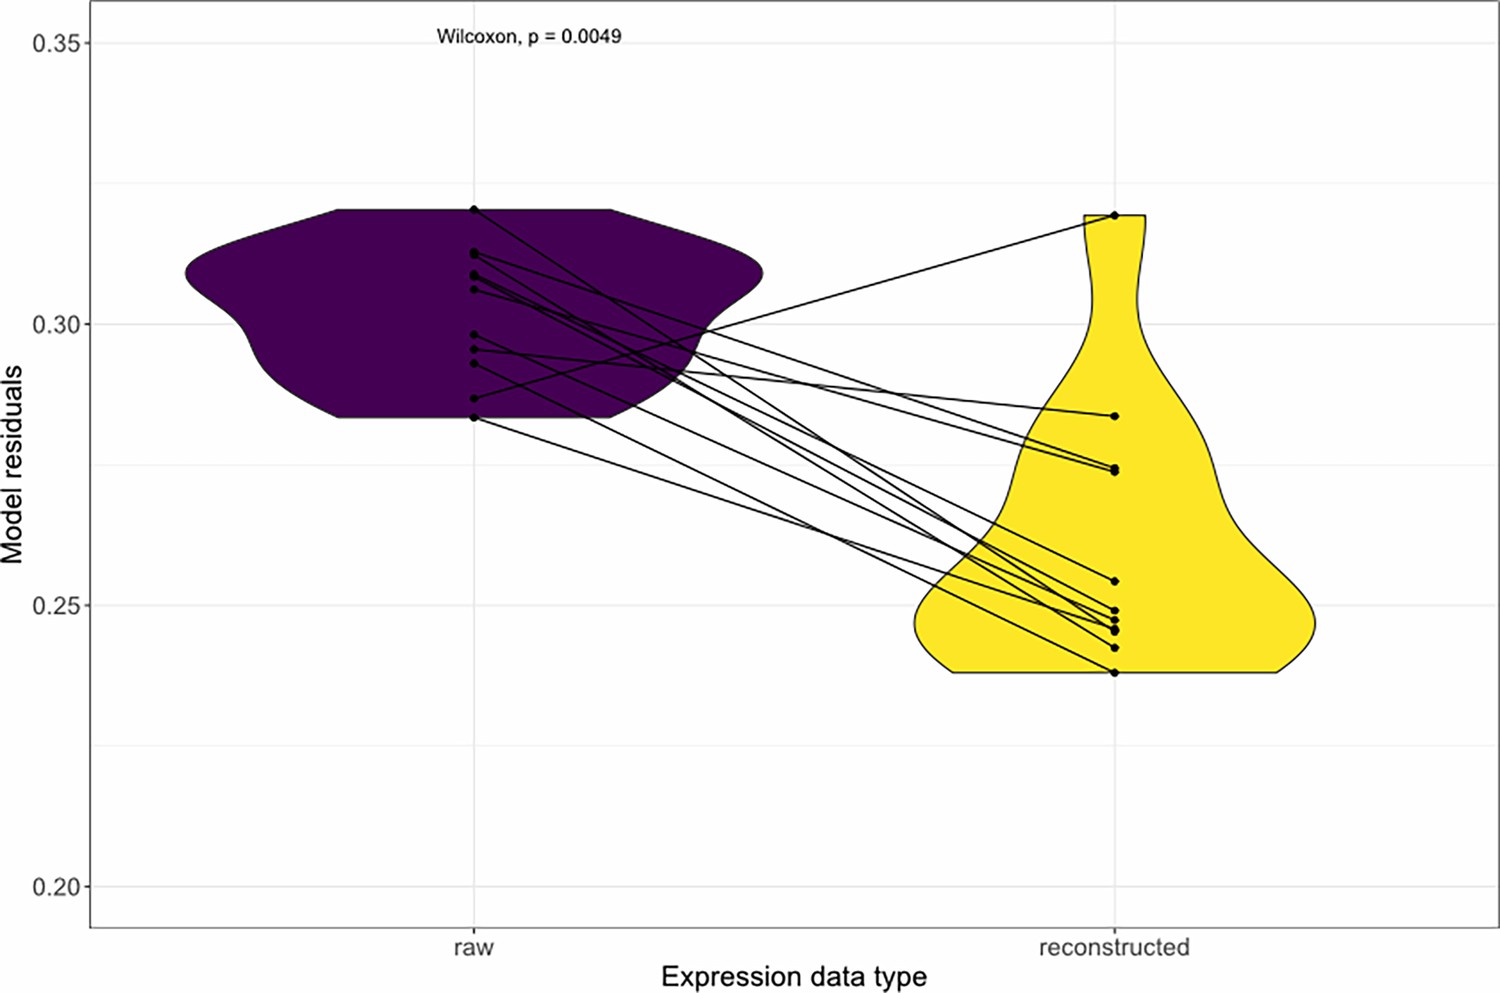
Denoising the expression data with DISCERN decreases the residuals of the variance partitioning model.
We partitioned the phenotype variance based on the contribution of gene expression and genotype changes using the GREML method. The expression data were either the original ones obtained from our scRNA-seq assay (purple) or the reconstructed expression data obtained by denoising the raw expression data with DISCERN (yellow). Each point pair represents a sample size, and the Wilcoxon signed rank p-value is indicated at the top of the graph.
Figure 4 with 1 supplement
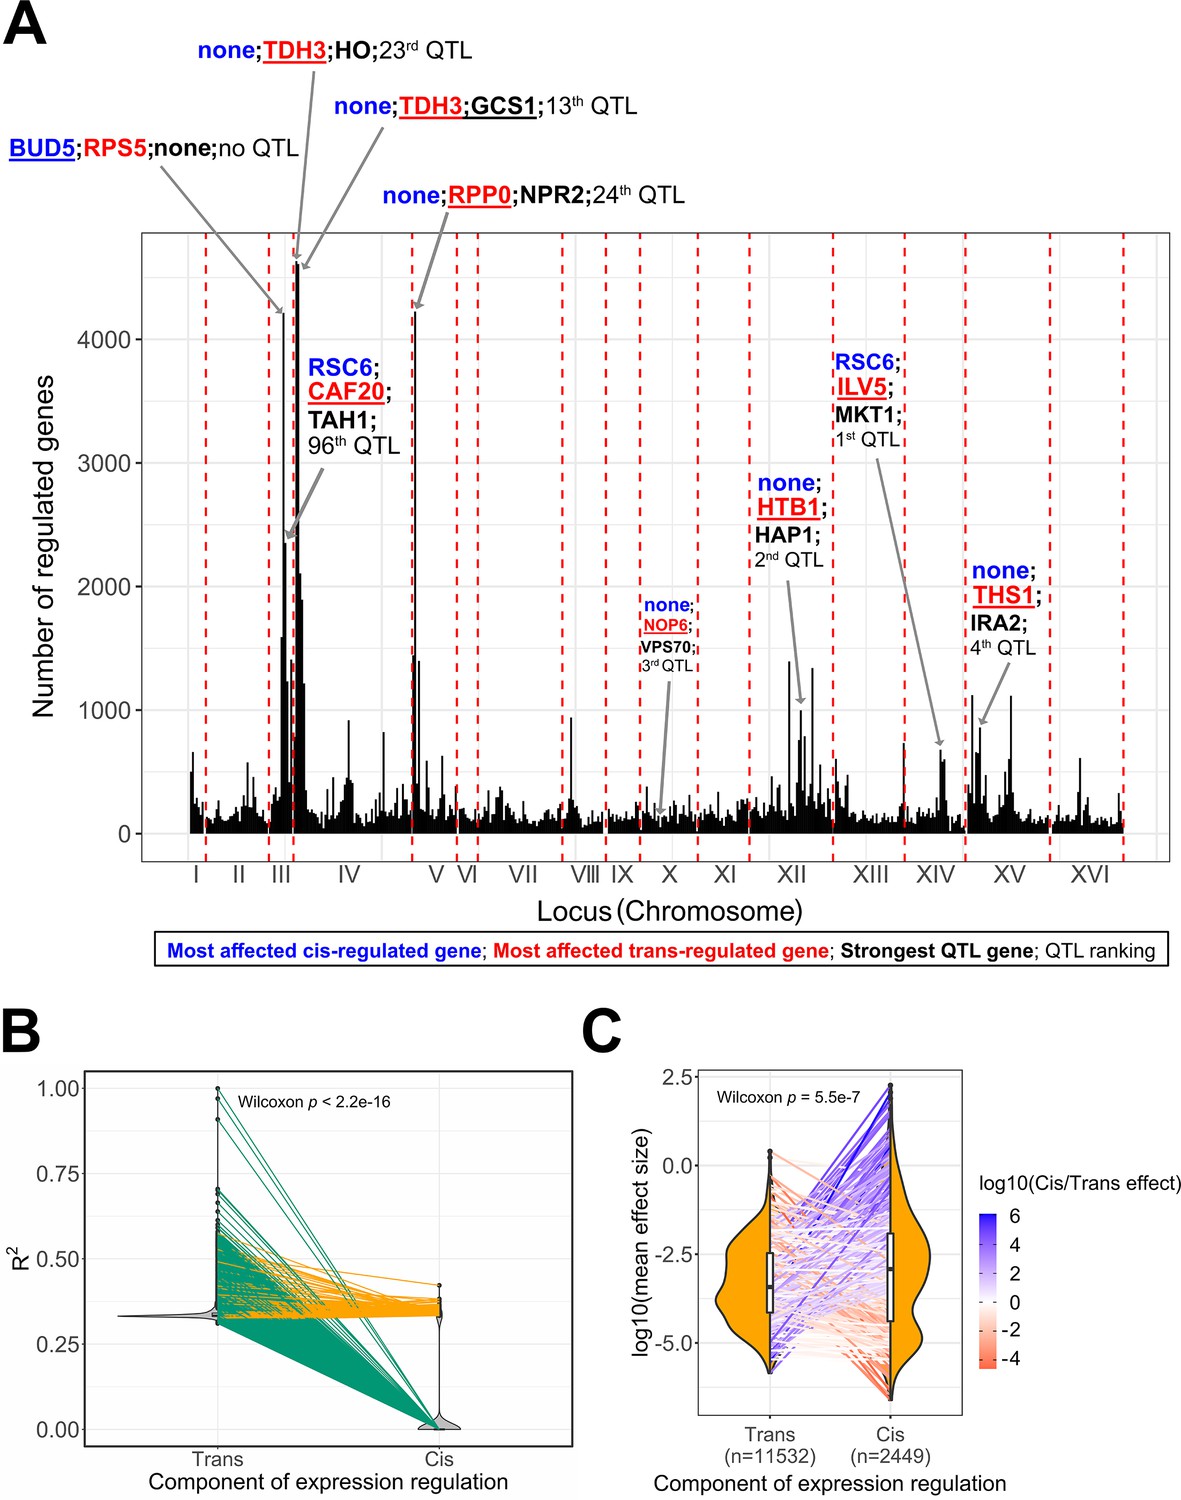
Expression quantitative trait loci (eQTL) features underlying trait variation across the BY/RM segregants.
(A) Mapping of the 30 C QTL in the eQTL hotspots. We represent the hotspots of expression regulation as genomic windows (25 kb) to acknowledge the uncertainty around the real position of the eQTL due to linkage disequilibrium. We annotated the top 5 eQTL hotspots and the eQTL hotspots in which the top additive QTL identified by the BB-QTL mapping of the 30C phenotype are located. In these regions, we represented the most affected trans-regulated genes in red, the most affected cis-regulated gene in blue, and the top QTL genes in black. The double quotation characters represent the absence of such genes in the associated region. We also represented the rank of the QTL in the set of 159 QTL of the 30C phenotype. (B) Partitioning of the expression heritability or explained variance (R2) among cis- and trans-eQTL. Each pair of points connected by a line represents a gene. Green lines represent the genes that only have trans-eQT,L and orange lines represent the genes that have both trans- and cis-eQTL. (C) Comparison of the mean effect size between cis- and trans-eQTL. Each pair of points connected by a line represents a gene. The line color represents the ratio of the average effect size between cis- and trans-eQTL. The sample size of each eQTL category is represented in the x-axis. This is the number of trans-eQTL and cis-eQTL used for calculating the average effect sizes per gene not the number of points per distribution.
Figure 4—figure supplement 1
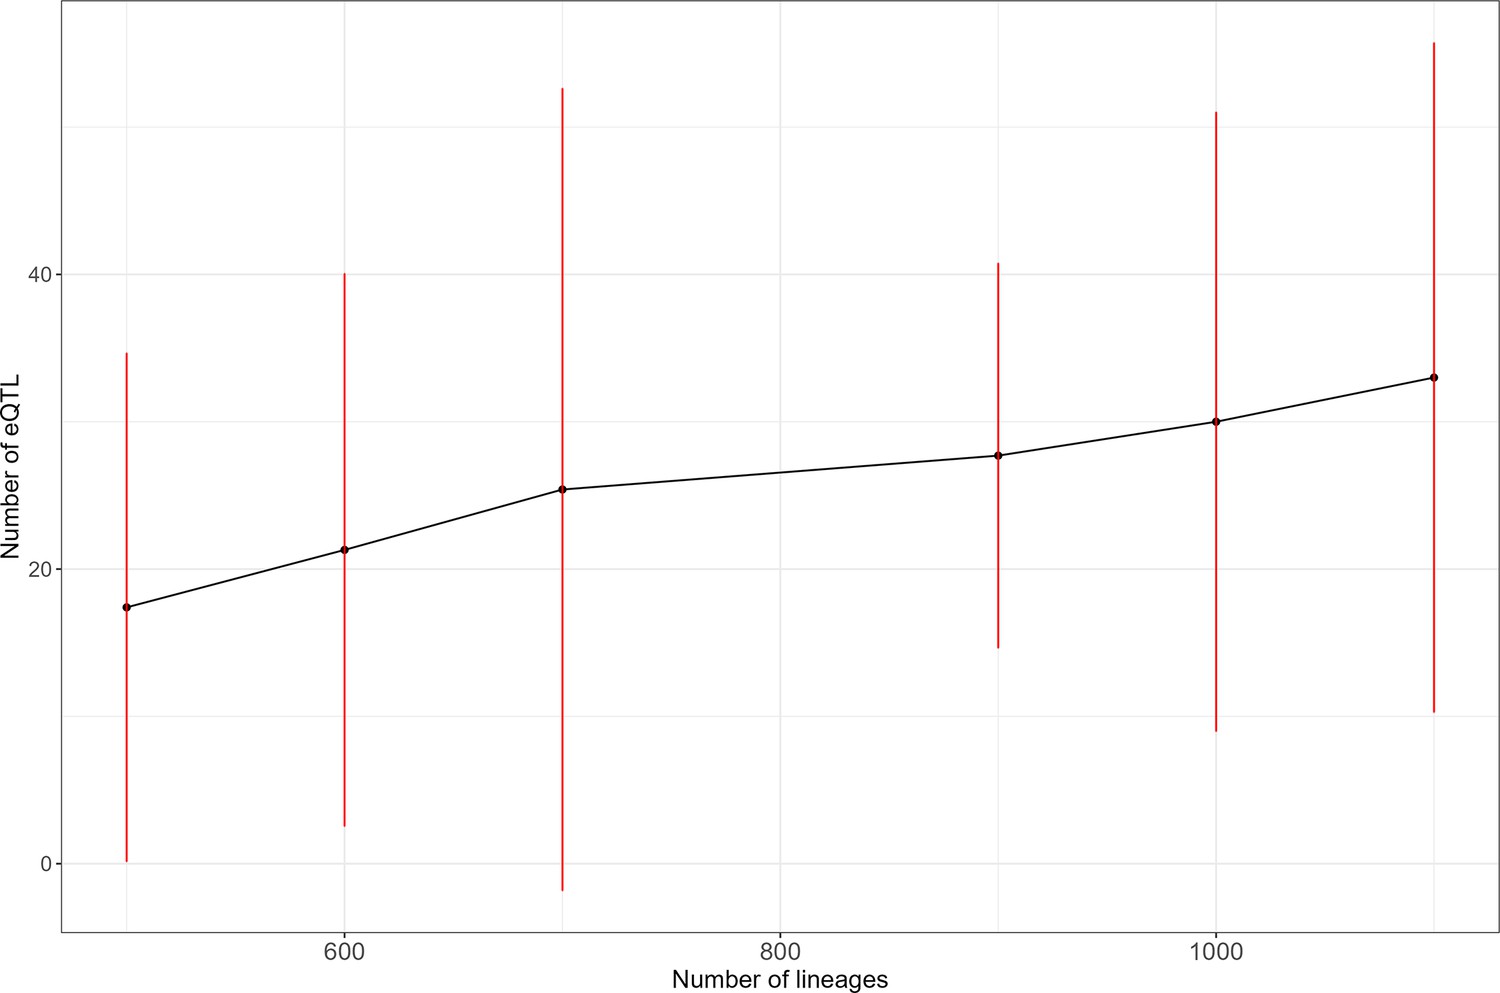
The number of detected expression quantitative trait loci (eQTL) revealed by scRNA-seq increases with sample size.
We evaluated the number of eQTLs detected per gene for the 10 most heritable genes in our dataset. For each sample size, the dot represents the average number of eQTL detected and the red line represents 2 standard deviations.
Tables
Table 1
scRNA-seq dataset features.
The doublets were defined as scRNA-seq barcodes with high coverage (≥ third quartile) without significant genotype association to any F2 segregants and for which the two most similar F2 segregants do not share genotypic similarity (R2 <0.1). The breadth of coverage is defined as the proportion of BY/RM polymorphic sites covered in a single cell.
| Metric | Value |
|---|---|
| Library size (number of reads) | 479,781,081 |
| Median number of covered genes per cell | 1,311 |
| Median number of unique molecular identifiers per cell | 5,158 |
| Doublet rate | 0.10 |
| Average number of cell barcodes per F2 segregant | 4.83 |
| Polymorphic sites mean breadth of coverage | 0.03 |
Additional files
-
Supplementary file 1
Predictors of the relatedness between high-coverage cells and their closest batch 1 lineage.
We used these variables as explanatory variables in a linear regression model where the relatedness of the high-coverage cells was the response variable. The high-coverage cells were defined as having a coverage in the top 25% of the distribution (>Q3). The data were normalized before performing the linear regression and the influence of the predictors is ranked in decreasing order from top to bottom of the table.
- https://cdn.elifesciences.org/articles/93906/elife-93906-supp1-v1.docx
-
Supplementary file 2
QTL identified from the bulk fitness and DNA sequencing assays.
- https://cdn.elifesciences.org/articles/93906/elife-93906-supp2-v1.docx
-
Supplementary file 3
QTL identified from single cells HMM-corrected genotypes and closest lineage fitness.
- https://cdn.elifesciences.org/articles/93906/elife-93906-supp3-v1.docx
-
MDAR checklist
- https://cdn.elifesciences.org/articles/93906/elife-93906-mdarchecklist1-v1.pdf
Download links
A two-part list of links to download the article, or parts of the article, in various formats.
Downloads (link to download the article as PDF)
Open citations (links to open the citations from this article in various online reference manager services)
Cite this article (links to download the citations from this article in formats compatible with various reference manager tools)
Refining the resolution of the yeast genotype–phenotype map using single-cell RNA-sequencing
eLife 13:RP93906.
https://doi.org/10.7554/eLife.93906.5


