Fitness landscape of substrate-adaptive mutations in evolved amino acid-polyamine-organocation transporters
- Department of Biochemistry, University of Groningen, Netherlands
Figures
Figure 1 with 2 supplements
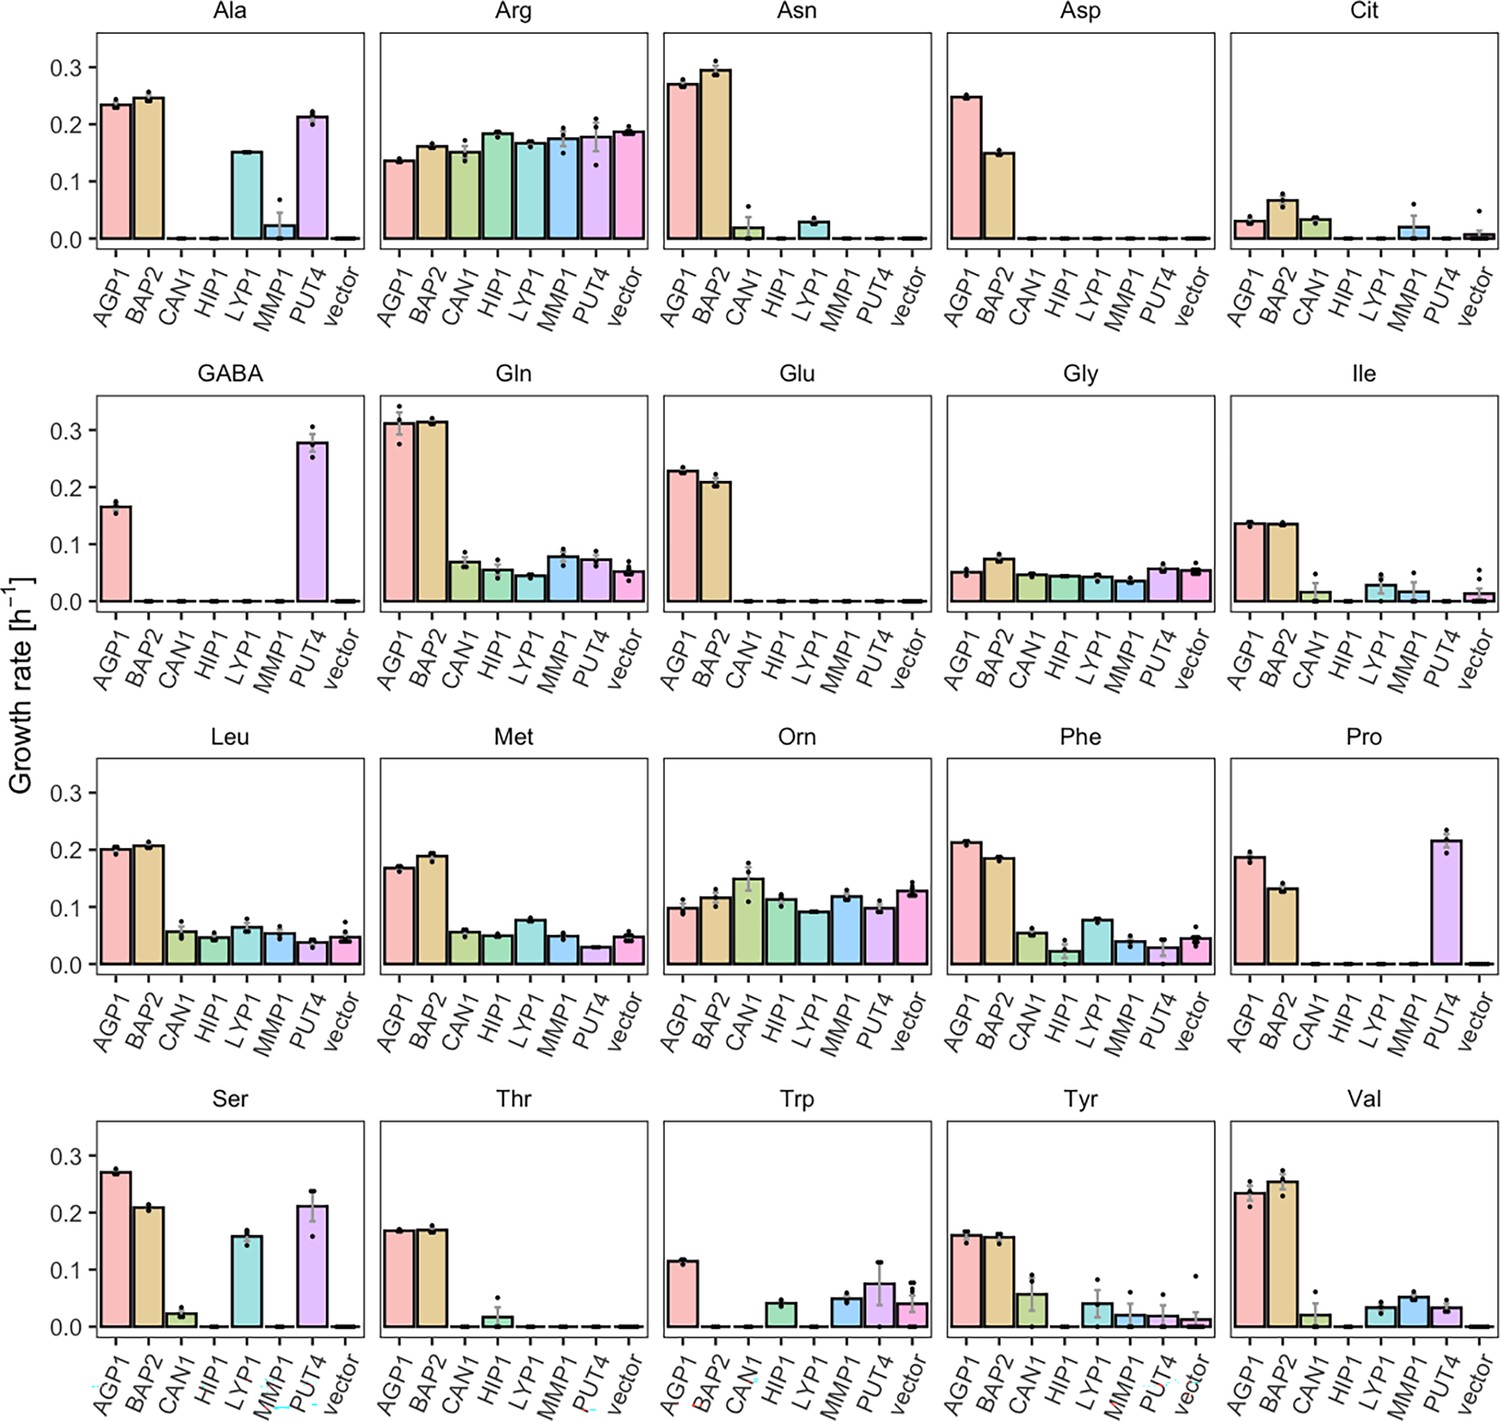
Yeast amino acid transporters (YAT) support growth on a range of amino acids.
Growth rates of Δ10AA expressing one of seven different wild-type YAT genes (AGP1, BAP2, CAN1, HIP1, LYP1, MMP1, PUT4) from pADHXC3GH and the empty vector control on 2 mM of each amino acid. Error bars represent the SEM (n≥3). For the respective growth curves, see Figure 1—figure supplement 1. For the respective growth rates, see Figure 1—source data 1. To give an indication of the relatedness of YAT proteins from S. cerevisiae, a pairwise identity matrix based on Clustal Omega (Madeira et al., 2022) alignment of Uniprot (UniProt Consortium, 2023) sequences is presented in Figure 1—figure supplement 2.
-
Figure 1—source data 1
Growth rates of yeast amino acid transporter (YAT) expressing yeast.
Growth rate values of Δ10AA expressing either one of the seven different wild-type YAT genes (AGP1, BAP2, CAN1, HIP1, LYP1, MMP1, PUT4) from pADHXC3GH and the empty vector control on 2 mM of each amino acid. The growth rates were calculated based on Figure 1—figure supplement 1.
- https://cdn.elifesciences.org/articles/93971/elife-93971-fig1-data1-v1.xlsx
Figure 1—figure supplement 1
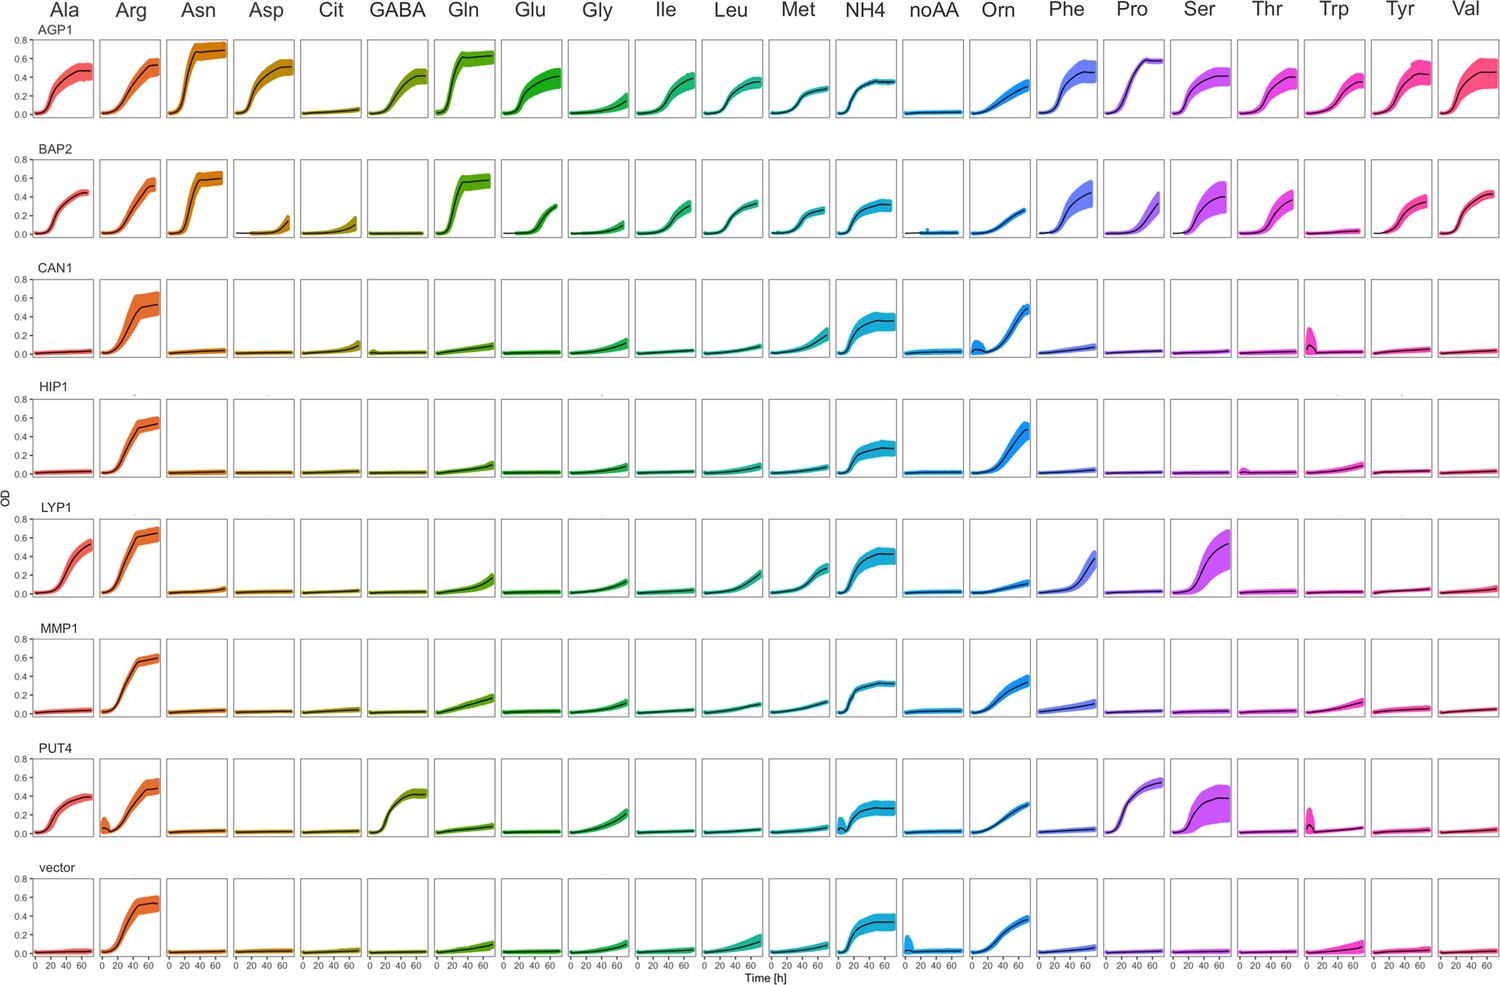
Yeast amino acid transporters (YAT) support growth on a range of amino acids.
Growth curves of Δ10AA expressing either one of the seven different wild-type YAT genes (AGP1, BAP2, CAN1, HIP1, LYP1, MMP1, PUT4) from pADHXC3GH and the empty vector control on 2 mM of each amino acid. Black lines represent mean values of all measured curves (n≥3). Colored areas represent the SD range.
Figure 1—figure supplement 2
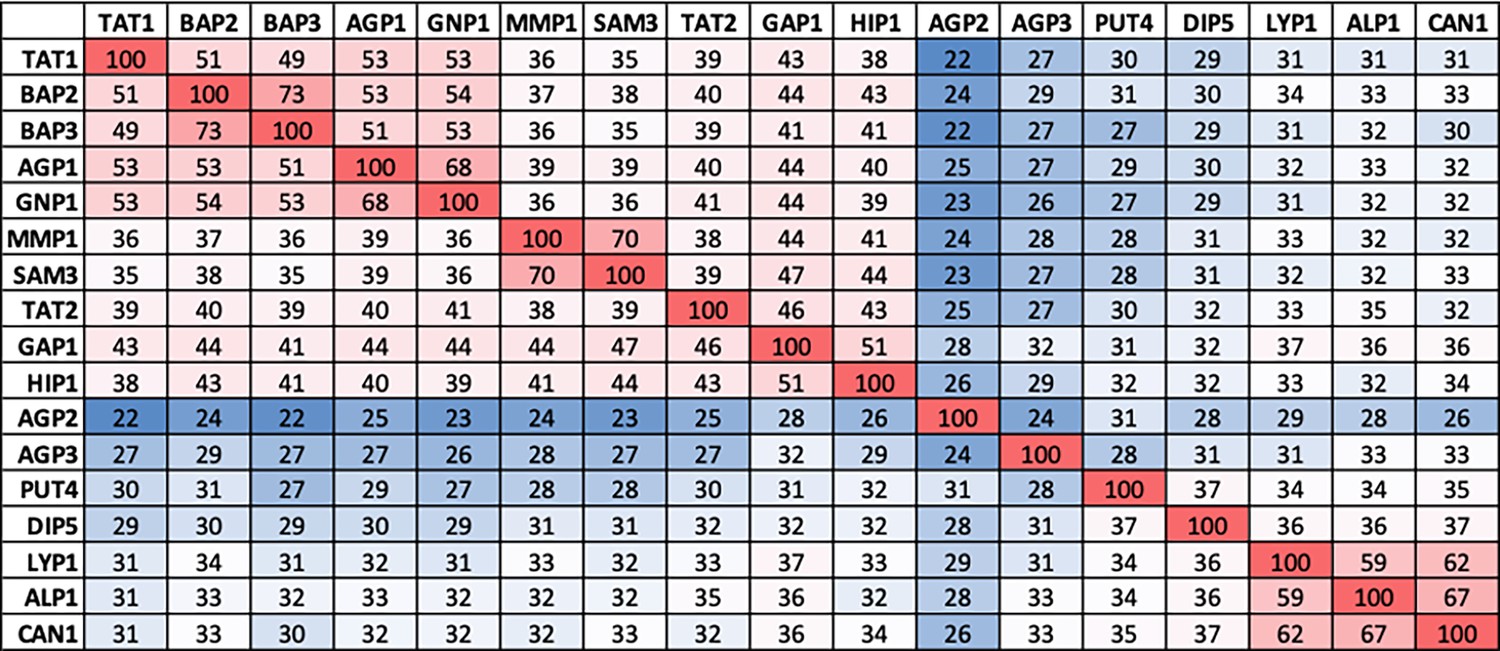
Pairwise identities of yeast amino acid transporter (YAT) protein sequences from S. cerevisiae.
The multiple sequence alignment was performed using Clustal Omega, with standard UniProt protein sequences as input (AGP1: P25376, AGP2: P38090, AGP3: P43548, ALP1: P38971, BAP2: P38084, BAP3: P41815, CAN1: P04817, DIP5: P53388, GAP1: P19145, GNP1: P48813, HIP1: P06775, LYP1: P32487, MMP1: Q12372, PUT4: P15380, SAM3: Q08986, TAT1: P38085, TAT2: P38967). The sequence identity is shown in percentage, from no identity (0) to identical match (100), represented in blue and red respectively.
Figure 2 with 4 supplements
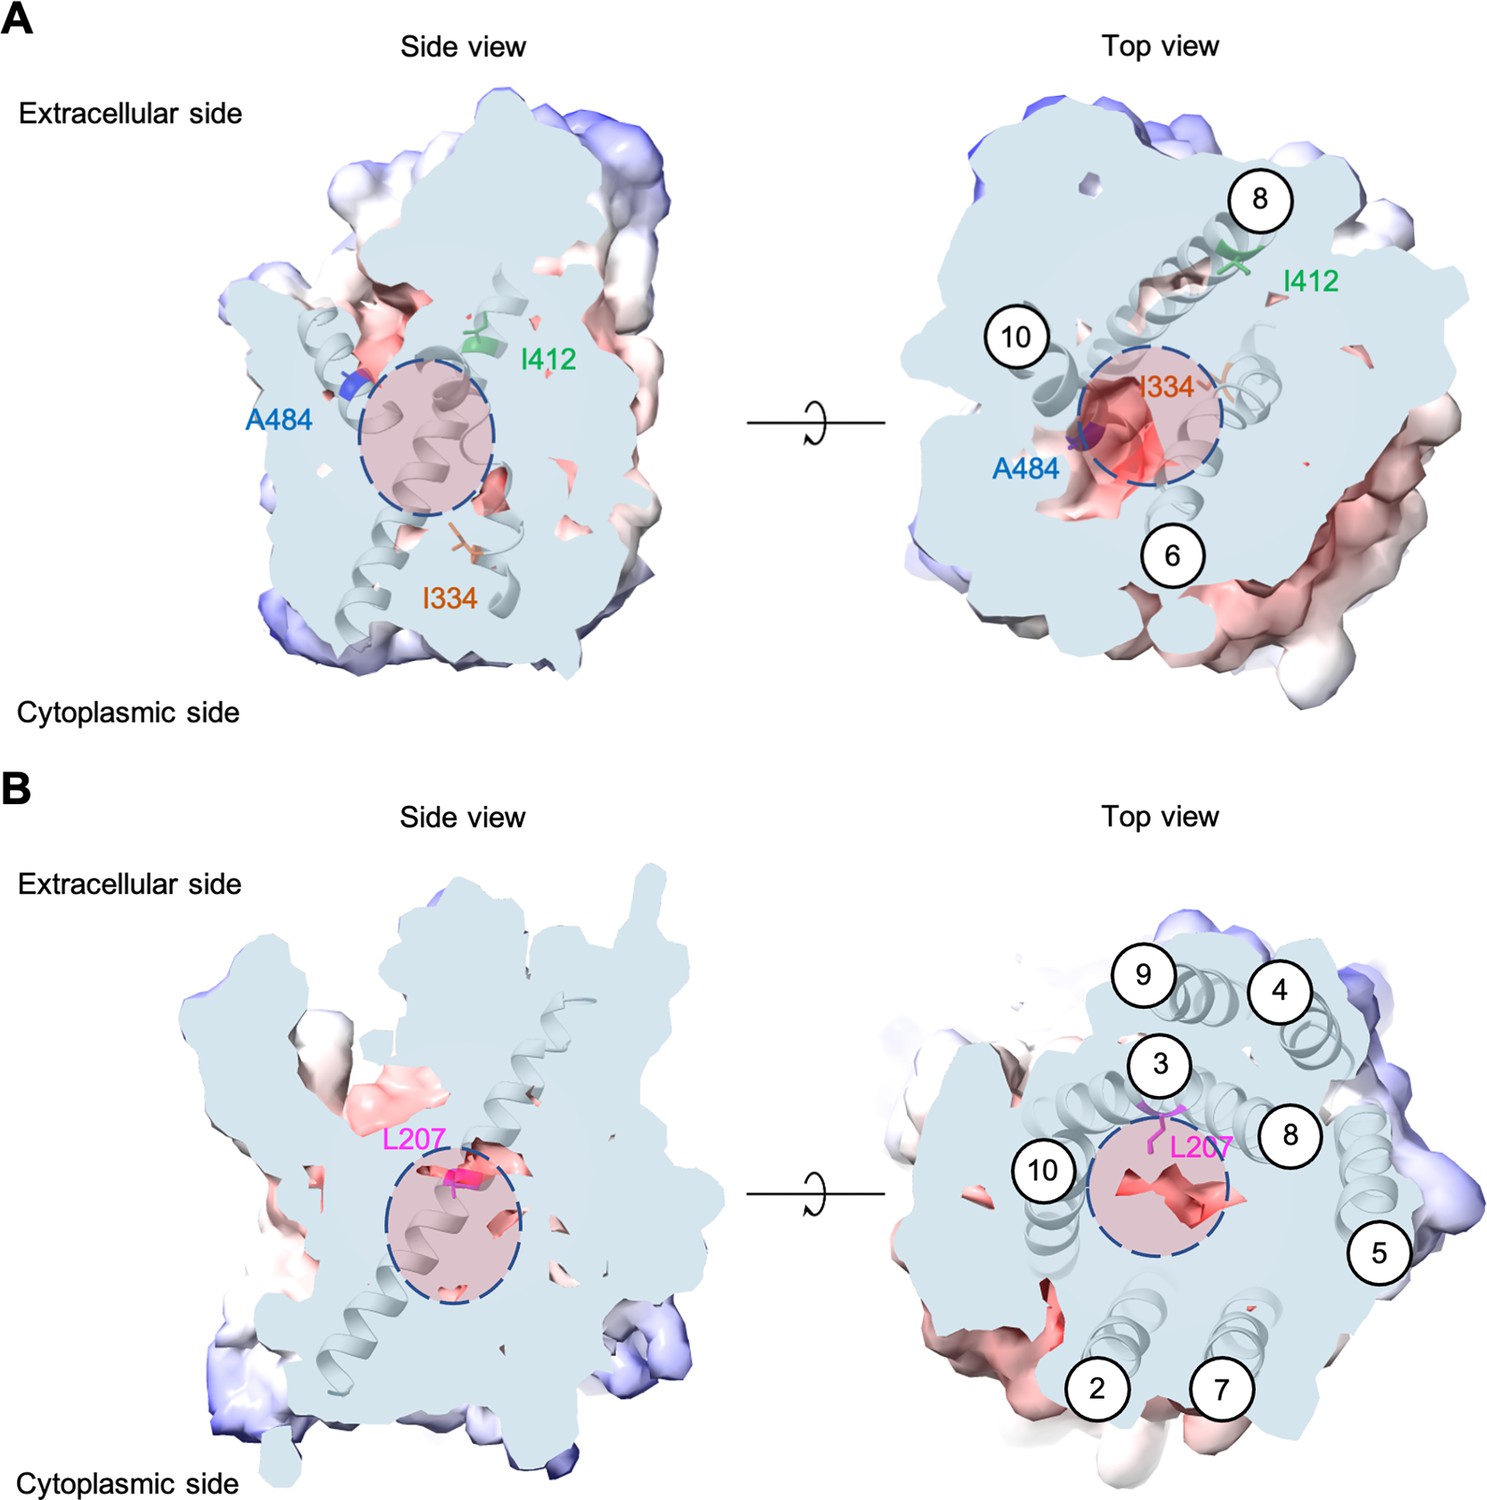
Positions of the substituted amino acids investigated in this study.
Side and top views of the AlphaFold models of AGP1 (AF-P25376) (A) and PUT4 (AF-P15380) (B) visualized in ChimeraX (1.3.0) (Pettersen et al., 2021). The amino acids of interest are highlighted in different colors. The respective TMs are presented in circles. The predicted substrate binding site is represented as dashed circle.
Figure 2—figure supplement 1
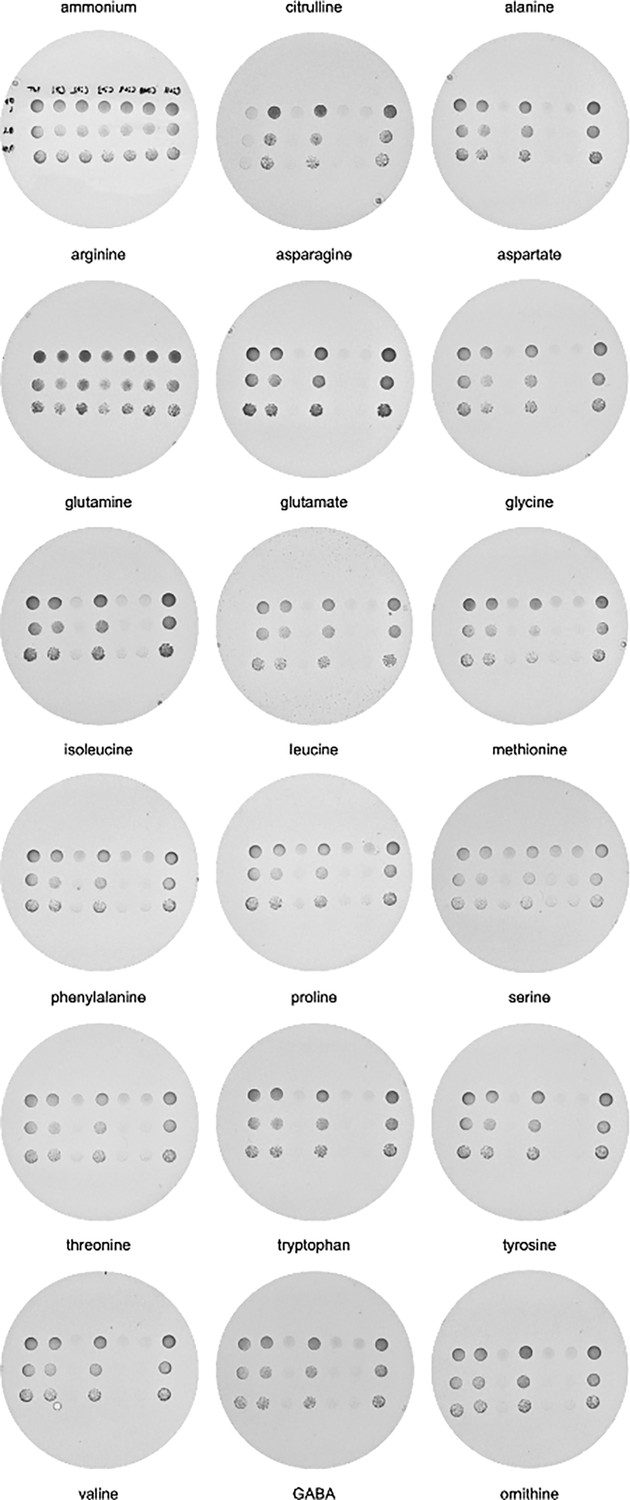
In vivo evolution of AGP1.
Growth assays of Δ10AA pADHXC3GH-AGP1 variants isolated from Cit evolution, spotted on minimal agar with 1 mM of the respective amino acid as the sole nitrogen source. Dishes were imaged after 6 days of incubation at 30°C. Order of AGP1 variants in each dish from left to right: AGP1 wild-type, AGP1-Cit1, AGP1-Cit2, AGP1-Cit3, AGP1-Cit9, AGP1-Cit10, AGP1-Cit11. Spotted are 5 µL of OD600 of 1, 0.1, and 0.01.
Figure 2—figure supplement 2
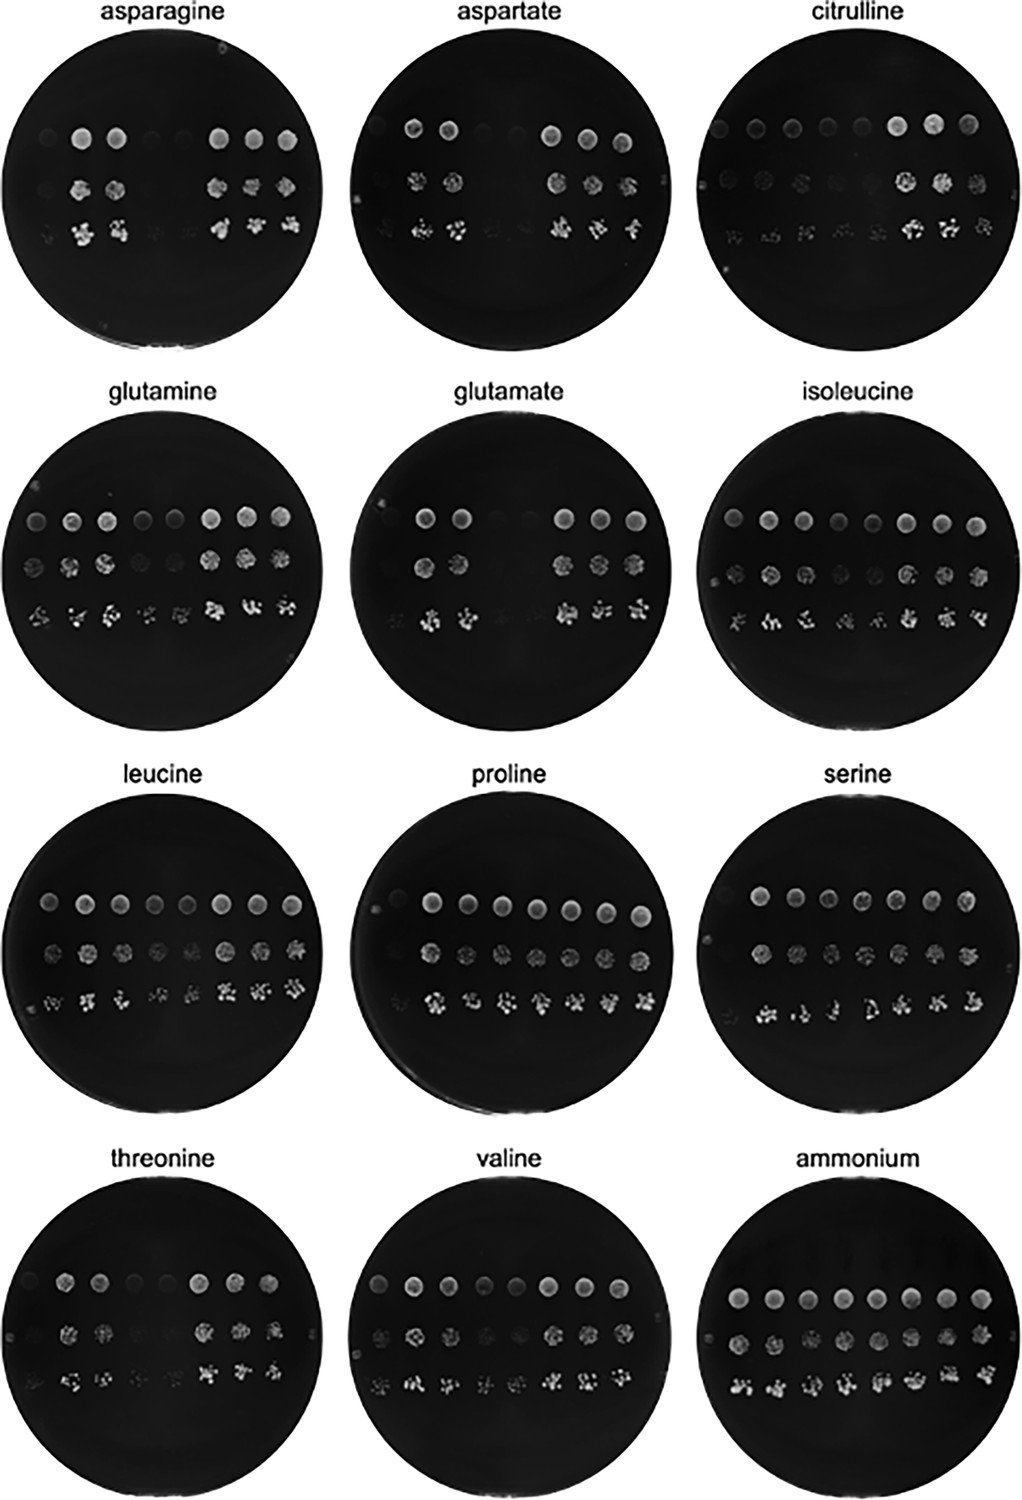
In vivo evolution of PUT4.
Growth assays of Δ10AA pADHXC3GH-PUT4 variants isolated from Asp and Glu evolution, spotted on minimal agar with 1 mM of the respective amino acid as the sole nitrogen source. Dishes were imaged after 15 days of incubation at 30°C. Order of PUT4 variants in each dish from left to right: negative control (AGP1-Cit9), PUT4-Glu2, PUT4-Glu1, PUT4-wild-type, PUT4-wild-type, PUT4-Asp3, PUT4-Asp2, PUT4-Asp1. Spotted are 5 µL of OD600 of 0.1, 0.01, and 0.001.
Figure 2—figure supplement 3
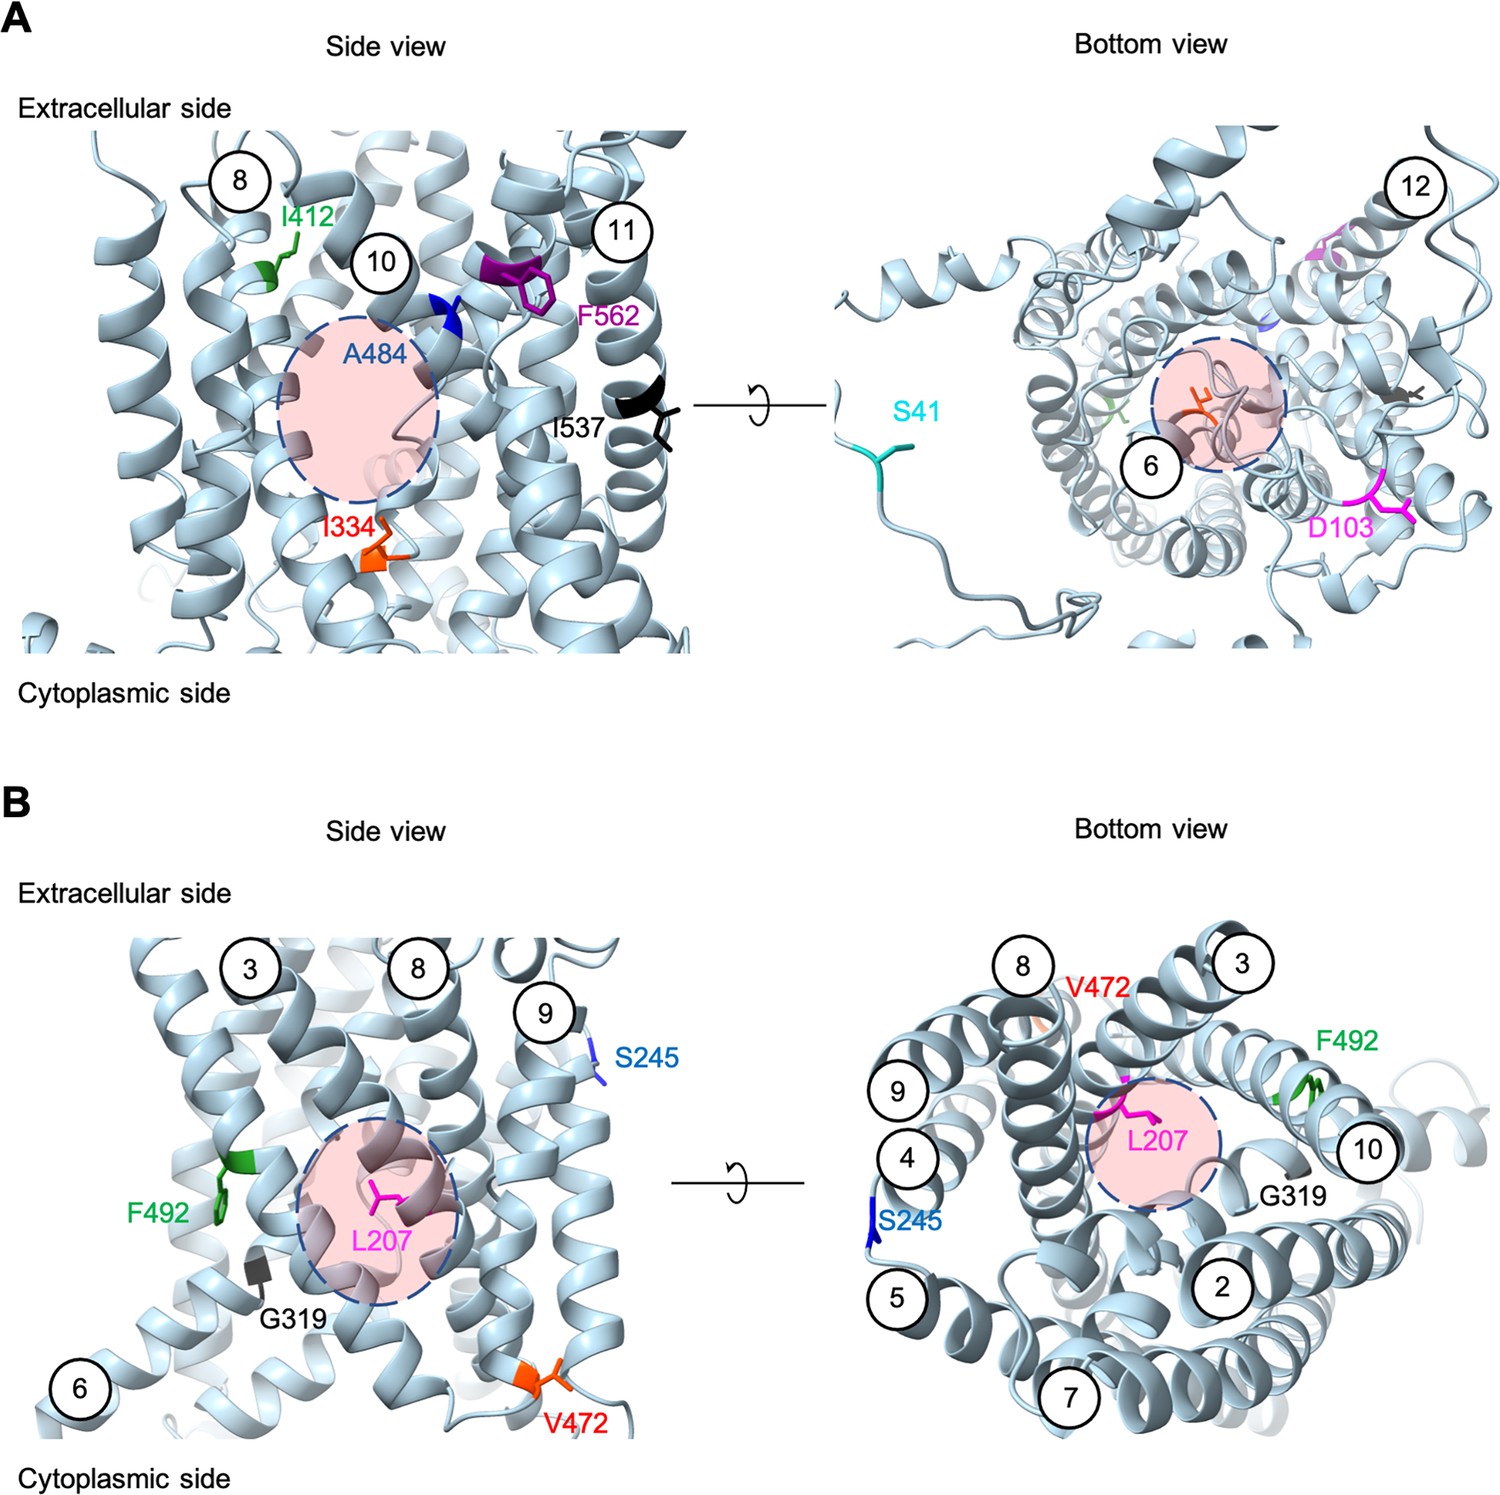
Positions of the substituted amino acids found in the evolved mutants.
Side and bottom views of the AlphaFold models of AGP1 (AF-P25376) (A) and PUT4 (AF-P15380) (B) visualized in ChimeraX (1.3.0). The reported amino acids that were substituted in the evolved mutants are highlighted in different colors. The respective TMs are presented in circles. The predicted substrate binding site is represented as dashed circle.
Figure 2—figure supplement 4
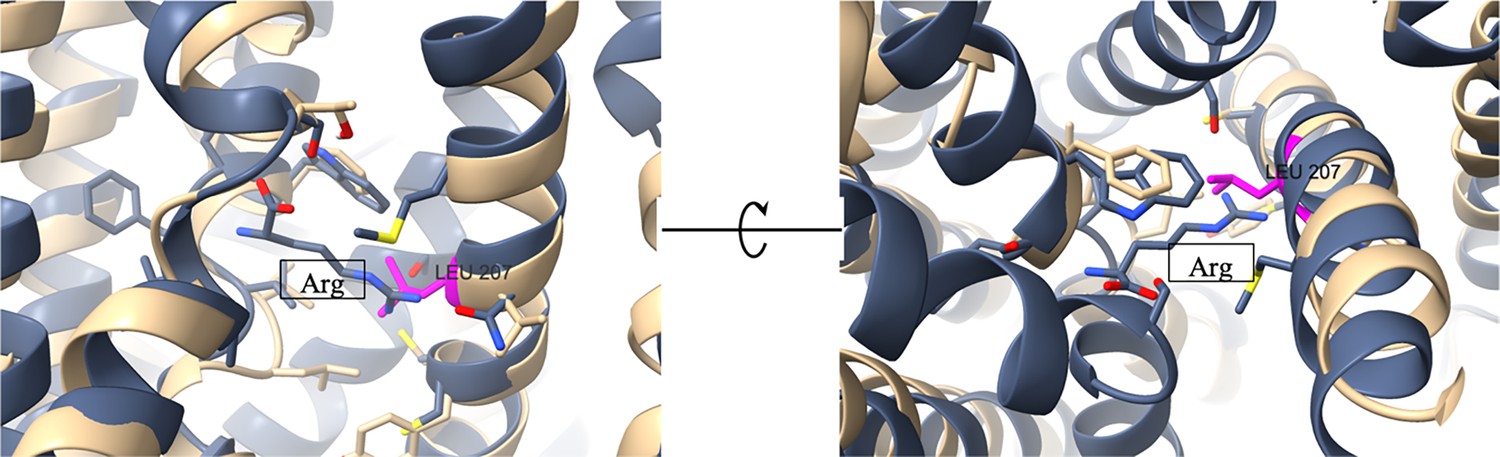
Position of the L207S on the transporter’s binding site.
Overlay of AdiC crystal structure (PDB: 3OB6; gray) and PUT4 AlphaFold model (AF-P15380; beige). The original substrate of AdiC is present in the middle of the images (‘Arg’; gray). The amino acids contributing to the substrate binding site are shown in sticks. The L207 of PUT4 is shown in magenta, positioned in the binding site area. According to VAST Search (NCBI), the two structures share a 16.5% sequence identity in the superimposed protein parts, a structural similarity score of 22.15 and RMSD of 3.51 Å.
Figure 3 with 3 supplements
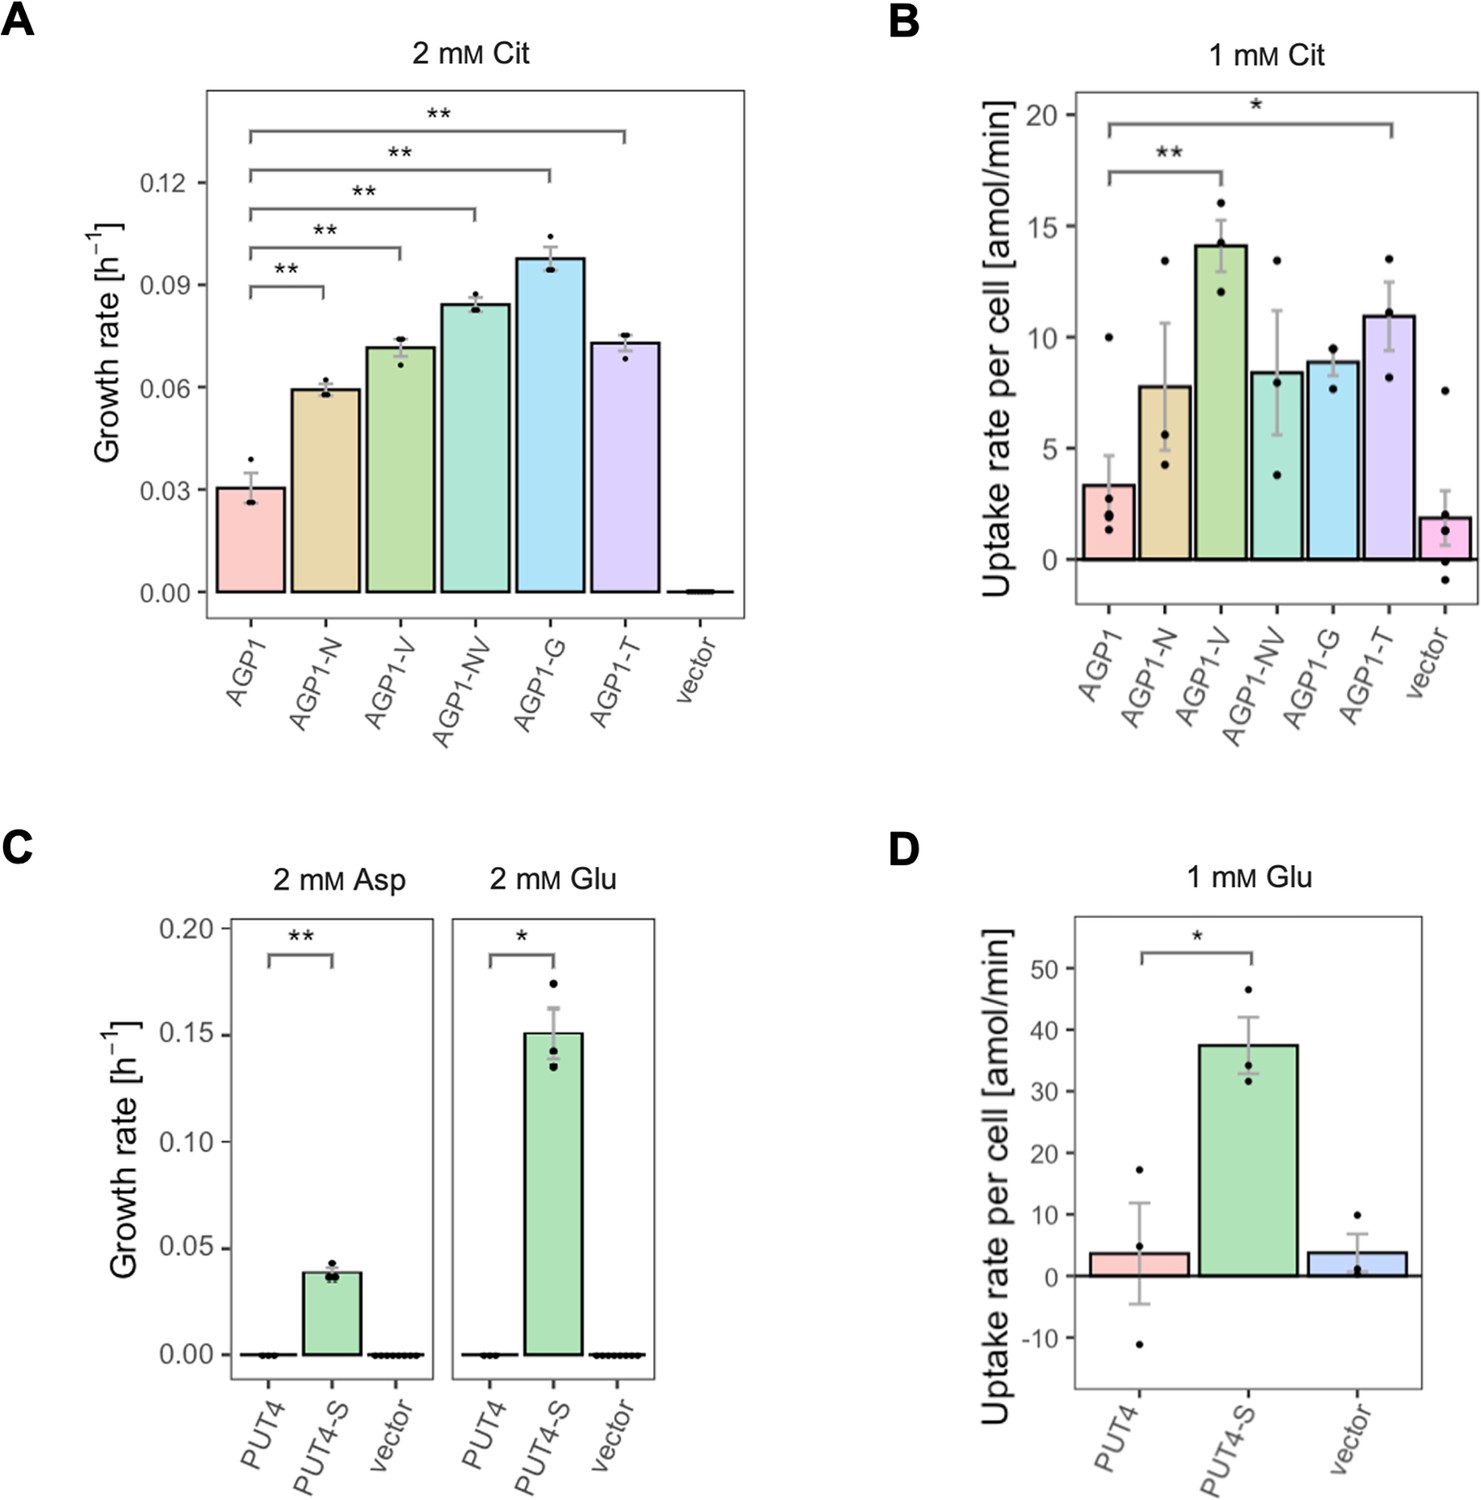
The evolved variants support growth and uptake of the respective amino acids.
(A) Growth rate of the AGP1 variants and the vector control on 2 mM L-citrulline (Cit). Error bars represent the SEM (n≥3). (B) Uptake rate of 1 mM 14C-Cit by whole cells expressing different AGP1 variants or none (vector control). Error bars represent the SEM (n≥3). Asterisks in (A) and (B) indicate the degree of significant difference (one-way ANOVA with a Dunett’s test; **p<0.01, *p<0.05) between the AGP1 variants and wild-type. In case of no significant difference (p>0.05) no asterisks are shown. (C) Growth rate of the PUT4 variants and the vector on 2 mM Asp and Glu. Error bars represent the SEM (n≥3). (D) Uptake rate of 1 mM 14C-Glu by whole cells expressing different PUT4 variants or none (vector control). Error bars represent the SEM (n≥3). Asterisks in (C) and (D) indicate the degree of significant difference in pairwise comparisons between the transporter-expressing variants (Student’s t-test; **p<0.01, *p<0.05).
Figure 3—figure supplement 1
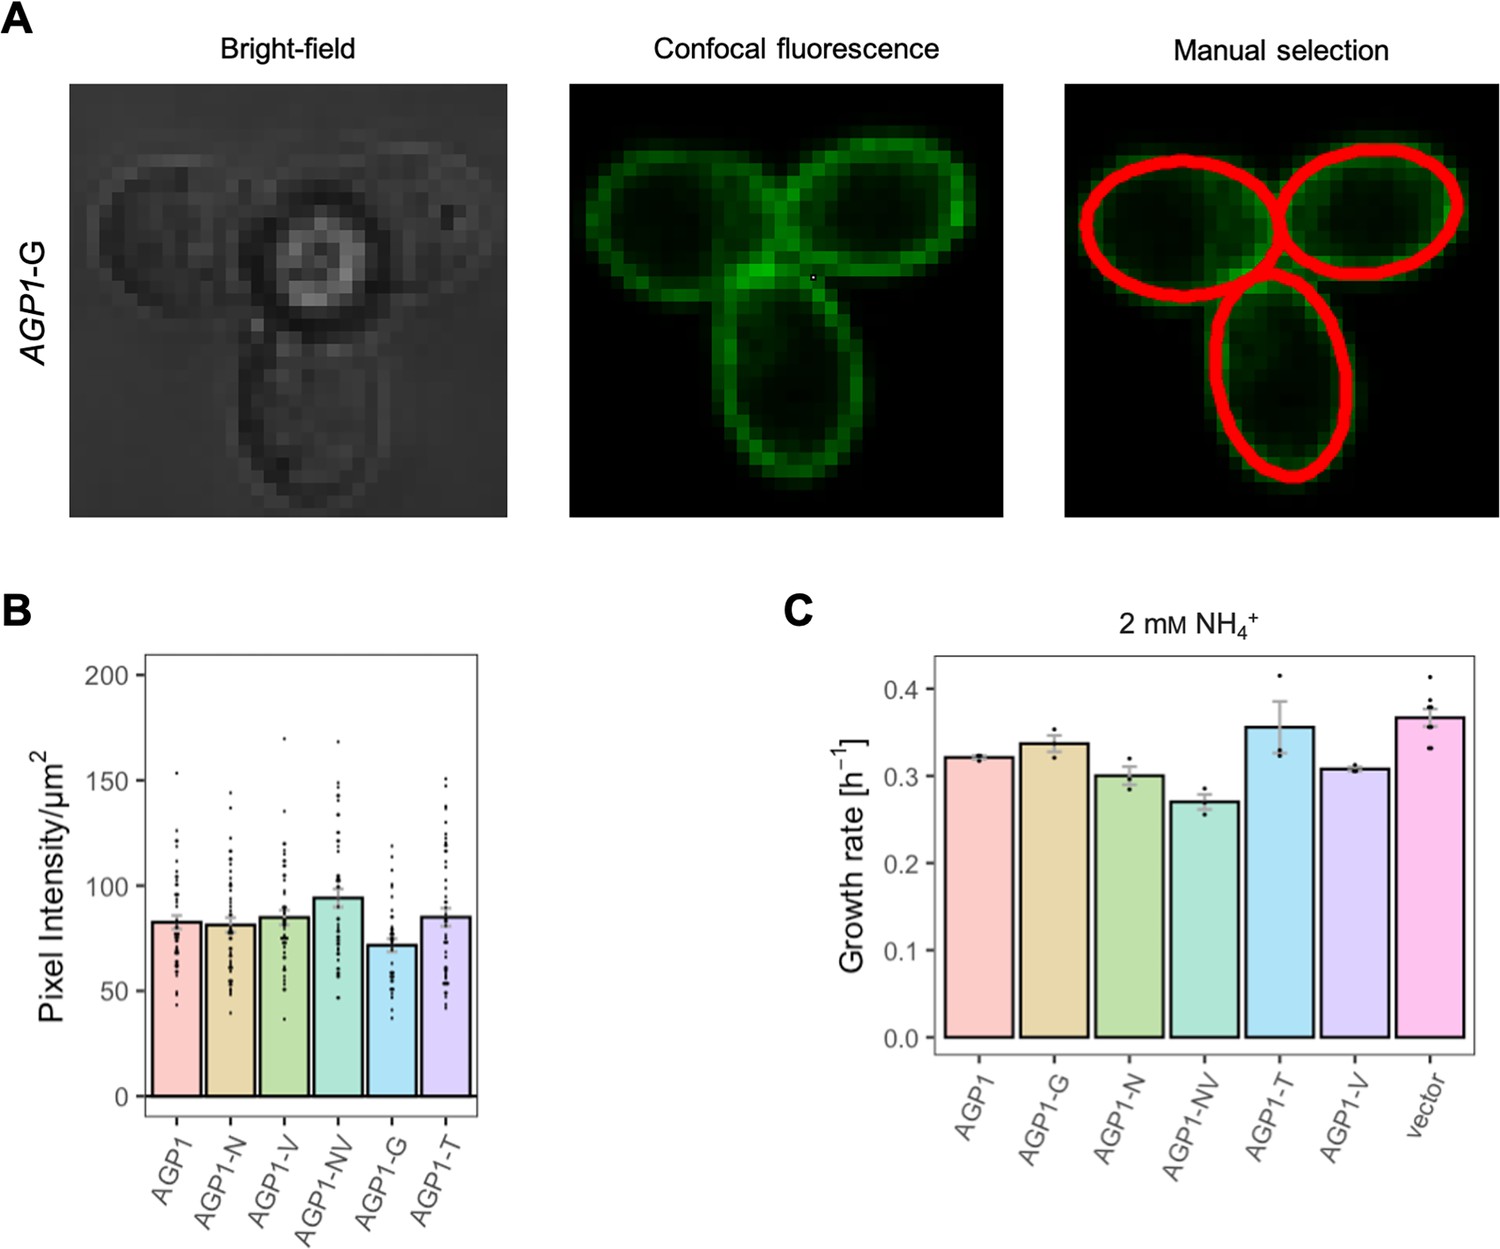
Effects of evolved AGP1 mutations on the surface expression and growth on non-amino acid nitrogen source.
(A) Localization of the AGP1-G variant in whole cells by fluorescence microscopy. The same cells are presented under the bright-field (left) and confocal fluorescence (middle) channels. The manual selection of the periphery of the cells (right) was performed in Fiji with 1 pixel width. (B) Surface expression of the AGP1 variants. Error bars represent the SEM (n=40–50). (C) Growth rate of the AGP1 variants and the vector on 2 mM NH4+. Error bars represent the SEM (n≥3). One-way ANOVA with a Dunett’s test showed no significant difference between the AGP1 variants and wild-type for both (B) and (C).
Figure 3—figure supplement 2
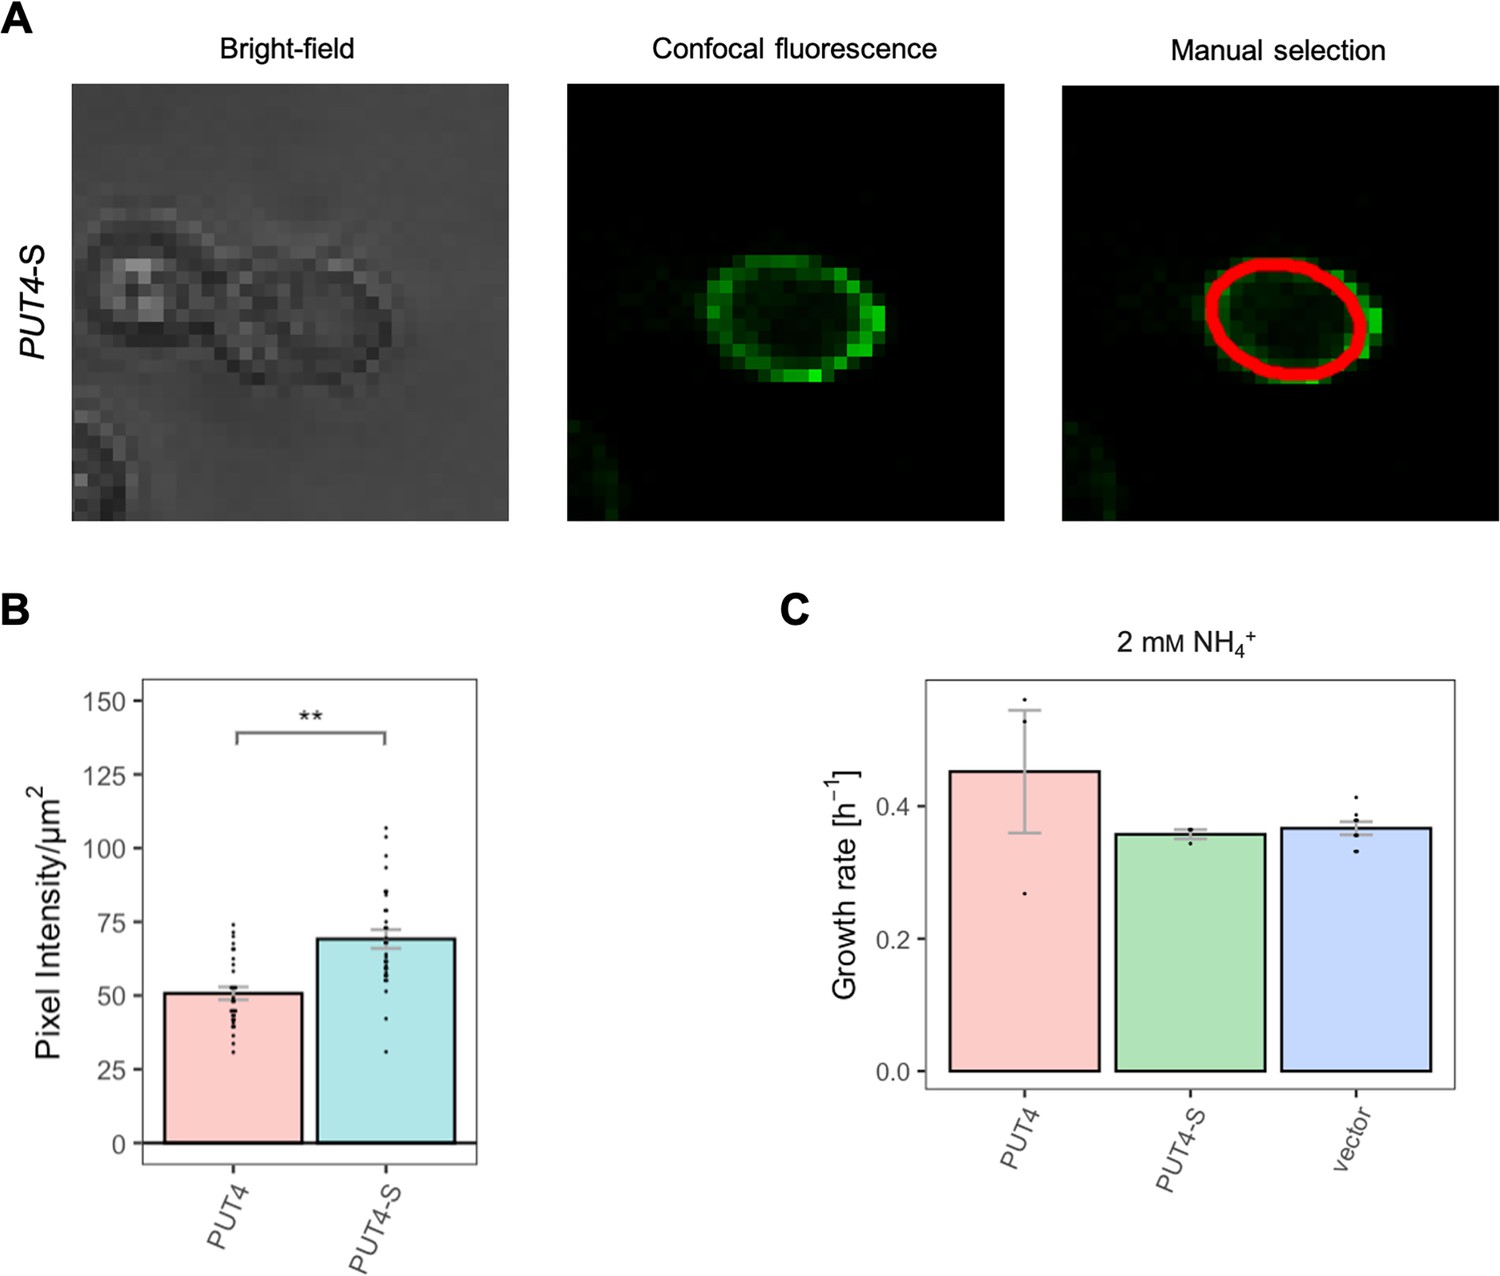
Effects of evolved PUT4-S mutation on the surface expression and growth on non-amino acid nitrogen source.
(A) Localization of the PUT4-S variant in whole cells by fluorescence microscopy. The same cell is presented under the bright-field (left) and confocal fluorescence (middle) channels. The manual selection of the periphery of the cell (right) was performed in Fiji with 1 pixel width. (B) Surface expression of the PUT4 variants. Error bars represent the SEM (n=30). Asterisks indicate the degree of significant difference in pairwise comparison between the transporter-expressing variants (Student’s t-test; **p<0.01, *p<0.05). (C) Growth rate of the PUT4 variants and the vector on 2 mM NH4+. Error bars represent the SEM (n≥3). Pairwise comparison (Student’s t-test) showed no significant difference between the transporter-expressing variants.
Figure 3—figure supplement 3
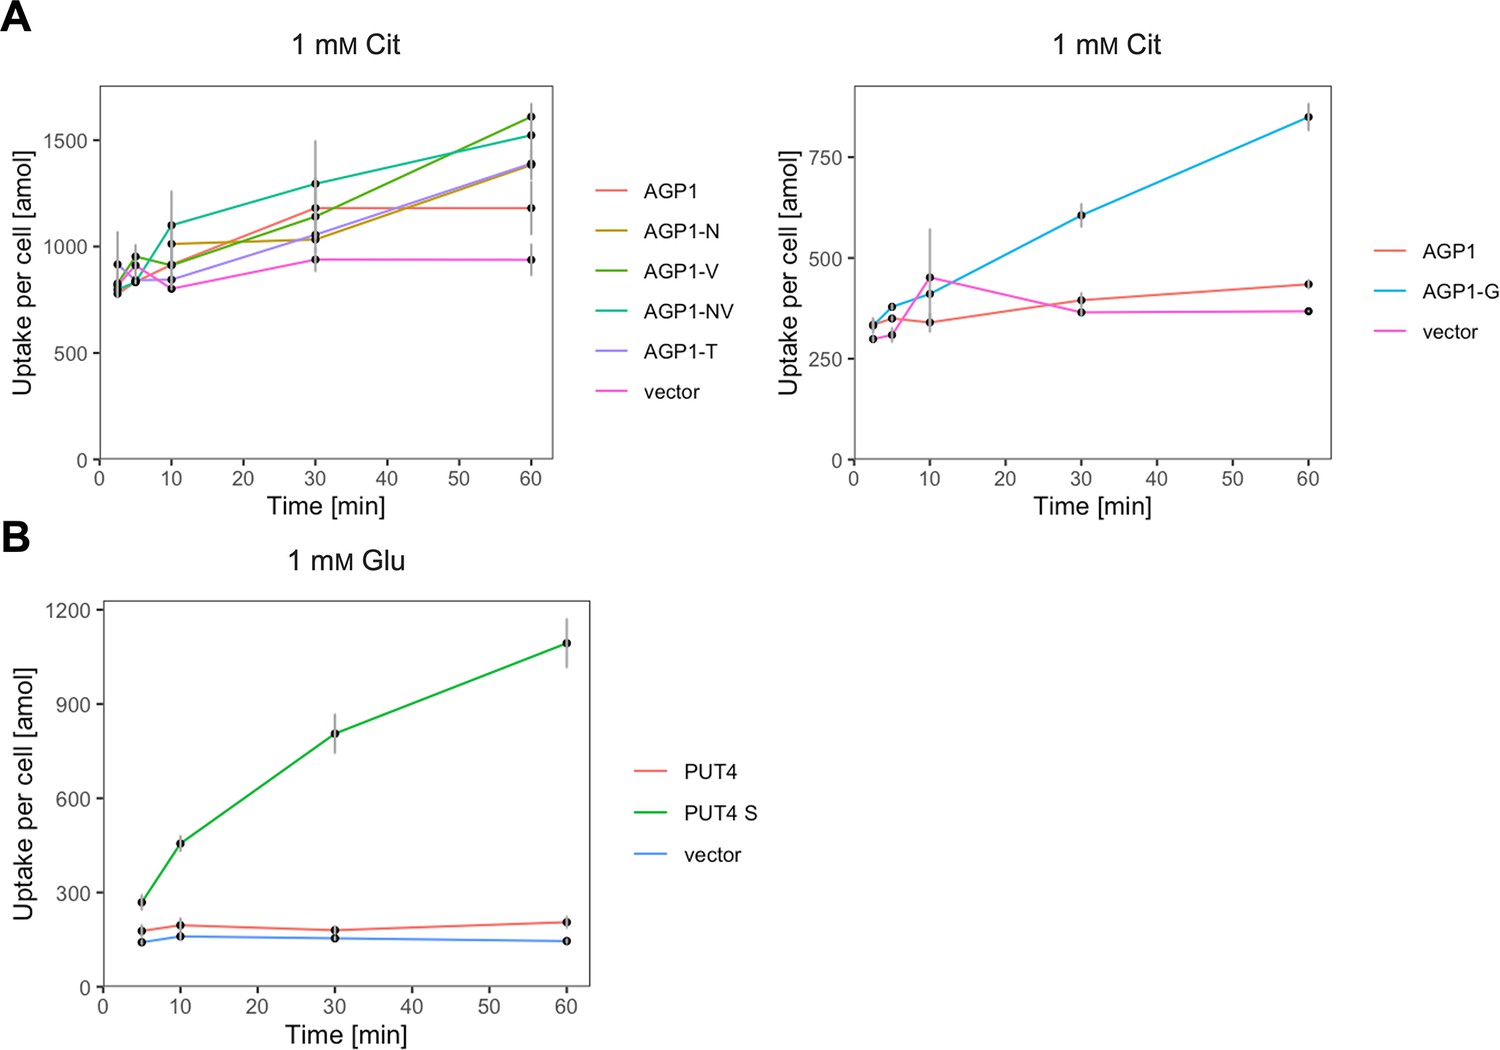
The evolved variants support uptake of the respective amino acids.
(A) Uptake of 1 mM 14C-Cit by whole cells expressing different AGP1 variants or none (vector). Error bars represent the SD (n=3). Each graph represents an independent experiment. (B) Uptake of 1 mM 14C-Glu by whole cells expressing different PUT4 variants or none (vector). Error bars represent the SD (n=3).
Figure 4 with 2 supplements
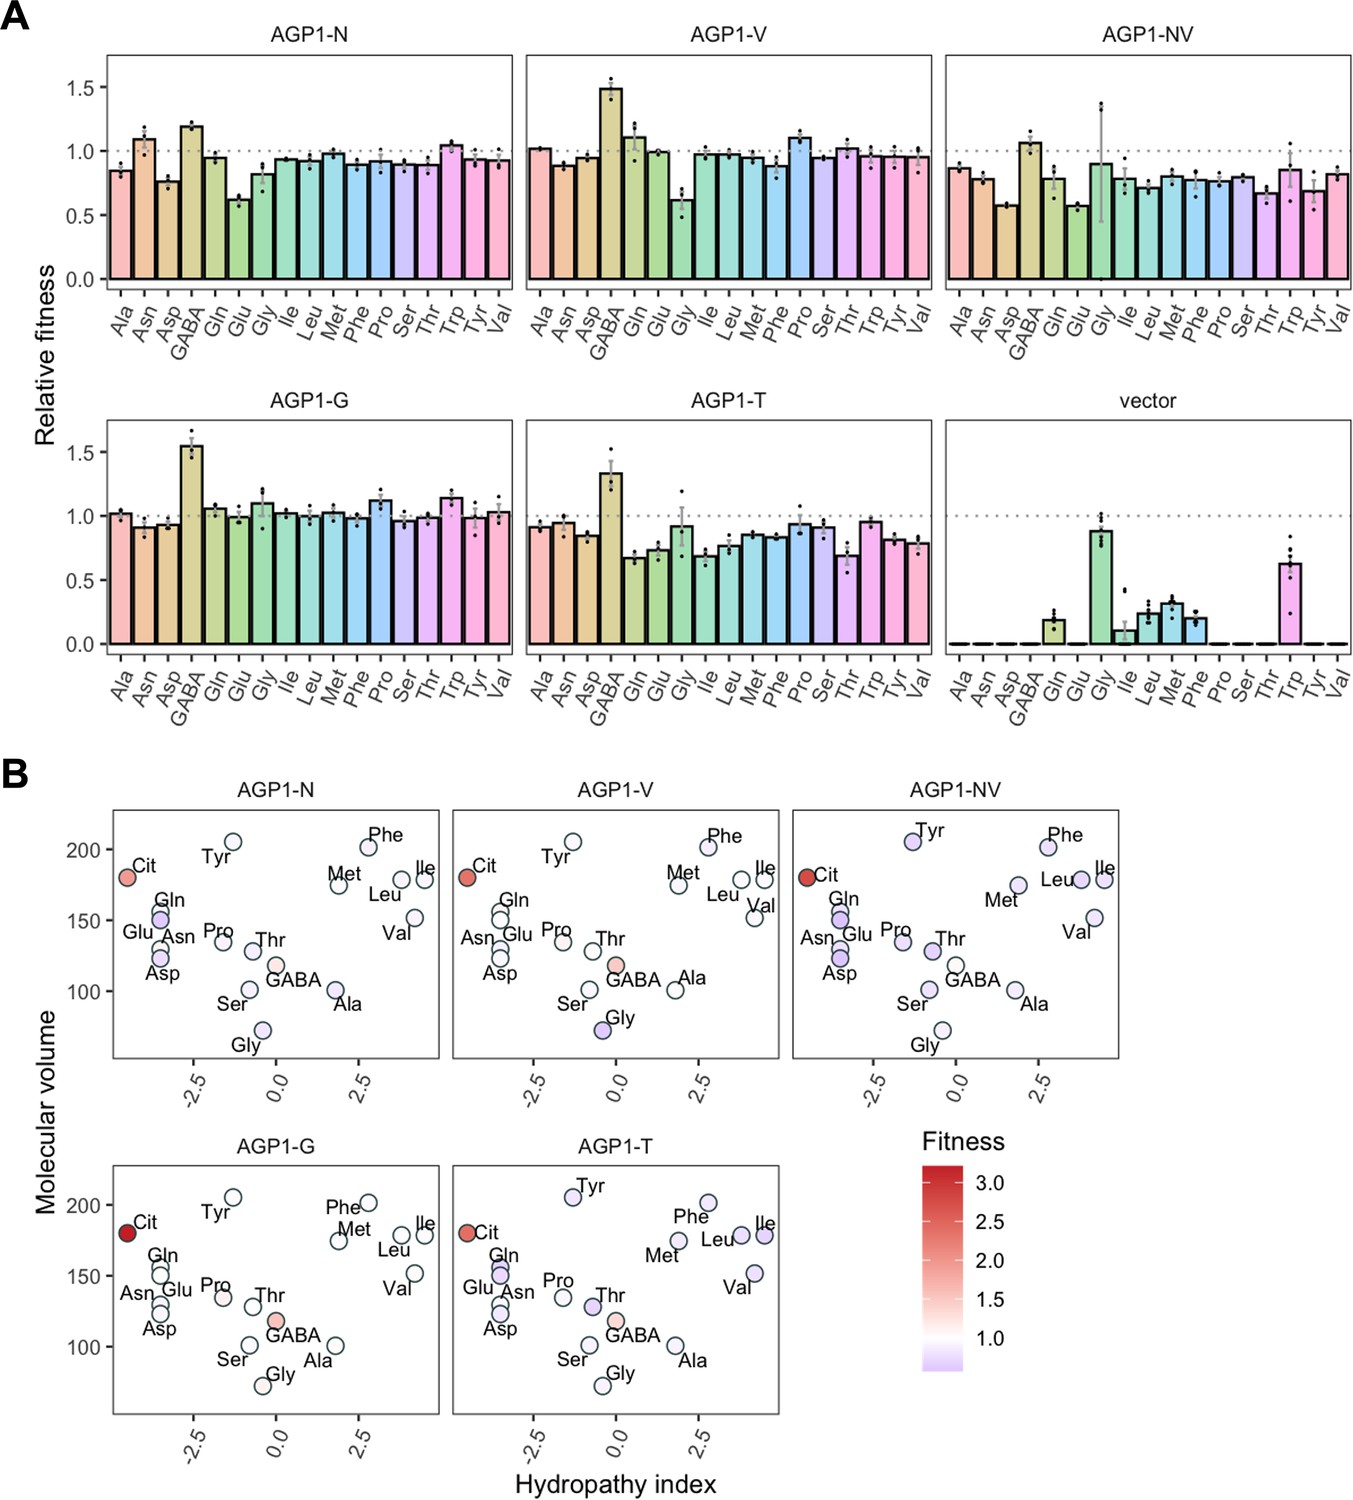
Relative fitness of evolved AGP1 variants.
(A) Relative fitness of AGP1 variants and the control strain for the growth on each of 17 amino acids as the sole nitrogen source. The relative fitness was calculated separately for each amino acid by dividing the growth rate of the mutant by the mean growth rate of the wild-type AGP1. Error bars represent the SEM (n≥3). For the respective growth curves, see Figure 4—figure supplement 1. (B) Mean relative fitness of AGP1 variants per substrate as a function of the amino acid hydropathy index (x axis) and molecular volume (y axis). Color corresponds to relative fitness. The plot is based on the growth rate measurements of panel (A).
Figure 4—figure supplement 1
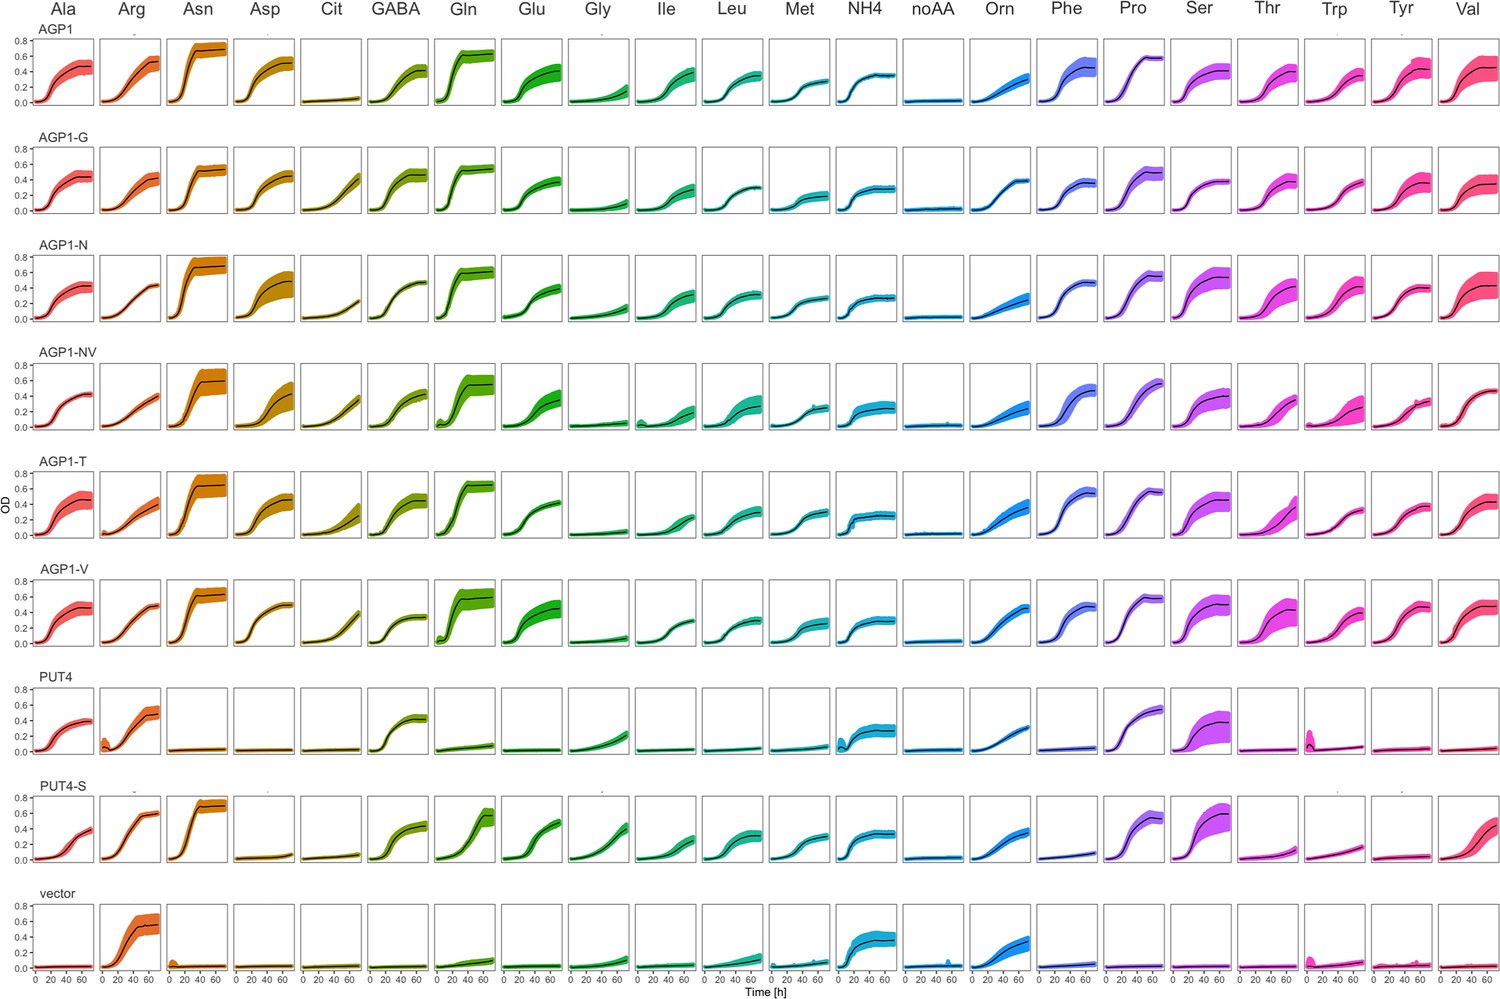
The evolved variants affect the strain’s growth on different amino acids.
Growth curves of Δ10AA expressing either one of the AGP1 and PUT4 variants from pADHXC3GH and the empty vector control on 2 mM of each amino acid. Black lines represent mean values of all measured curves (n≥3). Colored areas represent the SD range.
Figure 4—figure supplement 2
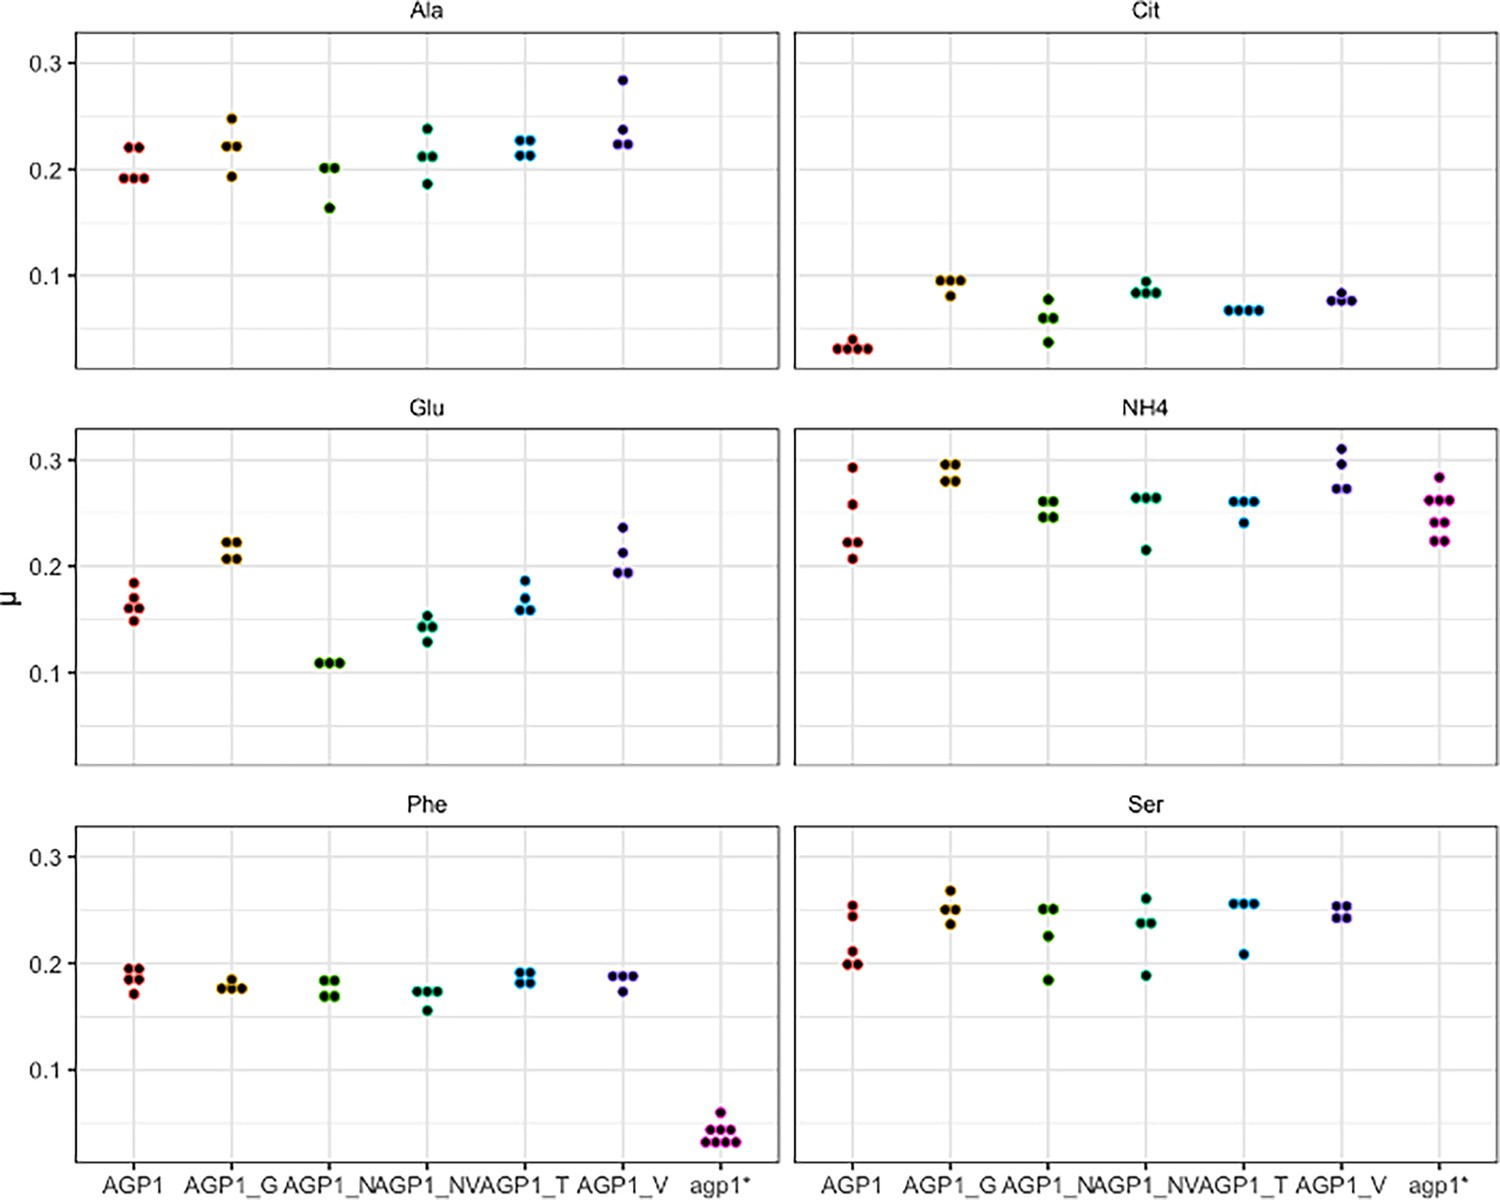
Effects of evolved AGP1 mutations on the growth rate on original substrates.
Repetition of the growth rate (μ) measurements of Δ10AA expressing either one of the AGP1 variants from pADHXC3GH on selected substrates. Each point reflects the growth rate of one replicate culture. Note the slow growth of wild-type AGP1 on Cit.
Figure 5 with 2 supplements
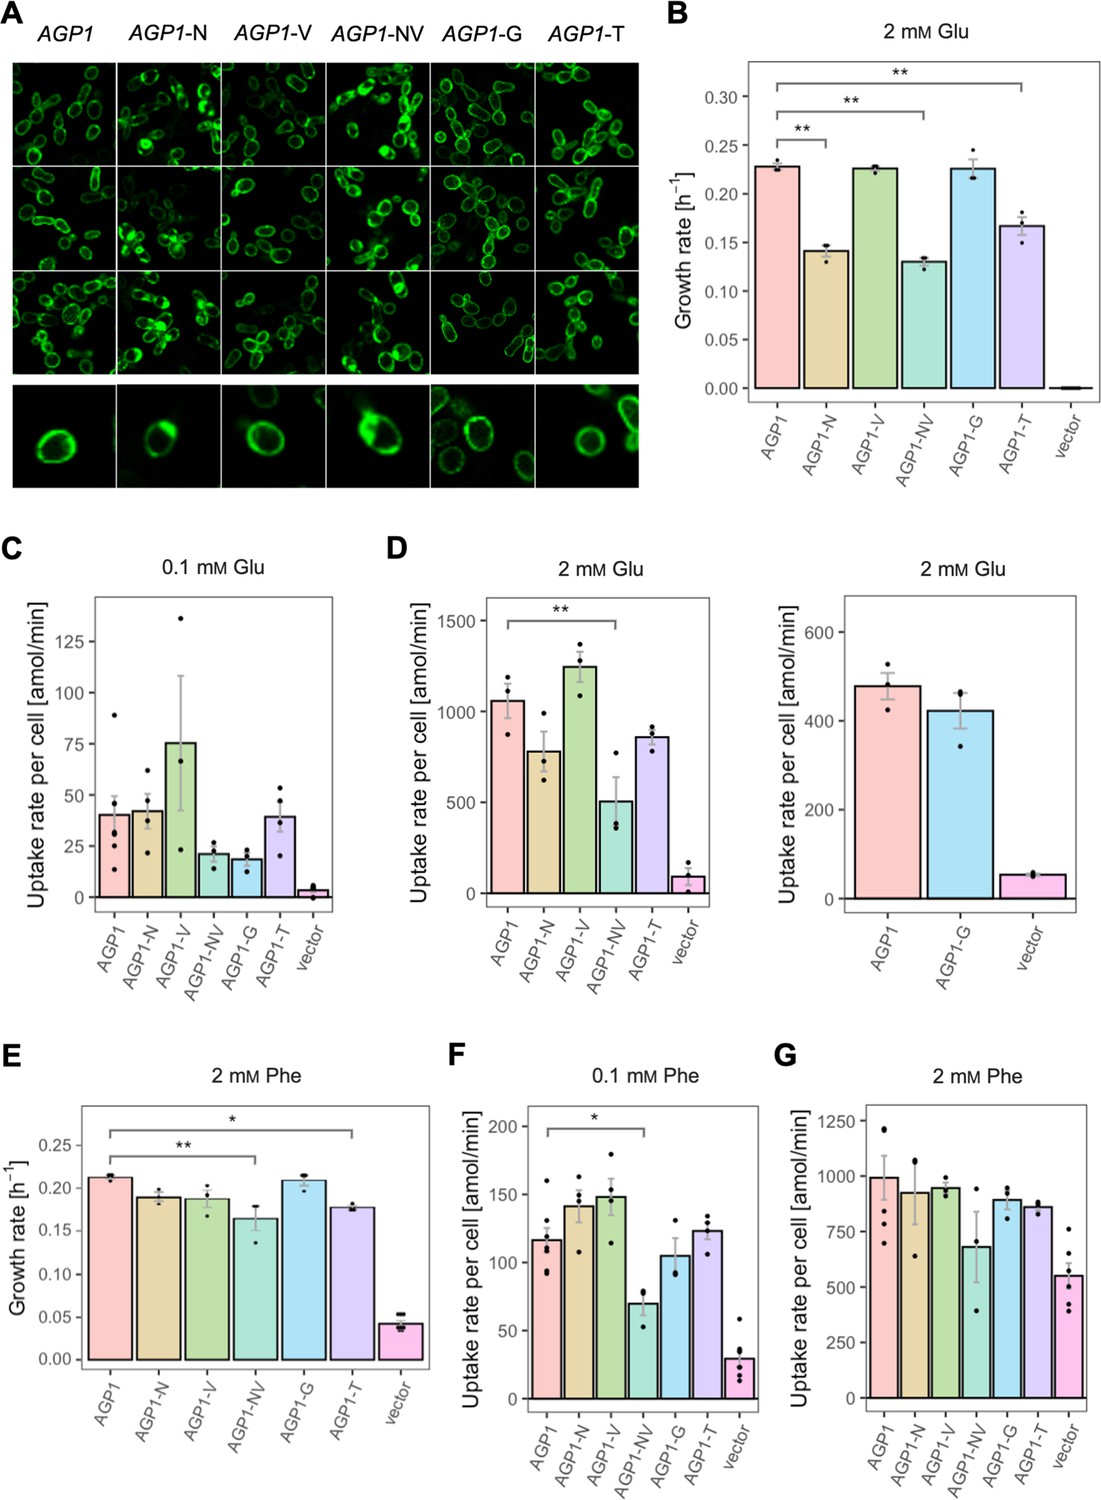
Effects of evolved AGP1 mutations on the growth and uptake of original substrates.
(A) Localization of the AGP1 variants in whole cells, based on replicate samples (different colonies) and analyzed by fluorescence microscopy, including a zoom-in of a representative cell. (B) Growth rate of the AGP1 variants and the vector on 2 mM Glu. Error bars represent the SEM (n≥3). (C–D) Uptake rate of 0.1 (C) and 2 mM (D) 14C-Glu in whole cells expressing different AGP1 variants or none (vector control). In the case of AGP1-G, the assay was performed with 2 mM 3H-Glu and is presented as independent experiment. Error bars represent the SEM (n≥3). (E) Growth rate of the AGP1 variants and the vector control on 2 mM Phe. Error bars represent the SEM (n≥3). (F–G) Uptake rate of 0.1 (F) and 2 mM (G) 14C-Phe in whole cells expressing different AGP1 variants or none (vector control). Error bars represent the SEM (n≥3). Asterisks in (B–G) indicate the degree of significant difference (one-way ANOVA with a Dunett’s test; **p<0.01, *p<0.05) between the AGP1 variants and wild-type. In case of no significant difference (p>0.05), no asterisks are shown. For the respective uptake curves, see Figure 5—figure supplement 1.
Figure 5—figure supplement 1
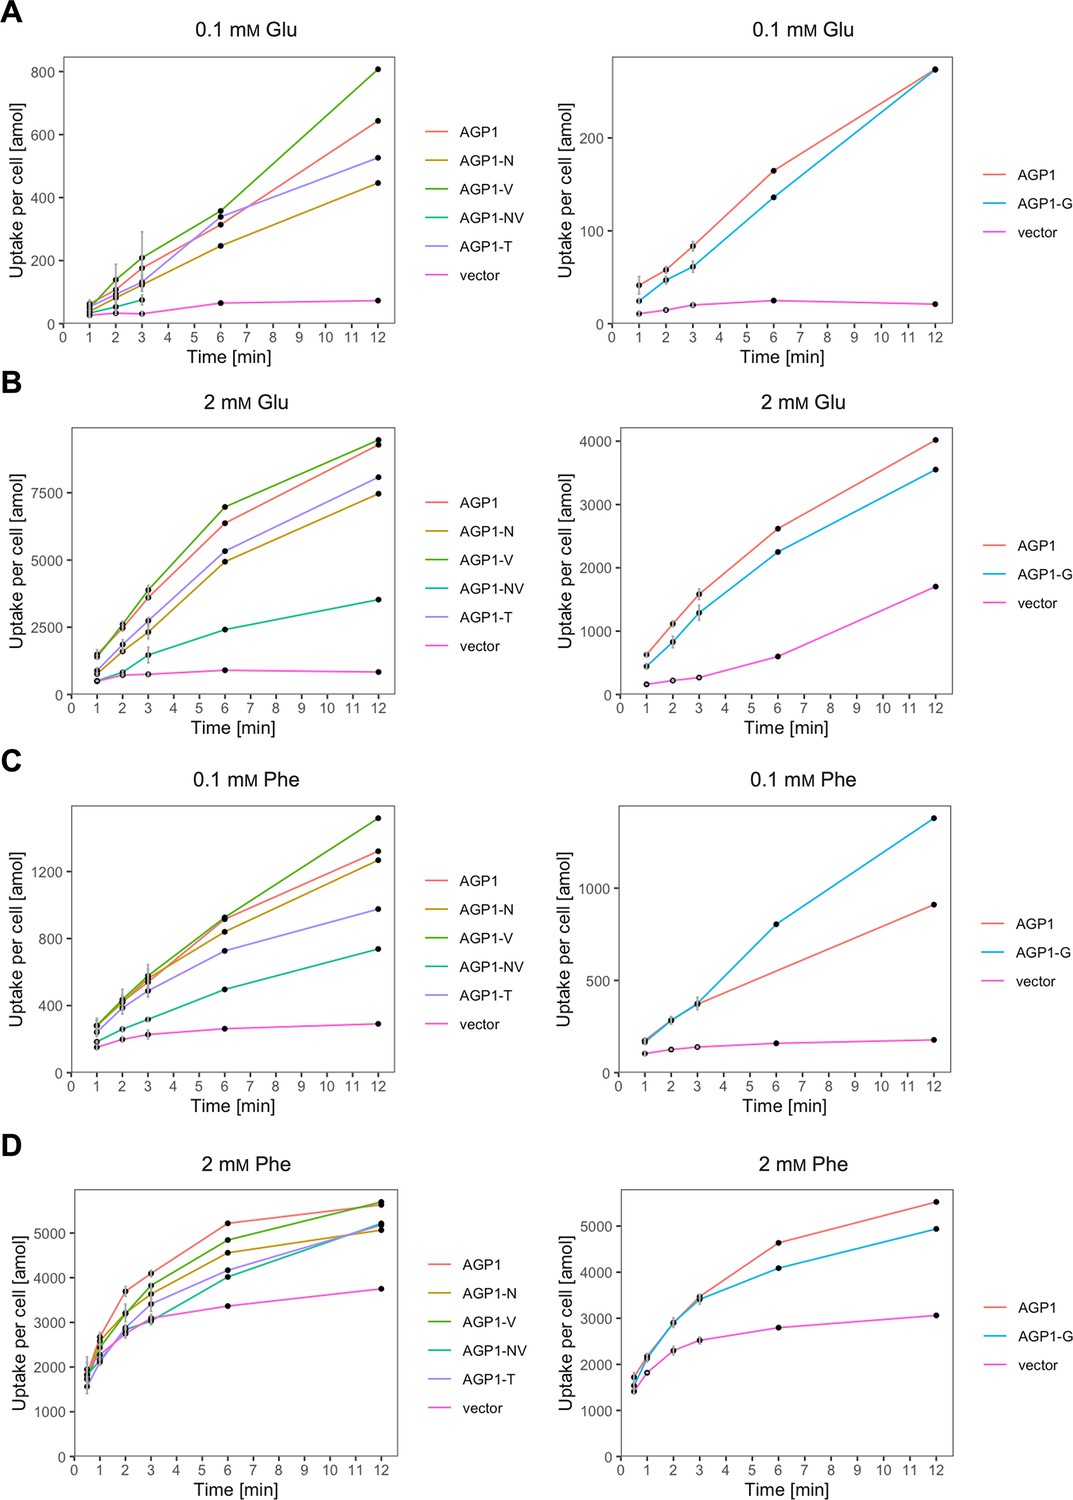
The evolved AGP1 variants support uptake of original substrates.
Uptake of 0.1 mM 14C-Glu (A), 2 mM 14C-Glu (B; left), or 3H-Glu (B; right), 0.1 mM 14C-Phe (C), 2 mM 14C-Phe (D) by whole cells expressing different AGP1 variants or none (vector). Error bars represent the SD (n=3). Each graph represents an independent experiment from the uptakes described in Figure 5.
Figure 5—figure supplement 2
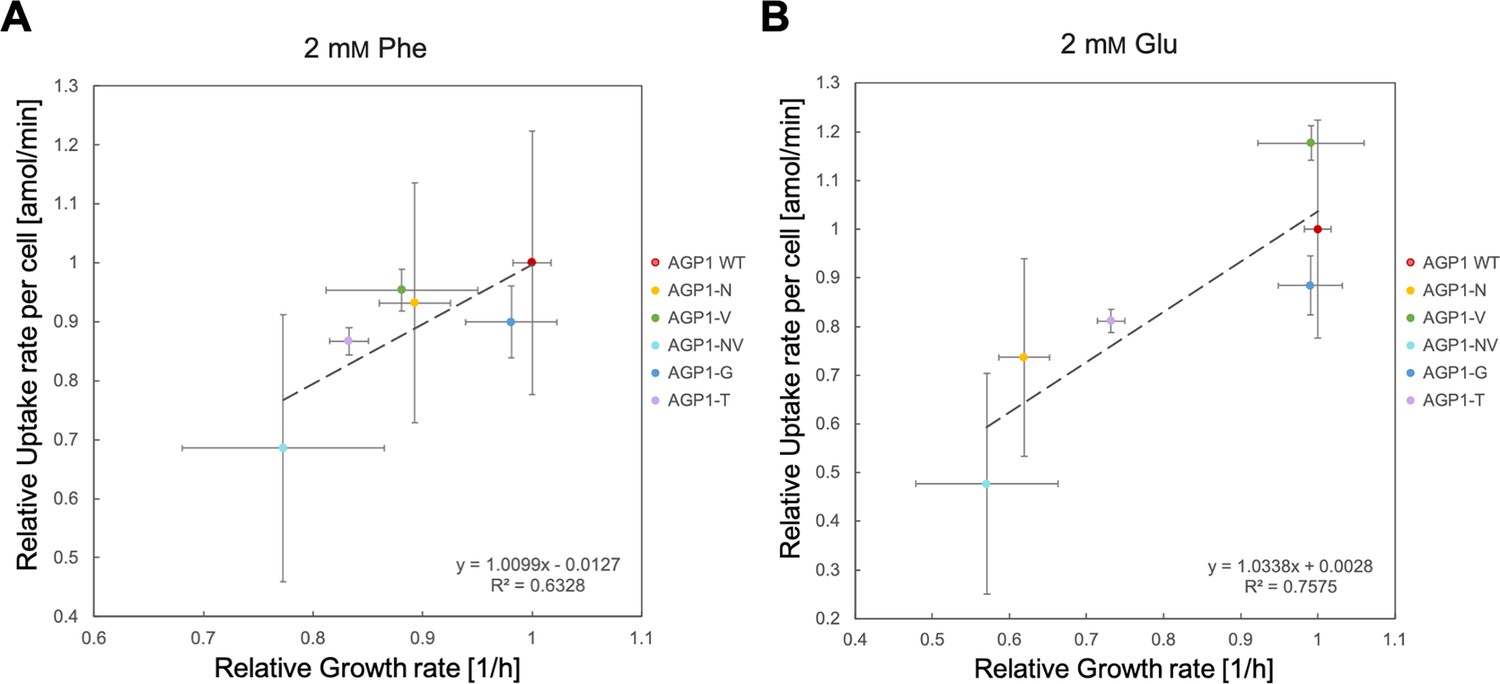
Correlation between the fitness and uptake of original substrates for the evolved AGP1 variants.
The uptake rate and growth rate on 2 mM Phe (A) or Glu (B) for the evolved AGP1 variants is presented relative to that of cells expressing the wild-type protein. Error bars represent the SD (n≥3). The correlation is described by the linear regression trendline and the equation is shown in the graph.
Figure 6 with 1 supplement
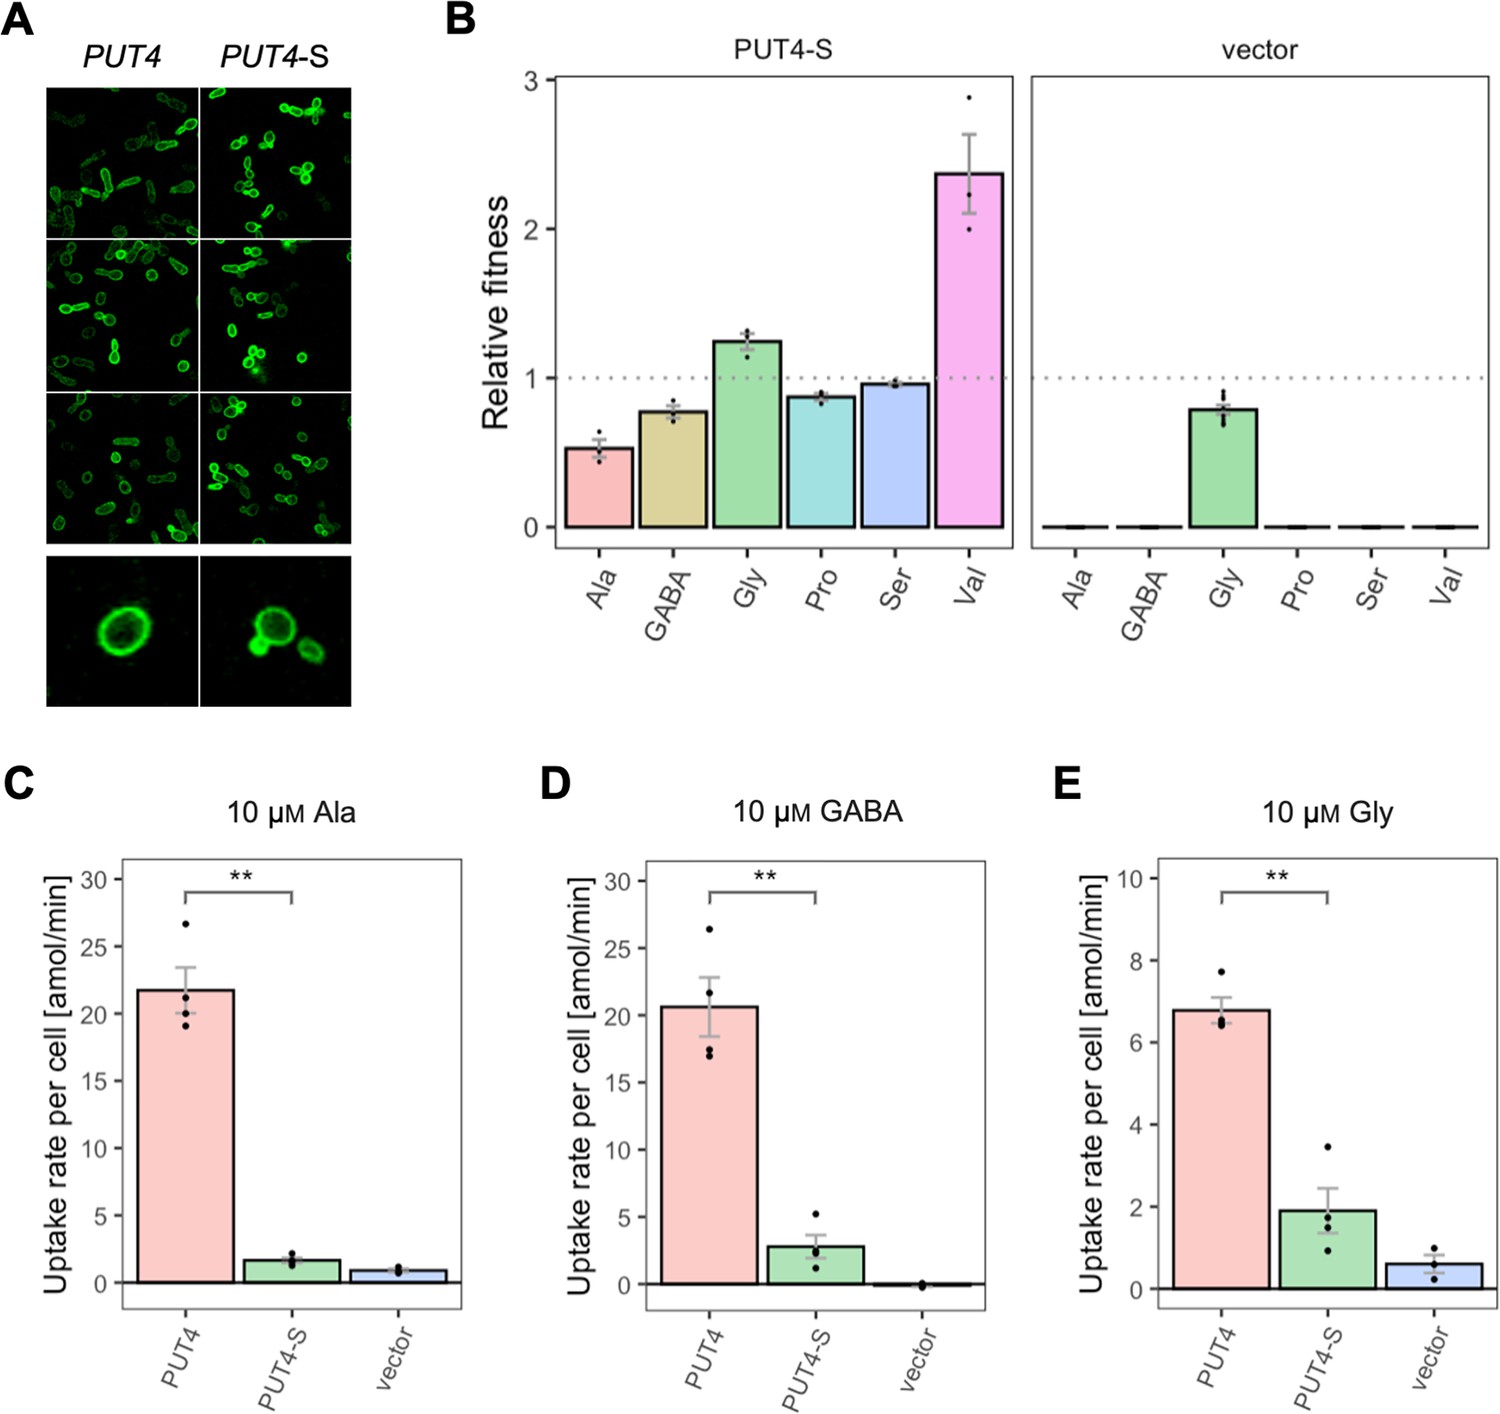
Effects of evolved PUT4-S mutation on the growth and uptake of original substrates.
(A) Localization of the PUT4 variants in whole cells, based on replicate samples (different colonies) and analyzed by fluorescence microscopy, including a zoom-in of a representative cell. (B) Relative fitness of PUT4-S and the vector for the growth on six amino acids as the sole nitrogen source. The relative fitness was calculated separately for each amino acid by dividing the growth rate of the mutant by the mean growth rate of the wild-type PUT4. Error bars represent the SEM (n≥3). For the respective growth curves, see Figure 4—figure supplement 1. (C–E) Uptake rate of 10 μM 14C-Ala (C), γ-amino butyric acid (GABA) (D), or Gly (E) in whole cells expressing PUT4 variants or none (vector). Error bars represent the SEM (n≥3). Asterisks in (C–E) indicate the degree of significant difference in pairwise comparisons between the transporter-expressing variants (Student’s t-test; **p<0.01, *p<0.05). For the respective uptake curves, see Figure 6—figure supplement 1.
Figure 6—figure supplement 1
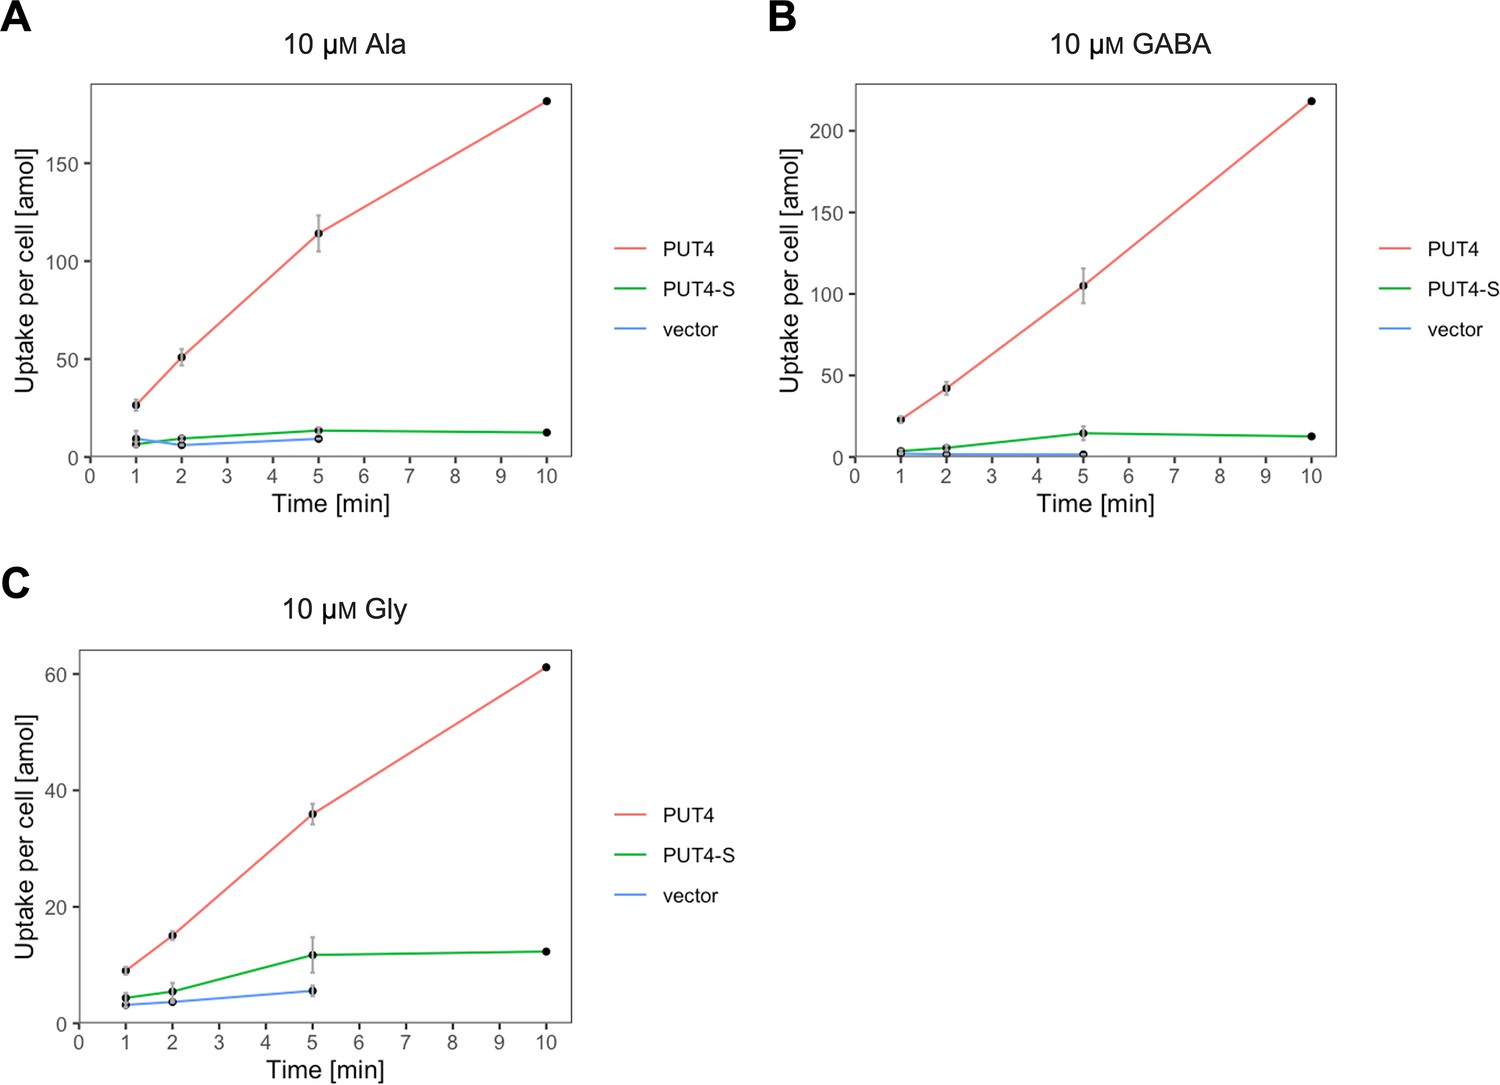
The evolved PUT4 variant supports uptake of original substrates.
Uptake of 10 μM 14C-Ala (A), γ-amino butyric acid (GABA) (B), or Gly (C) by whole cells expressing different PUT4 variants or none (vector). Error bars represent the SD (n=3). Each graph represents an independent experiment from the uptakes described in Figure 6.
Figure 7
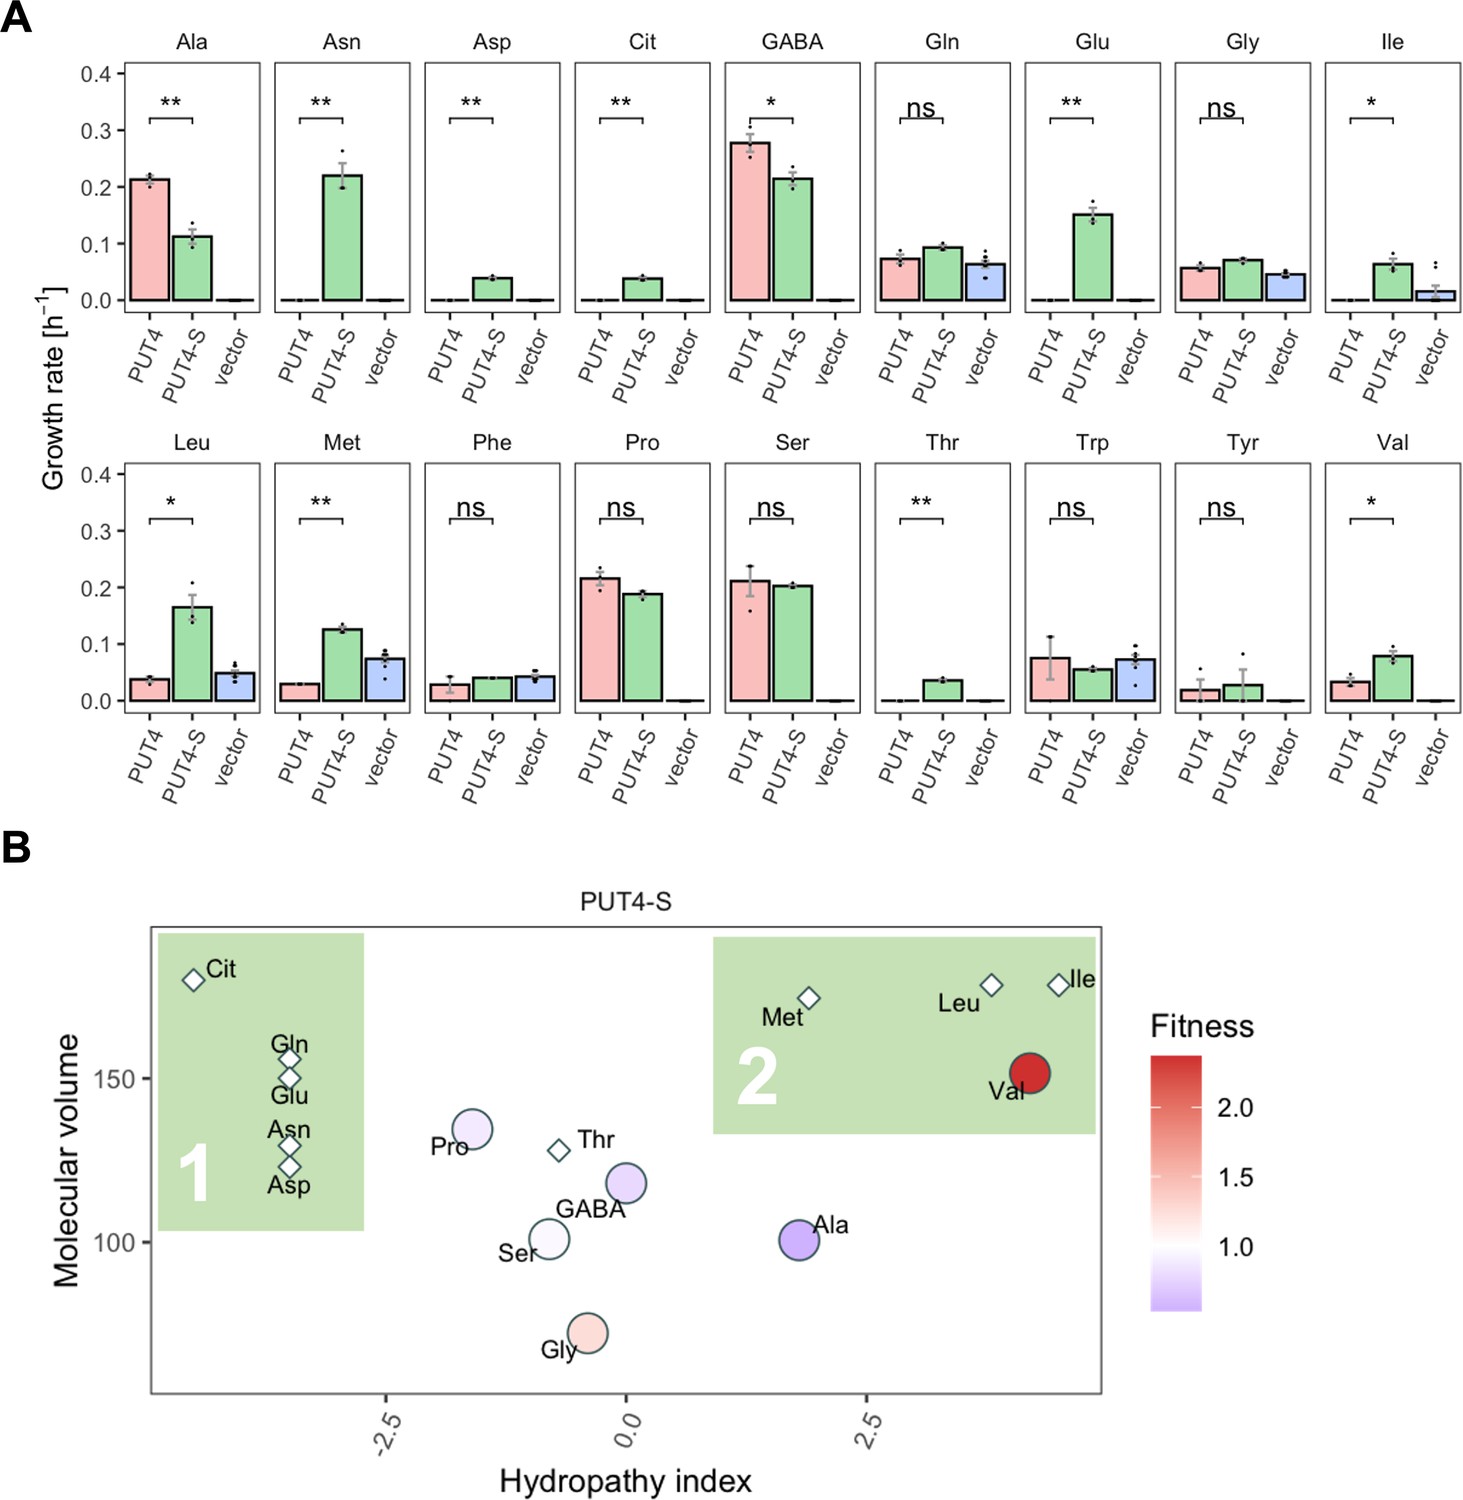
The evolved PUT4-S mutation broadens the substrate range of the transporter.
(A) Growth rate measurements of PUT4 variants and the vector control on 2 mM of 18 different amino acids as the sole nitrogen source. Error bars represent the SEM (n≥3). Asterisks indicate the degree of significant difference in pairwise comparisons (Student’s t-test; **p<0.01, *p<0.05). For the respective growth curves, see Figure 4—figure supplement 1. (B) Mean relative fitness of PUT4-S per substrate as a function of the amino acid hydropathy index (x axis) and molecular volume (y axis). Diamond shapes indicate novel substrates not found in the wild-type PUT4. Color corresponds to relative fitness. The plot is based on the same growth rate measurements as (A).
Tables
Table 1
Substrate range of transporters used in this study.
Only amino acids showing a significantly higher growth rate than the vector control (ANOVA with Dunnett’s test against vector, p<0.05) are shown. Substrates newly identified in this study are underscored. Substrates with an asterisk cannot be used as the sole N-source by S. cerevisiae. For AGP1, L-citrulline (Cit) was verified as an actual substrate in a separate experiment (Figure 4—figure supplement 2) because of a very low growth rate.
| Transporter gene | Uniprot accession number (UniProt Consortium, 2023) | Substrates described in literature (reviewed in Bianchi et al., 2019) | Substrates found in the present study |
|---|---|---|---|
| AGP1 | P25376 | Ala, Asn, Asp, Cys*, Gln, Glu, Gly, His*, Ile, Leu, Met, Phe, Pro, Ser, Thr, Trp, Tyr, Val, GABA | Ala, Asn, Asp, GABA, Gln, Glu, Ile, Leu, Met, Phe, Pro, Ser, Thr, Trp, Tyr, Val, (Cit) |
| BAP2 | P38084 | Ala, Cys*, Ile, Leu, Met, Phe, Tyr, Val | Ala, Asn, Asp, Cit, Gln, Glu, Gly, Ile, Leu, Met, Phe, Pro, Ser, Thr, Tyr, Val |
| CAN1 | P04817 | Arg, His*, Lys*, Orn, Ser | – |
| HIP1 | P06775 | His* | – |
| LYP1 | P32487 | Lys*, Met | Ala, Asn, Met, Phe, Ser, Val |
| MMP1 | Q12372 | S-Methylmethionine* | Val |
| PUT4 | P15380 | Ala, Gly, Pro, GABA | Ala, GABA, Pro, Ser, Val |
Table 2
Evolved AGP1-Cit variants and PUT4-Asp and -Glu variants.
| Evolved variant | Nucleotide substitutions (nonsynonymous in bold) | Amino acid substitutions | Abbreviated names of site-directed mutants |
|---|---|---|---|
| AGP1-Cit1 | T117C T1001A T1191A A1234G T1329C C1461G T1899C | I334N (=N) I412V (=V) | AGP1-N AGP1-V AGP1-NV AGP1-G AGP1-T |
| AGP1-Cit3 | T117C A308G T915C T1001A C1451G C1461G T1684C | D103G I334N (=N) A484G (=G) F562L | |
| AGP1-Cit11 | T111C T121C G1450A A1609G | S41P A484T (=T) I537V | |
| PUT4-Asp1 | T620C T1474C | L207S (=S) F492L | PUT4-S |
| PUT4-Asp2 | T620C T1415C T1474C | L207S (=S) V472A F492L | |
| PUT4-Asp3 | T191C T620C C734T G956A | I64T L207S (=S) S245F G319D | |
| PUT4-Glu1 | G225A T620C | L207S (=S) | |
| PUT4-Glu2 | T191C T620C G956A | I64T L207S (=S) G319D | |
| PUT4-Glu3 | T191C T620C | I64T L207S (=S) |
Table 3
Substrates of AGP1 strains with statistically significant relative fitness differences.
One-way ANOVA with a Dunnett’s test with AGP1 wild-type as the control group was used with a cutoff of p<0.05. Overall relative fitness estimates are calculated from the mean of growth rates on 17 original substrates relative to the wild-type.
| AGP1 variant | Substrates with significantly increased relative fitness | Substrates with significantly decreased relative fitness | Overall relative fitness (mean of 17 original substrates) | Relative fitness on Cit |
|---|---|---|---|---|
| AGP1-N | Ala, Asp, Glu | 0.92 | 1.9 | |
| AGP1-V | GABA | 0.98 | 2.4 | |
| AGP1-NV | Ala, Asn, Asp, Glu, Ile, Leu, Met, Phe, Pro, Ser, Thr, Tyr | 0.78 | 2.8 | |
| AGP1-G | GABA | 1.0 | 3.2 | |
| AGP1-T | Asp, Gln, Glu, Ile, Leu, Met, Phe, Thr, Val | 0.86 | 2.4 |
Key resources table
| Reagent type (species) or resource | Designation | Source or reference | Identifiers | Additional information |
|---|---|---|---|---|
| Strain, strain background (Saccharomyces cerevisiae) | Δ10AA (original name 22Δ10AAα) | Gift from Guillaume Pilot (Besnard et al., 2016) | MATa gap1-1 put4-1 uga4-1 Δcan1::HisGΔlyp1-alp1::HisGΔhip1::HisGΔdip5::HisG Δgnp1Δagp1 ura3-1 | The original 22Δ10AAα strain was labeled as MATα, but was found to be MATa in our laboratory (data not shown). |
| Strain, strain background (Saccharomyces cerevisiae) | Δ10ΔUH | This paper derived from Δ10AA | MATa gap1-1 put4-1 uga4-1 Δcan1::HisGΔlyp1-alp1::HisGΔhip1::HisGΔdip5::HisG Δgnp1Δagp1Δura3::loxP Δhis3::kanMX | The original 22Δ10AAα strain was labeled as MATα, but was found to be MATa in our laboratory (data not shown). Strains can be requested from the corresponding authors. |
| Strain, strain background (Saccharomyces cerevisiae) | Δ10ΔUH pAR-Ec611 | This paper | Δ10ΔUH pAR-Ec611 (HIS3) | Strains can be requested from the corresponding authors. |
| Strain, strain background (Saccharomyces cerevisiae) | Δ10ΔUH evol-AGP1 | This paper | Δ10ΔUH pAR-Ec611 (HIS3)+p1::AGP1YPet (URA3)+p2 | Strains can be requested from the corresponding authors. |
| Strain, strain background (Saccharomyces cerevisiae) | Δ10ΔUH evol-PUT4 | This paper | Δ10ΔUH pAR-Ec611 (HIS3)+p1::PUT4YPet (URA3)+p2 | Strains can be requested from the corresponding authors. |
| Strain, strain background (Saccharomyces cerevisiae) | Δ10AA pADHXC3GH-GOIs | This paper | Strains containing the pADHXC3GH plasmids containing various genes of interest, see plasmids | Strains can be requested from the corresponding authors. |
| Strain, strain background (Saccharomyces cerevisiae) | GA-Y319 | Gift from Chang Liu | MATa can1 his3 Δleu2Δura3Δtrp1 flo1+p1+p2 | |
| Recombinant DNA reagent | FDP-P10B2-A75-RZ-URA3 (plasmid) | Gift from Chang Liu (Addgene plasmid # 130874) | Plasmid containing the integration cassette for p1, the 10B2 artificial promoter, a hardcoded poly-A tail, and an URA3 selection marker | |
| Recombinant DNA reagent | FDP-AGP1YPet (plasmid) | This paper | Integration cassette for p1; derived from FDP-P10B2-A75-RZ-URA3, where the mKate gene was replaced by AGP1 with an N-terminal YPet fluorescent tag | Sequences are deposited in https://zenodo.org/records/10928101. Vectors can be requested from the corresponding authors. |
| Recombinant DNA reagent | FDP-PUT4YPet (plasmid) | This paper | Integration cassette for p1; derived from FDP-P10B2-A75-RZ-URA3, where the mKate gene was replaced by PUT4 with an N-terminal YPet fluorescent tag | Sequences are deposited in https://zenodo.org/records/10928101. Vectors can be requested from the corresponding authors. |
| Recombinant DNA reagent | pAR-Ec611 (plasmid) | Gift from Chang Liu (Addgene plasmid # 130872) | Error-prone TP-DNA polymerase 1 | |
| Recombinant DNA reagent | pYEXC3GH (plasmid) | Gift from Raimund Dutzler and Eric Geertsma (Addgene plasmid # 49027) | Saccharomyces cerevisiae expression vector for FX cloning | |
| Recombinant DNA reagent | pADHXC3GH (plasmid) | This paper | Derived from pYEXC3GH, where the GAL1 promoter was exchanged for the constitutive Saccharomyces cerevisiae ADH promoter. The GOI is expressed as a fusion protein with N-terminal 3C cleavage site, yeGFP, and His10 tag | Sequences are deposited in https://zenodo.org/records/10928101. Vectors can be requested from the corresponding authors. |
| Recombinant DNA reagent | pADHXC3GH-AGP1 (plasmid) | This paper | Sequences are deposited in https://zenodo.org/records/10928101. Vectors can be requested from the corresponding authors. | |
| Recombinant DNA reagent | pADHXC3GH-BAP2 (plasmid) | This paper | Sequences are deposited in https://zenodo.org/records/10928101. Vectors can be requested from the corresponding authors. | |
| Recombinant DNA reagent | pADHXC3GH-CAN1 (plasmid) | This paper | Sequences are deposited in https://zenodo.org/records/10928101. Vectors can be requested from the corresponding authors. | |
| Recombinant DNA reagent | pADHXC3GH-HIP1 (plasmid) | This paper | Sequences are deposited in https://zenodo.org/records/10928101. Vectors can be requested from the corresponding authors. | |
| Recombinant DNA reagent | pADHXC3GH-LYP1 (plasmid) | This paper | Sequences are deposited in https://zenodo.org/records/10928101. Vectors can be requested from the corresponding authors. | |
| Recombinant DNA reagent | pADHXC3GH-MMP1 (plasmid) | This paper | Sequences are deposited in https://zenodo.org/records/10928101. Vectors can be requested from the corresponding authors. | |
| Recombinant DNA reagent | pADHXC3GH-PUT4 (plasmid) | This paper | Sequences are deposited in https://zenodo.org/records/10928101. Vectors can be requested from the corresponding authors. | |
| Recombinant DNA reagent | pADHXC3GH-AGP1-N (plasmid) | This paper | T1001A=I334N | Sequences are deposited in https://zenodo.org/records/10928101. Vectors can be requested from the corresponding authors. |
| Recombinant DNA reagent | pADHXC3GH-AGP1-V (plasmid) | This paper | A1234G=I412V | Sequences are deposited in https://zenodo.org/records/10928101. Vectors can be requested from the corresponding authors. |
| Recombinant DNA reagent | pADHXC3GH-AGP1-NV (plasmid) | This paper | T1001A, A1234G=I334N, I412V | Sequences are deposited in https://zenodo.org/records/10928101. Vectors can be requested from the corresponding authors. |
| Recombinant DNA reagent | pADHXC3GH-AGP1-G (plasmid) | This paper | C1451G=A484G | Sequences are deposited in https://zenodo.org/records/10928101. Vectors can be requested from the corresponding authors. |
| Recombinant DNA reagent | pADHXC3GH-AGP1-T (plasmid) | This paper | G1450A=A484T | Sequences are deposited in https://zenodo.org/records/10928101. Vectors can be requested from the corresponding authors. |
| Recombinant DNA reagent | pADHXC3GH-PUT4-S (plasmid) | This paper | T620C=L207S | Sequences are deposited in https://zenodo.org/records/10928101. Vectors can be requested from the corresponding authors. |
Additional files
Download links
A two-part list of links to download the article, or parts of the article, in various formats.
Downloads (link to download the article as PDF)
Open citations (links to open the citations from this article in various online reference manager services)
Cite this article (links to download the citations from this article in formats compatible with various reference manager tools)
Fitness landscape of substrate-adaptive mutations in evolved amino acid-polyamine-organocation transporters
eLife 13:RP93971.
https://doi.org/10.7554/eLife.93971.3


