Ethnic and region-specific genetic risk variants of stroke and its comorbid conditions can define the variations in the burden of stroke and its phenotypic traits
- Human Molecular Genetics Laboratory, Rajiv Gandhi Centre for Biotechnology, India
- Department of Computational Biology and Bioinformatics, University of Kerala, India
Figures
Figure 1 with 4 supplements
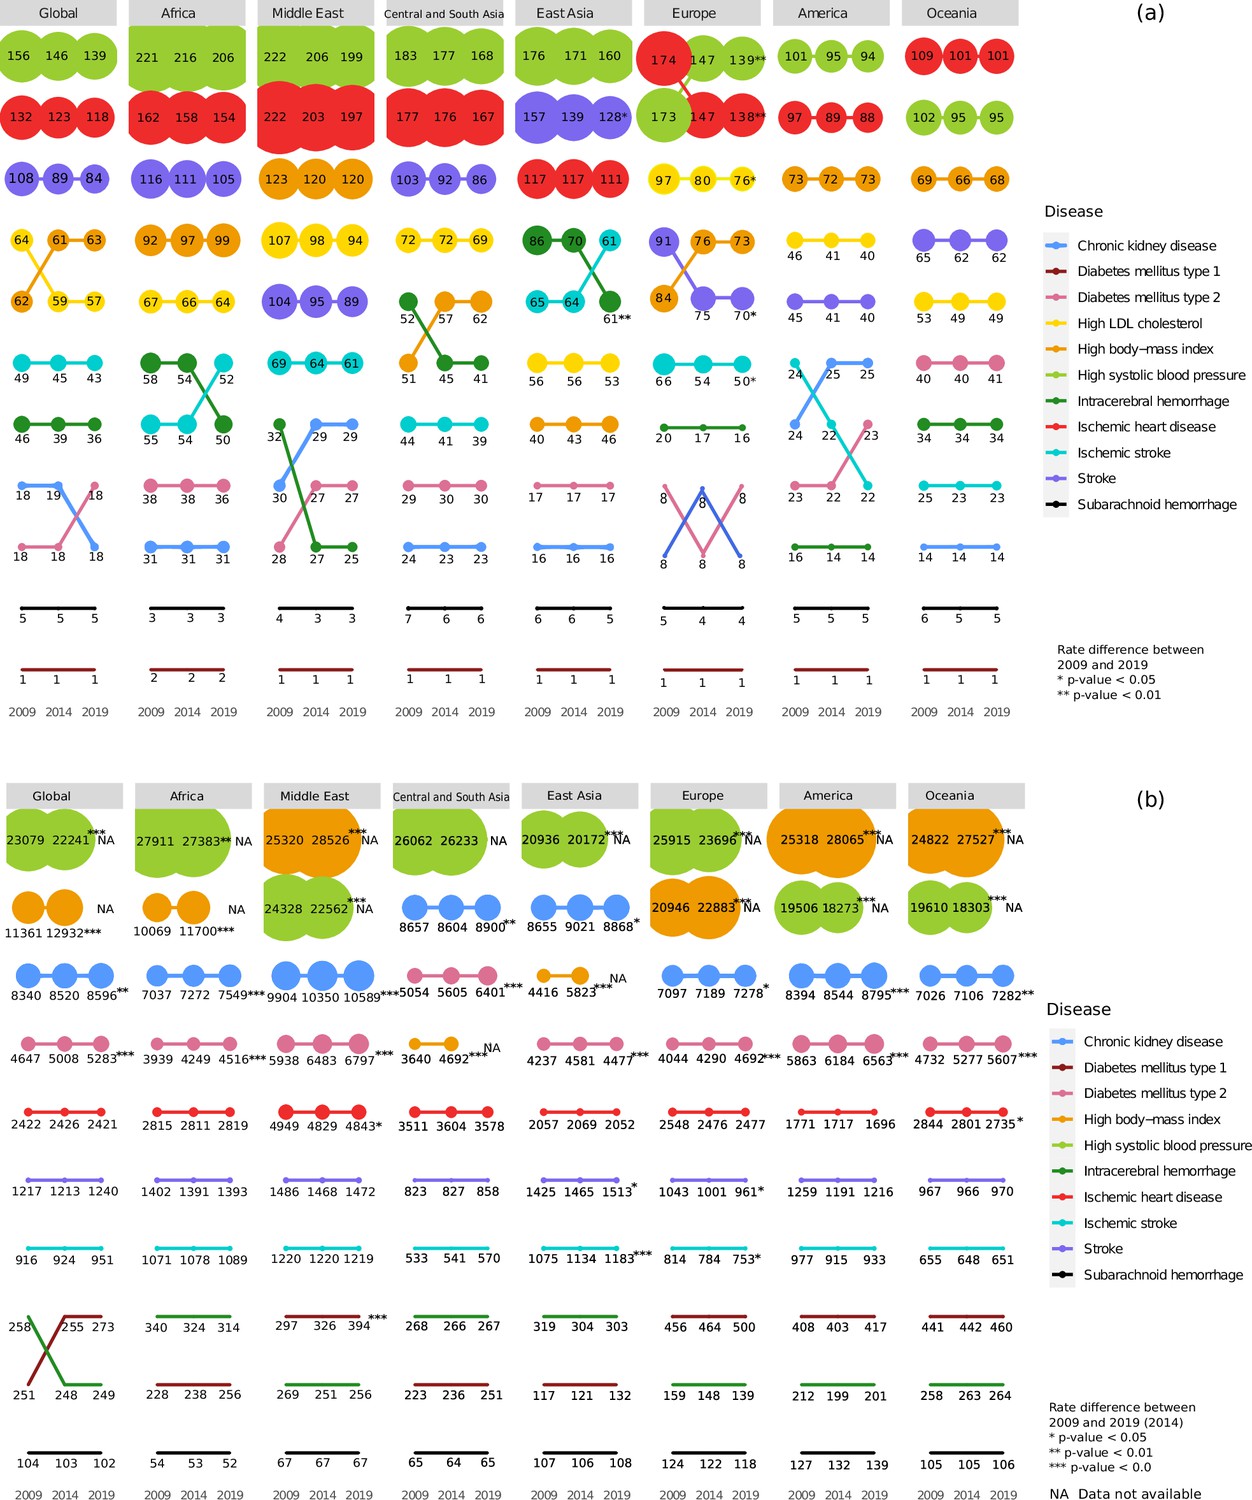
Regional (a) mortality rates and (b) prevalence rates for stroke, its subtypes, and comorbid factors.
The figure shows the age-standardized mortality and prevalence rates per 100,000 people for stroke, its subtypes, and its comorbid factors in 2009, 2014, and 2019 in the geographical regions. The size of the points indicates the rate and position indicates rank.
Figure 1—figure supplement 1
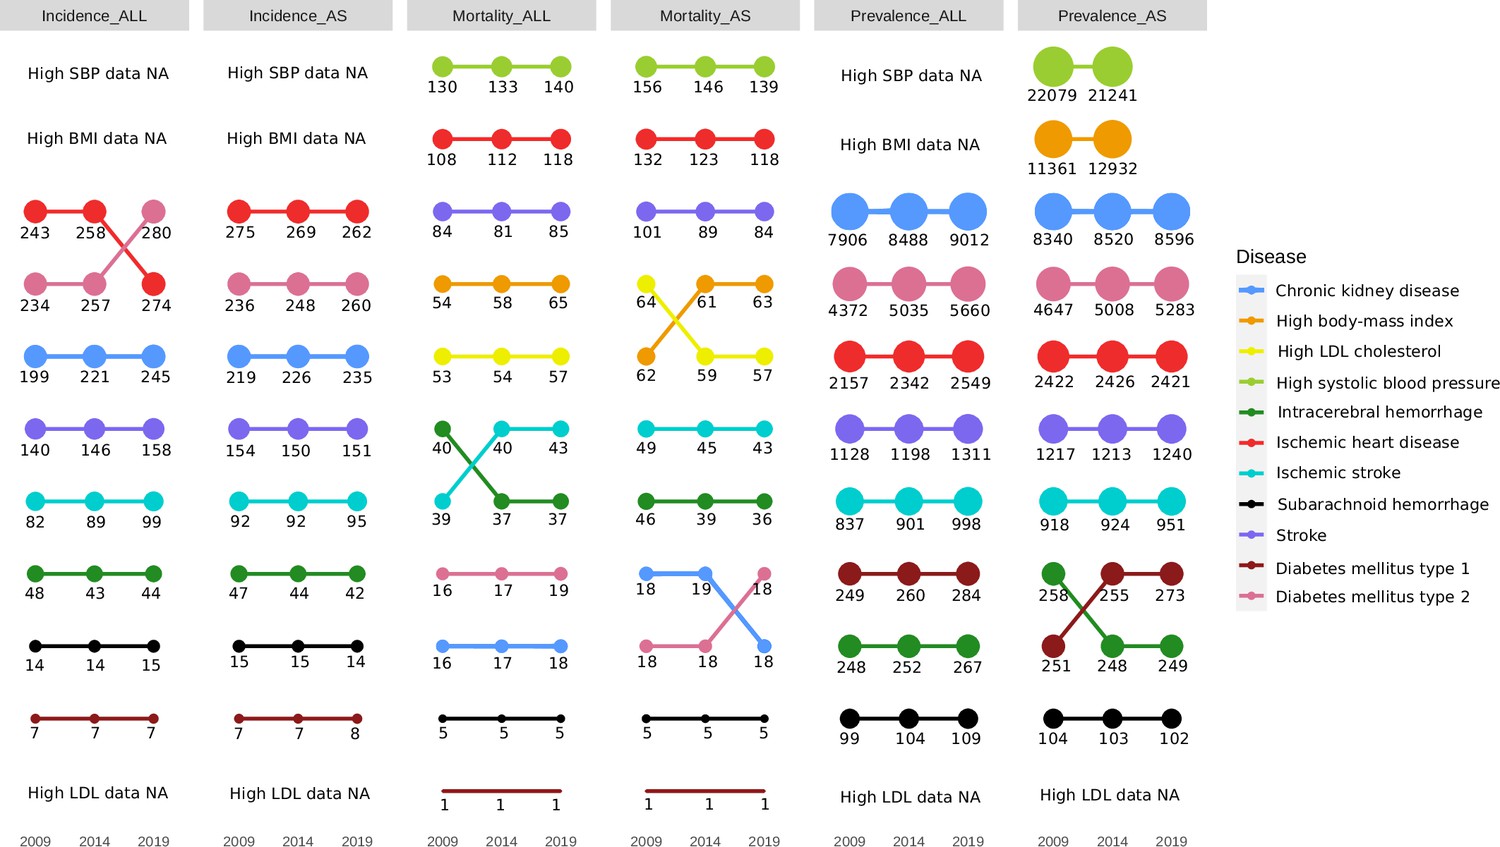
Global incidence, mortality, and prevalence rates for stroke, its subtypes, and comorbid factors.
Figure 1—figure supplement 2
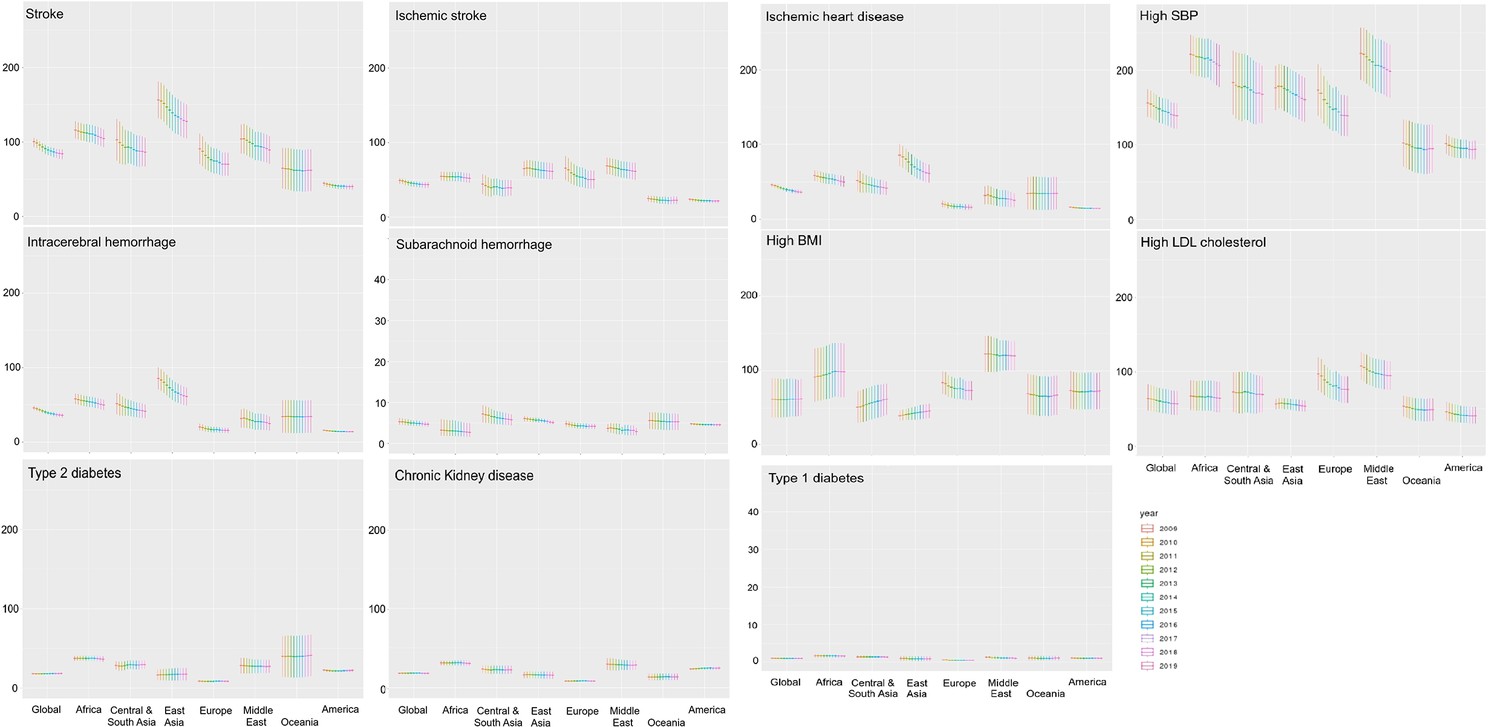
Boxplots of point estimates and uncertainty intervals of age-standardized mortality rates of stroke, its subtypes, and comorbid conditions across regions from 2009 to 2019.
Figure 1—figure supplement 3
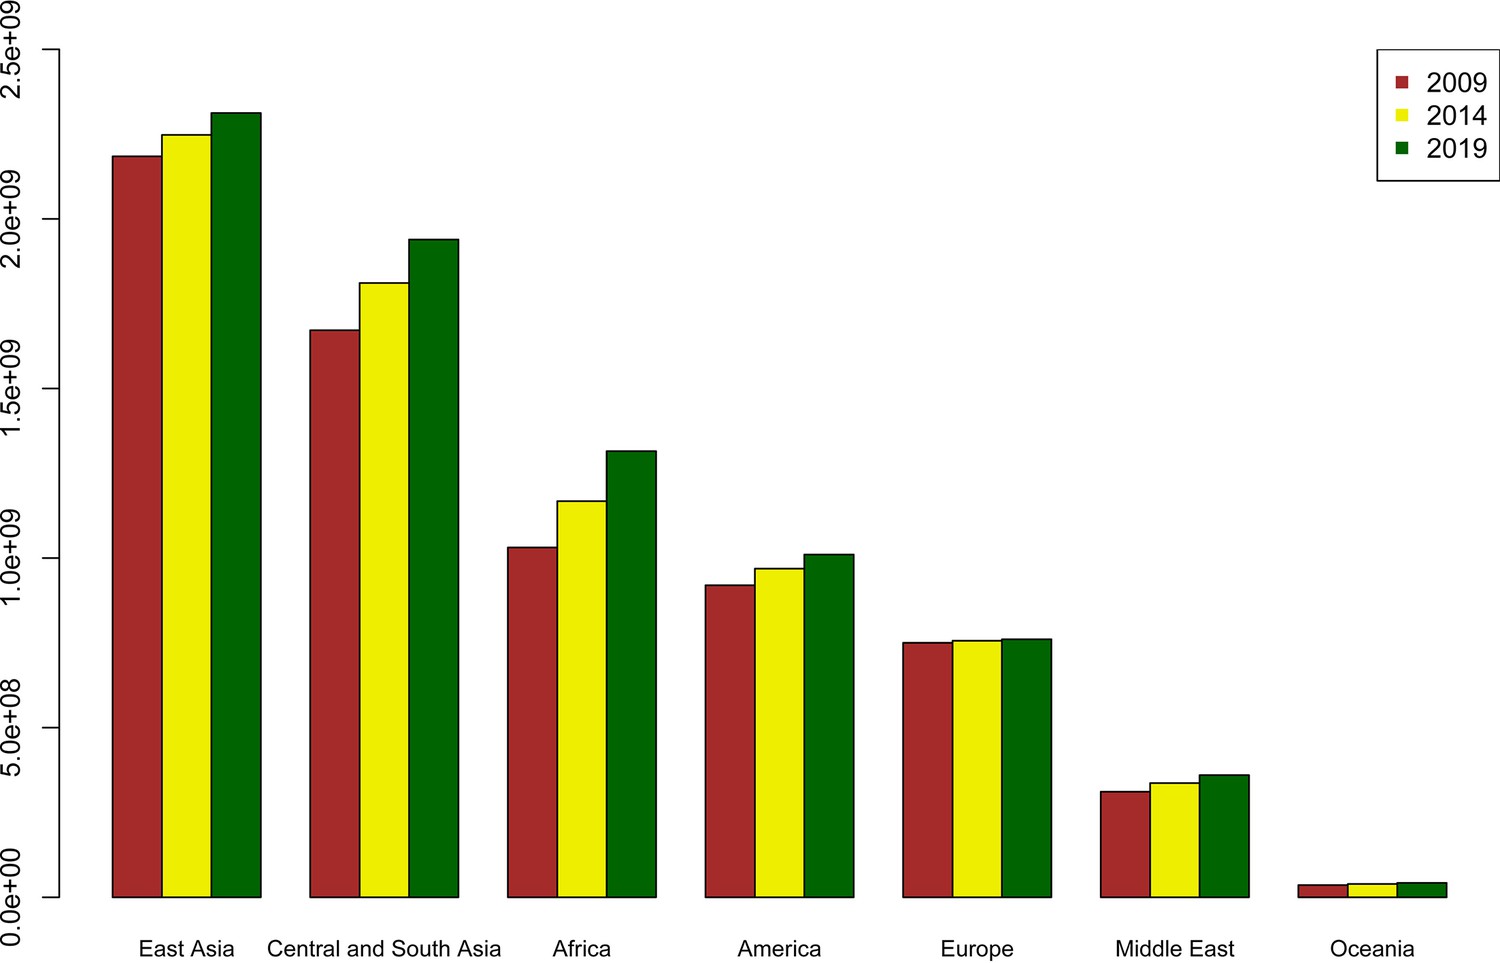
Population across different continents in 2009, 2014, and 2019.
Figure 1—figure supplement 4
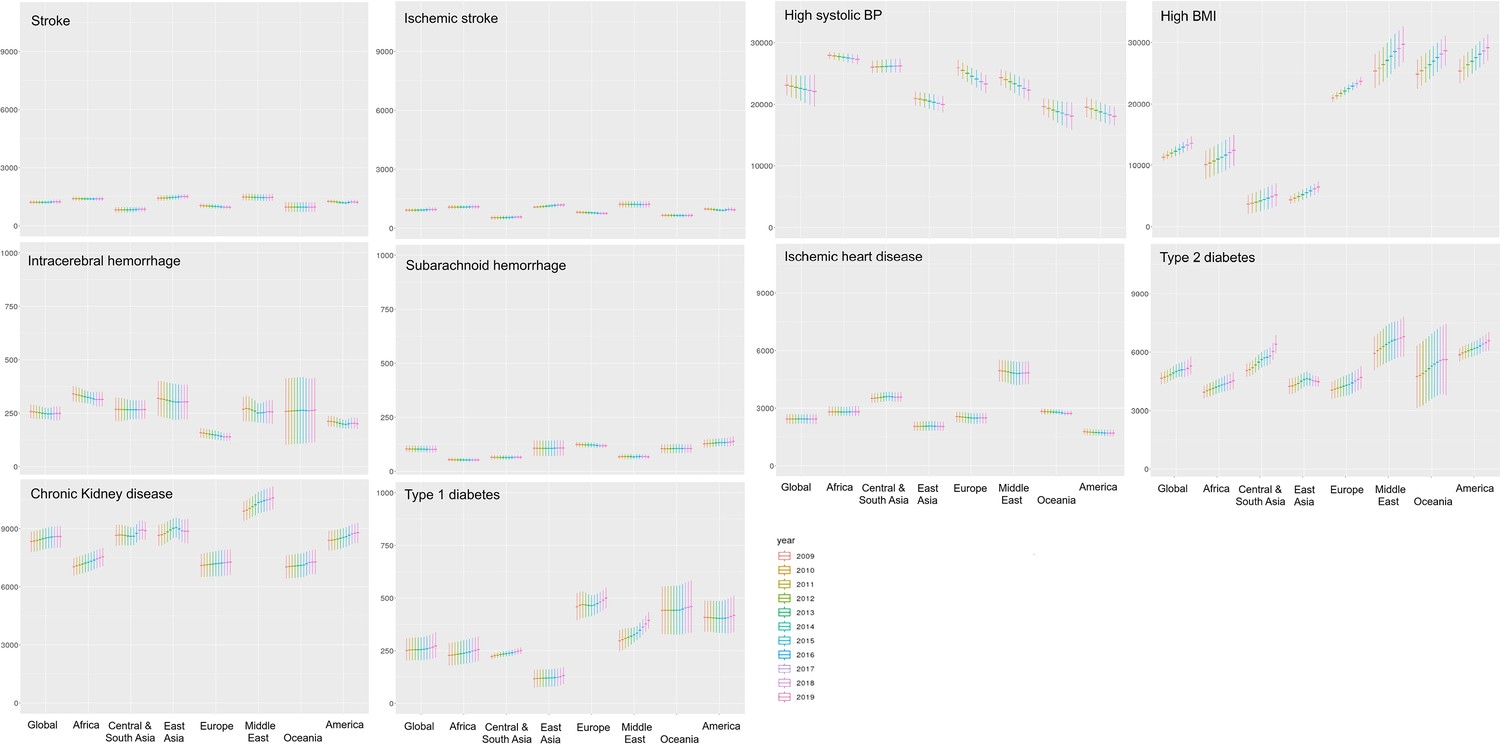
Boxplots of point estimates and uncertainty intervals of age-standardized prevalence rates of stroke, its subtypes, and comorbid conditions across regions from 2009 to 2019.
Figure 2
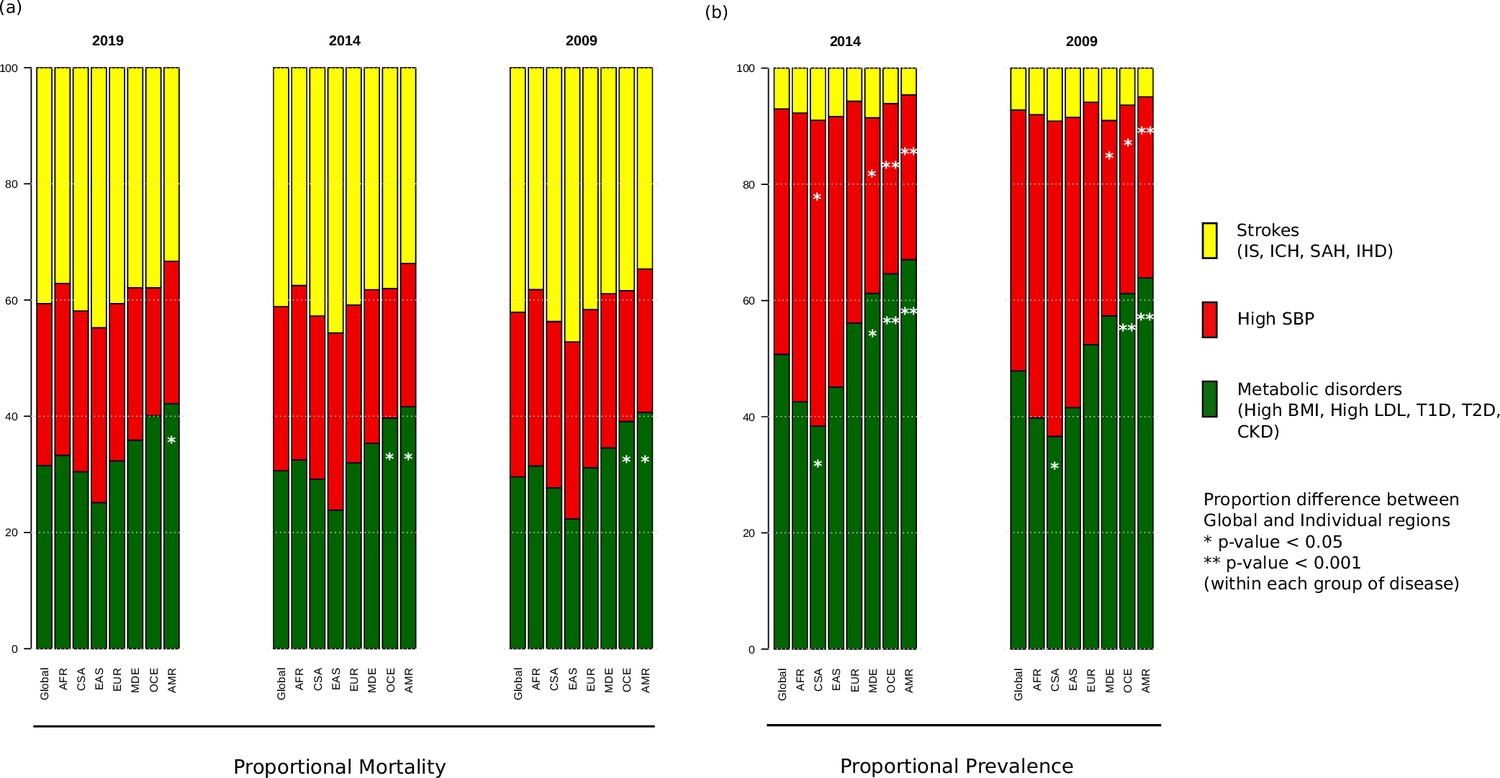
Proportional (a) mortality rates and (b) prevalence rates for strokes, high systolic blood pressure (SBP), and metabolic disorders.
The figure shows the proportional mortality and prevalence for all strokes in yellow (ischemic stroke, intracerebral hemorrhage, subarachnoid hemorrhage, and ischemic heart disease), high SBP in red, and metabolic disorders in green (high body mass index [BMI], high low-density lipoprotein [LDL], diabetes mellitus type 1 and 2, chronic kidney disorder). Proportions significantly different from global proportions are marked with asteriks. CSA – Central and South Asia, AFR – Africa, EAS – East Asia, EUR – Europe, MDE – Middle East, OCE – Oceania, AMR – America.
Figure 3
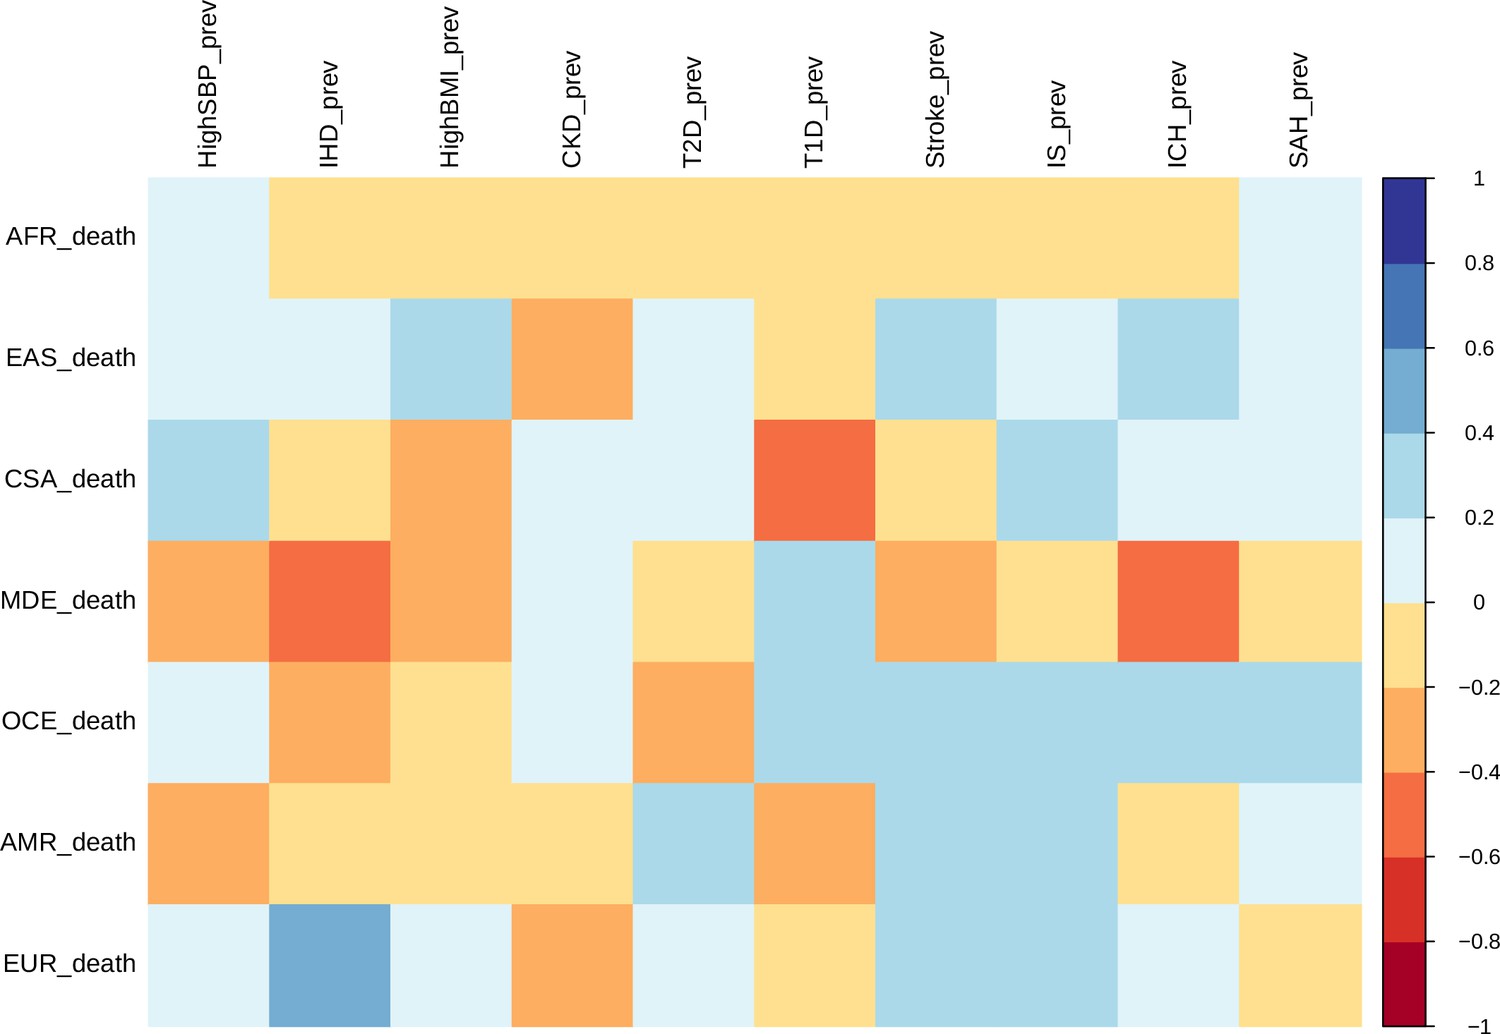
Correlation of mortality versus prevalence rates of stroke, its subtypes, and comorbid factors.
The figure shows the Pearson correlation coefficients of age-standardized mortality rates versus prevalence rates across different continents for 2014. CSA – Central and South Asia, AFR – Africa, EAS – East Asia, EUR – Europe, MDE – Middle East, OCE – Oceania, AMR – America.
Figure 4 with 1 supplement
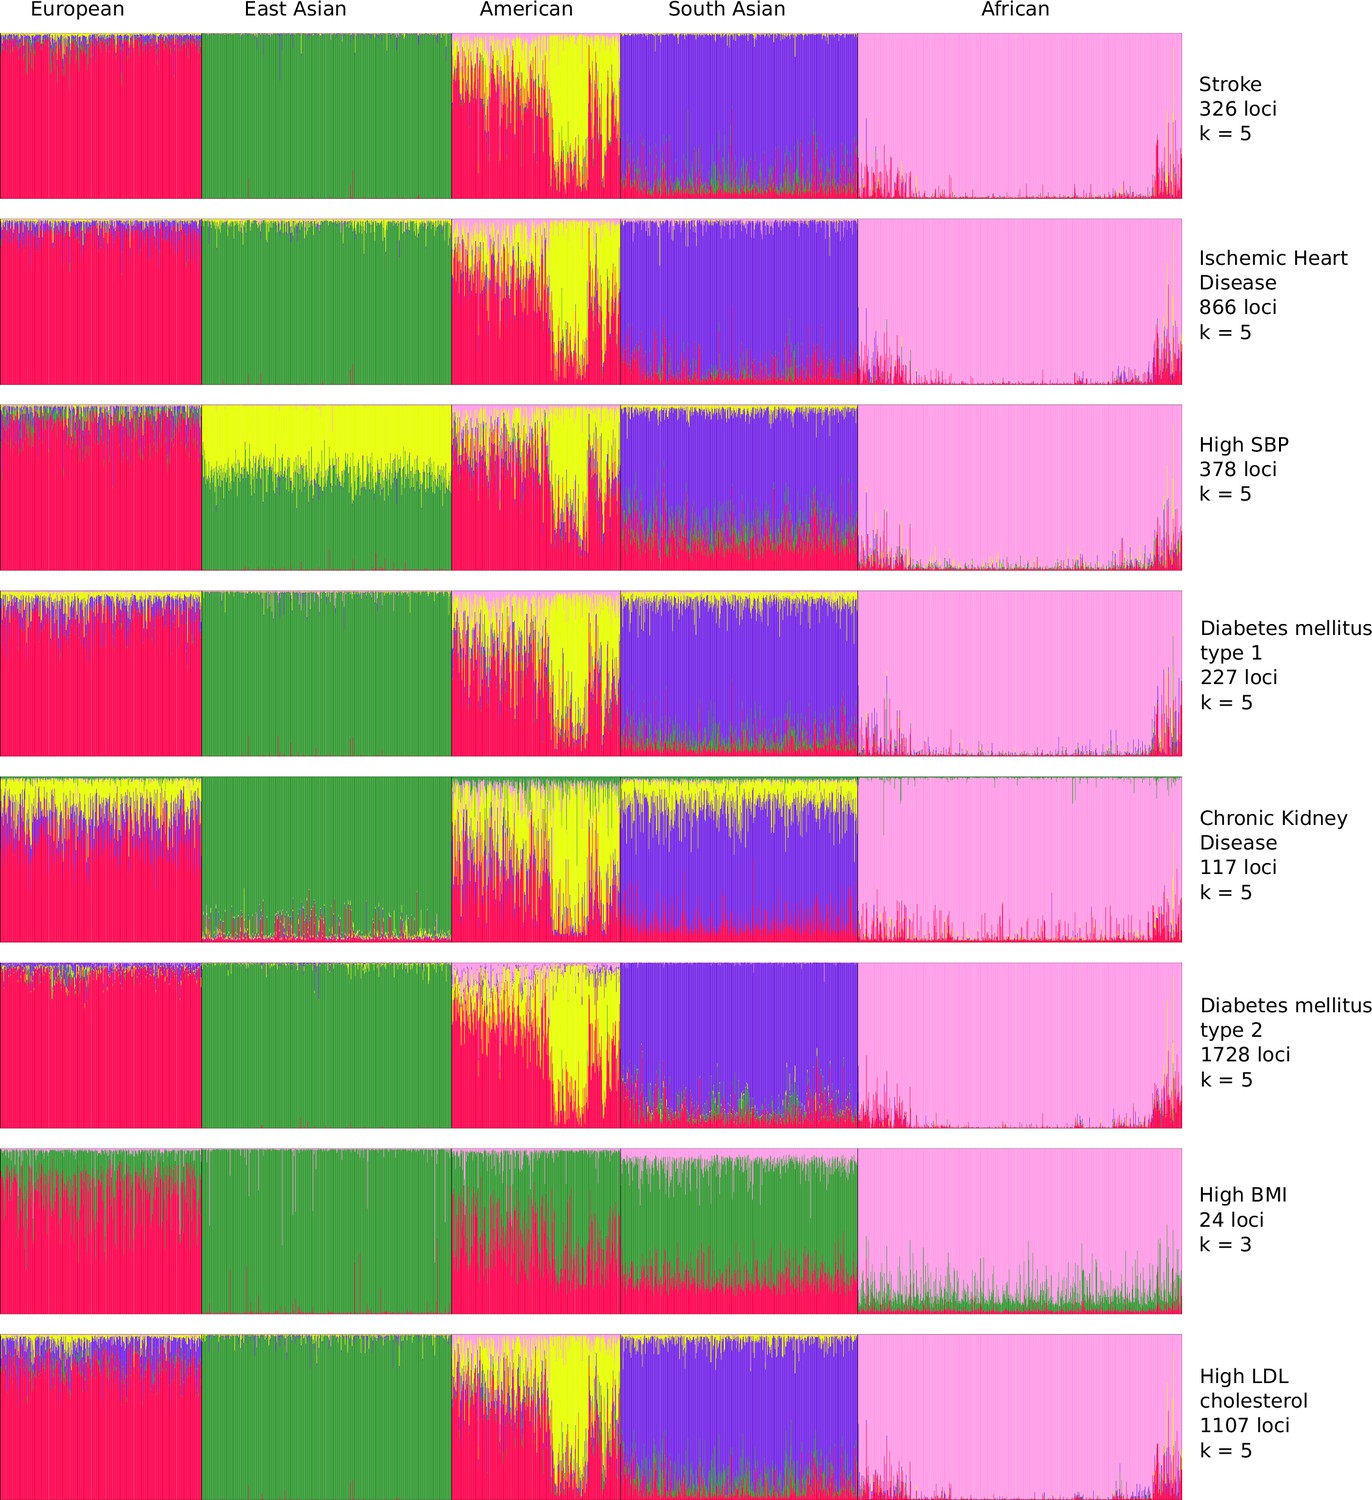
Population structure of risk variants for stroke and its comorbid factors using a model-based clustering.
The proportion of ancestral populations was estimated from the genotype of risk variants of each disease in unrelated individuals from the 1000 Genomes project using a model-based clustering approach. The individuals were represented by their super-population in 1000 Genomes (African, East Asian, South Asian, European, and American). The estimated ancestral populations clustered into either five or three clusters (in case of body mass index [BMI]) represented by the different colors – red (population cluster 1), green (population cluster 2), yellow (population cluster 3), purple (population cluster 4), and pink (population cluster 5).
Figure 4—figure supplement 1
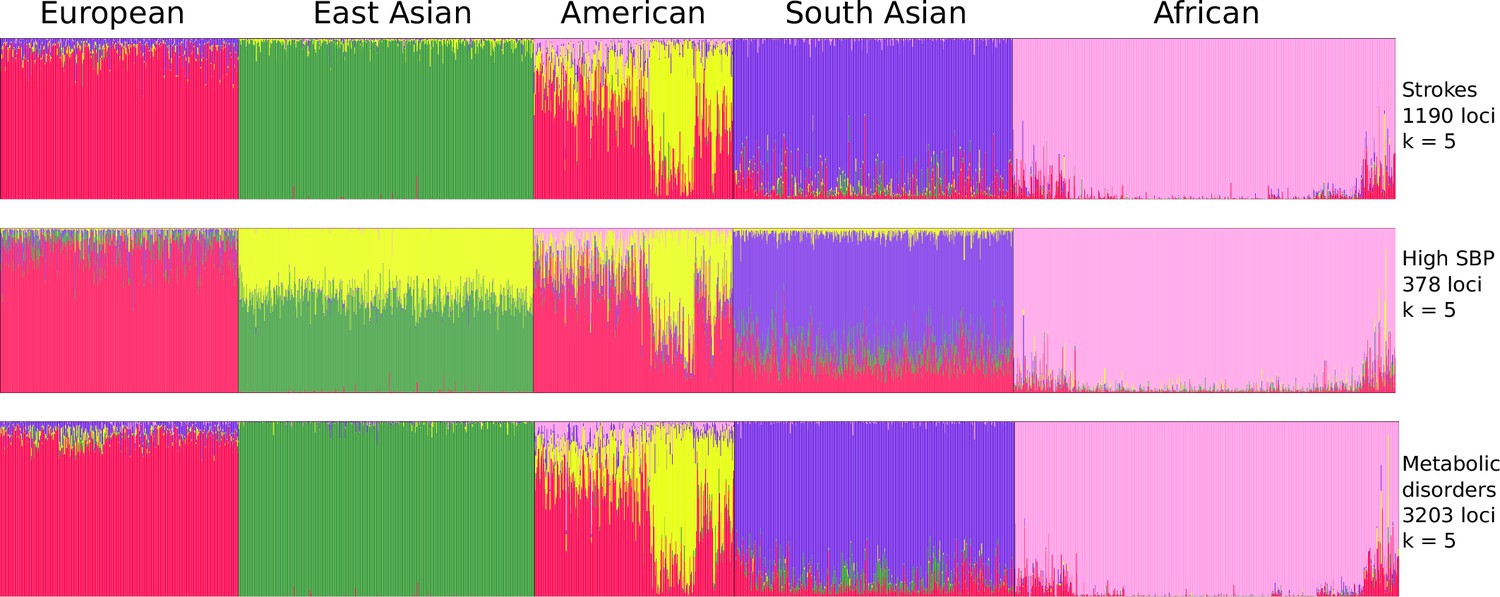
Population structure of risk variants for strokes, high systolic blood pressure (SBP), and metabolic disorders using a model-based clustering.
Figure 5
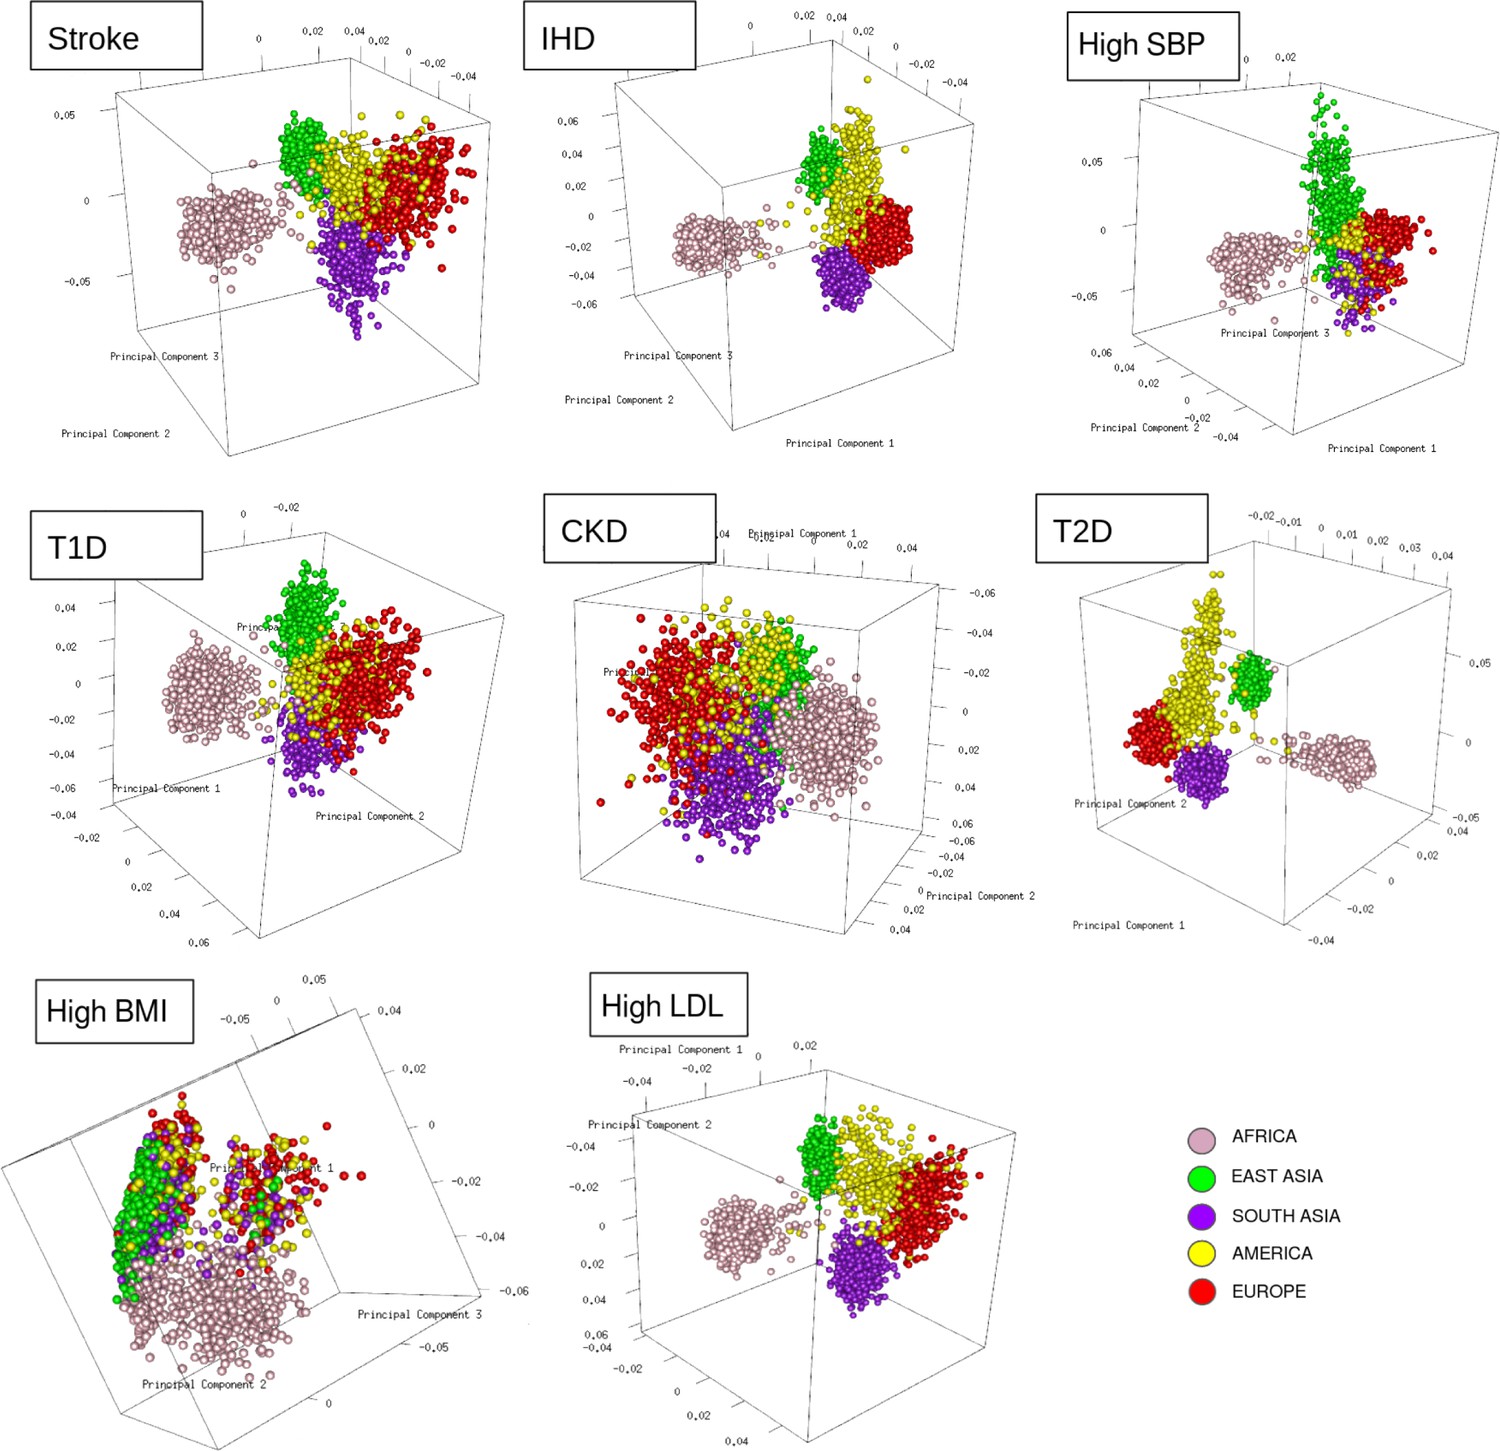
Clustering of risk variants for stroke and its comorbid factors using a PCA.
The eigenvectors were estimated from the genotype of risk variants of each disease in unrelated individuals from the 1000 Genomes project using PCA clustering. The individuals were represented by their super-population in 1000 Genomes (African, East Asian, South Asian, European, and American) shown in five different colors.
Figure 6
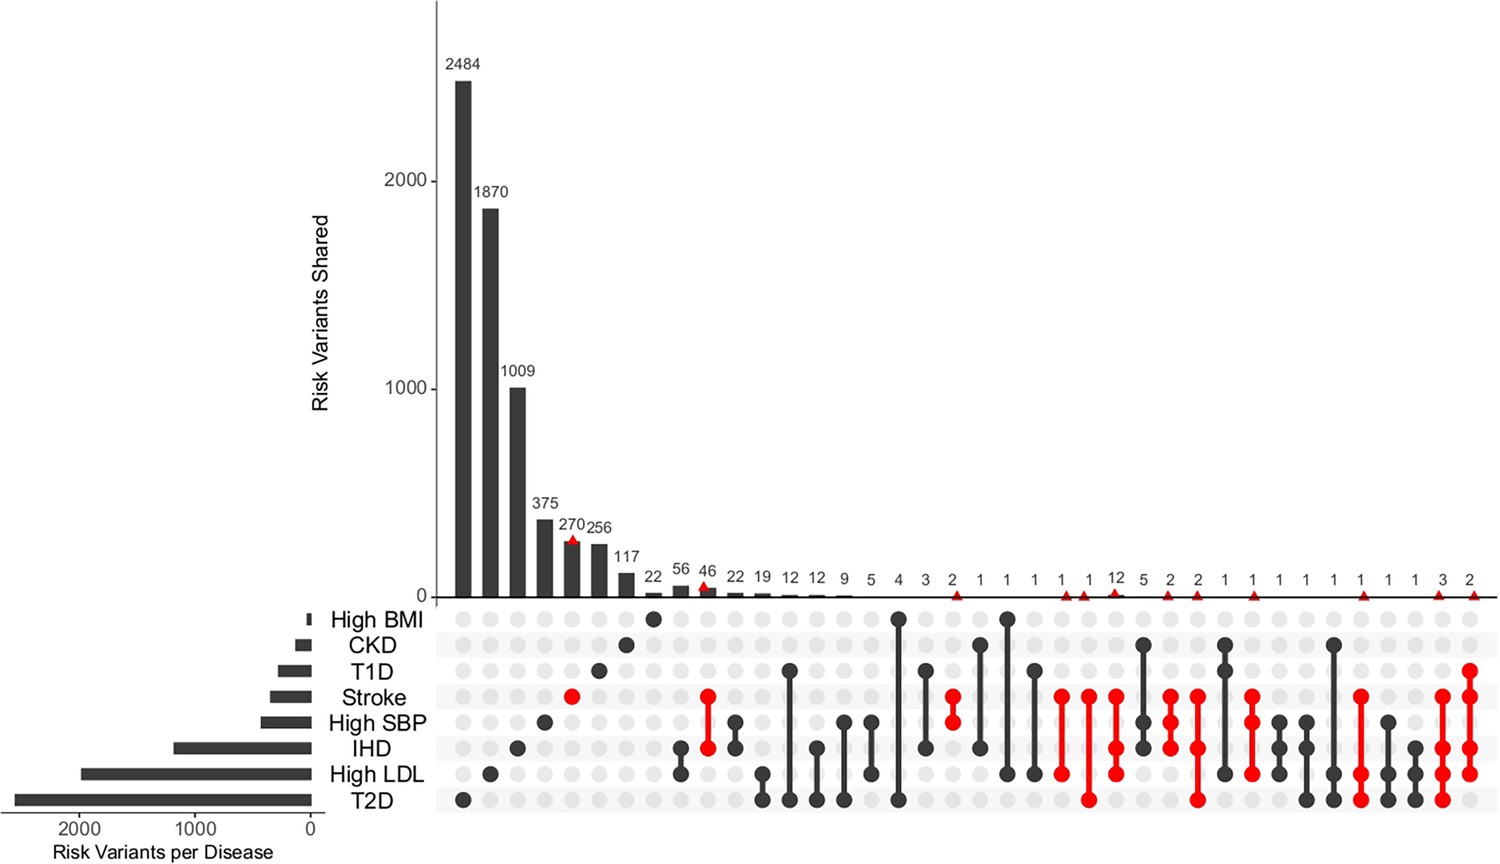
Distribution of unique and shared risk variants in stroke and its comorbid conditions.
The bar plot shows the number of GWAS risk variants unique for stroke and its comorbidities, as well as number of GWAS risk variants shared among the different diseases. The intersection of diseases is indicated below. Intersections containing stroke are highlighted in red. The total number of GWAS risk variants considered is stroke (366), ischemic heart disease (IHD) (1137), high systolic blood pressure (SBP) (419), type 2 diabetes (T2D) (2227), type 1 diabetes (T1D) (269), chronic kidney disease (CKD) (125), high body mass index (BMI) (27), and high low-density lipoprotein (LDL) (1734).
Figure 7
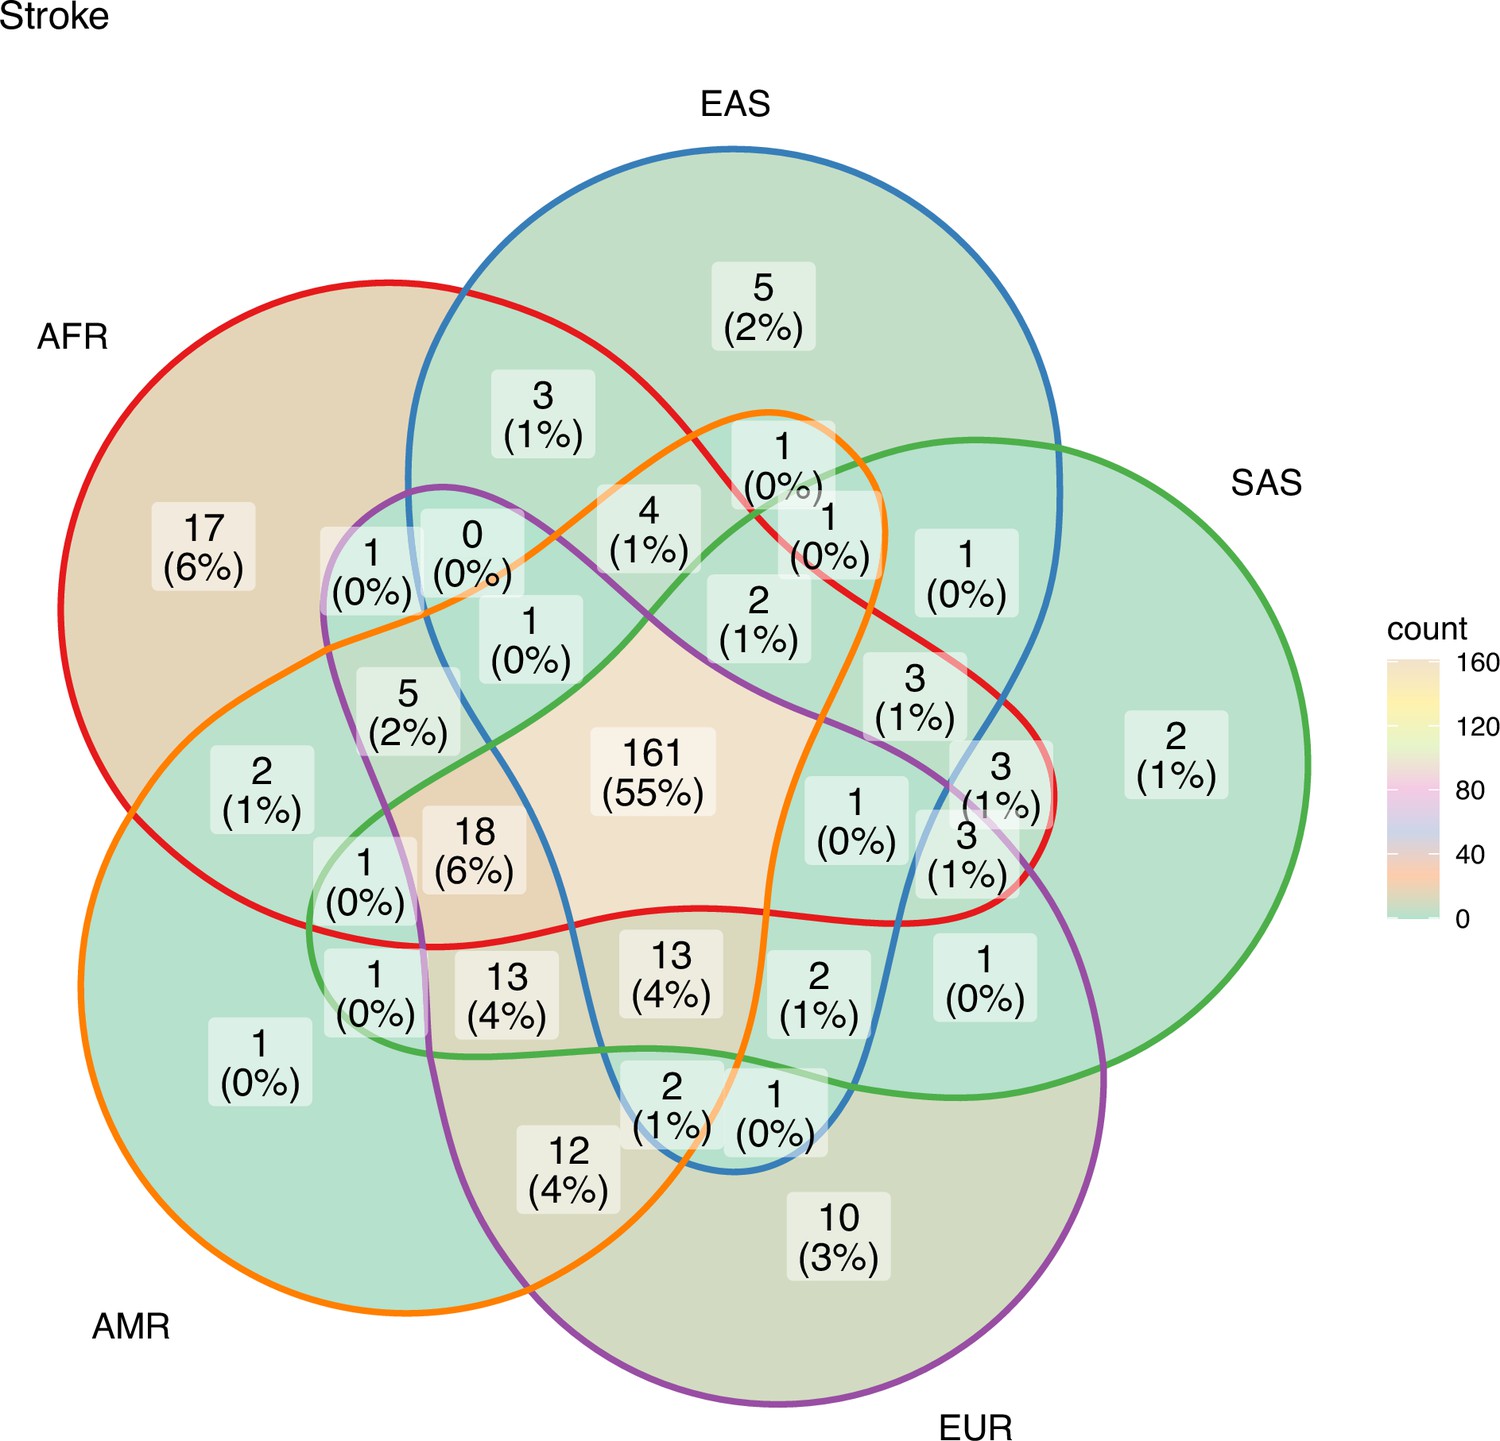
Risk variants of stroke shared among super-populations.
The GWAS risk variants for stroke (total 291) shared among the five super-populations in 1000 Genomes (African, East Asian, South Asian, European, and American). A risk variant was considered to be present in a population if the alternate allele frequency in 1000 Genomes was greater than or equal to 0.05.
Figure 8 with 1 supplement
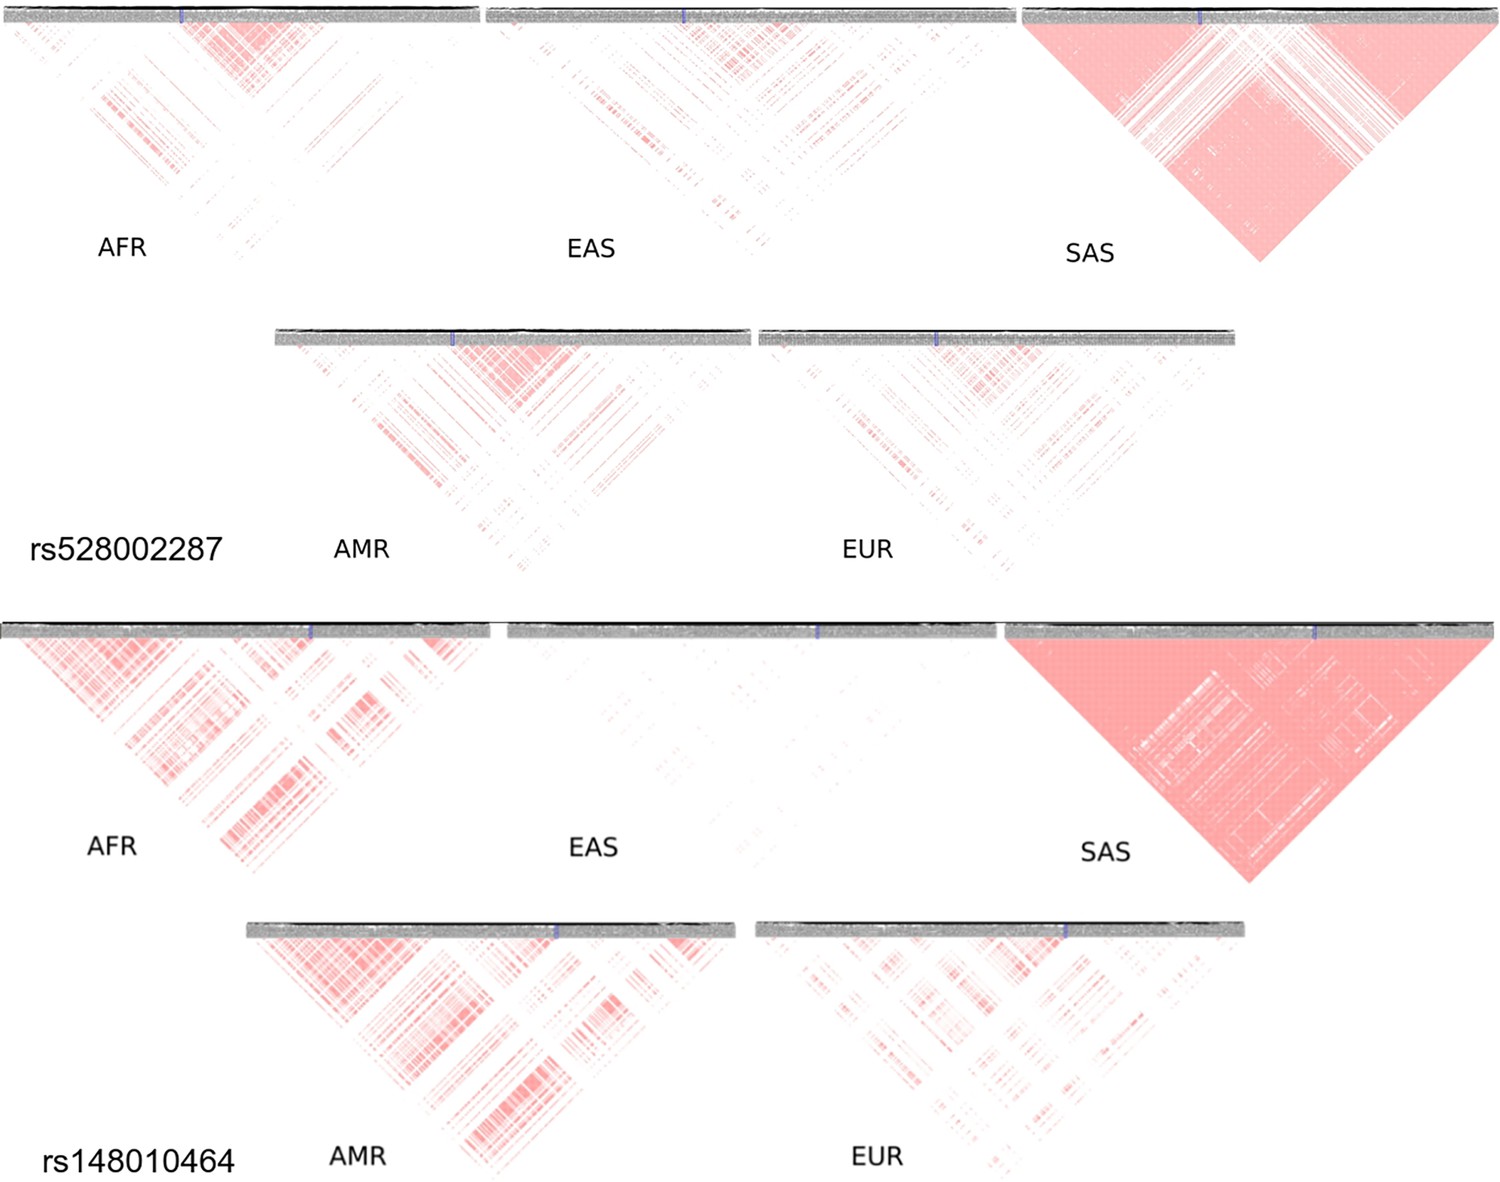
Linkage disequilibrium (LD) of low-frequency variants proxy to risk variants of stroke unique in South Asian population.
Proxy variants with frequency less than 0.1 in 1 MB region flanking the stroke risk variants unique in South Asia rs528002287 and rs148010464. The risk variants are marked in blue box. LD plots of variants in different 1000 Genome super-populations (AFR – Africa, EAS – East Asia, SAS – South Asia, AMR – America, EUR – Europe) are shown.
Figure 8—figure supplement 1
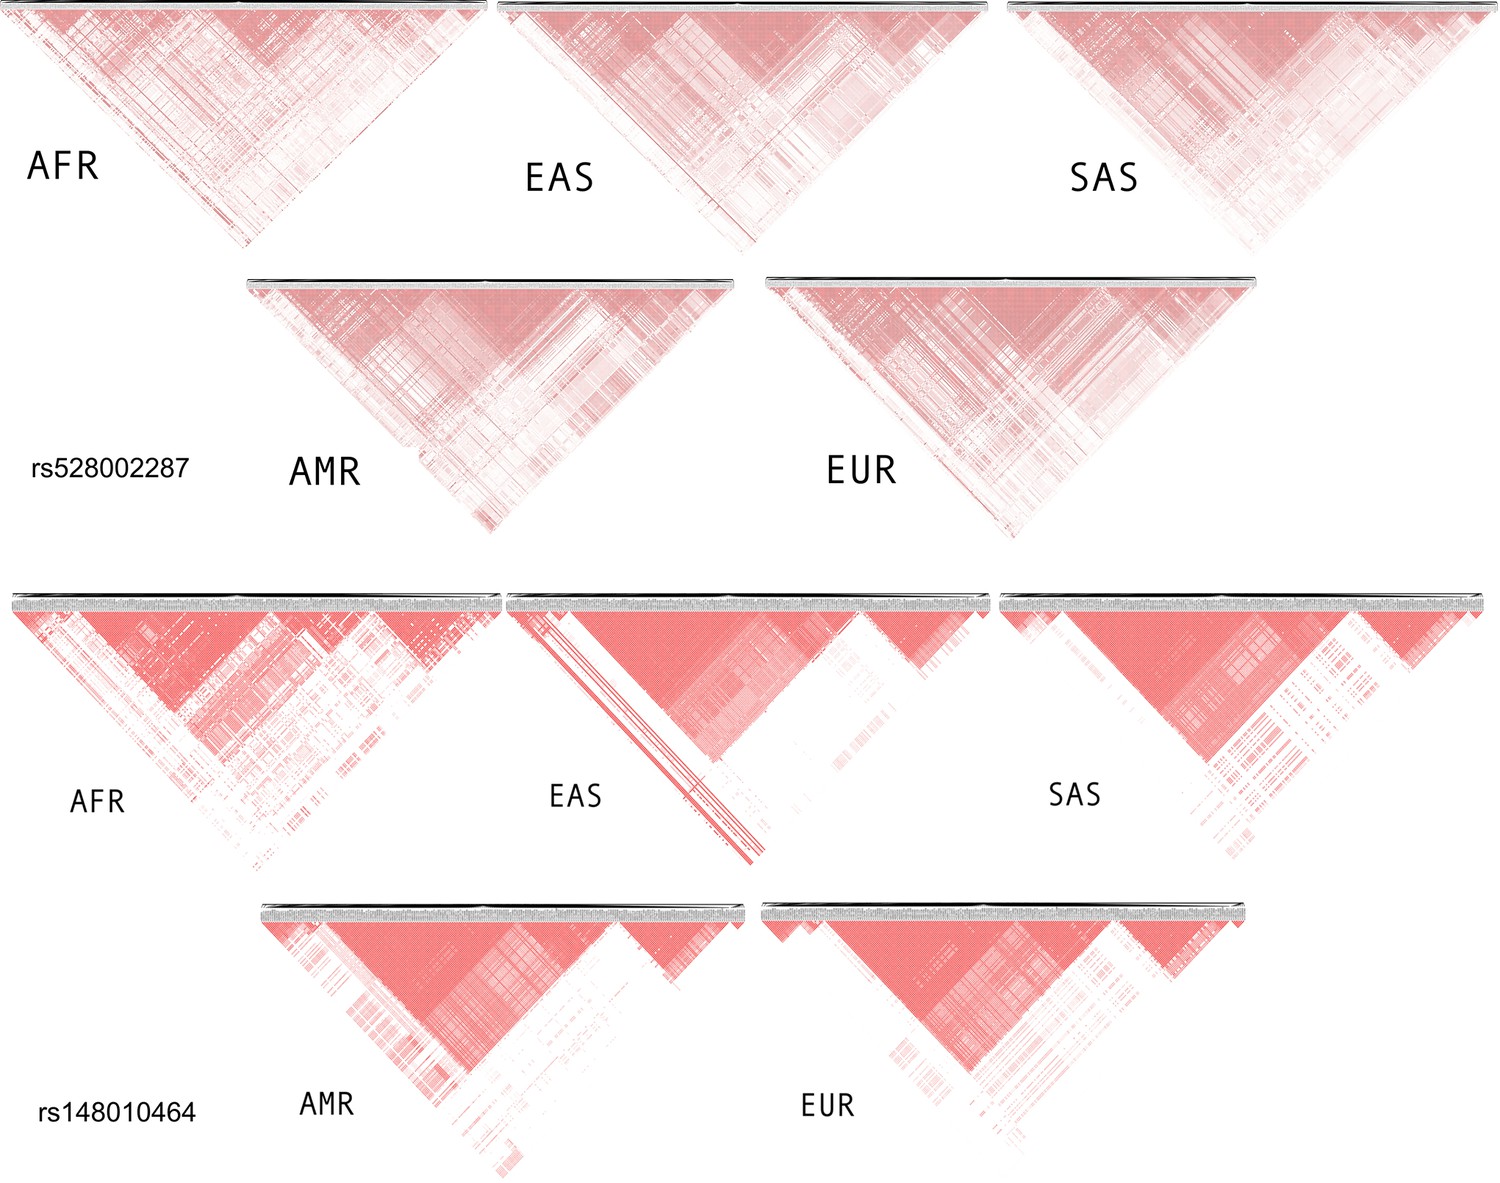
Linkage disequilibrium of common variants proxy to risk variants of stroke unique in South Asian population.
Figure 9
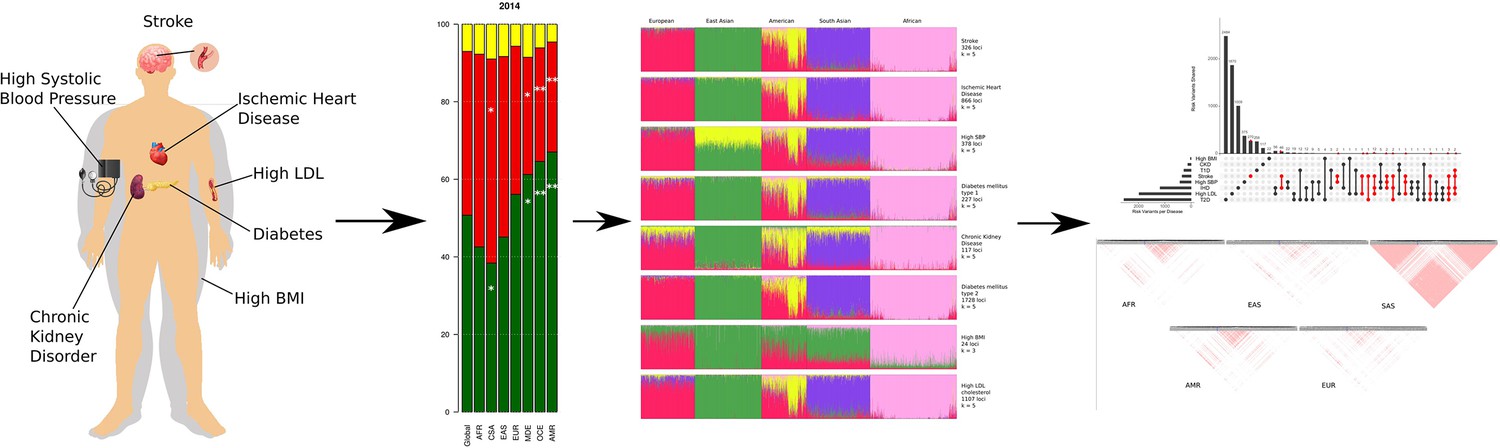
Summary of the work highlighting that the burden of stroke is driven by different risk factors in different regions.
The different socio-economic regions are driven by different risk factors of stroke and low-frequency genetic variants could be playing a role in the differences in burden of stroke seen in the different regions.
Tables
Table 1
Estimated annual percentage change (EAPC) from 2009 to 2019 of age-standardized mortality rates (ASMRs) of stroke and its comorbid conditions.
ASMR per 100,000 for stroke and its comorbid conditions for 2009 and 2019, as well as EAPC from 2009 to 2019 is shown. 95% uncertainty interval is shown in parenthesis, statistically significant intervals are highlighted in bold.
| Chronic kidney disease | High body mass index (BMI) | |||||
|---|---|---|---|---|---|---|
| Region | 2019 | 2009 | 2009–2019 EAPC | 2019 | 2009 | 2009–2019 EAPC |
| Global | 18.29 (19.6, 16.72) | 18.41 (19.22, 17.1) | –0.07 (–4.32, 4.37) | 62.59 (89.13, 39.92) | 61.66 (90.2, 37.44) | 0.16 (–2.2, 2.57) |
| Africa | 30.58 (27.11, 34.05) | 31.18 (28.37, 33.99) | –0.12 (–3.41, 3.27) | 98.83 (64.77, 136.6) | 91.64 (58.6, 130.04) | 0.88 (–1.02, 2.82) |
| Central and South Asia | 22.74 (17.68, 27.81) | 23.72 (18.93, 28.5) | 0.24 (–4.07, 3.73) | 62.07 (40.97, 83.17) | 51.31 (30.2, 72.47) | 2.0 (–0.5, 4.56) |
| East Asia | 15.8 (11.17, 20.42) | 16.22 (12.1, 20.34) | –0.38 (–4.9, 4.36) | 46.41 (36.68, 56.14) | 39.76 (32.9, 46.61) | 1.45 (–1.39, 4.38) |
| Europe | 8.18 (7.06, 9.3) | 8.19 (7.1, 9.29) | 0.11 (–6.17, 6.81) | 73.34 (60.31, 86.36) | 84.45 (69.2, 99.71) | –1.42 (–3.49, 0.7) |
| Middle East | 28.68 (22.76, 34.59) | 29.75 (22.4, 37.14) | –0.46 (–3.85, 3.06) | 120.14 (100.3, 139.9) | 122.6 (98.3, 146.9) | –0.23 (–1.91, 1.48) |
| Oceania | 13.71 (9.67, 17.74) | 13.6 (9.16, 18.04) | 0.17 (–4.76, 5.36) | 67.52 (41.1, 93.93) | 69.2 (42.2, 96.19) | –0.28 (–2.53, 2.02) |
| America | 24.95 (22.85, 26.81) | 23.83 (22.22, 24.68) | 0.48 (–3.24, 4.34) | 72.83 (48.62, 97.9) | 73.34 (49.02, 99.92) | –0.01 (–2.17, 2.23) |
| High low-density lipoprotein (LDL) | High systolic blood pressure (SBP) | |||||
| Region | 2019 | 2009 | 2009–2019 EAPC | 2019 | 2009 | 2009–2019 EAPC |
| Global | 56.51 (73.62, 41.83) | 63.9 (82.9, 47.71) | –1.29 (–3.65, 1.13) | 138.88 (155.7, 121.3) | 156.22 (174.7, 137.3) | –1.23 (–2.74, 0.31) |
| Africa | 64.39 (45.03, 86.13) | 67.15 (48.42, 88.17) | –0.34 (–2.6, 1.98) | 206.18 (177.4, 234.2) | 221.26 (196.2, 247.2) | –0.64 (–1.9, 0.63) |
| Central and South Asia | 68.91 (45.31, 92.51) | 72.3 (45.6, 98.99) | –0.46 (–2.64, 1.77) | 167.69 (129.1, 206.3) | 183.48 (140.3, 226.6) | –0.84 (–2.23, 0.57) |
| East Asia | 53.44 (46.16, 60.71) | 56.11 (48.82, 63.4) | –0.68 (–3.15, 1.82) | 160.36 (130.6, 190.1) | 176.4 (146.7, 206.1) | –1.1 (–2.51, 0.33) |
| Europe | 75.53 (57.71, 93.34) | 96.66 (74.4, 119.0) | –2.53 (−4.51, –0.51) | 138.88 (111.6, 166.2) | 173.48 (139.1, 207.9) | –2.26 (−3.73, −0.76) |
| Middle East | 94.43 (75.03, 113.8) | 107.43 (88.6, 126.3) | –1.3 (–3.14, 0.57) | 198.61 (162.8, 234.4) | 222.34 (187.2, 257.5) | –1.16 (–2.43, 0.13) |
| Oceania | 48.92 (33.56, 64.27) | 53.34 (39.4, 67.27) | –0.92 (–3.51, 1.74) | 94.63 (62.2, 127.06) | 102.14 (70.5, 133.76) | –0.81 (–2.68, 1.09) |
| America | 40.44 (30.0, 52.53) | 45.86 (34.22, 59.38) | –1.24 (–4.05, 1.64) | 93.91 (80.49,105.8) | 101.2 (87.28, 114.1) | –0.7 (–2.57, 1.21) |
| Ischemic heart disease | Intracerebral hemorrhage | |||||
| Region | 2019 | 2009 | 2009–2019 EAPC | 2019 | 2009 | 2009–2019 EAPC |
| Global | 117.95 (125.9, 107.8) | 131.77 (138.3, 122.4) | –1.17 (–2.81, 0.5) | 36.04 (38.67, 32.98) | 45.92 (48.45, 43.07) | –2.53 (–5.37, 0.39) |
| Africa | 154.04 (132.6, 175.4) | 162.34 (146.4, 180.7) | –0.45 (–1.91, 1.04) | 49.82 (43.07, 57.02) | 58.06 (51.19, 65.11) | –1.45 (–3.93, 1.09) |
| Central and South Asia | 167.39 (115.8, 219.0) | 176.75 (118.3, 235.2) | –0.51 (–1.91, 0.92) | 41.45 (32.34, 50.55) | 51.57 (37.19, 65.94) | –2.13 (–4.8, 0.62) |
| East Asia | 110.93 (94.7, 127.17) | 117.17 (100.7, 133.7) | –0.76 (–2.47, 0.97) | 61.2 (49.06, 73.33) | 85.51 (70.7, 100.37) | –3.54 (−5.65, –1.38) |
| Europe | 138.19 (105.5, 170.8) | 174.31 (134.8, 213.8) | –2.37 (−3.85, –0.88) | 15.7 (12.25, 19.15) | 20.31 (15.85, 24.77) | –2.46 (–6.77, 2.04) |
| Middle East | 197.4 (154.9,239.9) | 221.61 (178.7, 264.5) | –1.14 (–2.41, 0.16) | 24.94 (15.45, 34.42) | 31.66 (19.43, 43.89) | –2.445 (–5.8, 1.03) |
| Oceania | 100.75 (65.96, 135.6) | 109.14 (77.5, 140.7) | –0.86 (–2.67, 0.99) | 34.32 (12.57, 56.07) | 34.25 (12.46, 56.04) | –0.056 (–3.2, 3.19) |
| America | 87.51 (79.07, 93.31) | 97.5 (89.02, 102.0) | –1.06 (–2.98, 0.91) | 14.06 (12.97, 15.03) | 15.95 (15.05, 16.68) | –1.21 (–5.93, 3.74) |
| Ischemic stroke | Subarachnoid hemorrhage | |||||
| Region | 2019 | 2009 | 2009–2019 EAPC | 2019 | 2009 | 2009–2019 EAPC |
| Global | 43.5 (46.8, 39.08) | 49.24 (52.21, 44.75) | –1.3 (–3.99, 1.47) | 4.66 (5.17, 4.13) | 5.34 (6.2, 4.57) | –1.29 (–9.21, 7.33) |
| Africa | 52.05 (45.89, 58.59) | 54.74 (48.9, 60.76) | –0.43 (–2.94, 2.14) | 2.73 (1.62, 4.97) | 3.27 (1.9, 5.95) | –1.71 (–11.75, 9.48) |
| Central and South Asia | 39.2 (28.7, 49.75) | 44.32 (31.11, 57.53) | –0.99 (–3.88, 1.95) | 5.77 (4.42, 7.12) | 7.15 (5.05, 9.26) | –2.16 (–9.13, 5.34) |
| East Asia | 61.33 (50.37, 72.28) | 64.96 (54.8, 75.11) | –0.734 (–3.04, 1.61) | 5.14 (4.66, 5.62) | 6.05 (5.45, 6.65) | –1.66 (–9.11, 6.4) |
| Europe | 50.36 (38.22, 62.51) | 65.67 (49.49, 81.85) | –2.72 (−5.14,–0.25) | 4.16 (3.55, 4.78) | 4.84 (4.08, 5.6) | –1.3 (–9.74, 7.93) |
| Middle East | 61.43 (49.71, 73.15) | 68.72 (57.62, 79.81) | –1.17 (–3.44, 1.15) | 2.91 (2.0, 3.83) | 3.74 (2.82, 4.67) | –2.39 (–11.73, 8.14) |
| Oceania | 22.56 (17.61, 27.52) | 24.92 (20.87, 28.98) | –1.04 (–4.81, 2.89) | 5.27 (3.32, 7.21) | 5.61 (3.57, 7.64) | –0.64 (–8.31, 7.68) |
| America | 21.69 (18.8, 23.4) | 23.96 (21.31, 25.49) | –0.99 (–4.83, 2.99) | 4.57 (4.16, 4.9) | 4.81 (4.47, 5) | –0.45 (–8.72, 8.55) |
| Stroke | Type 2 diabetes | |||||
| Region | 2019 | 2009 | 2009–2019 EAPC | 2019 | 2009 | 2009–2019 EAPC |
| Global | 84.19 (90.15, 76.76) | 100.5 (105.4, 93.24) | –1.85 (–3.76, 0.1) | 18.49 (19.66, 17.18) | 18.23 (18.97, 17.12) | 0.21 (–4.07, 4.69) |
| Africa | 104.6 (93.07, 116.9) | 116.07 (104.7, 127.9) | –0.97 (–2.71, 0.81) | 36.45 (33.0, 40.01) | 37.5 (34.54, 40.3) | –0.24 (–3.24, 2.85) |
| Central and South Asia | 86.42 (67.06, 105.8) | 103.04 (75.1, 130.94) | –1.63 (–3.53, 0.3) | 29.61 (24.29, 34.93) | 28.54 (23.45, 33.63) | 0.62 (–2.83, 4.17) |
| East Asia | 127.66 (104.9, 150.5) | 156.52 (132.0, 181.0) | –2.2 (−3.73, –0.64) | 17.45 (9.53, 25.37) | 16.52 (9.67, 23.37) | 0.59 (–3.85, 5.24) |
| Europe | 70.22 (54.79, 85.65) | 90.82 (70.3, 111.34) | –2.6 (−4.65, –0.5) | 8.26 (7.03, 9.48) | 8.46 (6.95, 9.96) | 0.09 (–6.19, 6.78) |
| Middle East | 89.28 (70.7, 107.87) | 104.12 (84.6, 123.63) | –1.59 (–3.44, 0.3) | 27.43 (19.25, 35.6) | 28.38 (18.53, 38.22) | –0.38 (–3.86, 3.22) |
| Oceania | 62.15 (34.12, 90.18) | 64.78 (37.63, 91.92) | –0.47 (–2.79, 1.9) | 41.29 (15.02, 67.55) | 40.0 (14.19, 65.81) | 0.27 (–2.65, 3.27) |
| America | 40.33 (36.24, 43.1) | 44.72 (40.98, 46.98) | –1.01 (–3.83, 1.9) | 22.55 (20.65, 24.08) | 22.89 (21.35, 23.69) | –0.08 (–3.96, 3.97) |
| Type 1 diabetes | ||||||
| Region | 2019 | 2009 | 2009–2019 EAPC | - | - | - |
| Global | 0.98 (1.17, 0.85) | 1.03 (1.22, 0.88) | –0.45 (–17.5, 20.07) | - | - | - |
| Africa | 1.59 (1.24, 1.92) | 1.69 (1.29, 2.14) | –0.57 (–14.01, 14.9) | - | - | - |
| Central and South Asia | 1.34 (1.09, 1.6) | 1.4 (1.09, 1.71) | –0.33 (–14.93, 16.8) | - | - | - |
| East Asia | 0.91 (0.33, 1.49) | 0.98 (0.39, 1.56) | –1.17 (–18.6, 20.01) | - | - | - |
| Europe | 0.51 (0.42, 0.61) | 0.59 (0.49, 0.69) | –1.57 (–24.09, 27.6) | - | - | - |
| Middle East | 1.05 (0.8, 1.3) | 1.27 (0.97, 1.57) | –2.26 (–17.89, 16.3) | - | - | - |
| Oceania | 1.06 (0.52, 1.6) | 1.06 (0.53, 1.59) | –0.26 (–16.9, 19.74) | - | - | - |
| America | 1.04 (0.8, 1.29) | 1.1 (0.87, 1.37) | –0.27 (–16.89, 19.7) | - | - | - |
Table 2
Estimated annual percentage change (EAPC) from 2009 to 2019 of age-standardized prevalence rates (ASPRs) of stroke and its comorbid conditions.
ASPR per 100,000 for stroke and its comorbid conditions for 2009 and 2019, as well as EAPC from 2009 to 2019 is shown. 95% uncertainty interval is shown in parenthesis, statistically significant intervals are highlighted in bold.
| Chronic kidney disease | High body mass index (BMI) | |||||
|---|---|---|---|---|---|---|
| Region | 2019 | 2009 | 2009–2019 EAPC | 2016 | 2009 | 2009–2016 EAPC |
| Global | 8596.21 (8015.74, 9125.28) | 8340.38 (7792.87, 8846.68) | 0.34 (0.13, 0.54) | 13627.48 (14742.38, 12594.1) | 11360.96 (11989.37, 10745.18) | 2.63 (2.35, 2.91) |
| Africa | 7548.86 (7063.27, 8012.72) | 7037.32 (6575.34, 7477.98) | 0.71 (0.49, 0.93) | 12418.08 (9882.53, 14953.64) | 10068.8 (7764.52, 12373.08) | 3.04 (2.75, 3.34) |
| Central and South Asia | 8900.17 (8429.97, 9370.37) | 8656.77 (8113.18, 9200.36) | 0.33 (0.13, 0.54) | 5191.21 (3289.67, 7092.74) | 3639.99 (2090.94, 5189.04) | 5.2 (4.72, 5.69) |
| East Asia | 8868.46 (8227.29, 9509.63) | 8655.32 (8120.05, 9190.6) | 0.27 (0.07, 0.47) | 6471.83 (5527.54, 7416.12) | 4416.3 (3734.86, 5097.74) | 5.6 (5.17, 6.04) |
| Europe | 7277.72 (6612.97, 7942.47) | 7096.87 (6502.14, 7691.6) | 0.25 (0.03, 0.47) | 23696.85 (23004.53, 24389.17) | 20946.03 (20353.15, 21538.91) | 1.78 (1.57, 1.98) |
| Middle East | 10589.31 (9997.33, 11181.29) | 9904.13 (9402.68, 10405.57) | 0.69 (0.51, 0.88) | 29703.7 (26783.51, 32623.9) | 25320.15 (22564.8, 28075.51) | 2.36 (2.17, 2.55) |
| Oceania | 7282.16 (6638.89, 7925.43) | 7025.88 (6430.44, 7621.32) | 0.39 (0.17, 0.62) | 28663.27 (26270.75, 31055.79) | 24822.02 (22441.51, 27202.53) | 2.07 (1.89, 2.26) |
| America | 8795.43 (8257.8, 9295.57) | 8394.13 (7864.71, 8889.84) | 0.52 (0.31, 0.72) | 29195.14 (27054.8, 31335.48) | 25317.62 (23333.24, 27302.01) | 2.05 (1.87, 2.24) |
| High systolic blood pressure (SBP) | Ischemic heart disease | |||||
| Region | 2015 | 2009 | 2009–2015 EAPC | 2019 | 2009 | 2009–2019 EAPC |
| Global | 22078.6 (24798.17, 19573.65) | 23078.95 (24774.74, 21431.11) | –0.74 (−0.98, –0.49) | 2421.02 (2180.5, 2692.65) | 2422.21 (2185.13, 2688.5) | –0.01 (–0.39, 0.37) |
| Africa | 27269.91 (26515.46, 28024.36) | 27910.66 (27337.87, 28483.45) | –0.39 (−0.61, –0.16) | 2819.42 (2580.09, 3098.08) | 2814.78 (2584.93, 3072.69) | 0.02 (–0.33, 0.37) |
| Central and South Asia | 26256.46 (25139.35, 27373.58) | 26062.04 (25049.67, 27074.4) | 0.12 (–0.11, 0.35) | 3577.7 (3326.28, 3829.11) | 3510.51 (3256.78, 3764.25) | 0.18 (–0.13, 0.49) |
| East Asia | 19997.47 (18656.73, 21338.2) | 20935.67 (19829.41, 22041.94) | –0.76 (−1.02, –0.5) | 2052.09 (1817.64, 2286.54) | 2056.98 (1821.18, 2292.77) | –0.01 (–0.43, 0.4) |
| Europe | 23278.69 (21812.71, 24744.67) | 25915.06 (24642.41, 27187.72) | –1.77 (−2, –1.54) | 2476.75 (2203.31, 2750.18) | 2548.31 (2267.8, 2828.82) | –0.3 (–0.67, 0.08) |
| Middle East | 22293.46 (20587.65, 23999.28) | 24327.72 (23042.57, 25612.87) | –1.48 (−1.72, –1.24) | 4843.02 (4243.46, 5442.58) | 4949.35 (4386.28, 5512.41) | –0.27 (−0.54, –0.003) |
| Oceania | 18081.14 (15851.15, 20311.13) | 19610.27 (18278.28, 20942.26) | –1.34 (−1.61, –1.08) | 2734.98 (2611.03, 2858.93) | 2843.93 (2697.13, 2990.73) | –0.43 (−0.79, –0.08) |
| America | 18041.91 (16571.13, 19512.69) | 19505.67 (17874.04, 21137.3) | –1.29 (−1.56, –1.02) | 1695.56 (1530.76, 1871.92) | 1770.96 (1602.8, 1955.71) | –0.46 (−0.91, –0.01) |
| Intracerebral hemorrhage | Ischemic stroke | |||||
| Region | 2019 | 2009 | 2009–2019 EAPC | 2019 | 2009 | 2009–2019 EAPC |
| Global | 248.77 (217.09, 281.43) | 257.65 (226.36, 289.73) | –0.4 (–1.57, 0.79) | 950.97 (849.82, 1064.06) | 916.46 (827.21, 1011.45) | 0.43 (–0.18, 1.05) |
| Africa | 314.25 (281.2, 349.75) | 340.25 (305.47, 377.42) | –0.88 (–1.9, 0.15) | 1089.33 (984.73, 1198.86) | 1071.4 (971.23, 1174.89) | 0.18 (–0.39, 0.75) |
| Central and South Asia | 267.03 (223.81, 310.25) | 268.32 (214.19, 322.45) | –0.05 (–1.19, 1.1) | 570.43 (480.32, 660.53) | 533.37 (437.92, 628.82) | 0.76 (–0.04, 1.57) |
| East Asia | 302.65 (221.3, 384.01) | 319.25 (236.89, 401.6) | –0.58 (–1.64, 0.48) | 1183.05 (1086.71, 1279.4) | 1074.86 (1001.51, 1148.22) | 1.09 (0.53, 1.65) |
| Europe | 139.23 (120.98, 157.49) | 158.58 (135.99, 181.17) | –1.44 (–2.94, 0.09) | 753.15 (676.12, 830.17) | 813.8 (730.34, 897.26) | –0.85 (−1.51, –0.19) |
| Middle East | 255.65 (199.55, 311.75) | 268.51 (211.97, 325.06) | –0.7 (–1.85, 0.46) | 1218.88 (1060.37, 1377.4) | 1220.26 (1066.3, 1374.22) | –0.07 (–0.61, 0.47) |
| Oceania | 264.45 (113.71, 415.19) | 258.3 (103.93, 412.68) | 0.17 (–0.98, 1.34) | 650.92 (557.27, 744.58) | 655.29 (569.12, 741.47) | –0.09 (–0.82, 0.64) |
| America | 200.52 (176.38, 226.00) | 212.00 (188.08, 237.72) | –0.58 (–1.87, 0.73) | 932.69 (829.99, 1041.00) | 977.11 (888.38, 1068.44) | –0.4 (–1.00, 0.21) |
| Subarachnoid hemorrhage | Stroke | |||||
| Region | 2019 | 2009 | 2009–2019 EAPC | 2019 | 2009 | 2009–2019 EAPC |
| Global | 101.57 (87.13, 118.54) | 103.6 (89.2, 120.53) | –0.22 (–2.05, 1.64) | 1240.26 (1139.71, 1352.99) | 1217.36 (1126.81, 1313.52) | 0.22 (–0.31, 0.76) |
| Africa | 52.47 (44.76,61.46) | 53.58 (45.9, 62.63) | –0.2 (–2.74, 2.39) | 1393.27 (1288.31, 1503.93) | 1402.18 (1303.49, 1509.44) | –0.08 (–0.57, 0.43) |
| Central and South Asia | 65.01 (56.51,73.52) | 64.76 (54.84,74.67) | 0.05 (–2.25, 2.41) | 858.5 (737.58, 979.42) | 822.67 (682.76, 962.57) | 0.48 (–0.16, 1.14) |
| East Asia | 107.87 (72.53, 143.2) | 107.03 (72.44, 141.62) | 0.12 (–1.67, 1.95) | 1513.1 (1390.7, 1635.49) | 1425.39 (1298.41, 1552.38) | 0.69 (0.2, 1.18) |
| Europe | 118.34 (108.49, 128.2) | 124.24 (112.18, 136.31) | –0.52 (–2.19, 1.18) | 960.86 (861.79, 1059.92) | 1042.89 (932.11, 1153.68) | –0.9 (−1.49, –0.31) |
| Middle East | 66.69 (58.12,75.25) | 67.19 (57.51,76.87) | –0.03 (–2.27, 2.26) | 1471.6 (1292.03, 1651.17) | 1485.6 (1313.34, 1657.86) | –0.18 (–0.66, 0.31) |
| Oceania | 105.79 (85.55, 126.03) | 104.66 (83.96, 125.35) | 0.13 (–1.68, 1.97) | 970.31 (719.9, 1220.73) | 967.25 (721.78, 1212.72) | –0.0006 (–0.6, 0.6) |
| America | 138.9 (119.01, 162.64) | 127.3 (110.52, 146.72) | 0.75 (–0.87, 2.4) | 1215.6 (1113.69, 1328.23) | 1259.25 (1171.81, 1351.47) | –0.32 (–0.85, 0.22) |
| Type 1 diabetes | Type 2 diabetes | |||||
| Region | 2019 | 2009 | 2009–2019 EAPC | 2019 | 2009 | 2009–2019 EAPC |
| Global | 272.54 (216.98, 336.95) | 250.88 (203.63, 307.25) | 0.71 (–0.45, 1.89) | 5282.85 (4853.59, 5752.09) | 4646.97 (4341.45, 4960.45) | 1.24 (0.97, 1.51) |
| Africa | 255.51 (201.1, 318.05) | 227.8 (179.02, 286.18) | 1.16 (–0.06, 2.39) | 4516.3 (4096.49, 4976.22) | 3939.47 (3629.16, 4276.48) | 1.35 (1.06, 1.64) |
| Central and South Asia | 250.87 (235.66, 266.09) | 222.68 (211.11, 234.25) | 1.12 (–0.1, 2.36) | 6401.5 (5931.41, 6871.58) | 5054.2 (4714.43, 5393.97) | 2.18 (1.93, 2.44) |
| East Asia | 132.14 (92.27, 172) | 117.02 (75.77, 158.27) | 0.97 (–0.72, 2.7) | 4477.09 (4223.96, 4730.21) | 4237.06 (3842.25, 4631.87) | 0.68 (0.4, 0.97) |
| Europe | 499.9 (451.46, 548.34) | 458.58 (394.14, 523.02) | 0.69 (–0.17, 1.56) | 4691.56 (4113.82, 5269.3) | 4044.18 (3599.81, 4488.54) | 1.45 (1.16, 1.74) |
| Middle East | 394.02 (354.45, 433.59) | 297 (246.27, 347.72) | 2.84 (1.79, 3.89) | 6796.8 (5773.01, 7820.59) | 5937.92 (5063.13, 6812.7) | 1.3 (1.06, 1.53) |
| Oceania | 459.51 (335.35, 583.67) | 441.02 (327.93, 554.11) | 0.4 (–0.48, 1.29) | 5606.6 (3790.83, 7422.38) | 4732.14 (3129.63, 6334.64) | 1.87 (1.61, 2.14) |
| America | 417.47 (337.43, 511.23) | 408.22 (340.36, 487.84) | 0.14 (–0.79, 1.07) | 6563.01 (6071.37, 7036.07) | 5862.85 (5515.86, 6198.91) | 1.09 (0.85, 1.33) |
Additional files
-
Supplementary file 1
Supplementary information.
(a) Global incidence, mortality, and prevalence rates for stroke, its subtypes, and comorbid factors. (b) Spatio-temporal comparison of mortality rates of stroke, its subtypes, and comorbid factors. (c) Spatio-temporal comparison of prevalence rates of stroke, its subtypes, and comorbid factors. (d) Comparison of proportional mortality of stroke, high SBP, and metabolic conditions. (e) Comparison of proportional prevalence of stroke, high SBP, and metabolic conditions. (f) Variants and genes associated with stroke and its comorbid factors that are shared among populations, as well as unique to populations. (g) Continent Regions. (h) Number of final risk variants for each disease.
- https://cdn.elifesciences.org/articles/94088/elife-94088-supp1-v1.docx
-
MDAR checklist
- https://cdn.elifesciences.org/articles/94088/elife-94088-mdarchecklist1-v1.docx
Download links
A two-part list of links to download the article, or parts of the article, in various formats.
Downloads (link to download the article as PDF)
Open citations (links to open the citations from this article in various online reference manager services)
Cite this article (links to download the citations from this article in formats compatible with various reference manager tools)
Ethnic and region-specific genetic risk variants of stroke and its comorbid conditions can define the variations in the burden of stroke and its phenotypic traits
eLife 13:RP94088.
https://doi.org/10.7554/eLife.94088.3


