CyAbrB2 is a nucleoid-associated protein in Synechocystis controlling hydrogenase expression during fermentation
- School of Agriculture, Meiji University, Japan
eLife assessment
The authors provide solid data on a functional investigation of potential nucleoid-associated proteins and the modulation of chromosomal conformation in a model cyanobacterium. These valuable findings will be of interest to the chromosome and microbiology fields. Additional analysis and the tempering of conclusions has helped to improve the work, although further refinement remains possible.
https://doi.org/10.7554/eLife.94245.3.sa0Significance of the findings:
Valuable: Findings that have theoretical or practical implications for a subfield
- Landmark
- Fundamental
- Important
- Valuable
- Useful
Strength of evidence:
Solid: Methods, data and analyses broadly support the claims with only minor weaknesses
- Exceptional
- Compelling
- Convincing
- Solid
- Incomplete
- Inadequate
During the peer-review process the editor and reviewers write an eLife Assessment that summarises the significance of the findings reported in the article (on a scale ranging from landmark to useful) and the strength of the evidence (on a scale ranging from exceptional to inadequate). Learn more about eLife Assessments
Abstract
The hox operon in Synechocystis sp. PCC 6803, encoding bidirectional hydrogenase responsible for H2 production, is transcriptionally upregulated under microoxic conditions. Although several regulators for hox transcription have been identified, their dynamics and higher-order DNA structure of hox region in microoxic conditions remain elusive. We focused on key regulators for the hox operon: cyAbrB2, a conserved regulator in cyanobacteria, and SigE, an alternative sigma factor. Chromatin immunoprecipitation sequencing revealed that cyAbrB2 binds to the hox promoter region under aerobic conditions, with its binding being flattened in microoxic conditions. Concurrently, SigE exhibited increased localization to the hox promoter under microoxic conditions. Genome-wide analysis revealed that cyAbrB2 binds broadly to AT-rich genome regions and represses gene expression. Moreover, we demonstrated the physical interactions of the hox promoter region with its distal genomic loci. Both the transition to microoxic conditions and the absence of cyAbrB2 influenced the chromosomal interaction. From these results, we propose that cyAbrB2 is a cyanobacterial nucleoid-associated protein (NAP), modulating chromosomal conformation, which blocks RNA polymerase from the hox promoter in aerobic conditions. We further infer that cyAbrB2, with altered localization pattern upon microoxic conditions, modifies chromosomal conformation in microoxic conditions, which allows SigE-containing RNA polymerase to access the hox promoter. The coordinated actions of this NAP and the alternative sigma factor are crucial for the proper hox expression in microoxic conditions. Our results highlight the impact of cyanobacterial chromosome conformation and NAPs on transcription, which have been insufficiently investigated.
Introduction
Cyanobacteria perform fermentation, using glycolytic products as electron acceptors (Stal and Moezelaar, 1997). Cyanobacteria have multiple fermentation pathways according to the environment. For example, the freshwater living cyanobacterium Synechocystis sp. PCC 6803 (hereafter referred to as Synechocystis) produces acetate, lactate, dicarboxylic acids, and hydrogen (Stal and Moezelaar, 1997; Osanai et al., 2015).
Hydrogen is generated in quantities comparable to lactate and dicarboxylic acids as the result of electron acceptance in the dark microoxic condition (Iijima et al., 2016; Akiyama and Osanai, 2023). Bidirectional hydrogenase is a key enzyme for H2 production from protons (Carrieri et al., 2011) and is commonly found in cyanobacteria (Puggioni et al., 2016). Cyanobacterial hydrogenase comprises five subunits (HoxEFUHY) containing nickel and Fe-S clusters (Cassier-Chauvat et al., 2014). This enzyme can utilize NADH, reduced ferredoxin, and flavodoxin as substrates (Gutekunst et al., 2014). Hydrogenase mainly receives reduced ferredoxin from pyruvate-ferredoxin oxidoreductase (PFOR) in the microoxic condition (Gutekunst et al., 2014; Artz et al., 2020).
Although hydrogenase and PFOR are O2 sensitive, they can work under aerobic conditions (Wang et al., 2021; Burgstaller et al., 2022; Appel et al., 2000). Therefore, uncontrolled expression of hox operon and nifJ (coding gene of PFOR) may hamper metabolism under photosynthetic conditions. Furthermore, genetic manipulations on Synechocystis have demonstrated that modulating the expression of certain enzymes including hydrogenase can alter fermentative metabolic flow (Iijima et al., 2016; Akiyama and Osanai, 2023; Iijima et al., 2021). This provides evidence that transcription regulates the fermentative pathway. Thus, transcriptional regulation in response to the environment is essential for optimal energy cost performance.
Promoter recognition by RNA polymerases is an essential step in transcriptional regulation. Sigma factors, subunits of RNA polymerase, recognize core promoter sequences. Transcription factors can also bind to promoter regions to suppress or promote RNA polymerase transcription. As well as recruitment or blocking of RNA polymerase, some transcriptional factors, known as nucleoid-associated proteins (NAPs), modulate chromosomal conformation to regulate transcription (Hołówka and Zakrzewska-Czerwińska, 2020). NAPs are common in bacteria, but cyanobacterial NAPs remain unidentified, and higher-order DNA structure in cyanobacteria is yet to be shown. A recent study suggested that the manipulation of chromosomal supercoiling impacts transcriptional properties in cyanobacteria (Behle et al., 2022). There is room for consideration of NAPs modulating chromosomal conformation and regulating expression in cyanobacteria.
In Synechosysits, the coding genes of HoxEFUHY form a single operon (sll1220–1226), while PFOR is encoded in the nifJ (sll0741) gene. Both hox and nifJ operons are highly expressed under microoxic conditions (Summerfield et al., 2011). Genetic analysis has revealed that multiple global transcriptional regulators control hox and nifJ expression. Sigma factor SigE (Sll1689) promotes the expression of hox and nifJ operons (Osanai et al., 2005; Osanai et al., 2011), while transcription factor cyAbrB2 (Sll0822) represses them (Dutheil et al., 2012; Leplat et al., 2013). Positive regulators for the hox operon include LexA (Sll1626) and cyAbrB1 (Sll0359) (Oliveira and Lindblad, 2008; Gutekunst et al., 2005; Oliveira and Lindblad, 2005).
SigE, an alternative sigma factor, controls the expression of genes involved in glycogen catabolism and glycolysis, as well as PFOR/nifJ and hydrogenase (Osanai et al., 2005). SigE shows a high amino acid sequence similarity with the primary sigma factor SigA, which is responsible for transcribing housekeeping and photosynthetic genes (Imamura and Asayama, 2009). A ChIP-seq study revealed that, while most SigE binding sites are the same as SigA, SigE exclusively occupies the promoters of glycogen catabolism and glycolysis (Kariyazono and Osanai, 2022).
CyAbrB2 and its homolog cyAbrB1 are transcription factors highly conserved in cyanobacteria. For example, cyAbrB homologs in Anabaena sp. PCC7120 is involved in heterocyst formation (Higo et al., 2019). CyAbrB2 in Synechocystis regulates the expression of several genes involved in carbon metabolism, nitrogen metabolism, and cell division (Leplat et al., 2013; Ishii and Hihara, 2008; Lieman-Hurwitz et al., 2009). CyAbrB2 binds to the hox promoter in vitro and represses its expression in vivo (Dutheil et al., 2012). CyAbrB1, an essential gene, physically interacts with the cyAbrB2 protein (Yamauchi et al., 2011) and binds the hox promotor region in vitro to promote its expression (Oliveira and Lindblad, 2008).
To explore the dynamics of those transcription factors governing the expression of hox operon, we conducted a time-course analysis of the transcriptome and ChIP-seq of SigE and cyAbrB2. Our ChIP-seq and transcriptome analysis showed the NAPs-like nature of cyAbrB2, which prompted us to conduct a chromosomal conformation capture assay. 3C analysis explored the physical interaction between the hox promoter region and its downstream and upstream genomic region in the aerobic condition, and some loci changed interaction frequency upon entry to the microoxic condition. Furthermore, some interactions in the ∆cyabrB2 mutant were different from those of the wildtype. From those experiments, we propose that cyAbrB2 modulates chromosomal conformation like NAPs, allowing access to the SigE-containing RNA polymerase complex on the hox promoter, by which the hox operon achieves distinct expression dynamics. Chromosomal conformation of bacteria is a growing area of interest, and the findings of this study have brought insight into the transcriptional regulation of cyanobacteria.
Results
Transcriptomes on entry to dark microoxic conditions
To understand transcriptional regulation under microoxic conditions, we conducted a time-course transcriptome capturing light aerobic and dark microoxic conditions at 1, 2, and 4 hr timepoints (Figure 1A). Gene set enrichment analysis (GSEA) based on KEGG pathway revealed that many biological pathways, including photosynthesis and respiration (oxidative phosphorylation), were downregulated by the transition to dark microoxic conditions from light aerobic conditions (Figure 1B). Upregulated pathways included butanoate metabolism and two-component systems. The enrichment in the butanoate metabolism pathway indicates the upregulation of genes involved in carbohydrate metabolism. We further classified genes according to their expression dynamics. Within 1 hr of switching from aerobic to microoxic conditions, the expression levels of 508 genes increased more than twofold. Furthermore, genes with increased expression levels were classified into four groups based on the time course (Figure 1C and Figure 1—figure supplement 1). Of the 508 genes, 28 were termed ‘transiently upregulated genes’ due to their decreased expression upon the comparison of 1 and 4 hr incubation under microoxic conditions (Log2 fold change < −0.5), and 119 were termed ‘continuously upregulated genes’, which continuously increased between 1 and 4 hr incubation under microoxic conditions (Log2 fold change >0.5). Other than 508 genes twofold upregulated within 1 hr, 28 genes showed more than fourfold increment within 4 hr but not upregulated within 1 hr. We combined those ‘Late upregulated genes’ with 508 genes and referred to as ‘All upregulated genes’ in the subsequent analysis (Figure 1—figure supplement 1). Mapping the classified genes to central carbon metabolism revealed that nifJ encoding PFOR and hox operon encoding a bidirectional hydrogenase complex were transiently upregulated (Figure 1D and Table 1). RT-qPCR verified the transient expression of hoxF, hoxH, and nifJ (Figure 2—figure supplement 1).
Figure 1 with 1 supplement see all
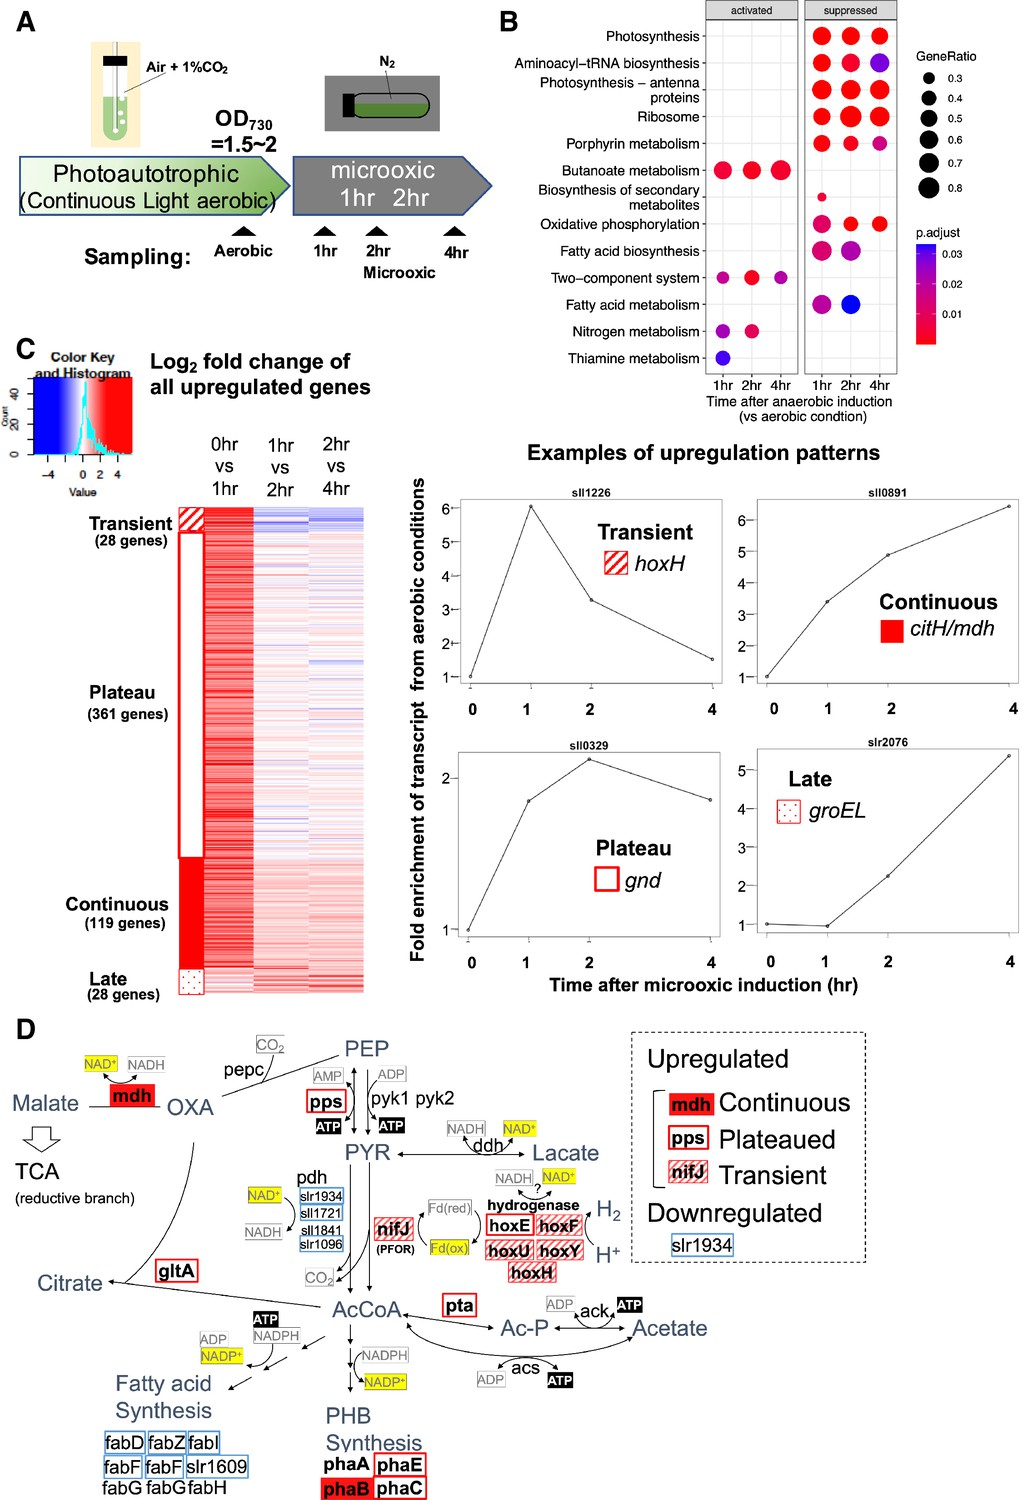
Time-course analysis of the transcriptome of Synechocystis on entry to the microoxic conditions.
(A) Schematic diagram for the sampling of cells under aerobic and microoxic conditions. (B) Gene set enrichment analysis on time-course transcriptome data. KEGG pathways enriched in upregulated or downregulated genes after 1, 2, and 4 hr incubation under microoxic conditions are shown. (C) (Left) Heatmap showing expression change in all upregulated genes over the time course. Genes classified into transient (striped square), plateau (open square), continuous (filled square), and late (dotty square) were clustered into subgroups and sorted by the gene name. (Right) Examples of genes are classified into each expression pattern. (D) The classified genes were mapped to central carbon metabolism, centered on pyruvate. PEP: phosphoenolpyruvate, PYR: pyruvate, AcCoA: acetyl CoA, Ac-P: acetyl phosphate, OXA: oxaloacetate, PHB: polyhydroxy butyrate, TCA: tricarboxylic acid cycle.
Table 1
List of transiently upregulated genes.
| Operon | ||
|---|---|---|
| Oxidoreductase | ||
| sll0741 | nifJ/‘pyruvate-ferredoxin/flavodoxin oxidoreductase’ | TU3296 |
| sll0743 | Hypothetical protein | |
| sll0744 | Dihydroorotate dehydrogenase (fumarate) | |
| sll1221 | hoxF/‘bidirectional [NiFe] hydrogenase diaphorase subunit’ | TU1714 |
| sll1222 | Unknown protein | |
| sll1223 | hoxU/‘bidirectional [NiFe] hydrogenase diaphorase subunit’ | |
| sll1224 | hoxY/‘NAD-reducing hydrogenase small subunit’ | |
| sll1225 | Unknown protein | |
| sll1226 | hoxH/‘NAD-reducing hydrogenase large subunit’ | |
| slr1434 | pntB/‘H+-translocating NAD(P) transhydrogenase subunit beta’ | TU1089 |
| Transporter | ||
| sll1450 | nrtA/‘nitrate/nitrite transport system substrate binding protein’ | TU1023 |
| sll1451 | nrtB/‘nitrate/nitrite transport system permease protein’ | |
| sll1452 | nrtC/‘nitrate/nitrite transport system ATP binding protein’ | |
| sll1453 | nrtD/‘nitrate/nitrite transport system ATP binding protein’ | |
| Two-component system | ||
| slr1214 | Twitching motility two-component system response regulator PilG | TU905 |
| slr1215 | Unknown protein | TU907 |
| Glycosyl transferase | ||
| slr2116 | spsA/‘spore coat polysaccharide biosynthesis protein; SpsA’ | TU1673 |
| Protease | ||
| sll1009 | frpC/‘iron-regulated protein’ | TU491 |
| Insertion sequence (transposase) | ||
| slr1523 | Transposase | TU1659 |
| sll1985 | Transposase | TU1589 |
| sll7001 | Transposase | NA |
| sll7003 | Toxin FitB | TU7001 |
| ssl0172 | Transposase | TU3163 |
| Other | ||
| slr1260 | Hypothetical protein | TU1446 |
| slr0668 | Unknown protein | TU3532 |
| slr5127 | Unknown protein | TU5127 |
| sll0710 | Unknown protein | TU97 |
| sll1307 | Unknown protein | TU1224 |
-
The list of transiently upregulated genes was merged by transcriptional units and sorted by function. The transcriptional unit information was obtained from a previous study (Kopf et al., 2014).
SigE and cyAbrB2 control the expression of transiently upregulated genes
The functional correlation between hydrogenase and PFOR, encoded by the hox operon and nifJ, suggests that transient upregulation has physiological significance. We focused on transiently upregulated genes and attempted to reveal the regulatory mechanism underlying transient upregulation. While SigE promotes the expression of hox and nifJ, cyAbrB2 represses them (Osanai et al., 2005; Dutheil et al., 2012; Leplat et al., 2013). We confirmed that the deletion of sigE and cyabrb2 (∆sigE and ∆cyabrb2, respectively) affected the expression of hoxF, hoxH, and nifJ by RT-qPCR (Figure 2—figure supplement 1). Thus, we conducted a time-course transcriptome analysis of ∆sigE and ∆cyabrb2 under aerobic conditions and after 1 and 2 hr cultivation in dark microoxic conditions (Figure 2A and Figure 2—figure supplement 2). The transcriptome data confirmed that SigE and cyAbrB2 regulated hox operon expression (Figure 2B). At each timepoint, we searched for differentially expressed genes (DEGs) between mutants and wildtype with a more than twofold expression change and a false discovery rate (FDR) <0.05. We found that deleting sigE or cyabrb2 preferentially affected the expression of transiently upregulated genes, not limited to hox and nifJ operons (Figure 2C and D). Interestingly, cyabrb2 deletion resulted in the upregulated expression of transient genes under aerobic conditions, in contrast to 1 hr cultivation under microoxic conditions (Figure 2C).
Figure 2 with 2 supplements see all
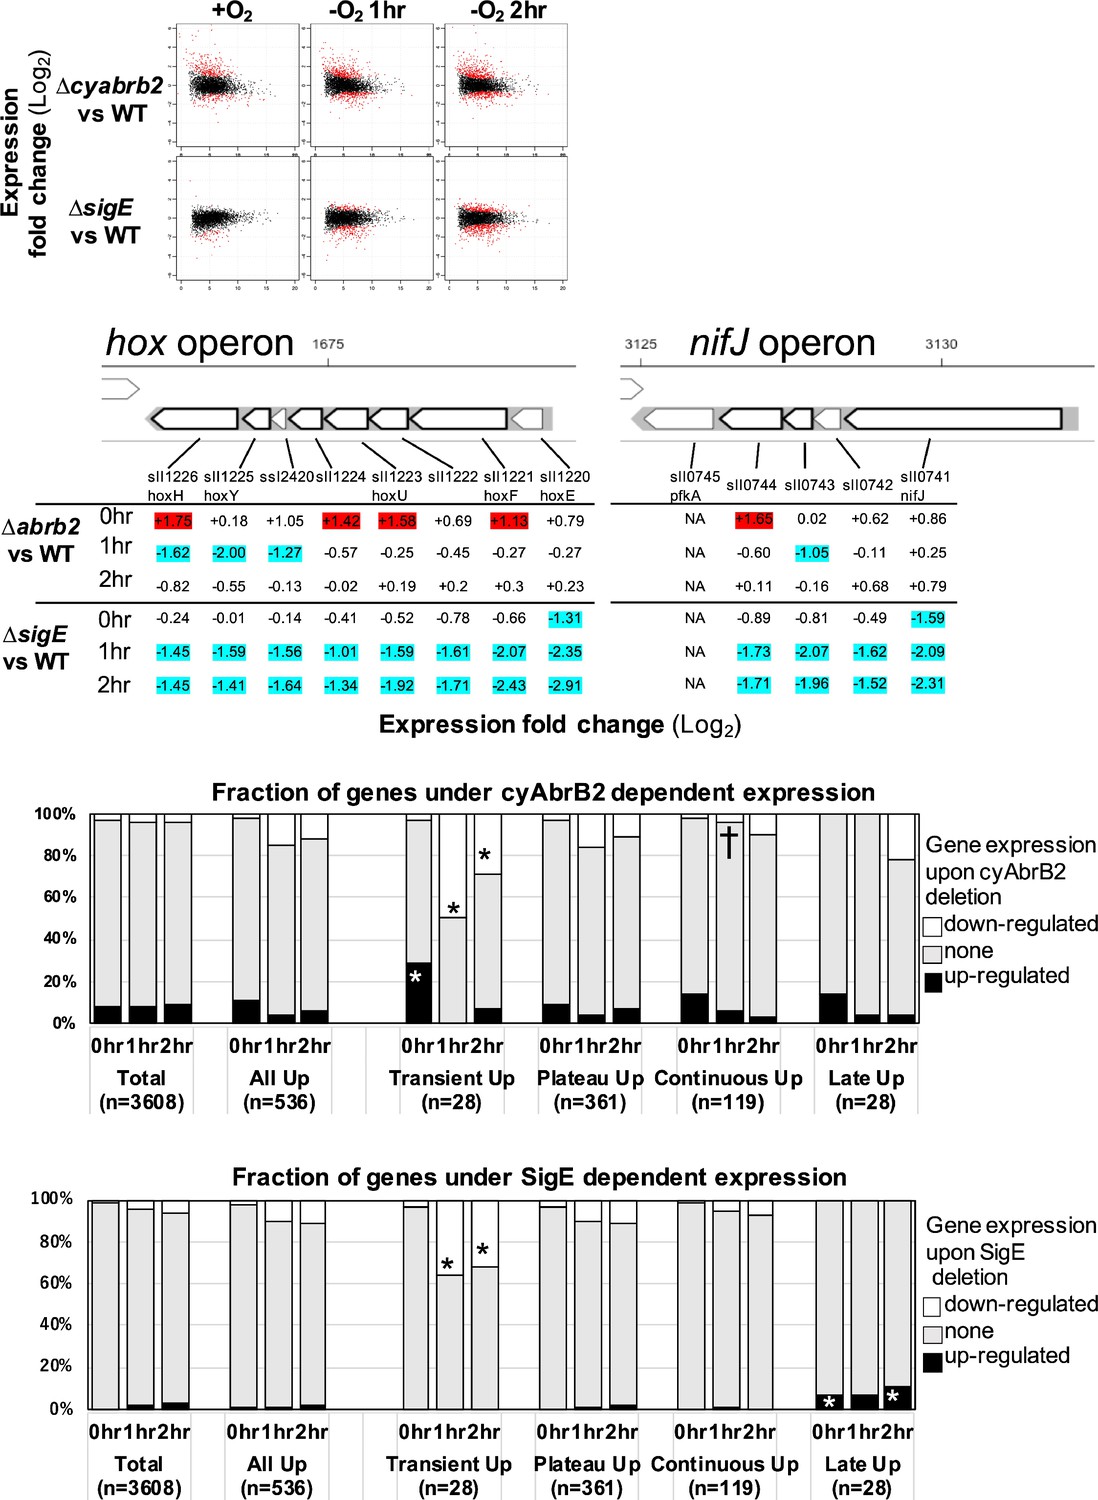
The impacts of ∆sigE and ∆cyabrb2 on the time-course transcriptome.
(A) MA plot showing fold change (y-axis) and average (x-axis) of gene expression between wildtype and mutant strains at each timepoint. Red dots indicate defined differentially expressed genes (DEGs) (|Log2 FC|>1 with false discovery rate [FDR]<0.05). (B) Log2 scaled expression fold change in genes in the hox and nifJ operons upon ∆cyabrb2 and ∆sigE under aerobic conditions (0 hr), 1 hr after microoxic condition (1 hr), and 2 hr after microoxic condition (2 hr). DEGs are marked with sky blue (downregulated upon deletion) or red (upregulated upon deletion). (C and D) Fraction of upregulated and downregulated genes upon the (C) ∆cyabrb2 and (D) ∆sigE at the timepoints of aerobic conditions (0 hr), 1 hr after anoxic condition (1 hr), and 2 hr after anoxic condition (2 hr). Genes are classified according to Figure 1C. Asterisk (*) and dagger (†) denote statistically significant enrichment and anti-enrichment compared with all upregulated genes tested by multiple comparisons of Fisher’s exact test (FDR<0.05).
Genome-wide analysis of cyAbrB2, cyAbrB1, and SigE via ChIP-seq
To decipher the regulatory mechanism of transiently upregulated genes, we must first comprehend the fundamental features and functions of these transcriptional regulators. Therefore, a genome-wide survey of cyAbrB2 and SigE occupation (Figure 3—figure supplement 1) combined with transcriptome data was done. Specifically, we generated a Synechocystis strain in which cyAbrB2 was epitope-tagged and performed a ChIP-seq assay under aerobic and microoxic conditions (Figure 3—figure supplements 2 and 3). SigE-tagged strains previously constructed and analyzed elsewhere were also employed (Kariyazono and Osanai, 2022). The primary sigma factor SigA was also analyzed to determine SigE-specific binding. In addition to cyAbrB2, we tagged and analyzed cyAbrB1, which is the interactor of cyAbrB2 and positively regulates the hox operon.
CyAbrB2 binds to long tracts of the genomic region and suppresses genes in the binding region
The ChIP-seq data showed that cyAbrB2 bound to long tracts of the genomic region with lower GC content than the whole-genome Synechocystis (Figure 3A and B). Vice versa, regions exhibiting lower GC contents showed a greater binding signal of cyAbrB2 (Figure 3C). This correlation was not a systematic bias of next-generation sequencing because the binding signals of SigE, SigA, and control showed no negative correlation to GC contents (Figure 3—figure supplement 4). The binding regions of cyAbrB2 called by peak caller covered 15.7% of the entire genome length. 805 of 3614 genes overlapped with cyAbrB2 binding regions, and almost half (399 of 805 genes) were entirely covered by cyAbrB2 binding regions. The cyAbrB2 binding regions included 80 of 125 insertion sequence elements (Figure 3D). Comparison with the transcriptome of ∆cyabrB2 revealed that cyAbrB2 tended to suppress the genes overlapping with its binding regions under aerobic conditions (Figure 3A and E). A survey of the genomic localization of cyAbrB1 under aerobic conditions revealed that cyAbrB1 and cyAbrB2 shared similar binding patterns (Figure 3A and Figure 3—figure supplement 5A). Due to the essentiality of cyAbrB1, we did not perform transcriptome analysis on a cyAbrB1-disrupted strain. Instead, we referred to the recent study performing transcriptome of cyAbrB1 knockdown strain, whose cyAbrB1 protein amount drops by half (Hishida et al., 2024). Among 24 genes induced by cyAbrB1 knockdown, 12 genes are differentially downregulated genes in cyabrb2∆ in our study (Figure 3—figure supplement 5).
Figure 3 with 5 supplements see all
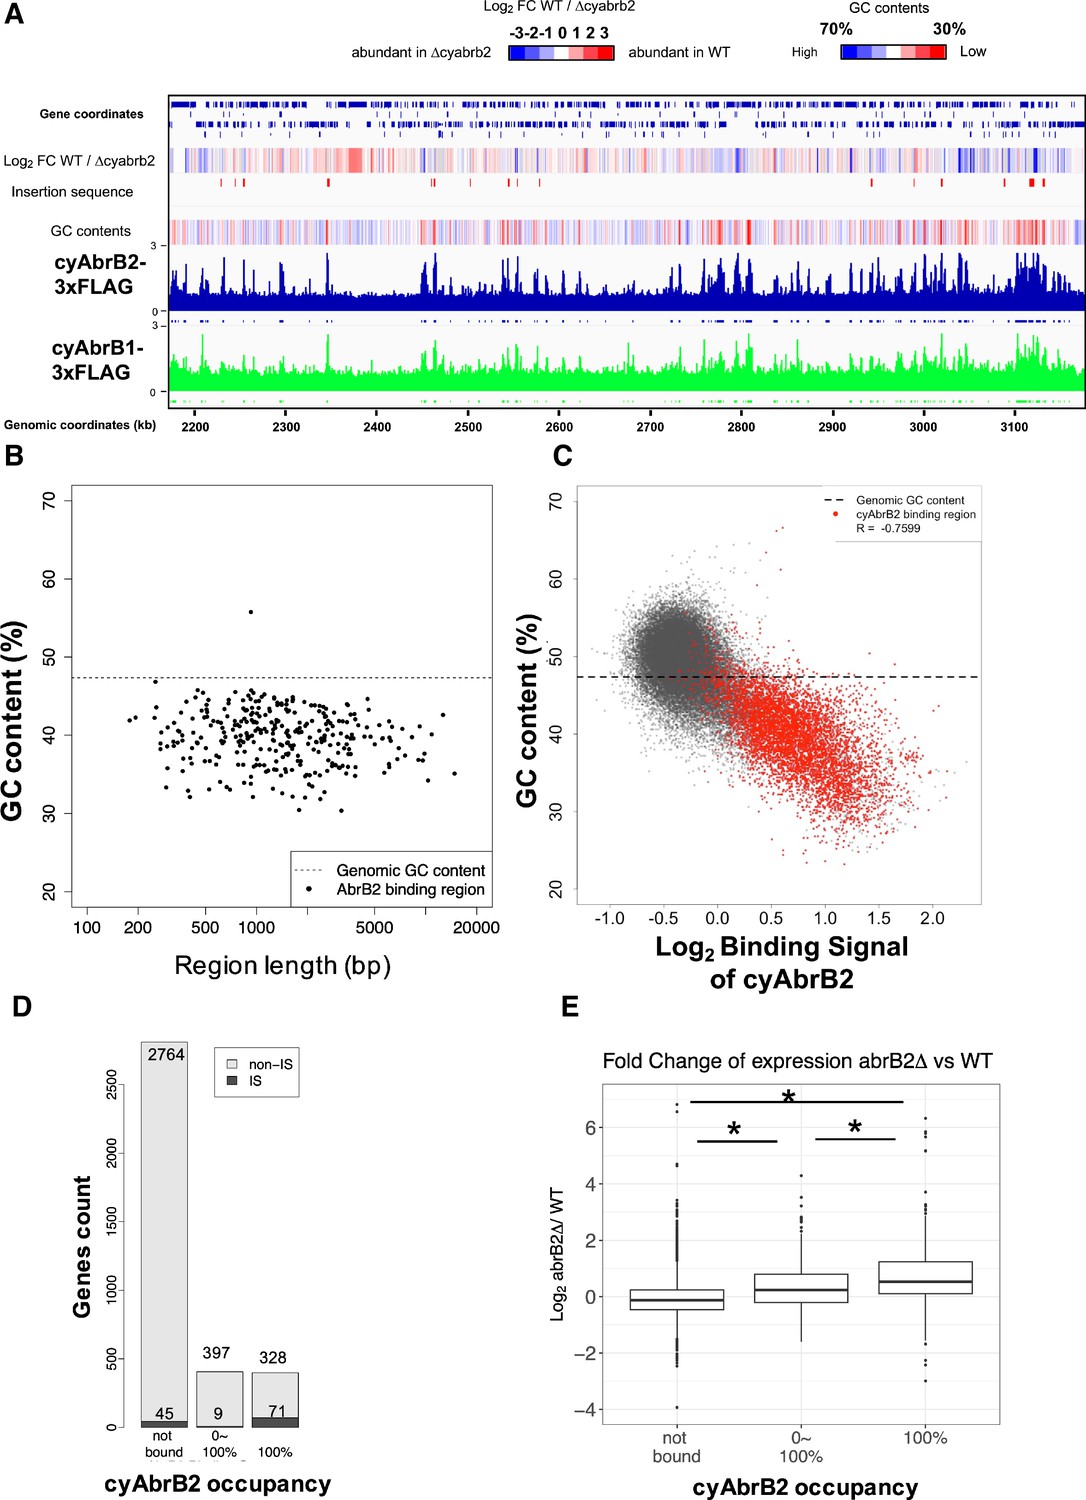
The long-tract distribution of cyAbrB2 on the Synechocystis genome and the repressive effect of cyAbrB2 on the gene expression.
(A) Snapshot of ChIP-seq data for cyAbrB2 and cyAbrB1 under aerobic conditions. The heatmap in the second column indicates expression fold change upon ∆cyabrb2 under aerobic conditions. Positive values (colored in red) indicate that the gene expression is higher in wildtype than in ∆cyabrb2, and negative values (colored in blue) indicate the opposite. The positions for the insertion elements are marked with red in the third column. The heatmap in the fourth column indicates GC contents. High GC contents are colored in blue and low GC contents are colored in blue. (B) GC contents and region length of cyAbrB2 binding regions (black dots). The horizontal dotted line indicates the genomic average of GC content. (C) Scatter plot of GC content and binding signal of cyAbrB2. The x-axis is the binding signal of cyAbrB2 in each 100 bp region, and the y-axis indicates GC contents within 500 bp windows sliding every 100 base pairs. CyAbrB2 binding regions are marked with red dots. (D) Histogram of genes showing the extent of occupancy (not bound, partially overlapped, or entirely overlapped) by the cyAbrB2 binding region. The gray bars indicate non-IS genes, and the count numbers of the non-IS genes are displayed on the gray bars. The black bars indicate the IS genes, and the count numbers of the IS genes are displayed above the black bars. (E) Boxplot showing fold change in gene expression by ∆cyabrb2 under aerobic conditions. Genes are classified according to the extent of occupancy by the cyAbrB2 binding region. Asterisk (*) denotes statistical significance tested by multiple comparisons of the Wilcoxon-rank test. Actual FDRs of "not bound vs 0~100%", "not bound vs 100%", and "0~100% vs 100%" are <2e-16, <2e-16, and 5e-06, respectively.
CyAbrB2 binds to transiently upregulated genes
The binding regions of cyAbrB2 overlapped 17 of 28 transiently upregulated genes, showing significant enrichment from all upregulated genes (Figure 4A). The transiently upregulated genes belong to 17 transcriptional units (TUs), according to the previous study (Kopf et al., 2014), and cyAbrB2 tends to bind TUs with transiently upregulated genes (Figure 4B). While cyAbrB2 covered the entire length of insertion sequences and unknown proteins, its binding positions on other transient genes were diverse (Figure 4C). Specifically, the hox and nifJ operons had two distinct binding regions located at the transcription start sites (TSSs) and middle of operons, the pntAB operon had two binding regions in the middle and downstream of the operon, and the nrtABCD operon had one binding region downstream of the operon (Figure 4C).
Figure 4
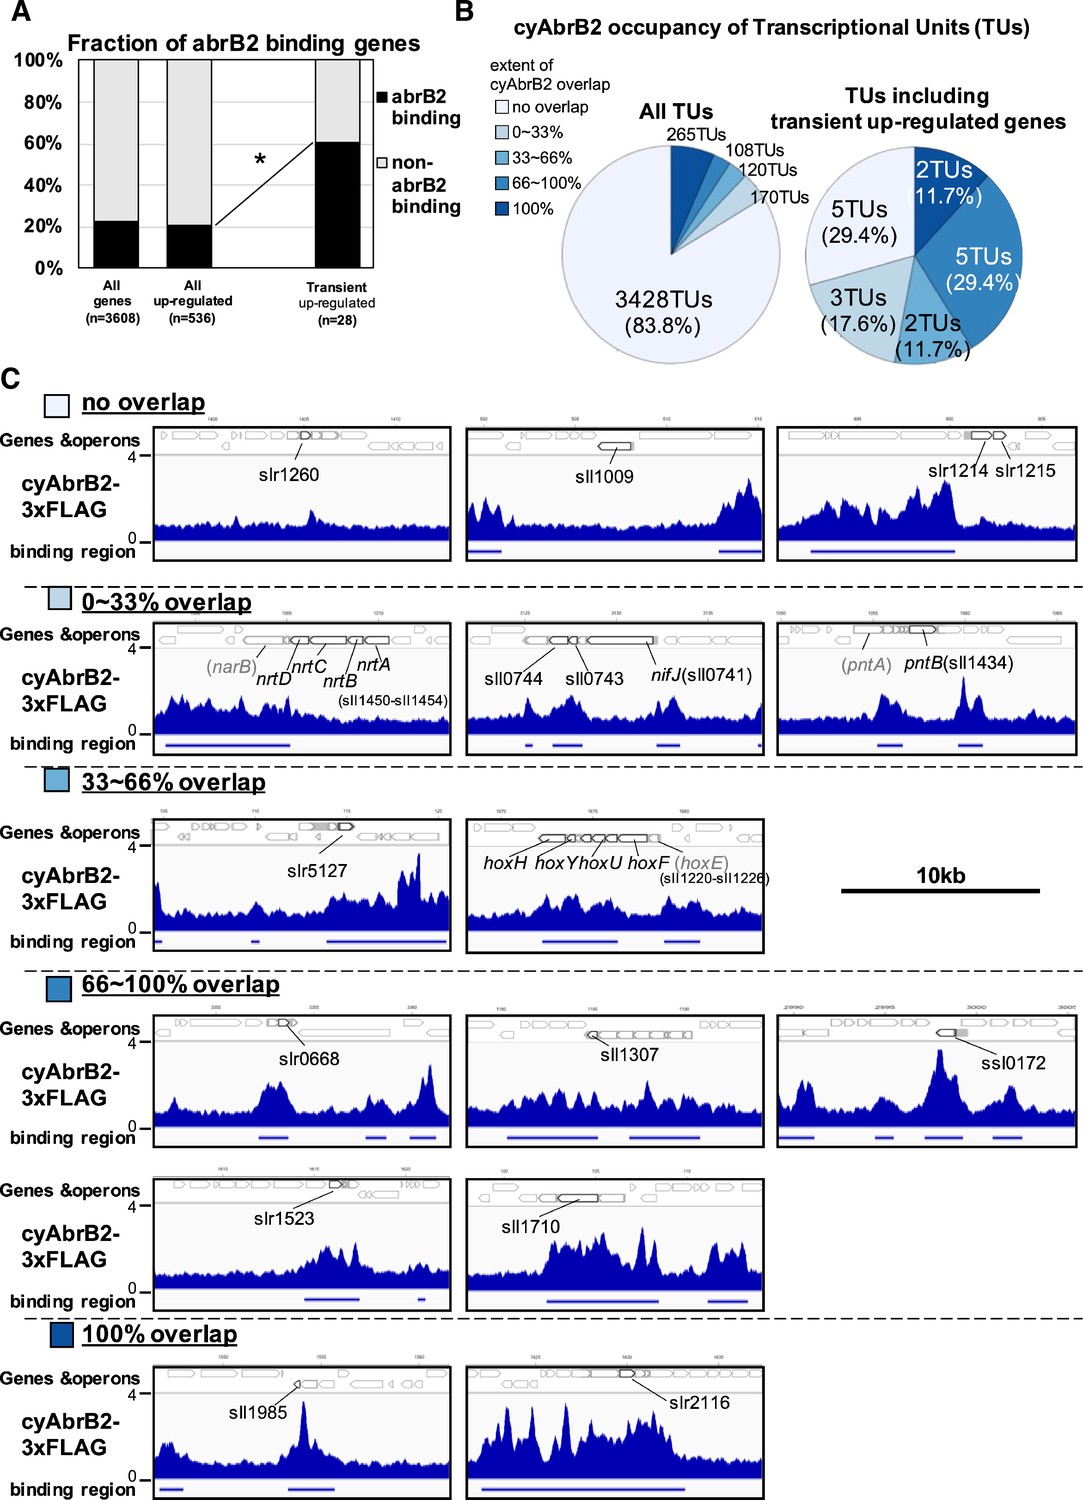
Transient up-regulated genes are enriched in cyAbrB2 binding regions.
(A) Fraction of genes overlapped or non-overlapped with cyAbrB2 binding regions at the timepoints of aerobic conditions. Genes are classified according to Figure 1—figure supplement 1. Asterisk (*) denotes statistically significant enrichment compared with all upregulated genes tested by multiple comparisons of Fisher’s exact test. (B) Pie charts of transcriptional units (TUs) classified by extent of overlapping with cyAbrB2 binding region. The left pie represents all TUs, and the right pie represents only TUs containing the transient upregulated genes. (C) Distribution of cyAbrB2 in the aerobic condition around transiently upregulated genes. Arrows with bold lines indicate transiently upregulated genes. Shaded arrows indicate operons whose data were obtained from a previous study. The bars below the graph indicate the binding regions of each protein. The black bar at the top of the figure indicates a length of 10 kbp.
Localization of cyAbrB2 became blurry under the microoxic condition
When cells entered microoxic conditions, the relative ChIP-seq signals in the cyAbrB2 binding regions slightly declined (Figure 5A and B). Notably, the total quantities of precipitated DNA by tagged cyAbrB2 did not decrease (Figure 5—figure supplement 1A), and qPCR confirmed that the cyAbrB2 binding signal increased in all positions tested (Figure 5C). ChIP-seq data and ChIP-qPCR data indicate that the boundary between cyAbrB2 binding region and cyAbrB2-free region became obscured when the cells entered microoxic conditions due to increased binding of cyAbrB2 to both cyAbrB2 binding and cyAbrB2-free region. The protein amount of cyAbrB2 was not altered on entry to the microoxic condition (Figure 5—figure supplement 1B). The cyAbrB2 binding signal around the transiently upregulated genes became less specific upon entry into microoxic conditions, consistent with the general tendency (Figure 5B). The amount of DNA immunoprecipitated by cyAbrB1 was also increased in the microoxic condition, and the protein amount was not increased (Figure 5—figure supplement 2).
Figure 5 with 2 supplements see all
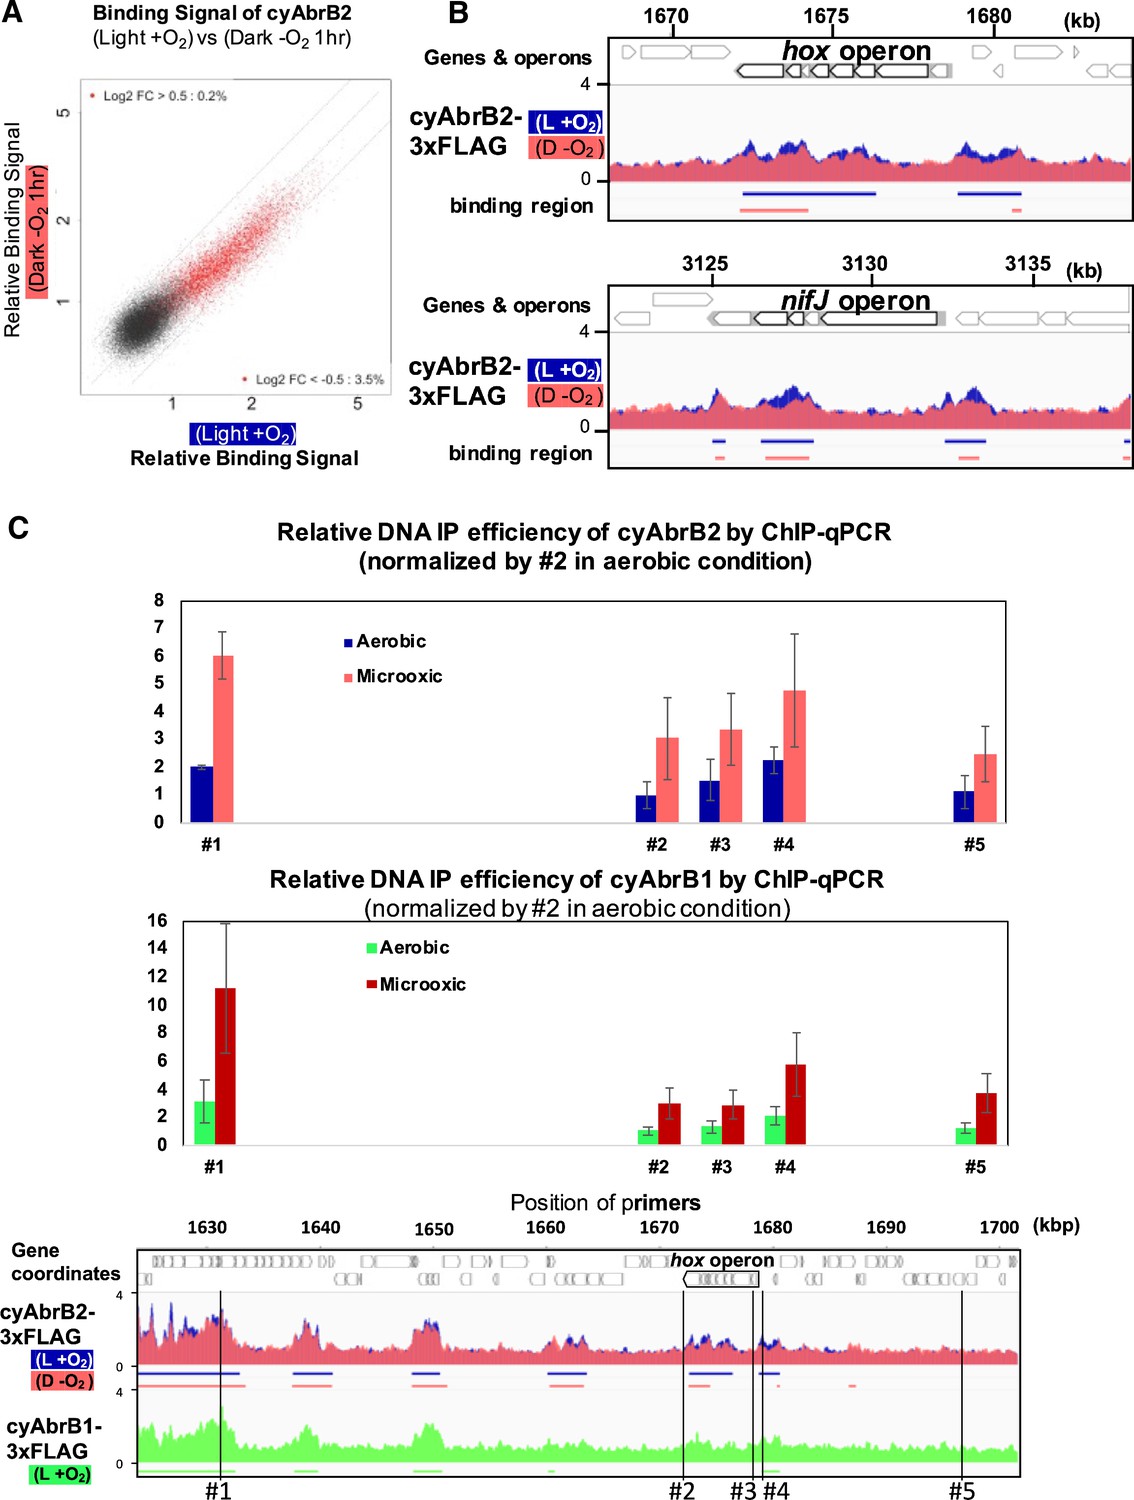
Changes of cyAbrB2 binding pattern on entry to the microoxic condition.
(A) Scatter plot showing changes of the binding signal by 1 hr cultivation in the microoxic condition. The binding signal of each 100 bp window is plotted. Red dots are cyAbrB2 binding regions in either aerobic or microoxic conditions. The dotty lines indicate Log2 fold enrichment of 0.5, 0, and –0.5 between aerobic and microoxic conditions. (B) Distribution of cyAbrB2 around hox operon and nifJ operon. ChIP-seq data in aerobic (L + O2) and dark microoxic (D − O2) conditions are overlayed. The bars below the graph indicate the binding regions of each protein. (C) Quantification for IP efficiency of cyAbrB2 (top) and cyAbrB1 (middle) by qPCR in the aerobic and microoxic conditions. The position of primers and ChIP-seq data of cyAbrB2 are shown at the bottom. Scores are normalized by the IP% at position #2 in the aerobic condition. Error bars represent standard deviation (n=3).
Sigma factors SigE and SigA are excluded from cyAbrB2 binding regions regardless of GC contents
We searched for SigE and SigA binding sites under aerobic and microoxic conditions (Figure 6—figure supplement 1, left and right, respectively). The SigE and SigA peaks identified in this study predominantly covered the previously identified peaks (Figure 6—figure supplement 2), reproducing the previous study’s conclusion (Kariyazono and Osanai, 2022), i.e., SigE and the primary sigma factor SigA share localization on the promoters of housekeeping genes, but SigE exclusively binds to the promoters of its dependent genes. SigE and SigA binding peaks were significantly excluded from the cyAbrB2 binding regions (Figure 6A and B). SigE preferred the cyAbrB2-free region in the aerobic condition more than SigA did (odds ratios of SigE and SigA being in the cyAbrB2-free region were 4.88 and 2.74, respectively). CyAbrB2 prefers AT-rich regions, but no correlation was found between the GC content and binding signals of SigE and SigA (Figure 3—figure supplement 4). Thus, SigA and SigE are excluded from cyAbrB2 binding regions regardless of GC contents.
Figure 6 with 2 supplements see all
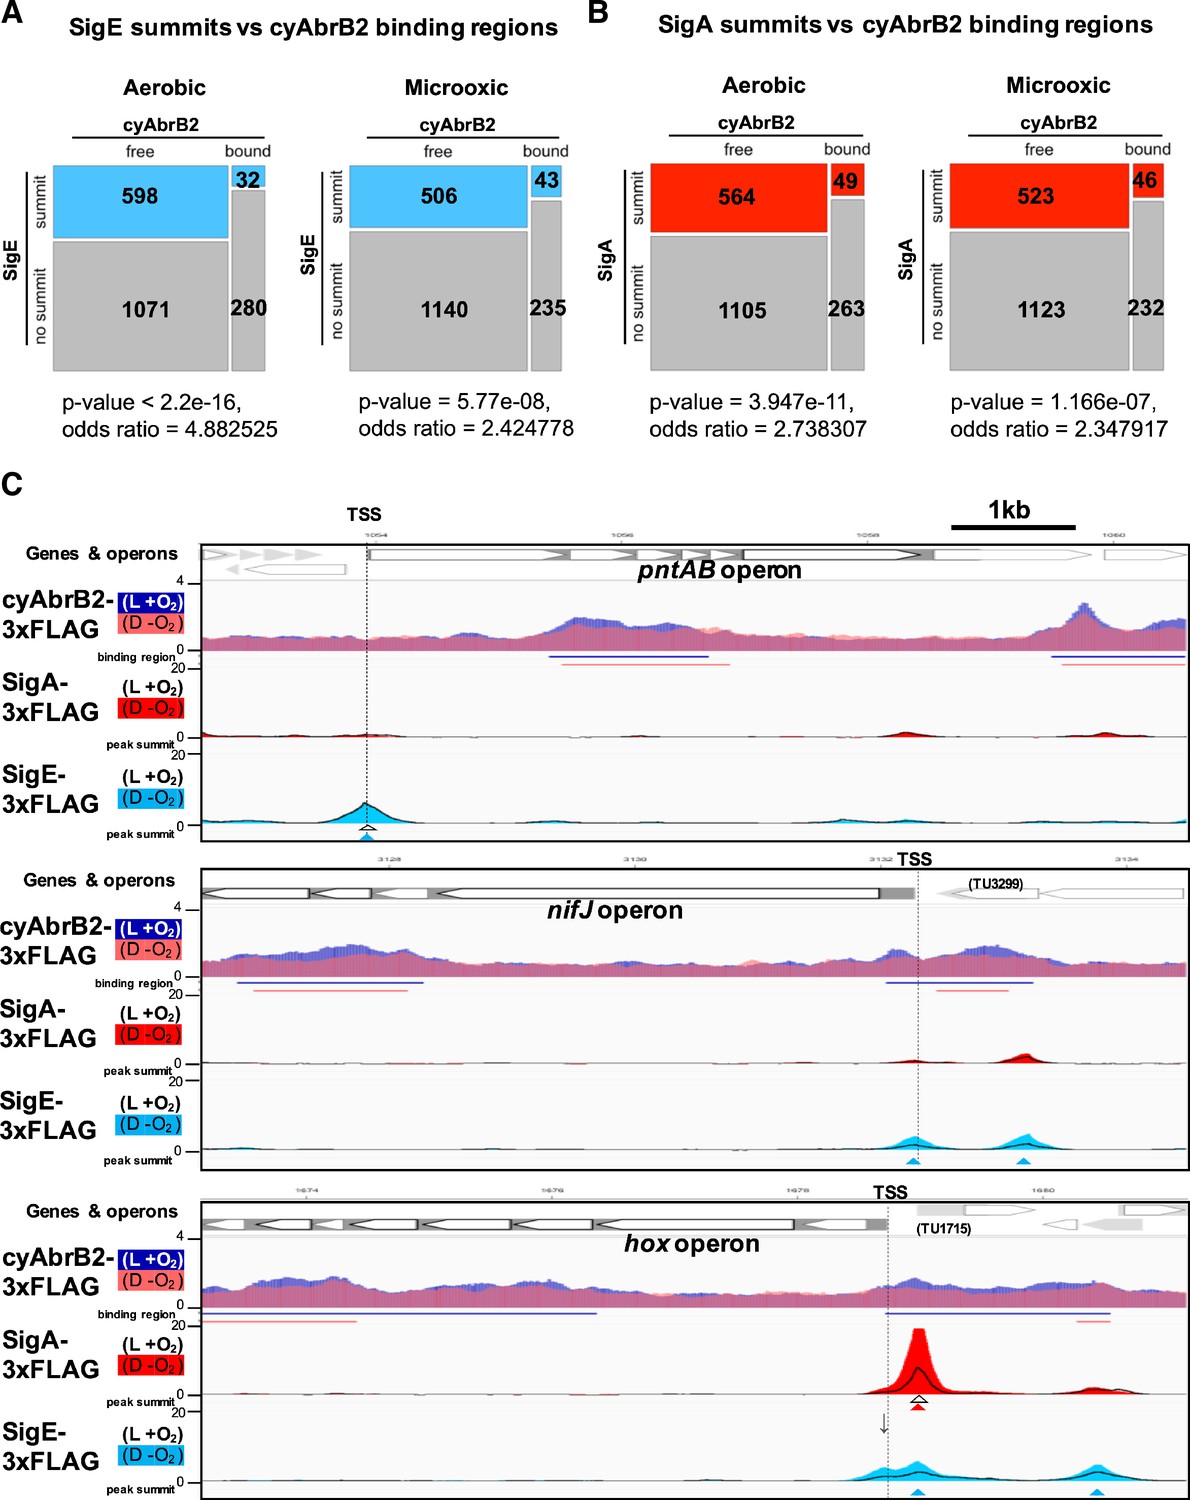
Sigma factors are excluded from cyAbrB2 binding regions.
(A and B) Anti-co-occurrence of cyAbrB2 binding regions and sigma factors. Mosaic plots of cyAbrB2 binding regions and SigE peaks (A) or SigA binding peaks (B) are shown. Odds and p-values were calculated by Fisher’s exact test. (C) Snapshots of ChIP-seq data for CyAabrB2, SigE, and SigA at the nifJ region (top) and hox region (bottom). ChIP-seq data for cyAbrB2, SigE, and SigA under aerobic and dark microoxic conditions are overlayed. ChIP-seq data of cyAbrB2 under aerobic and microoxic conditions are colored blue and pink, respectively. ChIP-seq data for SigE and SigA are shown in solid lines (aerobic conditions) and the area charts (microoxic conditions). The positions of transcription start sites (TSSs) were obtained from a previous study (Kopf et al., 2014) and indicated by vertical dotted lines. Open triangles indicate peak summits under aerobic conditions, and solid triangles indicate peak summits under microoxic conditions.
Dynamics of sigma factors upon exposure to the microoxic condition
When cells entered microoxic conditions, the binding signals of SigA and SigE were changed, although most of their peaks observed under aerobic conditions were present under microoxic conditions (Figure 6—figure supplement 1). The preference of SigE for the cyAbrB2-free region was alleviated in the microoxic condition (Figure 6A). Next, we focused on sigma factor dynamics in transiently upregulated genes. SigE, but not SigA, binds at the TSS of pntAB under aerobic and microoxic conditions (Figure 6C, top). SigE binding summits were not identified at the TSSs of the hox and nifJ operons under aerobic conditions. However, the SigE-specific binding summit appeared at the TSS of nifJ when cells entered microoxic conditions (Figure 6C, middle). A bimodal peak of SigE was observed at the TSS of the hox operon in a microoxic-specific manner (Figure 6C, bottom panel). The downstream side of the bimodal SigE peak coincides with the SigA peak and the TSS of TU1715. Another side of the bimodal peak lacked SigA binding and was located at the TSS of the hox operon (marked with an arrow in Figure 6C), although the peak caller failed to recognize it as a peak. SigE binding without SigA on the promoters of hox, nifj, and pntAB is consistent with their SigE-dependent expression (Figure 2B).
Chromatin conformation around hox operon and nifJ operon
We have shown that cyAbrB2 broadly binds to AT-rich genomic regions, including insertion element sequences, and represses expression (Figure 3). This is functionally similar to the NAPs (Hołówka and Zakrzewska-Czerwińska, 2020), which makes us hypothesize that cyAbrB2 modulates chromosomal conformation. Therefore, we conducted the chromatin conformation capture (3C) assay against wildtype and cyabrb2∆ strains at aerobic and microoxic conditions. qPCR was performed with unidirectional primer sets, where the genomic fragment containing hox operon and nif operon (hereinafter hox fragment and nifJ fragment, respectively) were used as bait (Figure 7).
Figure 7 with 2 supplements see all
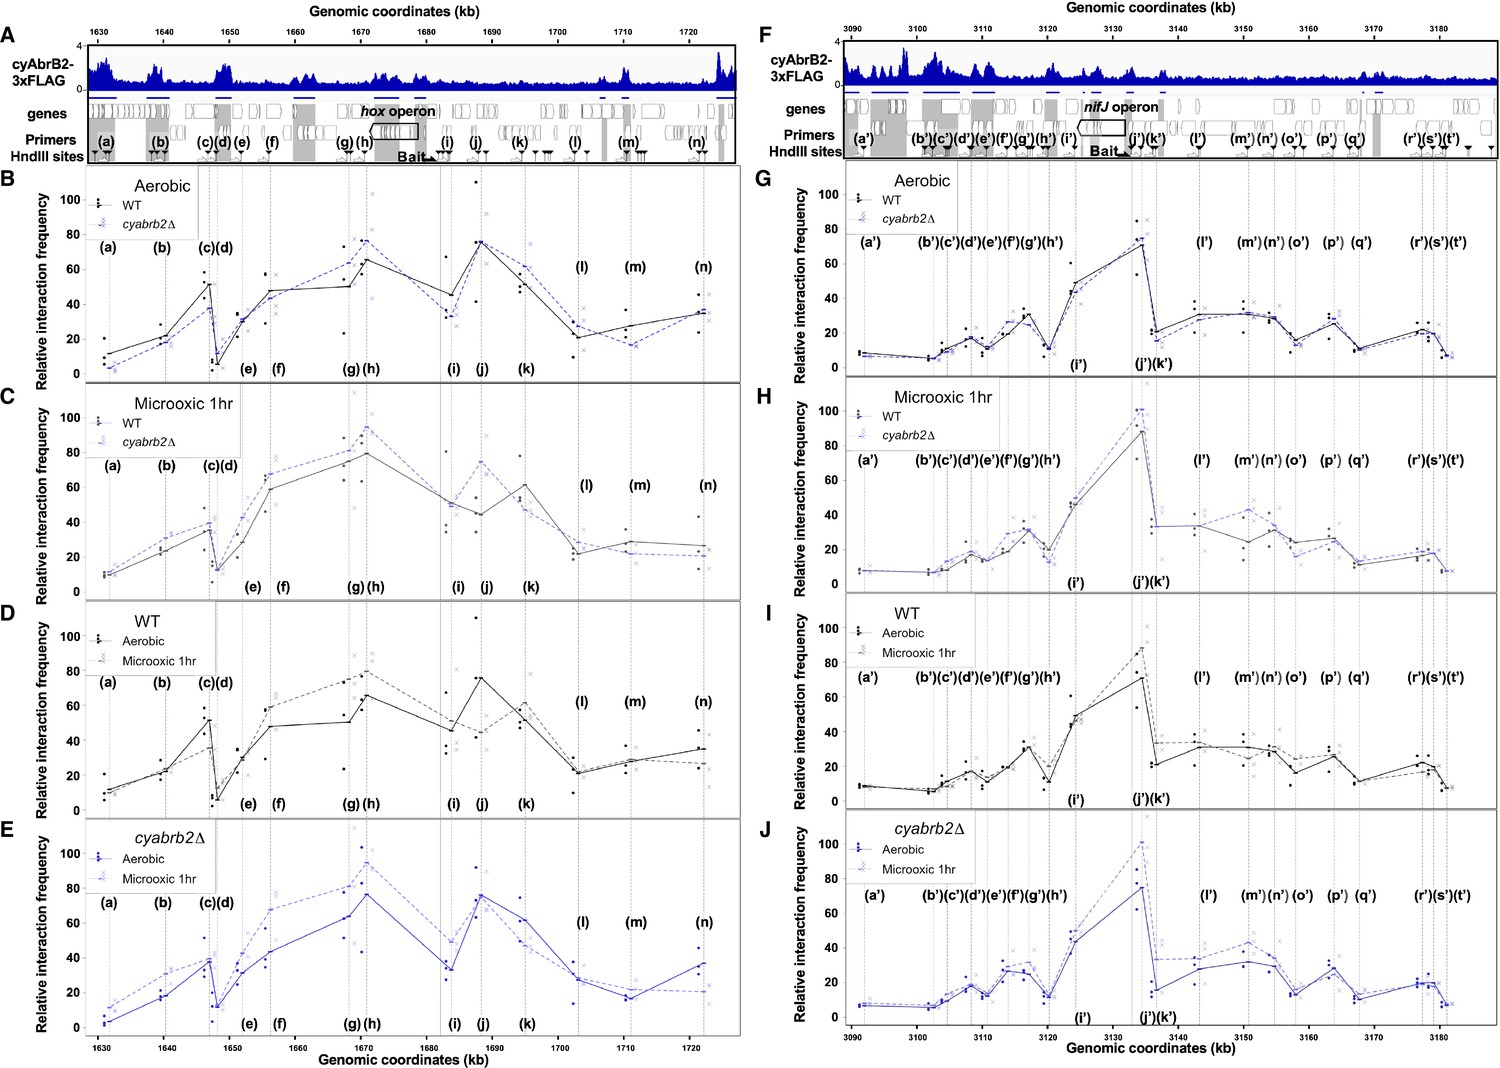
3C analysis showed changes of DNA conformation around hox and nifJ operon on entry to microoxic condition and the impact of cyabrb2 deletion on DNA conformation.
(A and F) Schematic diagram of 3C analysis around hox operon (A) and nifJ operon (F). In the panels (A) and (F), the black horizontal arrow shows the location of the bait primer, and white horizontal arrows ((a) to (n) in hox operon (A) and (a’) to (t’) in nifJ operon (F)) indicate loci where the interaction frequency with bait were assayed. Vertical black arrowheads indicate the position of HindIII sites. ChIP-seq data of cyAbrB2 in the aerobic condition is displayed in the bottom, and cyAbrB2 binding regions are marked with shade. (B–E) The line plot showing the interaction frequency of each locus with hox fragment. Two of data sets are presented; (B) wildtype vs ∆cyabrb2 in aerobic condition, (C) wildtype vs ∆cyabrb2 in 1 hr of microoxic condition, (E) wildtype in aerobic vs 1 hr of microoxic condition, and (E) ∆cyabrb2 in aerobic vs 1 hr of microoxic condition are compared. (G–J) The line plot showing the interaction frequency of each locus with nifJ fragment. Two data sets are selected and presented; (G) wildtype vs ∆cyabrb2 in aerobic condition, (H) wildtype vs ∆cyabrb2 in 1 hr of microoxic condition, (I) wildtype in aerobic vs 1 hr of microoxic condition, and (J) ∆cyabrb2 in aerobic vs 1 hr of microoxic conditions are compared. The line plots indicate the average interaction frequency over the random ligation (n=3). Individual data are plotted as dots.
First, focusing on the aerobic condition of wildtype (Figure 7B, solid line), the hox fragment interacted with its proximal downstream loci (loci (f) to (g)) and proximal upstream locus (locus (j)). The hox fragment also interacts with the distal downstream locus (locus (c)). Meanwhile, the nifJ fragment shows high interaction frequency with proximal upstream and downstream loci (Figure 7G, loci (i’) and (j’)), and a distal downstream locus (locus (g’)) showed higher interaction frequency with nifJ fragment than proximal locus (h’) did. The upstream regions of nifJ (loci (l’) to (n’) and (p’)) showed comparable frequency with locus (g’).
The chromatin conformation is changed in cyabrb2∆ in some loci
Then we compared the chromatin conformation of wildtype and cyabrb2∆. Although overall shapes of graphs did not differ, some differences were observed in wildtype and cyabrb2∆ (Figure 7B and G); interaction of locus (c) with hox region were slightly lower in cyabrb2∆ and interaction of loci (f’) and (g’) with nifJ region were different in wildtype and cyabrb2∆. Note that the interaction scores exhibit considerable variability and we could not detect statistical significance at those loci.
Changes of chromatin conformation upon microoxic condition
When the cells entered the microoxic condition, proximal loci interacted more frequently (Figure 7D, loci (f)–(h) and Figure 7I, loci (j’) and (k’)). This tendency was more apparent in cyabrb2∆ (Figure 7E and J). Furthermore, the interaction of nifJ upstream loci (l’)–(n’) increased in the microoxic condition in cyabrb2∆ but not wildtype (Figure 7I and J). The locus (c) and locus (j) interacted less frequently with hox fragment upon entry to the microoxic condition in the wildtype. While the interaction scores exhibit considerable variability, the individual data over time demonstrate declining trends of the wildtype at locus (c) and (j) (Figure 7—figure supplement 1). In ∆cyabrb2, by contrast, the interaction frequency of loci (c) and (j) was unchanged in the aerobic and microoxic conditions (Figure 7E). The interaction frequency of locus (c) in ∆cyabrb2 was as low as that in the microoxic condition of wildtype, while that of locus (j) in ∆cyabrb2 was as high as that in the aerobic condition of wildtype (Figure 7B and C). In summary, 3C analysis demonstrated cyAbrB2-dependent and independent dynamics of chromosomal conformation around the hox and nifJ operon in response to the microoxic condition (Figure 8).
Figure 8
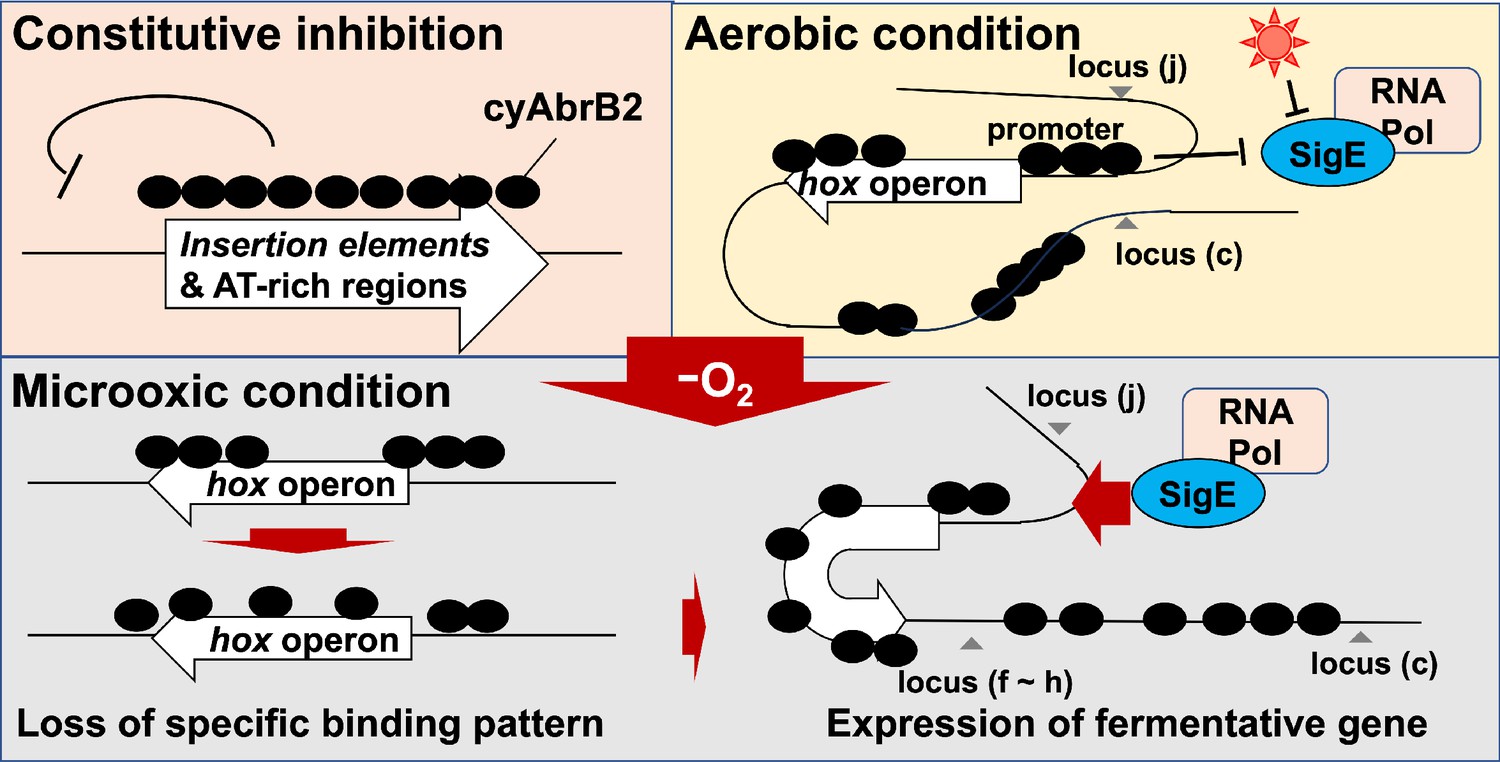
Schematic diagram of the dynamics of transcription factors governing fermentative gene expression.
Discussion
Physiological significance of transient upregulation of hox and nifJ operons
As the transcriptional change can alter the metabolic flow, the transcriptional upregulation of fermentative genes in response to the microoxic condition is expected to be adaptive for energy acquisition and the maintenance of redox balance. Our time-course transcriptome showed upregulation of several genes involved in catabolism upon exposure to the microoxic condition. The transient upregulation of hox and nifJ operons is distinctive among them (Figure 1D).
One reason for transient upregulation is probably the resource constraints of inorganic cofactors. Hydrogenase and PFOR (the product of nifJ gene) have iron-sulfur clusters, and hydrogenase requires nickel for its activity (Uyeda and Rabinowitz, 1971; Vignais and Billoud, 2007). Overexpression of the hox operon should be futile under physiological conditions without an adequate nickel supply (Ortega-Ramos et al., 2014).
Another significance for transient upregulation may be the reusability of fermentative products. Hydrogen, lactate, and dicarboxylic acids can be reused as the source of reducing power when cells return to aerobic conditions (Appel et al., 2000; Katayama et al., 2022; Angermayr et al., 2016). The substrate proton is abundant, but hydrogen is diffusive and difficult to store. Therefore, hydrogenase may favor fermentation initiation, and the reductive branch of TCA-producing dicarboxylic acids may become active subsequently. In fact, citH/mdh (sll0891) encoding a key enzyme of the reductive branch of TCA was classified as continuously upregulated genes in this study (Figure 1C and D).
Mechanisms for transient expression mediated by SigE and cyAbrB2
SigE and cyAbrB2 can independently contribute to the transient transcriptional upregulation. This is evident as the single mutants, ∆sigE or ∆cyabrb2, maintained transient expression of hoxF and nifJ (Figure 2—figure supplement 1). We first discuss cyAbrB2 as the potential NAPs, and then the mechanism of transient upregulation mediated by cyAbrB2 and SigE will be discussed.
cyAbrB2 is a novel nucleoid-associated protein of cyanobacteria
We have shown that cyAbrB2 broadly binds to AT-rich genomic regions, including IS elements (Figure 3). This is functionally similar to the histone-like nucleoid protein H-NS family, including H-NS in Enterobacteriaceae (Navarre et al., 2007; Oshima et al., 2006), and Lsr2 in Mycobacteria (Gordon et al., 2010). Like H-NS and Lsr2, cyAbrB2 may defend against exogenous DNA elements, which often have different GC content. Interestingly, Lsr2 controls genes responding to hypoxia, showing a functional analogy with cyAbrB2 (Kołodziej et al., 2021).
The biochemistry of cyAbrB2 will shed light on the regulation of chromatin conformation in the future
H-NS proteins often cause bound DNA to bend, stiffen, and/or bridge (Hołówka and Zakrzewska-Czerwińska, 2020). DNA-bound cyAbrB2 is expected to oligomerize, based on the long tract of cyAbrB2 binding region in our ChIP-seq data. However, no biochemical data mentioned the DNA deforming function or oligomerization of cyAbrB2 in the previous studies, and preference for AT-rich DNA is not fully demonstrated in vitro (Dutheil et al., 2012; Ishii and Hihara, 2008; Song et al., 2022). Moreover, our 3C data did not support bridging at least in hox region and nifJ region, as the high interaction locus and cyAbrB2 binding region did not seem to correlate (Figure 7). Therefore, direct observation of the DNA-cyAbrB2 complex by atomic force microscopy is the solution in the future.
Not only DNA structural change but also the effect of the post-translational modification can be investigated by biochemistry. The previous studies report that cyAbrB2 is subject to phosphorylation and glutathionylation (Spät et al., 2023; Sakr et al., 2013), and pH and redox state alters cyAbrB1’s affinity to DNA (Song et al., 2022). Those modifications might respond to environmental changes and be involved in transient expression. Overall, the biochemistry integrating assay conditions (PTM, buffer condition, and cooperation with cyAbrB1) and output (DNA binding, oligomerization, and DNA structure) will deepen the understanding of cyAbrB2 as cyanobacterial NAPs.
Cooperative and antagonistic function of cyAbrB1 and cyAbrB2
CyAbrB1, the homolog of cyAbrB2, may cooperatively work, as cyAbrB1 directly interacts with cyAbrB2 (Yamauchi et al., 2011), their distribution is similar, and they partially share their target genes for suppression (Figure 3A and Figure 3—figure supplement 4). The possibility of cooperation would be examined by the electrophoretic mobility shift assay of cyAbrB1 and cyAbrB2 as a complex. Despite their similar repressive function, cyAbrB1 and cyAbrB2 regulate hox expression in opposite directions, and their mechanism remains elusive. The stoichiometry of cyAbrB1 and cyAbrB2 bound to DNA fluctuates in response to the environmental changes (Lieman-Hurwitz et al., 2009), but there was no difference in the behavior of cyAbrB1 and cyAbrB2 around the hox region on entry to the microoxic condition.
Localization pattern and function of cyAbrB2
Herein, we classified three types of binding patterns for cyAbrB2. The first is that cyAbrB2 binds a long DNA tract covering the entire gene or operon, represented by the insertion sequence elements. CyAbrB2 suppresses expression in this pattern (Figure 3E). In the second pattern, cyAbrB2 binds on promoter regions, such as hox operon and nifJ. The binding on those promoters fluctuates in response to environmental changes, thus regulating expression. This pattern also applies to the promoter of sbtA (Na+/HCO3− symporter), where cyAbrB2 is bound in a CO2 concentration-dependent manner (Lieman-Hurwitz et al., 2009). The last one is cyAbrB2 binding in the middle or downstream of operons. The middle of hox, pntAB, and nifJ operons and the downstream of nrt operon are the cases (Figure 4C). Our data show that genes in the same operon separated by the cyAbrB2 binding region behave differently. In particular, pntB is classified as the transiently upregulated gene, while pntA is not, despite being in the same operon. This might be explained by the recent study which reported that cyAbrB2 affects the stability of mRNA transcribed from its binding gene (Song et al., 2022). The cyAbrB2-mediated stability of mRNA may also account for the decrease in transcript from transient upregulated genes at 4 hr of cultivation. Hereafter, we will focus on the mechanism of the second pattern, regulation by cyAbrB2 on the promoter.
Insight into the regulation of hox and nifJ operon by cyAbrB2
Genome-wide analysis indicates that the cyAbrB2-bound region blocks SigE and SigA (Figure 6A and B). This is presumably because sigma factors recognize the promoter as a large complex of RNA polymerase. CyAbrB2 binds to the hox and nifJ promoter region and may inhibit access to RNA polymerase complex under aerobic conditions. When cells entered microoxic conditions, the boundaries of the cyAbrB2 binding region and cyAbrB2-free region became obscure (Figure 5), and SigE binding peaks on those promoters became prominent (Figure 6C). Notably, cyAbrB2 ChIP efficiency at the hox promoter is higher in the microoxic condition than in the aerobic condition (Figure 5). Hence, while the exclusion by cyAbrB2 occupancy on promoter inhibits containing RNA polymerase in the aerobic condition, it is also plausible that chromosomal conformation change governed by cyAbrB2 provides SigE-containing RNA polymerase with access to the promoter region (Figure 8). Our 3C result demonstrated that cyAbrB2 influences the chromosomal conformation of hox and nifJ region to some extent (Figure 7).
A recent study demonstrated that manipulating the expression of topoisomerase, which influences chromosomal conformational change through supercoiling, affects transcriptional properties in cyanobacteria (Behle et al., 2022). Moreover, Song et al., 2022 pointed out that DNA looping may inhibit transcription in cyanobacteria because artificial DNA looping by the LacI repressor of Escherichia coli can repress cyanobacterial transcription (Camsund et al., 2014). Thus, we infer conformation change detected by the present 3C experiment regulates expression of hox operon.
Generality for chromosomal conformation in cyanobacteria
Our 3C analysis revealed that local chromosomal conformation changes upon entry to the microoxic conditions (Figure 8). As cyAbrB2 occupies about 15% of the entire genome and globally regulates gene expression, cyAbrB2 likely governs the whole chromosomal conformation. Furthermore, the conformational changes by deletion of cyAbrB2 were limited, suggesting there are potential NAPs in cyanobacteria yet to be characterized. It is speculated that conformational change of the entire chromosome occurs to deal with many environmental stresses.
The sigE-mediated mechanism for the transient expression
One possible SigE-mediated mechanism for transient expression is the post-transcriptional activation and degradation of SigE in the dark, i.e., SigE is sequestered by anti-sigma factor under light conditions and released under dark (Osanai et al., 2009), enabling acute transcription of hox operon and nifJ. Transcripts of sigE were continuously downregulated in our time-course transcriptome, while sigB (sll0306) and sigC (sll0184) were classified as continuous upregulated genes (Table 2). It is possible that upregulated SigB and SigC outcompete SigE in prolonged incubation under microoxic conditions. Finally, SigE is degraded under dark within 24 hr (Iijima et al., 2015).
Table 2
Fold changes of transcripts from sigA, sigB, sigC, sigD, and sigE.
| 0 hr vs 1 hr | 1 hr vs 4 hr | ||||
|---|---|---|---|---|---|
| Sigma factor | Locus | Log2FC | FDR | Log2FC | FDR |
| SigA | slr0653 | –0.873248 | 0.00766486 | –0.0013514 | 0.99797563 |
| SigB | sll0306 | 1.38098826 | 8.42E-06 | 0.77453605 | 0.04057775 |
| SigC | sll0184 | 2.97101055 | 1.75E-16 | 1.30743549 | 0.00067892 |
| SigD | sll2012 | 0.4701823 | 0.1498473 | –0.4522181 | 0.32402556 |
| SigE | sll1689 | –1.9111759 | 1.96E-11 | –1.1223298 | 0.00633142 |
-
Data is extracted from Supplementary file 1d.
Another reason for the microoxic specific expression may exist in the sequence of the hox promoter. We previously determined the consensus sequence of –10 element for SigE regulon in the aerobic condition as ‘TANNNT’, where N is rich in cytosine (Kariyazono and Osanai, 2022). The –10 sequence of the hox promoter ‘TAACAA’ (Oliveira and Lindblad, 2005) deviates from the consensus, and no hexamer precisely fitting the consensus is found in the nifJ promoter. This deviation can inhibit SigE from binding during aerobic conditions, aside from cyAbrB2-mediated inhibition. Under the microoxic condition, transcription factors LexA (Oliveira and Lindblad, 2005) and Rre34 (Summerfield et al., 2011) may aid SigE binding to the promoter of hox and nifJ, respectively.
Moreover, SigE seems susceptible to the blocking from cyAbrB2 during the aerobic condition compared with SigA. This is supported by the odds ratio of SigE being in the cyAbrB2-free region was higher than that of SigA in the aerobic condition (Figure 6A and B). The higher exclusion pressure of cyAbrB2 on SigE may contribute to sharpening the transcriptional response of hox and nifJ on entry to microoxic conditions. Overall, multiple environmental signals are integrated into the hox and nifJ promoter through the cyAbrB2 and SigE dynamics.
Materials and methods
Key resources table
| Reagent type (species) or resource | Designation | Source or reference | Identifiers | Additional information |
|---|---|---|---|---|
| Strain, strain background (Synechocystis sp. PCC6803) | Wildtype | https://doi.org/10.1016/0076-6879(88)67088-1 | GT | |
| Strain, strain background (Synechocystis sp. PCC6803) | ∆sigE::KmR | https://doi.org/10.1074/jbc.M505043200 | G50 | |
| Strain, strain background (Synechocystis sp. PCC6803) | SigA-8His-KmR | https://doi.org/10.1111/tpj.15687 | KR93 | |
| Strain, strain background (Synechocystis sp. PCC6803) | SigA-3FLAG-KmR | https://doi.org/10.1111/tpj.15687 | KR94 | |
| Strain, strain background (Synechocystis sp. PCC6803) | ∆cyabrb2::KmR | In this study | KR340 | The genome of GT strain was manipulated by the transformation of the plasmid VK203 |
| Strain, strain background (Synechocystis sp. PCC6803) | cyAbrB(sll0359)–3xFLAG-KmR | In this study | KR338 | The genome of GT strain was manipulated by the transformation of the plasmid VK200 |
| Strain, strain background (Synechocystis sp. PCC6803) | cyAbrB2(sll0822)–3xFLAG-KmR | In this study | KR339 | The genome of GT strain was manipulated by the transformation of the plasmid VK201 |
| Strain, strain background (Synechocystis sp. PCC6803) | ∆cyabrB2::KmR ∆sigE::CmR | In this study | KR359 | The genome of G50 strain was manipulated by the transformation of the plasmid VK82 |
| Recombinant DNA reagent | sigE∆CmR | In this study | VK82 | Plasmid backbone:pTA2 (Toyobo), available upon request |
| Recombinant DNA reagent | AbrB1-3F-KmR | In this study | VK200 | Plasmid backbone:pTA2 (Toyobo), available upon request |
| Recombinant DNA reagent | AbrB2-3F-KmR | In this study | VK201 | Plasmid backbone:pTA2 (Toyobo), available upon request |
| Recombinant DNA reagent | cyabrB2∆KmR | In this study | VK203 | Plasmid backbone:pTA2 (Toyobo), available upon request |
| Antibody | Anti-FLAG | Sigma-aldrich | F1804 | RRID:AB_262044 For immunoprecipitation |
| Antibody | Anti-FLAG (alkaline phosphatase conjugated) | Sigma-aldrich | A9469 | RRID:AB_439699 For western blot (1:20,000) |
Bacterial strains and plasmids
Request a detailed protocolThe glucose-tolerant strain of Synechocystis sp. PCC 6803 (Williams, 1988) was used as a wildtype strain in this study. The sigE (sll1689)-disrupted strain (G50), SigE FLAG-tagged strain, and SigA FLAG-tagged strain were constructed in a previous study (Osanai et al., 2005; Kariyazono and Osanai, 2022). Disruption and epitope tagging of cyabrb1(sll0359) and cyabrb2(sll0822) were performed by homologous double recombination between the genome and PCR fragment (Williams, 1988). The resulting transformants were selected using three passages on BG-11 plates containing 5 µg/mL kanamycin. Genomic PCR was used to confirm the insertion of epitope tag fragments and gene disruption (Figure 3—figure supplement 3). Key resources table and Supplementary file 1 contain the cyanobacterial strains, oligonucleotides, and plasmids used in this study.
Aerobic and microoxic culture conditions
Request a detailed protocolFor aerobic conditions, cells were harvested after 24 hr cultivation in HEPES-buffered BG-110 medium (Stanier et al., 1979), which was buffered with 20 mM HEPES-KOH (pH 7.8) containing 5 mM NH4Cl under continuous exposure to white light (40 µmol/m2/s) and bubbled with air containing 1% CO2 (final OD730=1.4–1.8). For the dark microoxic culture, the aerobic culture cell was concentrated to an OD730 of 20 with the centrifuge and resuspended in the culture medium. The concentrated cultures were poured into vials, bubbled with N2 gas, and sealed. The sealed vials were shaded and shaken at 30°C for the described times.
Antibodies and immunoblotting
Request a detailed protocolSample preparation for immunoblotting was performed as previously described (Kariyazono and Osanai, 2022), and FLAG-tagged proteins were detected by alkaline-phosphatase-conjugated anti-FLAG IgG (A9469, Sigma-Aldrich, St. Louis, MO, USA) and 1-Step NBT/BCIP substrate solution (Thermo Fisher Scientific, Waltham, MA, USA).
RNA isolation
Request a detailed protocolTotal RNA was isolated with ISOGEN (Nippon Gene, Tokyo, Japan) following the manufacturer’s instructions and stored at −80°C until use. The extracted RNA was treated with TURBO DNase (Thermo Fisher Scientific) for 1 hr at 37°C to remove any genomic DNA contamination. We confirmed that the A260/A280 of the extracted RNA was >1.9 by NanoDrop Lite (Thermo Fisher Scientific). We prepared triplicates for each timepoint for the RNA-seq library. RT-qPCR was performed as described elsewhere (Iijima et al., 2015).
ChIP assay
Request a detailed protocolTwo biological replicates were used for each ChIP-seq experiment, and one untagged control ChIP was performed. ChIP and qPCR analyses were performed using the modified version of a previous method (Kariyazono and Osanai, 2022). FLAG-tagged proteins were immunoprecipitated with FLAG-M2 antibody (F1804 Sigma-Aldrich) conjugated to protein G dynabeads (Thermo Fisher Scientific).
Library preparation and next-generation sequencing
Request a detailed protocolFor the ChIP-seq library, input and immunoprecipitated DNA were prepared into multiplexed libraries using NEBNext Ultra II DNA Library Prep Kit for Illumina (New England Biolabs, Ipswich, MA, USA). For the RNA-seq library, isolated RNA samples were deprived of ribosomal RNA with Illumina Ribo-Zero Plus rRNA Depletion Kit (Illumina, San Diego, CA, USA) and processed into a cDNA library for Illumina with the NEBNext Ultra II Directional RNA Library Prep Kit for Illumina (New England Biolabs). Dual-index primers were conjugated with NEBNext Multiplex Oligos for Illumina (Set1, New England Biolabs). We pooled all libraries, and the multiplexed libraries were dispatched to Macrogen Japan Inc and subjected to paired-end sequencing with HiSeqX. Adapter trimming and quality filtering of raw sequence reads were conducted with fastp (ver. 0.21.0) (Chen et al., 2018) under default conditions. The paired-end sequences were mapped onto the Synechocystis genome (ASM972v1) using Bowtie2 (Langmead and Salzberg, 2012) (ver. 2.4.5 paired-end). Supplementary file 1 contains the read counts that passed via fastp quality control and were mapped by Bowtie2.
RNA-seq analysis
Request a detailed protocolMapped reads were counted by HT-seq count (ver. 2.0.2) (Anders et al., 2015) for the GFF file of ASM972v1, with the reverse-strandedness option. EdgeR package (ver. 3.40.1) (Robinson et al., 2010) was used to perform the differential expression analysis. Fold changes in expression and FDR were used for gene classification. Supplementary file 1 contains fold change in gene expression calculated by edgeR.
Genome-wide analyses
Request a detailed protocolPeaks were called using the MACS3 program (ver. 3.0.0b1) (Zhang et al., 2008). For paired-end reads for SigE, SigA, and untagged control ChIP, narrow peaks were called with <1e−20 of the q-value cut-off and ‘--call-summits’ options. The peak summits from two replicates and the untagged control were merged if summits were located within 40 bp of each other. Peak summits identified in both replicates but not in the control were considered for further analysis. The midpoint of the peak summits for the two merged replicates was further analyzed.
Broad peak calling methods were applied to paired-end reads for cyAbrB2, cyAbrB1, and untagged control ChIP using the ‘–broad’ option, with a q-value cut-off of <0.05 and a q-value broad cut-off of <0.05. The intersection of broad peaks from two replicates, excluding those called by the control, was used in subsequent analyses.
The positions of the TSS, including internal start sites, were obtained as reported by Kopf et al., 2014. The read count, merging, and intersection of the binding region were calculated using BEDTools (ver. 2.30.0) (Quinlan and Hall, 2010).Supplementary file 1 contain SigA and SigE peaks and the broad binding regions of cyAbrB2 and cyAbrB1, respectively.
Binding signals in every 100 bp bin for scatter plots were calculated as (IP read counts within 100 bp window)/(input read counts within 100 bp window) * (total input read counts/total IP read counts). GC contents were calculated within 500 bp in 100 bp sliding windows by seqkit (ver. 2.3.0) (Shen et al., 2016).
Genome extraction, digestion, and ligation for 3C assay
Request a detailed protocolA 3C assay was conducted based on the previous prokaryotic Hi-C experiment (Takemata et al., 2019; Takemata and Bell, 2021), with certain steps modified. To begin, Synechocystis were fixed with 2.5% formaldehyde for 15 min at room temperature. Fixation was terminated by adding a final concentration of 0.5 M of glycine, and cells were stored at –80°C until use. Fixed cells were disrupted using glass beads and shake master NEO (Bio Medical Science, Tokyo, Japan), following the previous study’s instructions for preparing cell lysate for ChIP. The lysates were incubated with buffer containing 1 mM Tris-HCl (pH 7.5), 0.1 mM EDTA, and 0.5% SDS for 10 min at room temperature, and 1% Triton X-100 quenched SDS. Genomes in the cell lysate were digested by 600 U/mL of HindIII (Takara Bio, Shiga, Japan) for 4 hr at 37°C, and RNA in the lysate was simultaneously removed by 50 µg/mL of RNaseA (Nippon Genetics, Tokyo, Japan). The digestion was terminated by adding 1% SDS and 22 mM EDTA. The fill-in reaction and biotin labeling steps were omitted from the procedure. The digested genomes were diluted by ligation buffer containing 1% Triton X-100 to the final concentration of approximately 1 µg/mL and incubated for 10 min at room temperature. Ligation was performed with 2 U/mL of T4 DNA ligase (Nippon Gene) overnight at 16°C. Crosslinking was reversed under 65°C for 4 hr in the presence of 2.5 mg/mL of proteinase K (Kanto Chemical, Tokyo, Japan), and DNA was purified with the phenol-chloroform method and ethanol precipitation method.
Preparation of calibration samples for 3C qPCR
Request a detailed protocolBased on a previous study, calibration samples for possible ligated pairs were prepared in parallel with 3C ligation (Abou El Hassan and Bremner, 2009). In brief, the purified genome of Synechocystis was digested by HindIII, and DNA was purified with the phenol-chloroform and ethanol precipitation. Purified DNA was dissolved into the ligation buffer at a concentration of about 600 ng/µL and ligated with 2 U/mL of T4 DNA ligase at 16°C overnight.
Quantification of crosslinking frequency for 3C assay
Request a detailed protocolBefore the real-time PCR assay, we confirmed that each primer set amplified single bands in a ligation-dependent manner by GoTaq Hot Start Green Master Mix (Promega, Madison, WI, USA) (Figure 7—figure supplement 2). Real-time PCR was performed with StepOnePlus (Applied Biosystems, Foster City, CA, USA) and Fast SYBR Green Master Mix (Thermo Fisher Scientific) according to the manufacturer’s instructions. Interaction frequency was calculated by ∆∆Ct method using dilution series of calibration samples described above. We confirmed each primer set amplified DNA fragment with a unique Tm value. The amount of the bait fragment containing hox operon were quantified and used as an internal control. Supplementary file 1a contains the list of primers used in the 3C quantification. Interaction frequency for each primer position was calculated as the relative abundance of ligated fragments against the calibration samples and normalized among samples by internal control.
Statistical analysis
Request a detailed protocolStatistical analyses were performed with R version 4.2.2 (R Development Core Team, 2021). The ‘fisher.test’ function was used for Fisher’s exact test, and p-values< 0.05 were denoted as asterisks in the figure. Multiple comparisons of Fisher’s exact test were conducted using ‘fisher.Multcomp’ function in the RVAideMemoire package (Hervé, 2022), where p-values were adjusted by the ‘fdr’ method and FDRs<0.05 are shown in the figures. Multiple comparisons of the Wilcoxon-rank test were conducted by ‘pairwise.wilcox.test’, and p-values were adjusted by the ‘fdr’ method. Adjusted p-values<0.05 are shown in the figure. The correlation coefficient was calculated with the ‘cor’ function. GSEA was performed by culsterPlofiler package Wu et al., 2021 in R with p-value cut-off of 0.05. The enriched pathways detected by GSEA are listed in Supplementary file 1.
Data availability
ChIP sequencing and RNA sequencing reads were deposited in the Sequence Read Archive (accession ID: PRJNA956842).
-
NCBI BioProjectID PRJNA956842. Time course transcriptome of Synechocystis sp. PCC6803 under the microoxic conditions.
References
-
A rapid simple approach to quantify chromosome conformation captureNucleic Acids Research 37:e35.https://doi.org/10.1093/nar/gkp028
-
Regulation of organic acid and hydrogen production by NADH/NAD+ ratio in Synechocystis sp. PCC 6803Frontiers in Microbiology 14:1332449.https://doi.org/10.3389/fmicb.2023.1332449
-
Chirality matters: synthesis and consumption of the d-Enantiomer of Lactic Acid by Synechocystis sp. Strain PCC6803Applied and Environmental Microbiology 82:1295–1304.https://doi.org/10.1128/AEM.03379-15
-
The structure and reactivity of the HoxEFU complex from the cyanobacterium Synechocystis sp. PCC 6803The Journal of Biological Chemistry 295:9445–9454.https://doi.org/10.1074/jbc.RA120.013136
-
Design and analysis of LacI-repressed promoters and DNA-looping in a cyanobacteriumJournal of Biological Engineering 8:4.https://doi.org/10.1186/1754-1611-8-4
-
The role of the bidirectional hydrogenase in cyanobacteriaBioresource Technology 102:8368–8377.https://doi.org/10.1016/j.biortech.2011.03.103
-
Advances in the function and regulation of hydrogenase in the cyanobacterium synechocystis PCC6803International Journal of Molecular Sciences 15:19938–19951.https://doi.org/10.3390/ijms151119938
-
fastp: an ultra-fast all-in-one FASTQ preprocessorBioinformatics 34:i884–i890.https://doi.org/10.1093/bioinformatics/bty560
-
CRISPRi knockdown of the cyabrB1 gene induces the divergently transcribed icfG and sll1783 operons related to carbon metabolism in the cyanobacterium Synechocystis sp. PCC 6803The Journal of General and Applied Microbiology 70:01.001.https://doi.org/10.2323/jgam.2024.01.001
-
Nucleoid associated proteins: the small organizers that help to cope with stressFrontiers in Microbiology 11:590.https://doi.org/10.3389/fmicb.2020.00590
-
Sigma factors for cyanobacterial transcriptionGene Regulation and Systems Biology 3:65–87.https://doi.org/10.4137/grsb.s2090
-
Fast gapped-read alignment with Bowtie 2Nature Methods 9:357–359.https://doi.org/10.1038/nmeth.1923
-
Genome-wide transcriptome analysis of hydrogen production in the cyanobacterium Synechocystis: Towards the identification of new playersInternational Journal of Hydrogen Energy 38:1866–1872.https://doi.org/10.1016/j.ijhydene.2012.11.118
-
Positive regulation of sugar catabolic pathways in the cyanobacterium Synechocystis sp. PCC 6803 by the group 2 sigma factor sigEThe Journal of Biological Chemistry 280:30653–30659.https://doi.org/10.1074/jbc.M505043200
-
Genetic engineering of group 2 sigma factor SigE widely activates expressions of sugar catabolic genes in Synechocystis species PCC 6803The Journal of Biological Chemistry 286:30962–30971.https://doi.org/10.1074/jbc.M111.231183
-
SoftwareR: A language and environment for statistical computingR Foundation for Statistical Computing, Vienna, Austria.
-
The activity of the Synechocystis PCC6803 AbrB2 regulator of hydrogen production can be post-translationally controlled through glutathionylationInternational Journal of Hydrogen Energy 38:13547–13555.https://doi.org/10.1016/j.ijhydene.2013.07.124
-
Deep proteogenomics of a photosynthetic cyanobacteriumJournal of Proteome Research 22:1969–1983.https://doi.org/10.1021/acs.jproteome.3c00065
-
Fermentation in cyanobacteriaFEMS Microbiology Reviews 21:179–211.https://doi.org/10.1016/S0168-6445(97)00056-9
-
Pyruvate-ferredoxin oxidoreductase. 3. purification and properties of the enzymeThe Journal of Biological Chemistry 246:3111–3119.
-
Occurrence, classification, and biological function of hydrogenases: an overviewChemical Reviews 107:4206–4272.https://doi.org/10.1021/cr050196r
-
BookConstruction of specific mutations in photosystem II photosynthetic reaction center by genetic engineering methods in synechocystis 6803In: Williams JGK, editors. Methods in Enzymology. Academic Press. pp. 766–778.https://doi.org/10.1016/0076-6879(88)67088-1
-
Model-based analysis of ChIP-Seq (MACS)Genome Biology 9:R137.https://doi.org/10.1186/gb-2008-9-9-r137
Article and author information
Author details
Funding
Japan Society for the Promotion of Science (20H02905)
- Takashi Osanai
Japan Science and Technology Agency
https://doi.org/10.52926/jpmjal1306- Takashi Osanai
Japan Science and Technology Agency GteX (JPMJGX23B0)
- Takashi Osanai
Asahi Glass Foundation
- Takashi Osanai
The funders had no role in study design, data collection and interpretation, or the decision to submit the work for publication.
Acknowledgements
This study was supported by the following grants to TO: Grant-in-Aid for Scientific Research (B) (grant no. 20H02905), JST-ALCA of the Japan Science and Technology Agency (grant number JPMJAL1306), the Asahi Glass Foundation, and JST-GteX (grant number JPMJGX23B0). We thank Dr. Kohki Yoshimoto for providing laboratory instruments and Ms. Kaori Iwazumi for the support of bacterial culture and the medium preparation.
Version history
- Preprint posted:
- Sent for peer review:
- Reviewed Preprint version 1:
- Reviewed Preprint version 2:
- Version of Record published:
Cite all versions
You can cite all versions using the DOI https://doi.org/10.7554/eLife.94245. This DOI represents all versions, and will always resolve to the latest one.
Copyright
© 2024, Kariyazono and Osanai
This article is distributed under the terms of the Creative Commons Attribution License, which permits unrestricted use and redistribution provided that the original author and source are credited.
Metrics
-
- 1,124
- views
-
- 106
- downloads
-
- 5
- citations
Views, downloads and citations are aggregated across all versions of this paper published by eLife.
Citations by DOI
-
- 1
- citation for umbrella DOI https://doi.org/10.7554/eLife.94245
-
- 4
- citations for Version of Record https://doi.org/10.7554/eLife.94245.3
Download links
A two-part list of links to download the article, or parts of the article, in various formats.
Downloads (link to download the article as PDF)
Open citations (links to open the citations from this article in various online reference manager services)
Cite this article (links to download the citations from this article in formats compatible with various reference manager tools)
CyAbrB2 is a nucleoid-associated protein in Synechocystis controlling hydrogenase expression during fermentation
eLife 13:RP94245.
https://doi.org/10.7554/eLife.94245.3


