S-acylation of NLRP3 provides a nigericin sensitive gating mechanism that controls access to the Golgi
- School of Bioscience, University of Sheffield, United Kingdom
Figures
Figure 1 with 8 supplements

Association of NLRP3 with intracellular membranes is dependent on S-acylation.
(A) Schematic of the sequences used for GFP tagged minimal NLRP3 constructs expressed transiently in HeLaM cells. (B) Representative confocal microscopy images of each construct expressed. Scale bar = 10 µm. (C) Quantification of the amount of each mini-construct localised to the Golgi relative to cytosolic signal. N=3. (D) Overview of domain architecture of NLRP3. Boxed region indicates region and residues shown below with sequence conservation across 20 species represented by a web-logo plot. (E) ChimeraX graphic based on the inactive Cryo-EM structure of NLRP3 (PDB ID: 7PZC) showing a side view of the NLRP3 decamer. Monomers within each pentamer are colour coded blue or green. One monomer from each pentamer is hidden to give a clearer view of helix115-125 (coloured cyan with Cys-130 in pink) and the polybasic region (coloured yellow) from each monomer. (Ei) Graphic from boxed region showing the position of residues 95–146 relative to the PYD and NACHT domains. (Eii) Zoom in looking along helix115-125. Residues Tryp117, Leu120, Leu121, and Leu124 (labelled) align along a single face of helix115-125. (F) Representative confocal microscopy images of HeLaM cells transiently expressing GFP-NLRP3 treated with either 0.5% DMSO or 100 µM 2 BP for 16 hr with or without a 1 hr treatment with 10 µM nigericin and (G) quantification of GFP-NLRP3 signal associated with the Golgi from the same experiment. N=4. Scale bars = 10 µm. (H) Representative images of HeLaM cells transiently expressing GFP-NLRP3 or GFP-NLRP3C130S treated with or without 10 µM nigericin for 1 hr. Scale bars = 10 µm. (I) Quantification of GFP-NLRP3 or GFP-NLRP3C130S on the Golgi before and after nigericin treatment. N=3.
Figure 1—figure supplement 1
Cysteine-130 and helix115-125 are surface exposed in the cryo-EM structure of the inactive NLRP3 complex.
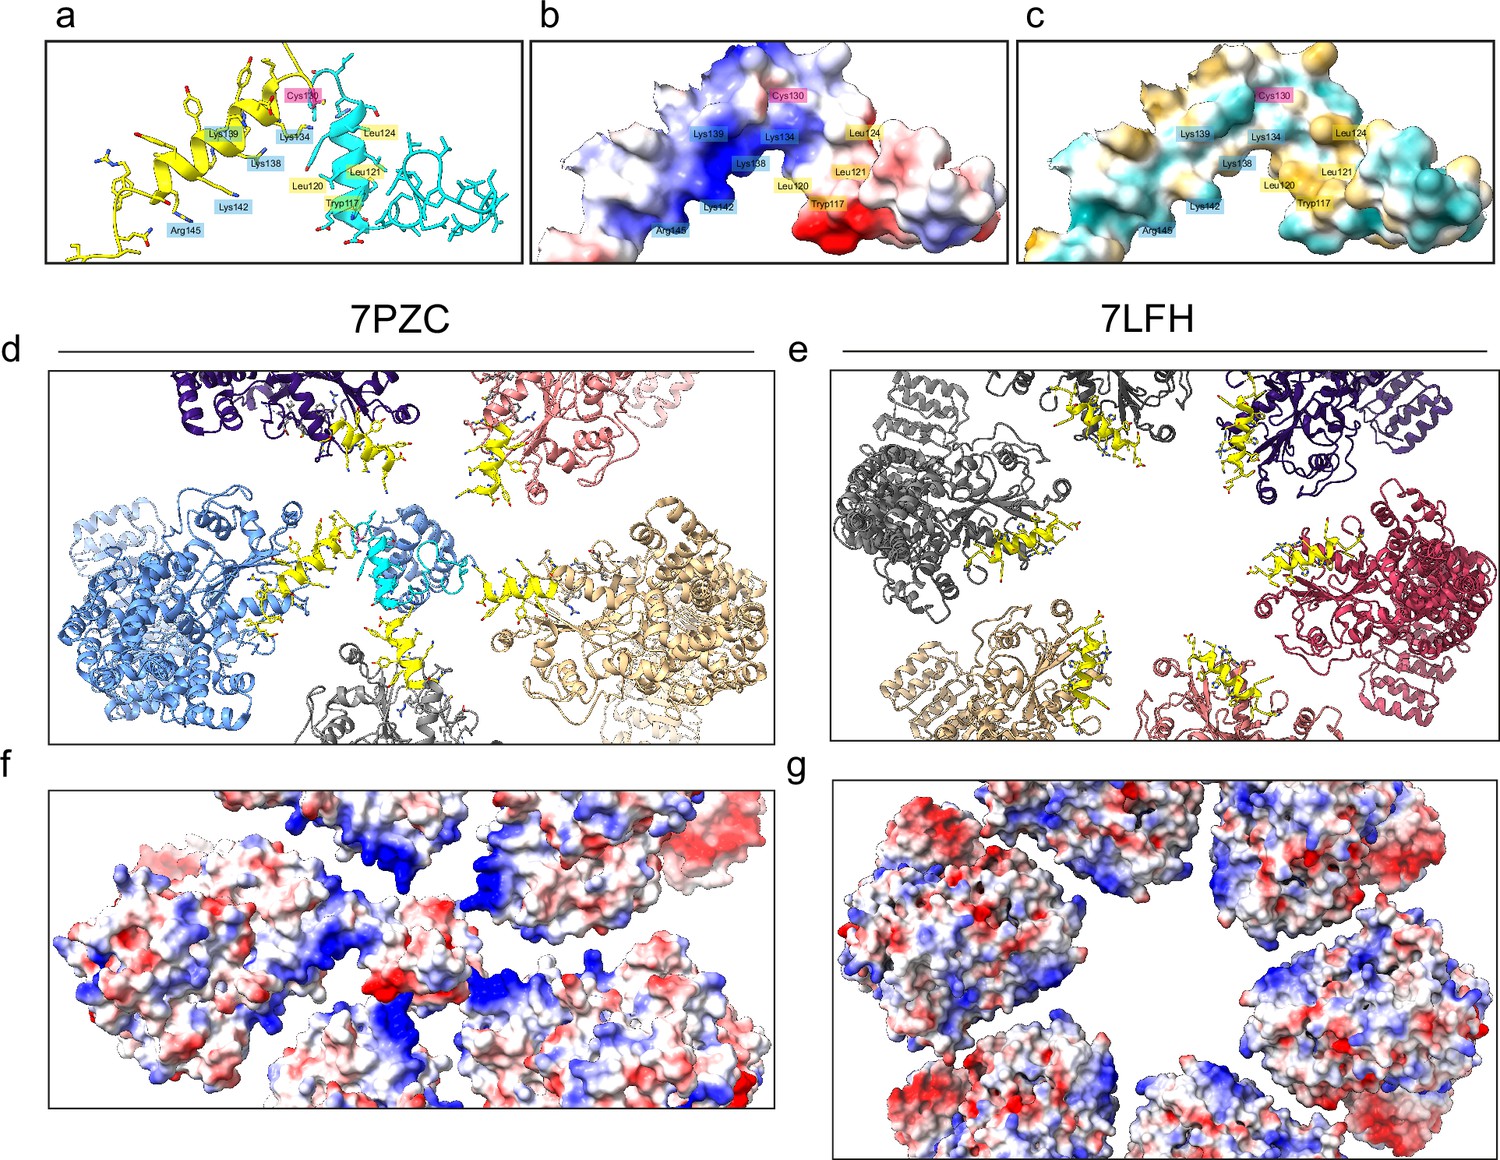
(A) Zoom in of residues 95–152 looking into the core of the decameric complex where the PYD domains are proposed to be shielded. The graphic shows the position of key charged (labelled in blue boxes) and hydrophobic (labelled in yellow boxes) residues in relation to Cys130 (labelled in pink box). (B) Electrostatic potential and (C) hydrophobicity of the same region with the position of each highlighted residue indicated. Lys-134, Lys-138, Lys139, Lys142, and Arg145 form a positively charged patch whilst Tryp117 Leu120, Leu121, and Leu124 form an adjacent hydrophobic patch that flanks Cys-130. (D) View of a pentamer of NLRP3 monomers from 7PZC (Hochheiser et al., 2022) and (E) an NLRP3 hexamer from 7LFH (Andreeva et al., 2021). For 7PZC, the polybasic regions from each monomer are arranged around helix115-125 and Cys-130, with a similar arrangement seen in 7FLH, although helix115-125 and Cys-130 were not resolved. Electrostatic potential of the polybasic regions from each monomer surrounding helix115-125 and Cys-130 mapped onto the structure of the NLRP3 pentamer for (F) 7PZC and the NLRP3 hexamer for (G) 7LFH.
Figure 1—figure supplement 2
Treatment of cells with 2 BP does not impact Golgi PI4P levels or overall Golgi integrity.
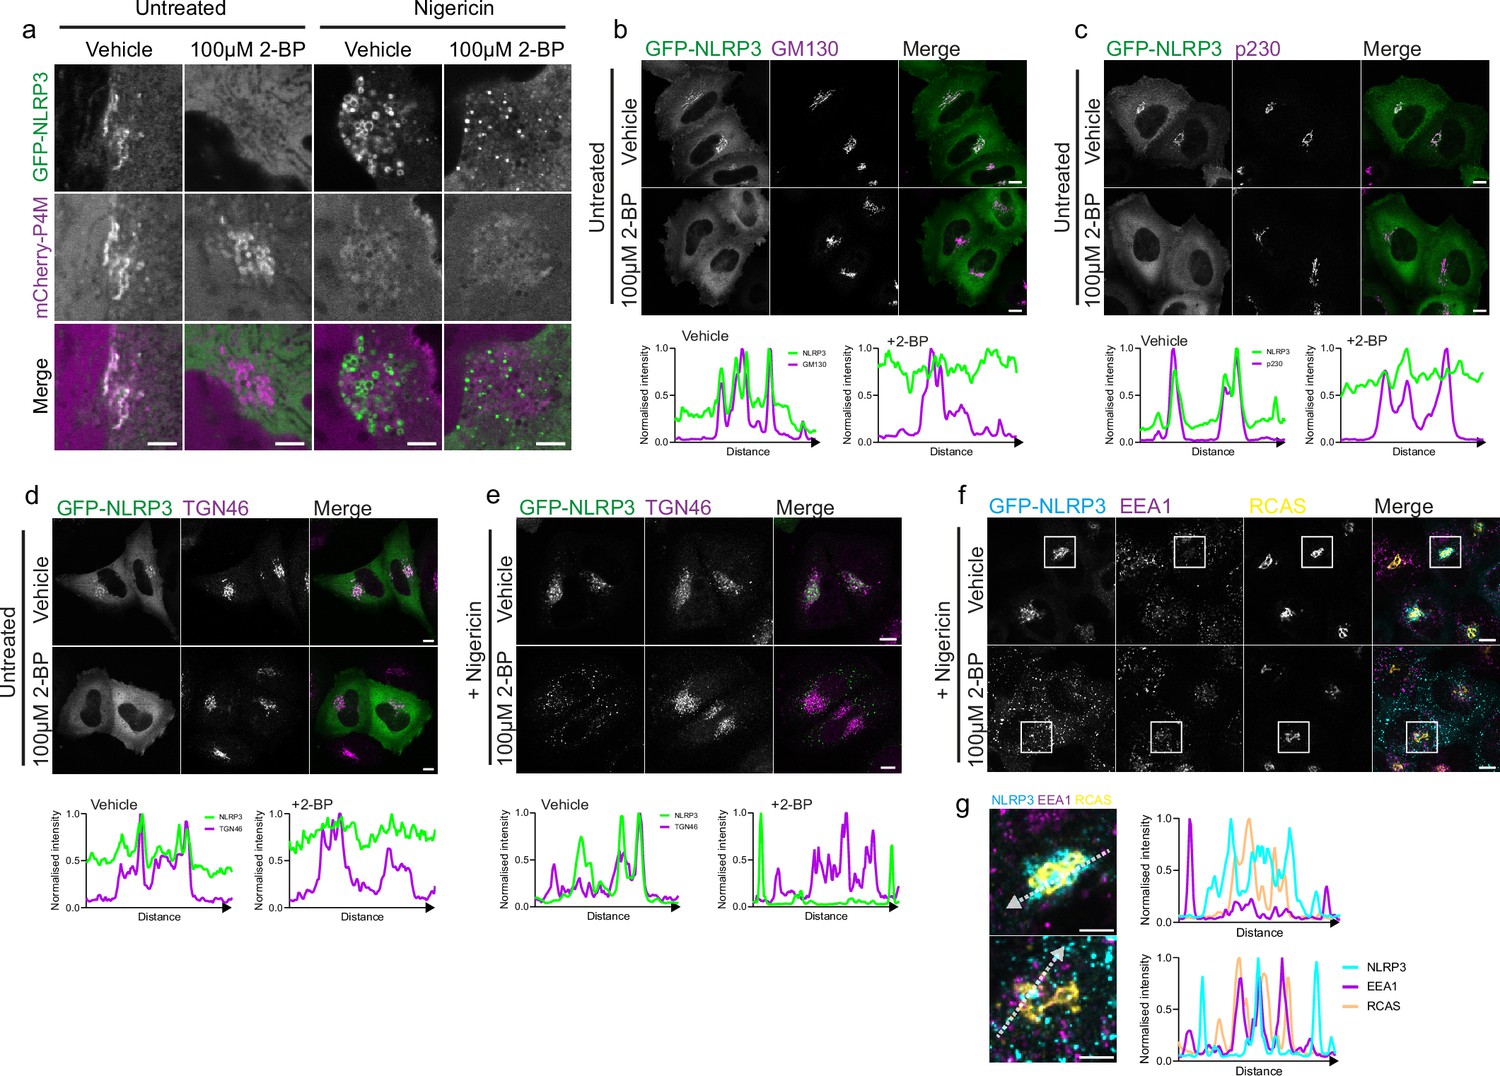
(A) Representative confocal micrographs of HeLaM cells transiently expressing GFP-NLRP3 and mCherry-P4M. Cells were treated for 16 hr with 100 µM 2 BP and imaged live following 1 hr treatment with 10 µM nigericin. HeLaM cells expressing GFP-NLRP3 treated with vehicle control or 100 µM 2 BP for 16 hr, fixed and stained with antibodies against (B) GM130 (C) p230 or (D) TGN46. (E) Cells were also treated for nigericin for 1 hr with 10 µM nigericin and stained with antibodies against TGN46. Linescan profiles for signal overlap between GFP-NLRP3 and the indicated marker are shown below each image set. Scale bars = 10 µm. (F) Representative images of HeLaM cells expressing GFP-NLRP3 treated with 100 µM 2 BP overnight followed by 10 µM nigericin for 1 hr. Cells were fixed and stained with antibodies against EEA1 and RCAS1. (G) Zoom in of boxed region in (F) with line scan analysis of signal overlap between GFP-NLRP3, EEA1, and RCAS1.
Figure 1—figure supplement 3

Dynamics of NLRP3 association with the Golgi post nigericin treatment in HeLaM cells.
(A) Representative images of GFP-NLRP3 transiently expressed in HeLaM cells treated with 10 µM nigericin for the indicated times. Scale bars = 10 µm. (B) Mean fluorescence intensity values (MFI) for GFP-NLRP3 in the cytosol and Golgi from cells treated with 10 µM nigericin for the indicated times. (C) Quantification of the Golgi to cytoplasmic GFP-NLRP3 fluorescence for the same experiment. N=2.
Figure 1—figure supplement 4
NLRP3 localisation is sensitive to BrefeldinA.
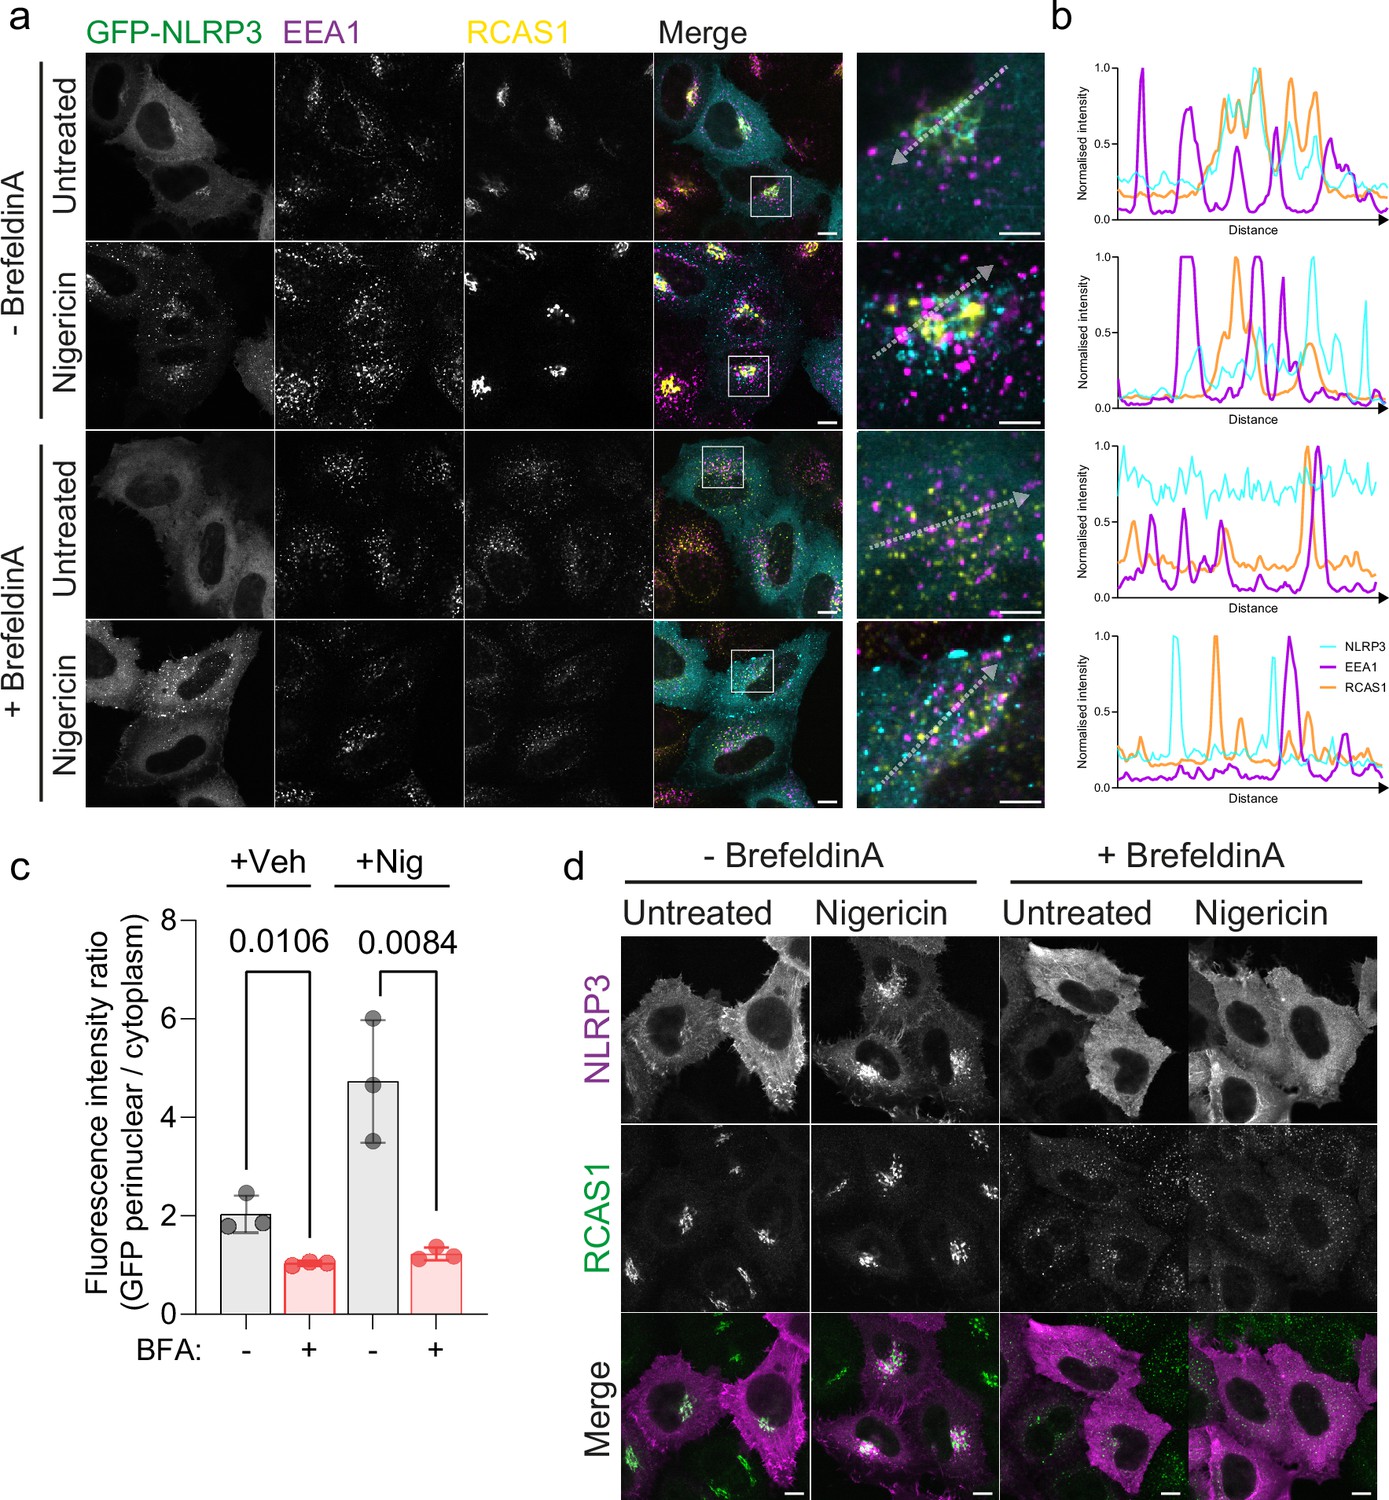
(A) Representative confocal micrographs of HeLaM cells transiently expressing GFP-NLRP3 treated with or without 5 µg / ml BrefeldinA (BFA) for 30 min prior to addition of 10 µM nigericin for a further 1 hr. Cells were fixed and stained with antibodies against EEA1 and RCAS1. Boxed region indicates region shown in higher magnification in the adjacent panel. Scale bar in zoom outs = 10 µm. Scale bar in zoom in = 5 µm. (B) Linescan analysis of signal overlap between GFP-NLRP3, EEA1, and RCAS as indicated by arrows shown in zoom ins. Puncta formed in BFA treated cells stimulated by nigericin show minimal overlap with early endosomes or the Golgi. (C) Quantification of GFP-NLRP3 signal in the perinuclear area relative to cytosolic signal in cells treated with or without BFA in the presence or absence of 10 µM nigericin. (D) Representative confocal micrographs of HeLaM cells transiently transfected with an untagged NLRP3 construct. Cells were treated as above for GFP-NLRP3 with BFA and nigericin, fixed and stained with antibodies against RCAS1. Scale bar = 10 µm.
Figure 1—figure supplement 5
Localisation of untagged NLRP3 to the Golgi is S-acylation dependent.
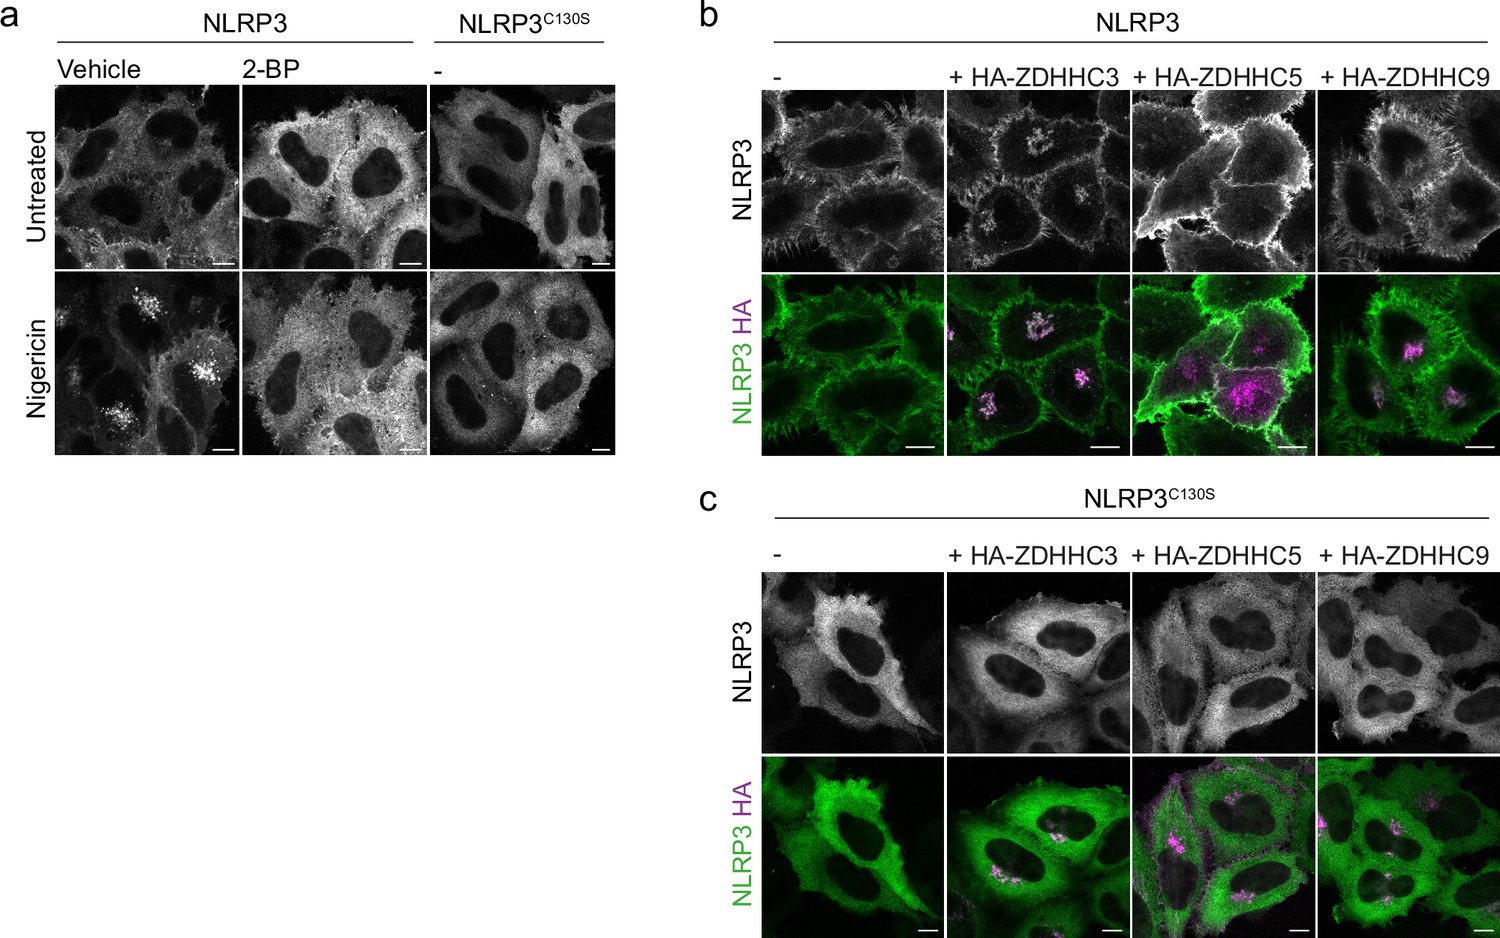
(A) Representative confocal microscopy images of HeLaM cells transiently expressing untagged NLRP3 or NLRP3C130S detected with anti-NLRP3 antibodies. Cells were treated with either 0.5% DMSO or 100 µM 2 BP for 16 hr before treatment with 10 µM nigericin or vehicle for 1 hr. Representative confocal microscopy images of HeLaM cells transiently transfected with (B) NLRP3 or (C) NLRP3C130S and 0.25 µg of the indicated ZDHHC enzyme. Untagged NLRP3 is sensitive to the same ZDHHC enzymes in a Cys-130-dependent manner as GFP tagged NLRP3. Scale bars = 10 µm.
Figure 1—figure supplement 6
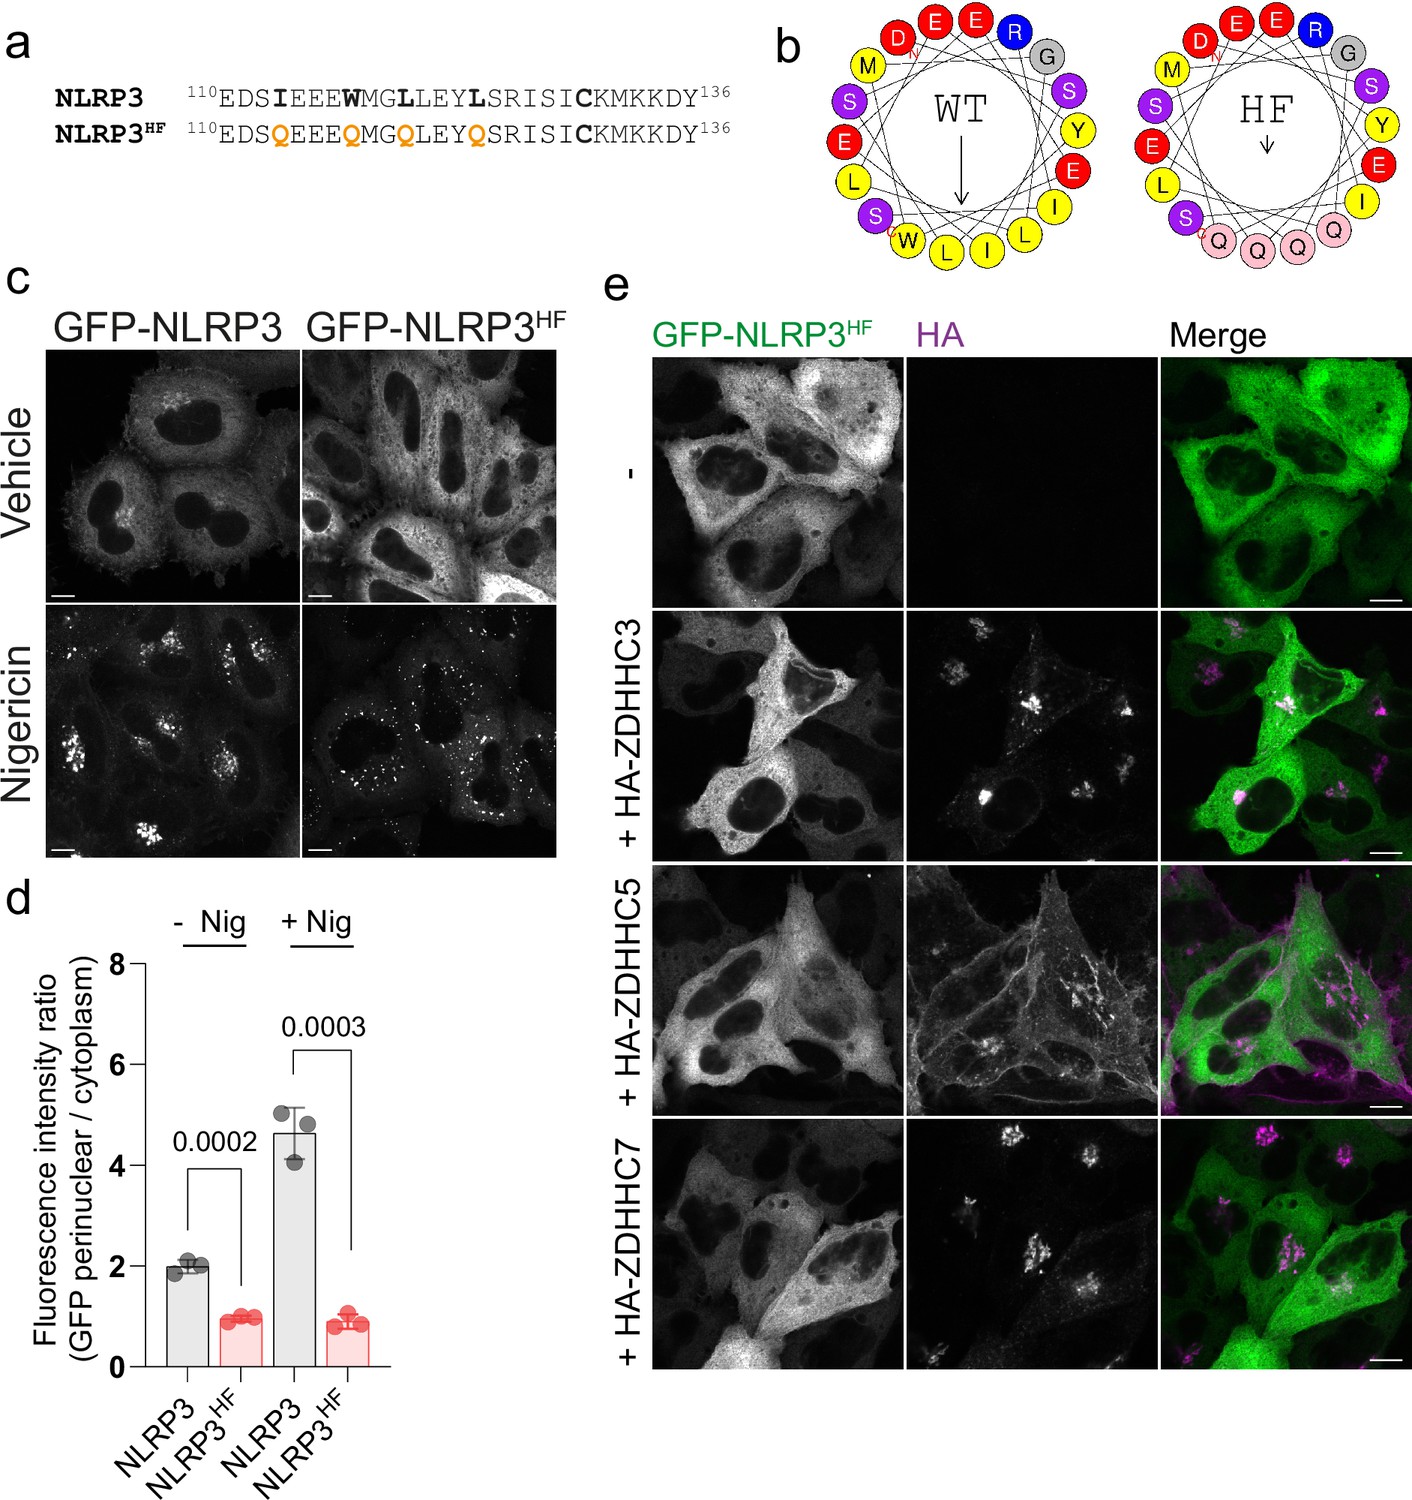
Hydrophobic residues within helix115-125 are important for localisation of NLRP3 to the Golgi apparatus.
(A) Sequence of NLRP3 between residues 110 and 136 and mutations made in the same sequence to disrupt the putative hydrophobic face of helix115-125. (B) Heliquest plot of wild type NLRP3 sequence for residues 111–128 and the effect of mutations to residues I113, W117, L120, and L124 (NLRP3HF) on the hydrophobic face. (C) Representative images of wild type GFP-NLRP3 and GFP-NLRP3HF transiently expressed in HeLaM cells and treated with 10 µM nigericin for 1 hr or left untreated. (D) Quantification of GFP-NLRP3HF levels on the Golgi relative to cytosolic signal in comparison to wild type GFP-NLRP3. (E) GFP-NLRP3HF is insensitive to ZDHHC overexpression. Representative images of HeLaM cells transfected with GFP-NLRP3HF and 0.25 µg of the indicated HA-ZDHHC enzyme. Scale bars in all images = 10 µm.
Figure 1—figure supplement 7
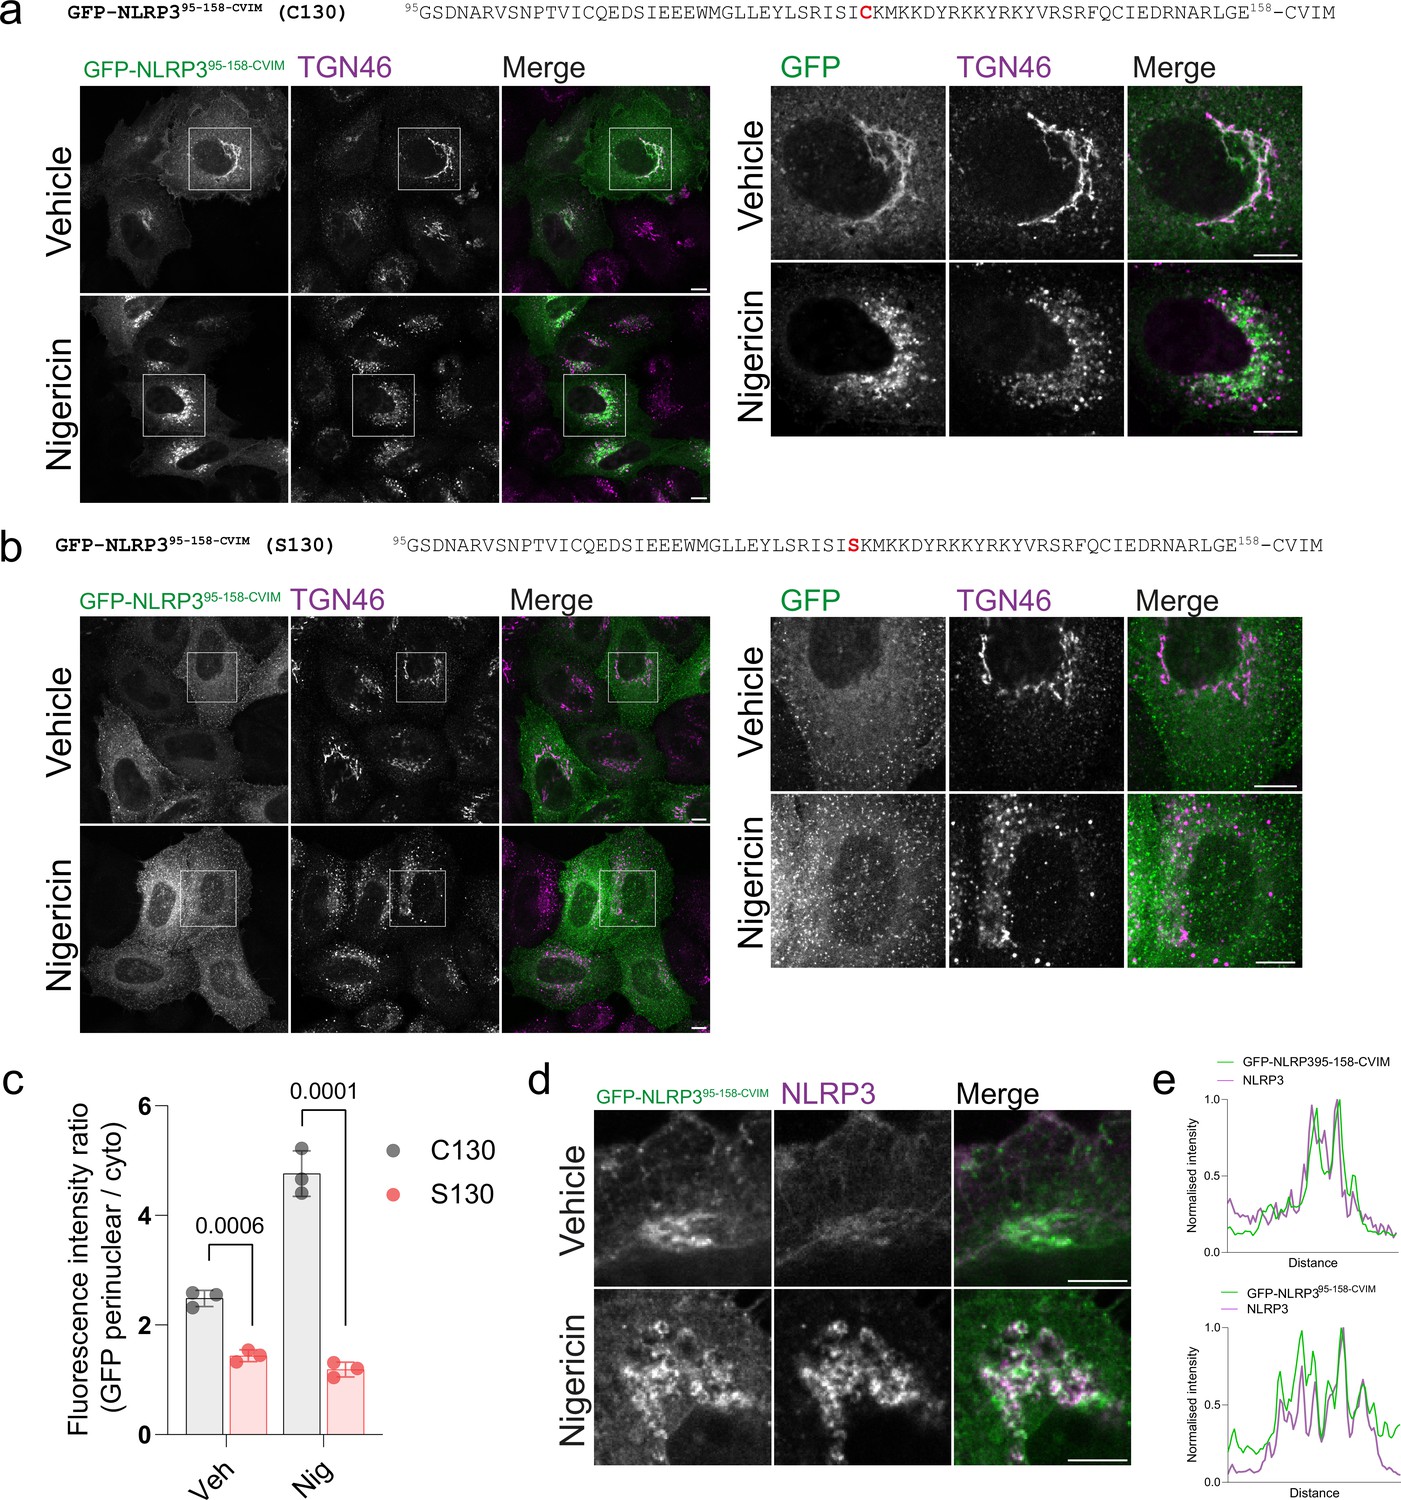
Farnesylation of NLRP3 residues 95–158 permits Cys-130-dependent Golgi association.
(A) Representative images of NLRP395-158-CVIM and (B) NLRP3C130S,95-158-CVIM transiently expressed in HeLaM cells treated with or without 10 µM nigericin for 1 hr. Boxed region in each image indicates the region shown in higher magnification next to each set of images. Scale bars = 10 µm. (C) Quantification of the Golgi association of each construct in untreated cells and in cells treated with 10 µM Nigericin for 1 hr. (D) Representative microscopy images showing GFP-NLRP395-158-CVIM co-localisation with untagged NLRP3 in untreated cells and following nigericin stimulation. Cells were stimulated with 10 µM nigericin or vehicle for 1 hr. The NLRP3 antibody used is raised against the LRR domain, which is absent from GFP-NLRP395-158-CVIM. (E) Linescan analysis of GFP-NLRP395-158-CVIM signal with NLRP3 in vehicle-treated and nigericin-treated cells. GFP-NLRP395-158-CVIM shows a high degree of overlap with NLRP3 under both conditions.
Figure 1—figure supplement 8
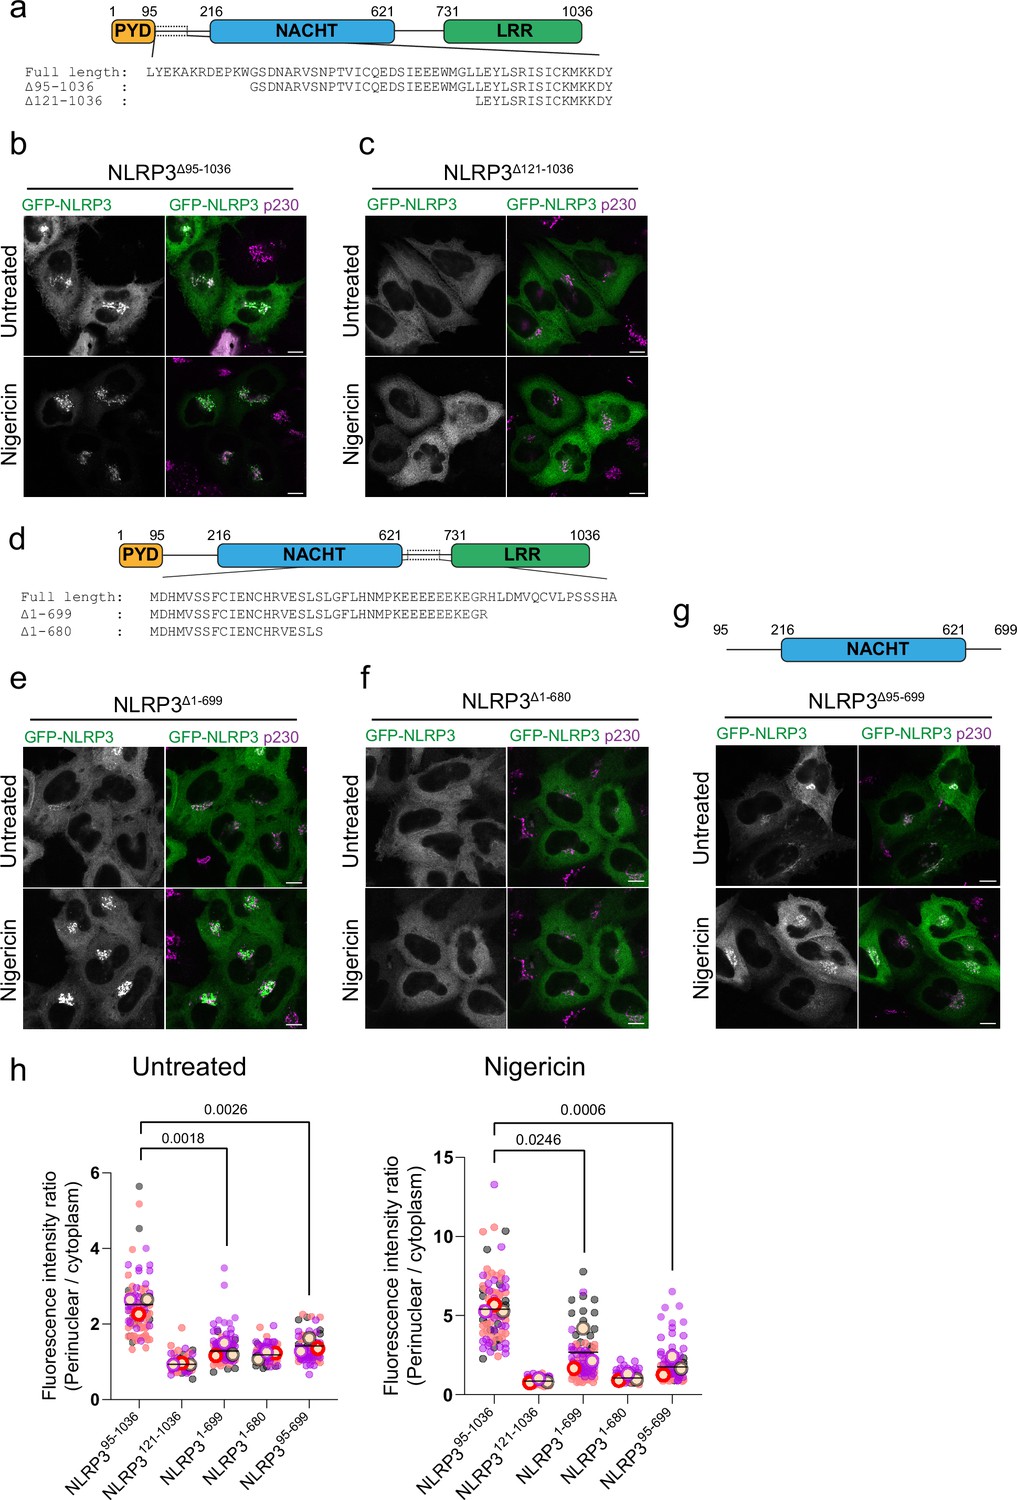
Definition of a minimal NLRP3 region required for enrichment at the Golgi apparatus.
(A) Schematic of truncations made in full length NLRP3 from the N terminus of the protein. Representative confocal microscopy images of (B) GFP-NLRP3Δ95-1036 or (C) GFP-NLRP3Δ121-1036 transiently expressed in HeLaM cells, treated with or without 10 µM nigericin for 1 hr. (D) Schematic of truncations made in full length NLRP3 from the C terminus of the protein. Representative confocal microscopy images of (E) GFP-NLRP3Δ1-699 or (F) GFP-NLRP3Δ1-680 transiently expressed in HeLaM cells, treated with or without 10 µM nigericin for 1 hr. (G) Schematic of the minimal Golgi binding truncation mutant NLRP3 Δ95-699 with representative confocal microscopy images of NLRP3 Δ95-699 expressed in HeLaM cells, treated with or without 10 µM nigericin for 1 hr. (H) Quantification of the ratio of GFP signal in the perinuclear region over cytoplasmic GFP signal for each of the indicated constructs in untreated or nigericin treated cells. N=3. Scale bars = 10 µm.
Figure 2 with 1 supplement

Overexpression of ZDHHC palmitoyltransferases can alter NLRP3 localisation in a Cys-130 and helix115-125-dependent manner.
(A) Quantification of the ratio of GFP-NLRP3 signal on the Golgi relative to that in the cytosol in HeLaM cells transiently transfected with 1 µg of each individual HA-tagged ZDHHC enzyme and GFP-NLRP3. N=2. (B) Representative confocal microscopy images showing the effect of HA-ZDHHC3 and HA-ZDHHC5 on the localisation of GFP-NLRP3. Scale bars = 10 µm. (C) Quantification of GFP-NLRP3 or GFP-NLRP3C130S Golgi signal in HeLaM cells transiently transfected with lower amounts (0.25 µg) of each HA-ZDHHC enzyme which altered GFP-NLRP3 localisation in (A). N=3. **p<0.01, ***p<0.001 (Unpaired t test). (D) Representative confocal microscopy images of GFP-NLRP3 or GFP-NLRP3C130S expressed with the indicated HA tagged ZDHHC enzyme. HA-ZDHHC9 images demonstrate that not all Golgi localised PATs drive enhanced Golgi recruitment of NLRP3. Scale bars = 10 µm. (E) Representative confocal microscopy images of GFP-NLRP3 Golgi recruitment in cells transfected with wild type HA-ZDHHC3 or catalytically inactive HA-ZDHHC3C157S. Scale bar = 10 µm. (F) Quantification of GFP-NLRP3 Golgi signal in HeLaM cells co-transfected with HA-ZDHHC3 and catalytically inactive HA-ZDHHC3C157S. N=3. (G) Quantification of GFP-NLRP3 or GFP-NLRP3HF signal on the Golgi in HeLaM cells transiently transfected with 0.25 µg HA-ZDHHC3. N=3.
Figure 2—figure supplement 1
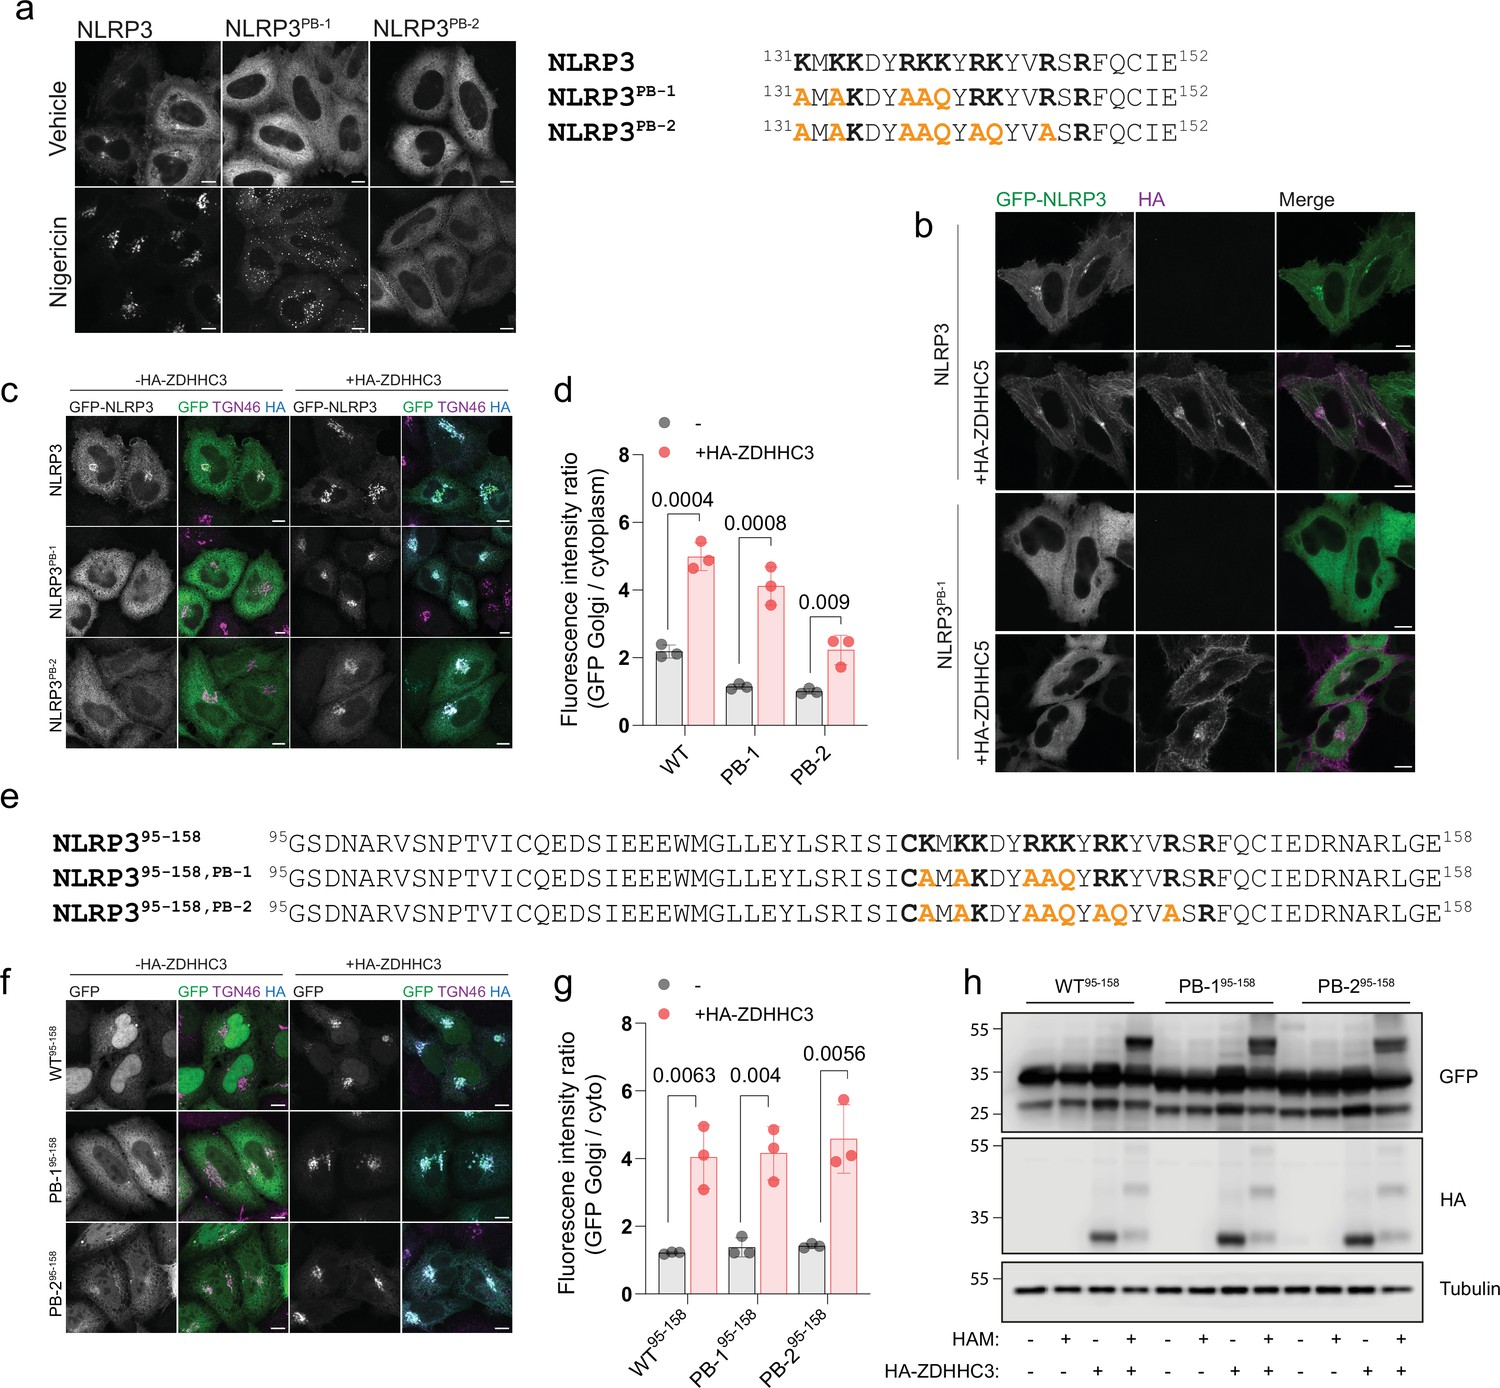
The NLRP3 PB region provides an additional affinity for charged membranes.
(A) Representative images of full length GFP tagged NLRP3 polybasic mutants treated with or without 10 µM nigericin for 1 hr and schematic of mutations made in the polybasic region. Mutated residues are highlighted in orange. (B) Representative images of GFP-NLRP3 and GFP-NLRP3PB-1 co-expressed with or without HA-ZDHHC5. Mutation of residues within the polybasic region renders NLRP3 insensitive to ZDHHC5 overexpression. (C) Representative confocal microscopy images of GFP-NLRP3, GFP-NLRP3PB-1, and GFP-NLRP3PB-2 transiently expressed in HeLaM cells alone or with HA-ZDHHC3. (D) Quantification of GFP-NLRP3, GFP-NLRP3PB-1 and GFP-NLRP3PB-2 Golgi recruitment with and without HA-ZDHHC3. (E) Schematic of mutations made in the polybasic region of GFP-NLRP395-158 constructs. Mutated residues are highlighted in orange. (F) Representative confocal microscopy images of GFP-NLRP395-158, GFP-NLRP3PB-1,95-158 or GFP-NLRP3PB-2,95-158 expressed in HeLaM cells with or without HA-ZDHHC3. (G) Quantification of GFP-NLRP395-158, GFP-NLRP3PB-1,95-158 or GFP-NLRP3PB-2,95-158 signal on the Golgi with and without HA-ZDHHC3. Scale bars in all images = 10 µm. (H) Western blots of acyl biotin exchange assay using 5 kDa PEG maleimide performed on cell lysates harvested from cells expressing GFP-NLRP395-158, GFP-NLRP3 PB-1,95-158 or GFP-NLRP3PB-2,95-158 with or without HA-ZDHHC3.
-
Figure 2—figure supplement 1—source data 1
Raw uncropped western blots for Figure 2—figure supplement 1H.
- https://cdn.elifesciences.org/articles/94302/elife-94302-fig2-figsupp1-data1-v2.zip
Figure 3

NLRP3 localisation to the Golgi is Cys-130 dependent and sensitive to ZDHHC3 levels in THP-1 macrophages.
(A) Confocal microscopy images of LPS stimulated THP-1 cells stained with antibodies against NLRP3 and p230. Scale bar = 5 µm. (B) THP-1 cells stably transduced with either GFP-NLRP3, GFP-NLRP3C130S, or GFP-NLRP3HF were imaged live by confocal microscopy and scored in (C) for the percentage of cells showing a perinuclear enrichment of GFP-NLRP3 signal. N=3. Scale bars = 10 µm. (D) Confocal microscopy images of stable GFP-NLRP3 or GFP-NLRP3C130S THP-1 cells transduced with HA-ZDHHC3 and stained for HA to visualise ZDHHC3 localisation and TGN46. Images are representative of two independent experiments. Scale bars = 10 µm. (E) THP-1 cells stably over-expressing HA-ZDHHC3 or HA-ZDHHC3C157S were stained with anti-NLRP3 antibodies to visualise NLRP3 recruitment to the peri-nuclear region. Scale bars = 20 µm. (F) Representative live cell confocal microscopy images of LPS primed THP-1 cells stably over-expressing HA-ZDHHC3 or HA-ZDHHC3C157S stimulated with 20 µM nigericin for 2 hr. Dead cells were visualised by propidium iodide staining with cell boundaries visualised through WGA-Alexa647 staining. Scale bars = 20 µm. (G) Quantification of the percentage of non-transduced, HA-ZDHHC3 or HA-ZDHHC3C157S THP-1 cells positive for propidium iodide following treatment with 20 µM nigericin for 2 hr. N=3.
Figure 4

NLRP3 can be S-acylated at Cys-130.
(A) Visualisation of S-acylation sites in HeLaM cells transiently expressing GFP-NLRP3 or GFP-NLRP3C130S, labelled by an acyl biotin exchange assay (ABE) with 5 kDa PEG maleimide. Arrowheads indicate non-lipidated NLRP3 (0), singly S-acylated NLRP3 (1) and doubly acylated NLRP3 (2) species. HAM = hydroxylamine. (B) Visualisation of acylation sites by 5 kDa PEG maleimide ABE in HeLaM cells transiently expressing GFP-NLRP3 or GFP-NLRP3C130S and 0.25 µg HA-ZDHHC3. (C) Visualisation of acylation sites by 5 kDa PEG maleimide ABE in THP-1 cells stably transduced with GFP-NLRP3 or GFP-NLRP3C130S. Blots are representative of 2 independent experiments. (D) Schematic of minimal GFP tagged NLRP3 sequences used and expressed in HeLaM cells to directly assess S-acylation at Cys-130. Mutations introduced are highlighted in green. (E) Representative confocal microscopy images of GFP-NLRP395-158, GFP-NLRP3C130S,95-158 or GFP-NLRP3HF,95-158, expressed alone or with 0.25 µg HA-ZDHHC3. N=3. Scale bars = 10 µm. (F) Quantification of GFP-NLRP395-158, GFP-NLRP3C130S,95-158 or GFP-NLRP3HF,95-158 signal associated with the Golgi with or without HA-ZDHHC3. (G) Visualisation of S-acylation sites in GFP-NLRP395-158 peptides expressed in HeLaM cells by ABE with or without 0.25 µg HA-ZDHHC3.
-
Figure 4—source data 1
Raw uncropped western blots for Figure 4A–C, G.
- https://cdn.elifesciences.org/articles/94302/elife-94302-fig4-data1-v2.zip
Figure 5 with 2 supplements

NLRP3 dynamically associates with the Golgi apparatus.
(A) Representative confocal microscopy images of GFP-NLRP3 relative to TGN46 in HeLaM cells treated for 4 hr with 50 µM PalmostatinB or 0.4% DMSO vehicle control and quantification of GFP-NLRP3 signal associated with the Golgi with or without PalmostatinB treatment. (B) Representative images of GFP-NLRP3 in HeLaM cells co-expressed with 0.25 µg APT1-FLAG or 0.25 µg APT2-FLAG with quantification of GFP-NLRP3 signal associated with the Golgi in cells overexpressing APT1-FLAG or APT2-FLAG. Golgi associated GFP-NLRP3 signal is lost in cells expressing APT2-FLAG. (C) Representative confocal images of the effect of PalmostatinB treatment on enhanced recruitment of NLRP3 to the Golgi after nigericin treatment and quantification of perinuclear GFP-NLRP3 signal. Cells were pre-treated for 4 hr with 50 µM PalmostatinB or 0.4% DMSO control before a 1 hr stimulation with 10 µM nigericin. (D) Representative microscopy images of GFP-NLRP3 and APT1 or APT2-FLAG expressing cells following a 1 hr treatment with 10 µM nigericin and quantification of GFP-NLRP3 signal on the Golgi under the same conditions. (E) Representative images of GFP-NLRP3 expressing HeLaM cells before and after photobleaching of Golgi associated NLRP3. Scale bars in (A–E) = 10 µm. (F) FRAP recovery curves of GFP-NLRP3 treated with vehicle control or 10 µM nigericin for 1 hr. (G) Quantification of the mobile and immobile pool of GFP-NLRP3 signal in cells treated with vehicle control or 10 µM nigericin. N = 3, untreated = total of 32 cells analysed, nigericin = 29 cells. Minimum of 9 cells analysed per experiment. (H) Representative confocal microscopy images of FKBP tagged GFP-NLRP3 transiently expressed in HeLaM cells. Cells were treated with either vehicle control or 10 µM nigericin for 1 hr before a 15 min co-incubation with 500 nM rapamycin prior to fixation. Scale bars in main figure = 10 µm, insets = 5 µm. (I) Quantification of the amount of GFP-NLRP3 signal associated with the mitochondria following rapamycin treatment in the presence of absence of nigericin. Values are expressed as a percentage of the mitochondrial to cytosolic GFP-NLRP3 ratio seen in vehicle-treated control cells. N = 3.
Figure 5—figure supplement 1
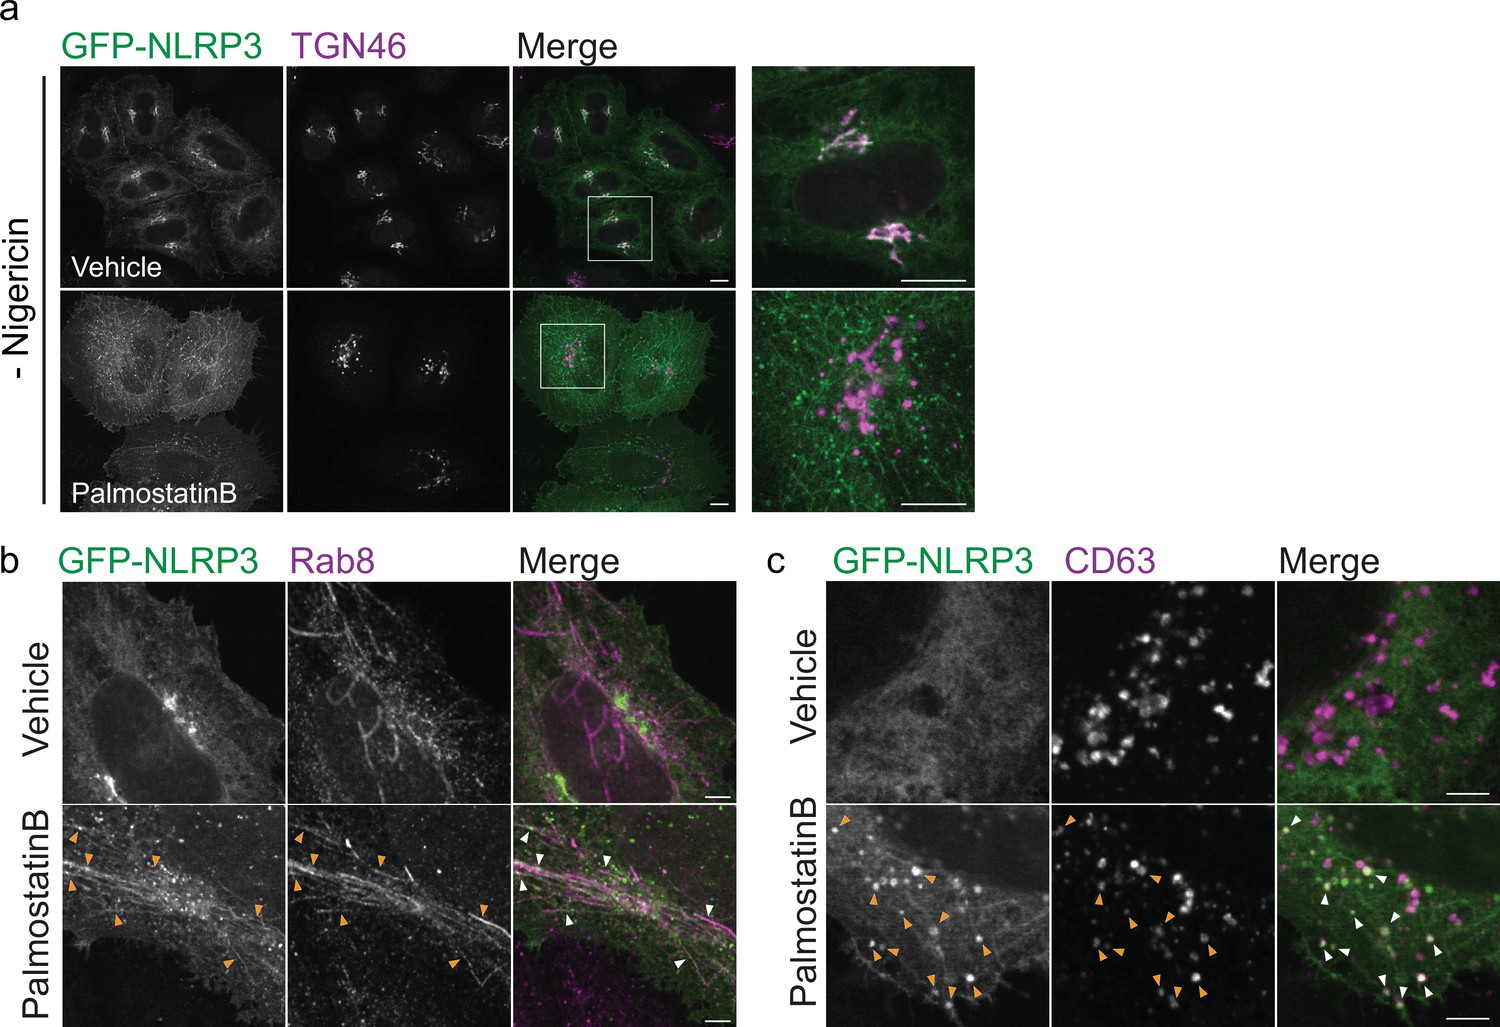
PalmostatinB treatment relocalises NLRP3 to the plasma membrane, tubular recycling endosomes and late endosomes.
(A) Zoom out of images from Figure 5A showing multiple cells treated with vehicle or 50 µM Palmostatin B for 4 hr. Scale bars = 10 µm. Representative images of GFP-NLRP3 co-localisation with (B) Rab8 or (C) CD63 in cells treated with vehicle or 50 µM PalmostatinB for 4 hr. Orange arrowheads point to instances of co-localisation between GFP-NLRP3 and the indicated marker in PalmostatinB-treated cells. Scale bars = 5 µm.
Figure 5—figure supplement 2
The effect of APT2 on NLRP3 Golgi enrichment can be reversed.
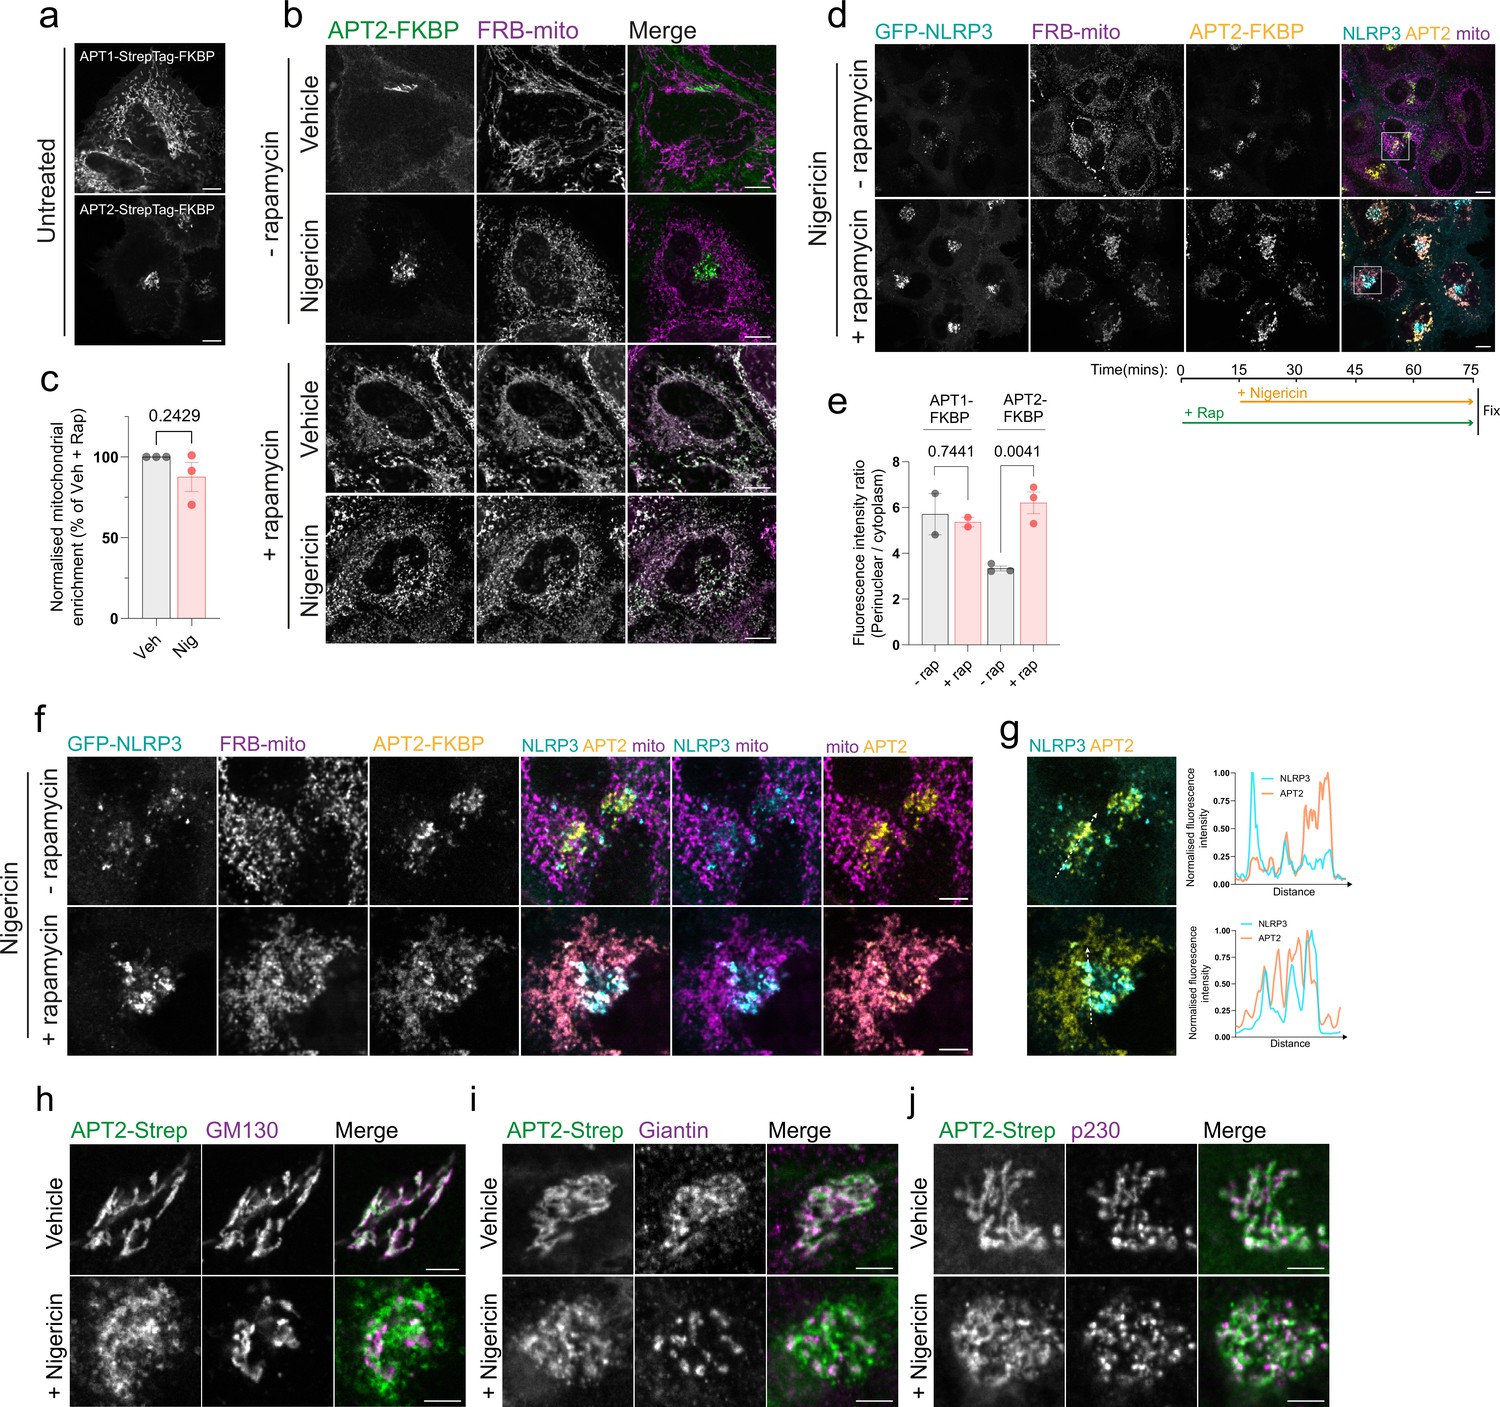
(A) Representative confocal micrographs of HeLaM cells transiently expressing APT1-StrepTag-FKBP or APT2-StrepTag-FKBP showing localisation of APT1 to the mitochondria and APT2 to the Golgi and plasma membrane. (B) Representative confocal microscopy images and quantification of APT2-StrepTag-FKBP (APT2) signal in the perinuclear region showing re-routing of APT2 onto mitochondrial membranes in the presence of 500 nM rapamycin for 15 min and (C) Quantification of APT2 signal recruited to the mitochondria relative to cytosolic signal with and without 10 µM nigericin. Nigericin treatment has no significant effect on recruitment of APT2 to the mitochondria. (D) Representative images of HeLaM cells transiently expressing GFP-NLRP3 with APT2-StrepTag-FKBP and FRB-mito pre-treated with rapamycin or vehicle for 15 min prior to 10 µM nigericin treatment for 1 hr. Removal of overexpressed APT2-StrepTag-FKBP activity restores the enhanced perinuclear NLRP3 signal seen following nigericin treatment to levels seen using APT1, quantified in (E). (F) Zoom in of boxed regions in (D) showing overlap between GFP-NLRP3 and APT2-StrepTag with (F) linescan analysis for each set of images. Representative images of APT-StrepTag-FKBP co-localisation with (H) GM130 (I) Giantin (J) p230 in cells treated with vehicle or 10 µM nigericin for 1 hr. Scale bars = 5 µm.
Figure 6 with 3 supplements

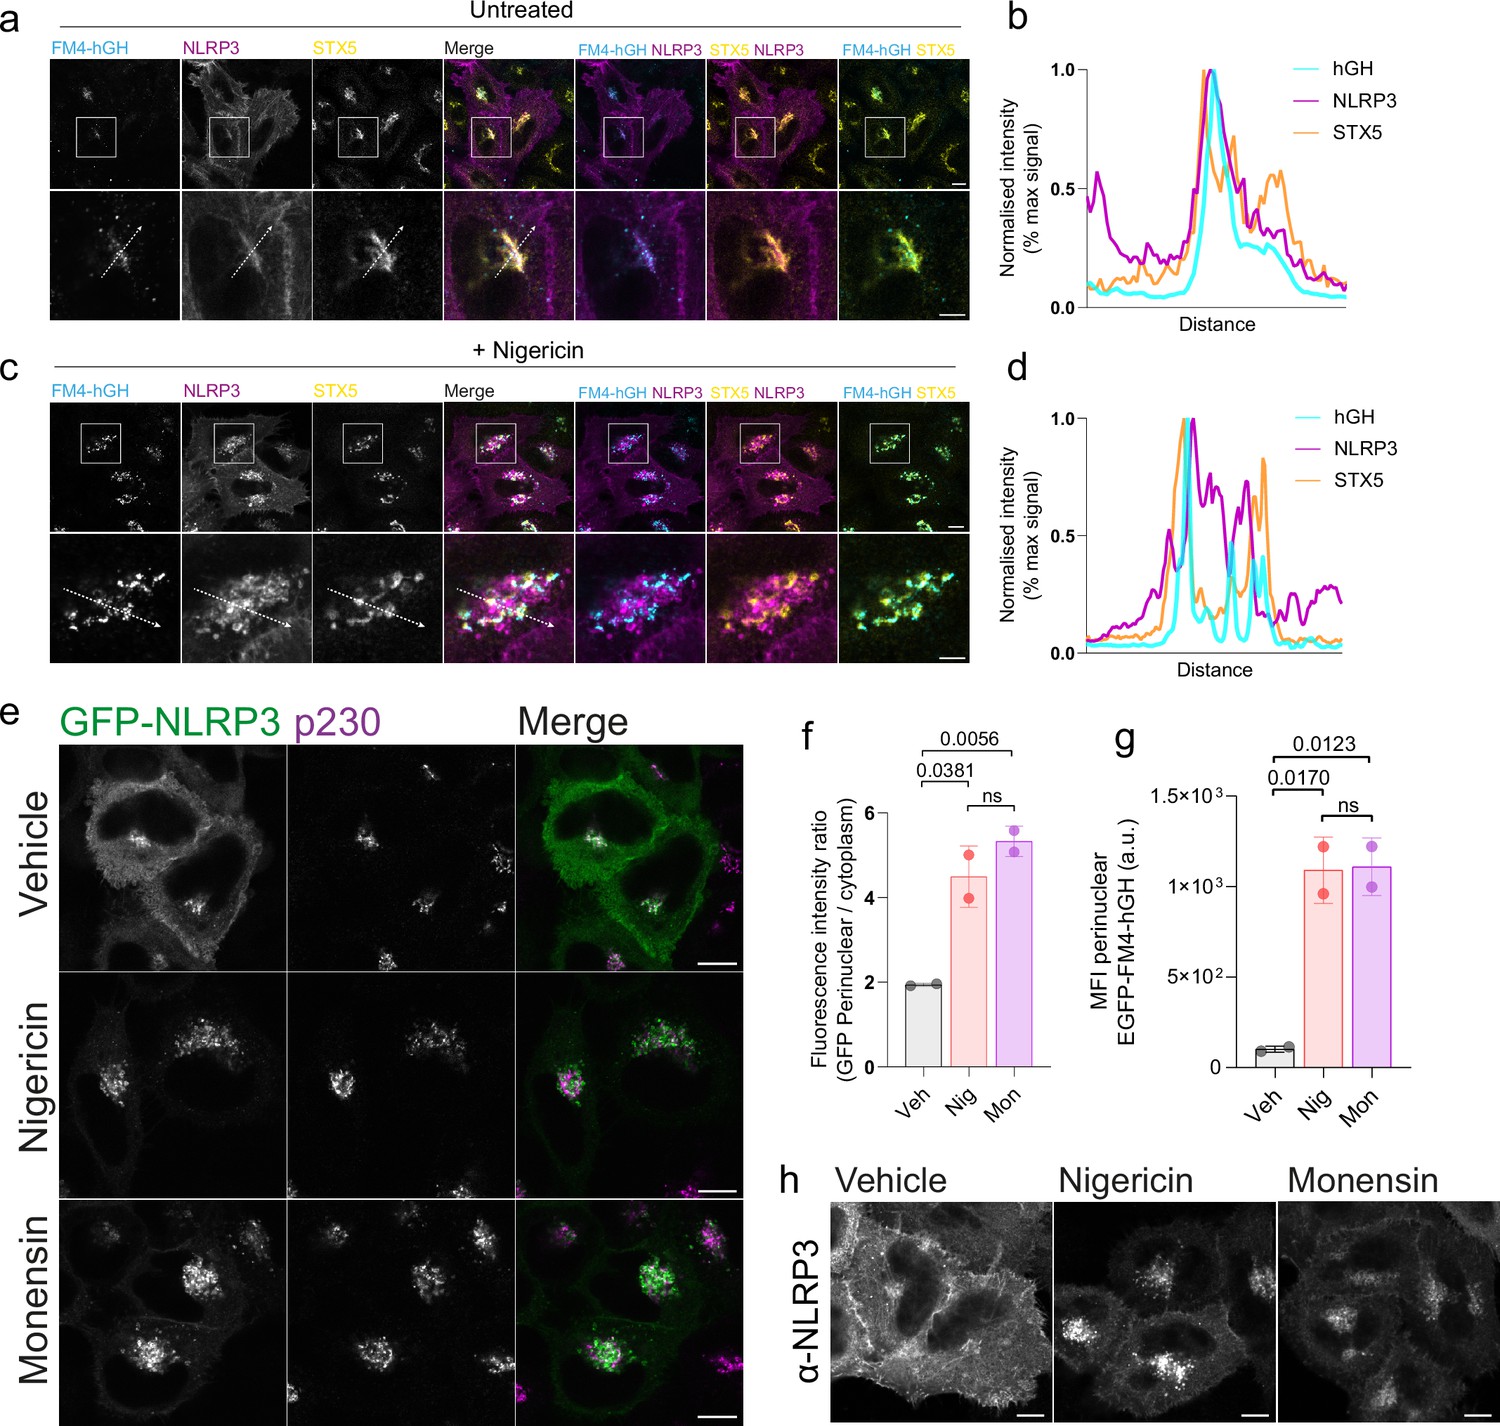
Nigericin inhibits trafficking through the Golgi apparatus and limits contact of thioesterases with NLRP3.
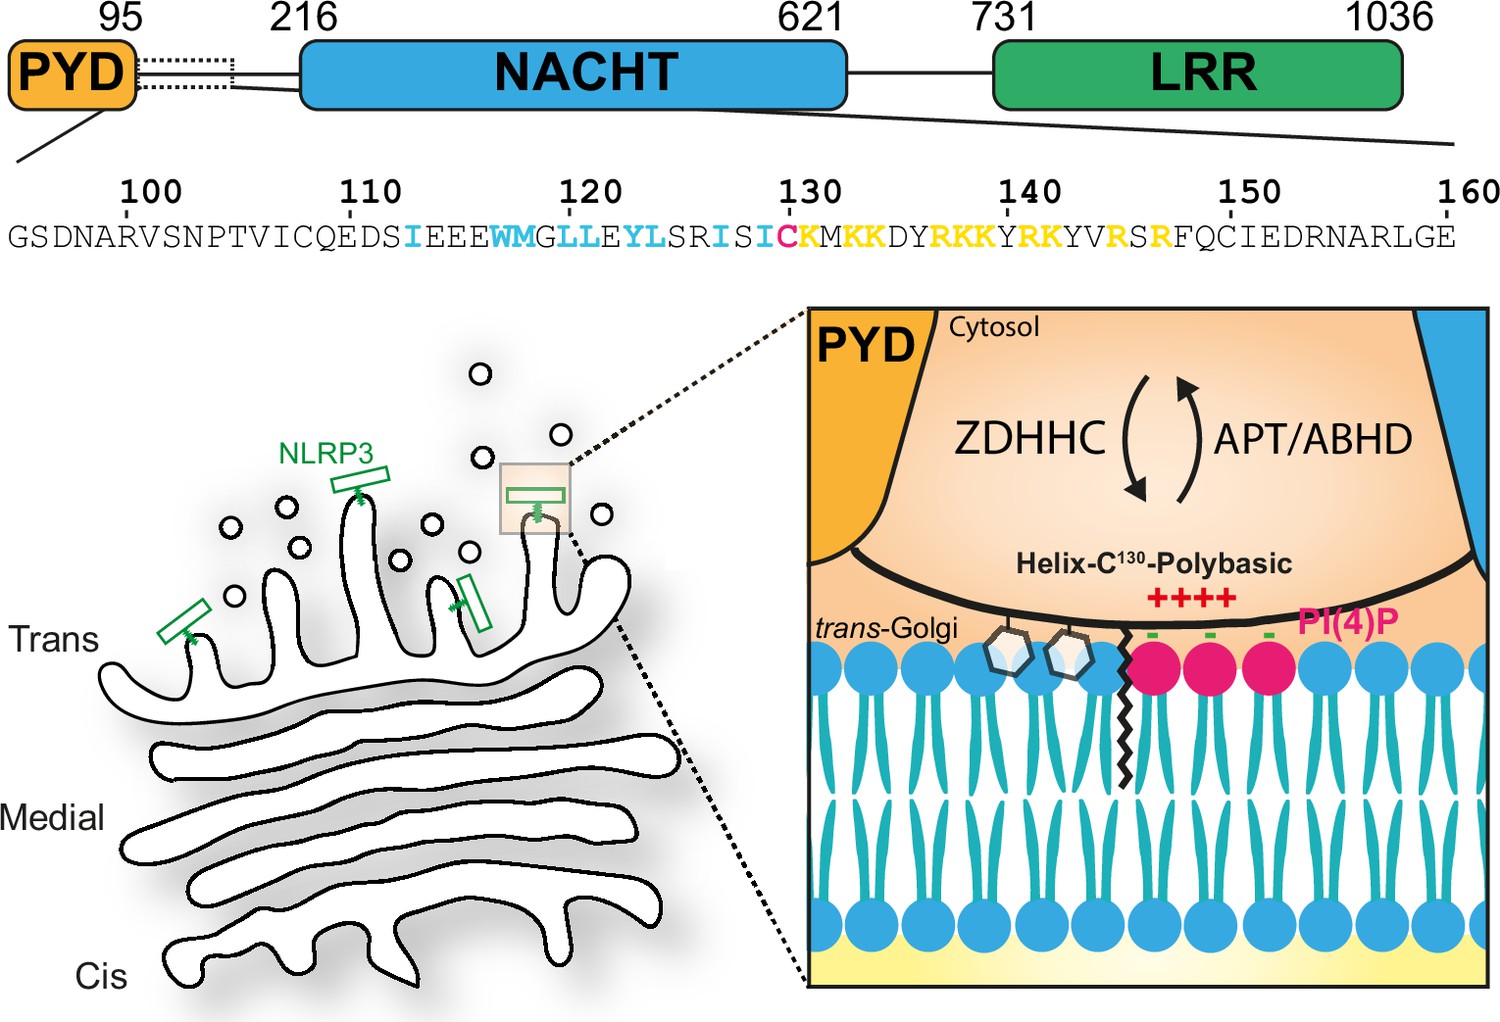
(A) Representative confocal microscopy images of GFP-NLRP3 and APT2S122A-StrepTag following a 1 hr treatment with 10 µM nigericin or vehicle control. Arrowheads point to instances of GFP-NLRP3 signal where APT2S122A is largely absent. Scale bars = 5 µm. (B) Linescan analysis of GFP-NLRP3 signal overlap with APT2S122A in control and nigericin-treated cells. Representative confocal microscopy images of EGFP-FM4-hGH relative to the cis-Golgi marker STX5 and (C) the TGN marker TGN46 or (D) the trans-Golgi marker p230 in HeLa cells treated with 500 nM rapamycin, in the presence or absence of 10 µM nigericin, for 1 hr. Scale bars = 5 µm. (E) Schematic of EGFP-FM4-hGH secretory reporter system showing the domain architecture of the EGFP-FM4-hGH reporter and position of the reporter within the secretory pathway over time after the addition of rapamycin. (F) Quantification of EGFP-FM4-hGH signal in the perinuclear area in cells treated with or without nigericin for 1 hr. N=3. (G) Proposed model for S-acylation-dependent accumulation of NLRP3 on the Golgi. In the absence of nigericin, NLRP3 shows enrichment on the Golgi due to the balance of acylation and de-acylation provided by the opposing actions of ZDHHC and APT/ABHD enzymes. (H) Nigericin alters the organisation of the Golgi complex and inhibits the exchange of material between Golgi cisternae. This potentially limits the amount of APT2 able to access NLRP3 leading to its gradual accumulation, likely on trans cisternae and the TGN.
Figure 6—figure supplement 1
Monensin enhances NLRP3 Golgi recruitment and blocks trafficking through the Golgi.
Representative images of untagged NLRP3 expressed in HeLa cells stably expressing the secretory reporter EGFP-FM4-hGH, treated with 500 nM rapamycin for 1 hr in the (A) absence or (C) presence of 10 µM nigericin. Following nigericin treatment, NLRP3 shows minimal co-localisation with the cis-Golgi marker STX5 and hGH, which is trapped in STX5+ compartments. Scale bars in main image = 10 µm, zoom ins = 5 µm. Line scan analysis of NLRP3 signal overlap with hGH and STX5 in (B) vehicle treated control cells or (D) cells treated with 10 µM nigericin for 1 hr. (E) Representative images of HeLaM cells transfected with GFP-NLRP3 and treated with either 10 µM nigericin or 10 µM monensin for 1 hr. Scale bars = 10 µm. (F) Quantification of the Golgi to cytoplasmic GFP-NLRP3 ratio following treatment with nigericin or monensin. N=2. (G) Quantification of EGFP-FM4-hGH signal in the perinuclear region after 1 hr treatment with rapamycin administered in combination with either vehicle, 10 µM nigericin, or 10 µM monensin. (H) Representative images of HeLaM cells transfected with an untagged NLRP3 construct and stained with anti-NLRP3 antibodies following treatment with either 10 µM nigericin or 10 µM monensin for 1 hr. Scale bars = 10 µm.
Figure 6—figure supplement 2
Model of S-acylation dependent recruitment of NLRP3 to intracellular membranes.
Interaction of NLRP3 with intracellular membranes is likely to be driven through an initial transient mode of binding provided by residues in helix115-125 and the polybasic region. Stable enrichment and trapping of NLRP3 at the Golgi requires S-acylation at Cys-130 by ZDHHC enzymes with removal of NLRP3 likely catalysed by proteins from the APT or ABHD family of thioesterases.
Figure 6—figure supplement 3
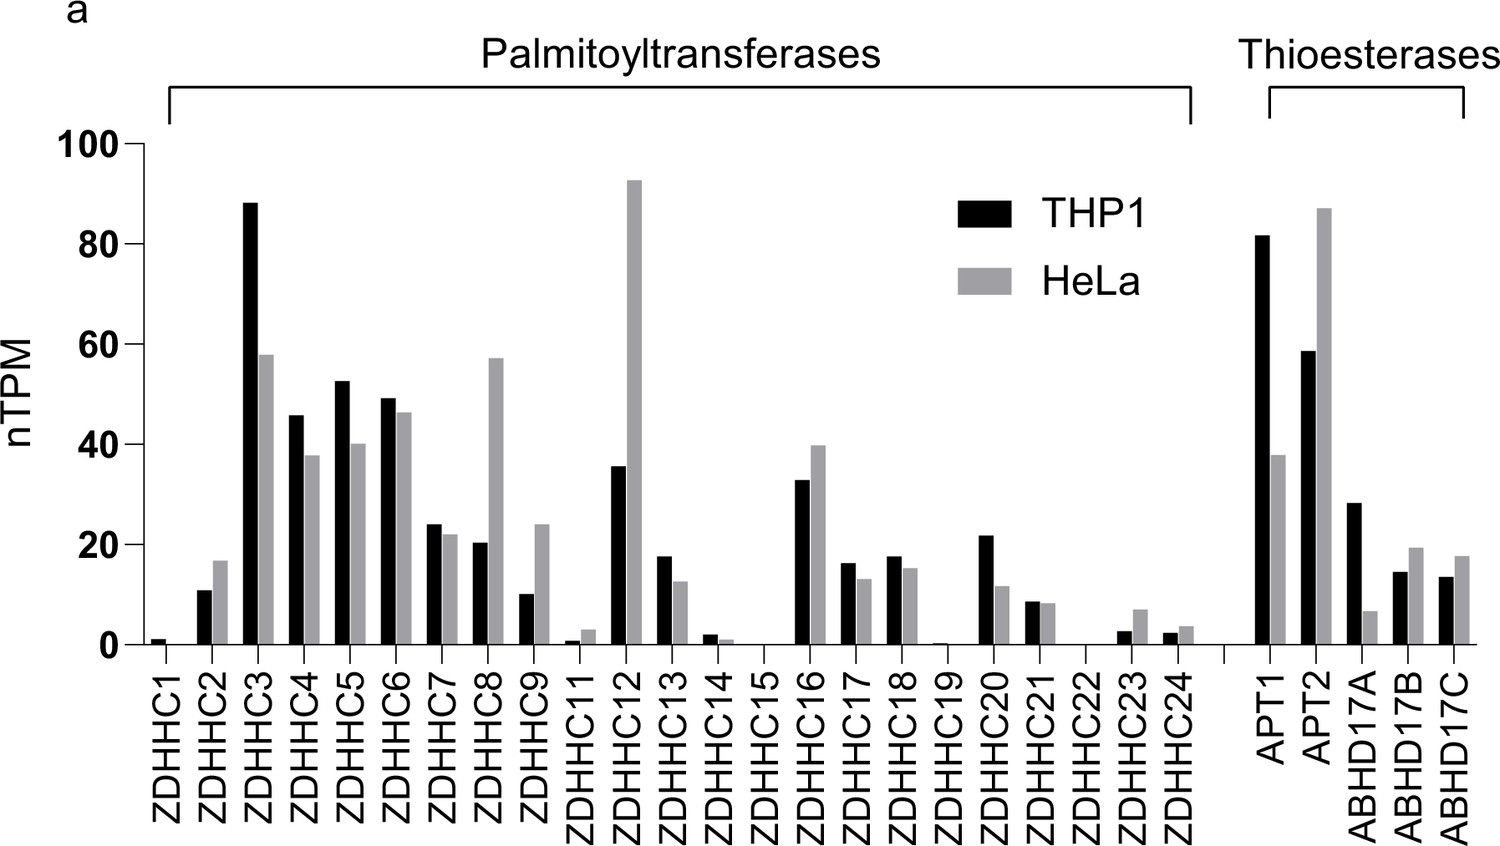
Palmitoyltransferase and thioesterase transcript levels in THP-1 cells and HeLa cells.
Data are collated from the human protein atlas (https://www.proteinatlas.org/).
Author response image 1

Overexpression of HA-ZDHHC3 does not impact Golgi morphology.
A) Representative confocal micrographs of HeLaM cells transfected with 200 ng HA-ZDHHC3 fixed and stained with antibodies to STX5 or TGN46. Scale bars = 10 µm.
Author response image 2

S-acylated peripheral membrane proteins show differential sensitivity to nigericin.
(A) Representative confocal micrographs of HeLaM cells coexpressing GFP-NRas and an untagged NLRP3 construct. Cells were left untreated or treated with 10 µM nigericin for 1 hour prior to fixation. Scale bars = 10 µm. (B) Quantification of GFP-NRas or NLRP3 signal in the perinuclear region of cells treated with or without nigericin
Additional files
Download links
A two-part list of links to download the article, or parts of the article, in various formats.
Downloads (link to download the article as PDF)
Open citations (links to open the citations from this article in various online reference manager services)
Cite this article (links to download the citations from this article in formats compatible with various reference manager tools)
S-acylation of NLRP3 provides a nigericin sensitive gating mechanism that controls access to the Golgi
eLife 13:RP94302.
https://doi.org/10.7554/eLife.94302.3


