Population clustering of structural brain aging and its association with brain development
- Institute of Science and Technology for Brain-Inspired Intelligence, Fudan University, China
- Key Laboratory of Computational Neuroscience and Brain-Inspired Intelligence (Fudan University), Ministry of Education, China
- School of Data Science, Fudan University, China
- Department of Child and Adolescent Psychiatry and Psychotherapy, Central Institute of Mental Health, Medical Faculty Mannheim, Heidelberg University, Germany
- Discipline of Psychiatry, School of Medicine and Trinity College Institute of Neuroscience, Trinity College Dublin, Ireland
- University Medical Centre Hamburg-Eppendorf, Germany
- Social Genetic and Developmental Psychiatry Centre, Institute of Psychiatry, Psychology and Neuroscience, King’s College London, United Kingdom
- Institute of Cognitive and Clinical Neuroscience, Central Institute of Mental Health, Medical Faculty Mannheim, Heidelberg University, Germany
- Department of Psychology, School of Social Sciences, University of Mannheim, Germany
- NeuroSpin, CEA, Université Paris-Saclay, France
- Departments of Psychiatry and Psychology, University of Vermont, United States
- Sir Peter Mansfield Imaging Centre School of Physics and Astronomy, University of Nottingham, United Kingdom
- Department of Psychiatry and Psychotherapy CCM, Charité – Universitätsmedizin Berlin, corporate member of Freie Universität Berlin, Humboldt-Universität zu Berlin, and Berlin Institute of Health, Germany
- Physikalisch-Technische Bundesanstalt (PTB), Braunschweig and Berlin, Germany
- Institut National de la Santé et de la Recherche Médicale, INSERM U1299 "Developmental Trajectories and Psychiatry", Université Paris-Saclay, Ecole Normale supérieure Paris-Saclay, CNRS, Centre Borelli, France
- AP-HP. Sorbonne Université, Department of Child and Adolescent Psychiatry, Pitié-Salpêtrière Hospital, France
- Psychiatry Department, EPS Barthélémy Durand, France
- Institute of Medical Psychology and Medical Sociology, University Medical Center Schleswig-Holstein, Kiel University, Germany
- Department of Child and Adolescent Psychiatry and Psychotherapy, University Medical Centre, Germany
- Department of Psychiatry and Neuroimaging Center, Technische Universität Dresden, Germany
- Department of Psychiatry and Neurosciences, Charité–Universitätsmedizin Berlin, corporate member of Freie Universität BerlinHumboldt-Universität zu Berlin, and Berlin Institute of Health, Germany
- School of Psychology and Global Brain Health Institute, Trinity College Dublin, Ireland
- Centre for Population Neuroscience and Stratified Medicine (PONS Centre), ISTBI, Fudan University, China
- Centre for Population Neuroscience and Stratified Medicine (PONS), Department of Psychiatry and Psychotherapy, Charité Universitätsmedizin, Germany
- Huashan Institute of Medicine, Huashan Hospital affiliated to Fudan University, China
- MOE Frontiers Center for Brain Science, Fudan University, China
- Zhangjiang Fudan International Innovation Center, China
- Department of Computer Science, University of Warwick, United Kingdom
Figures
Figure 1
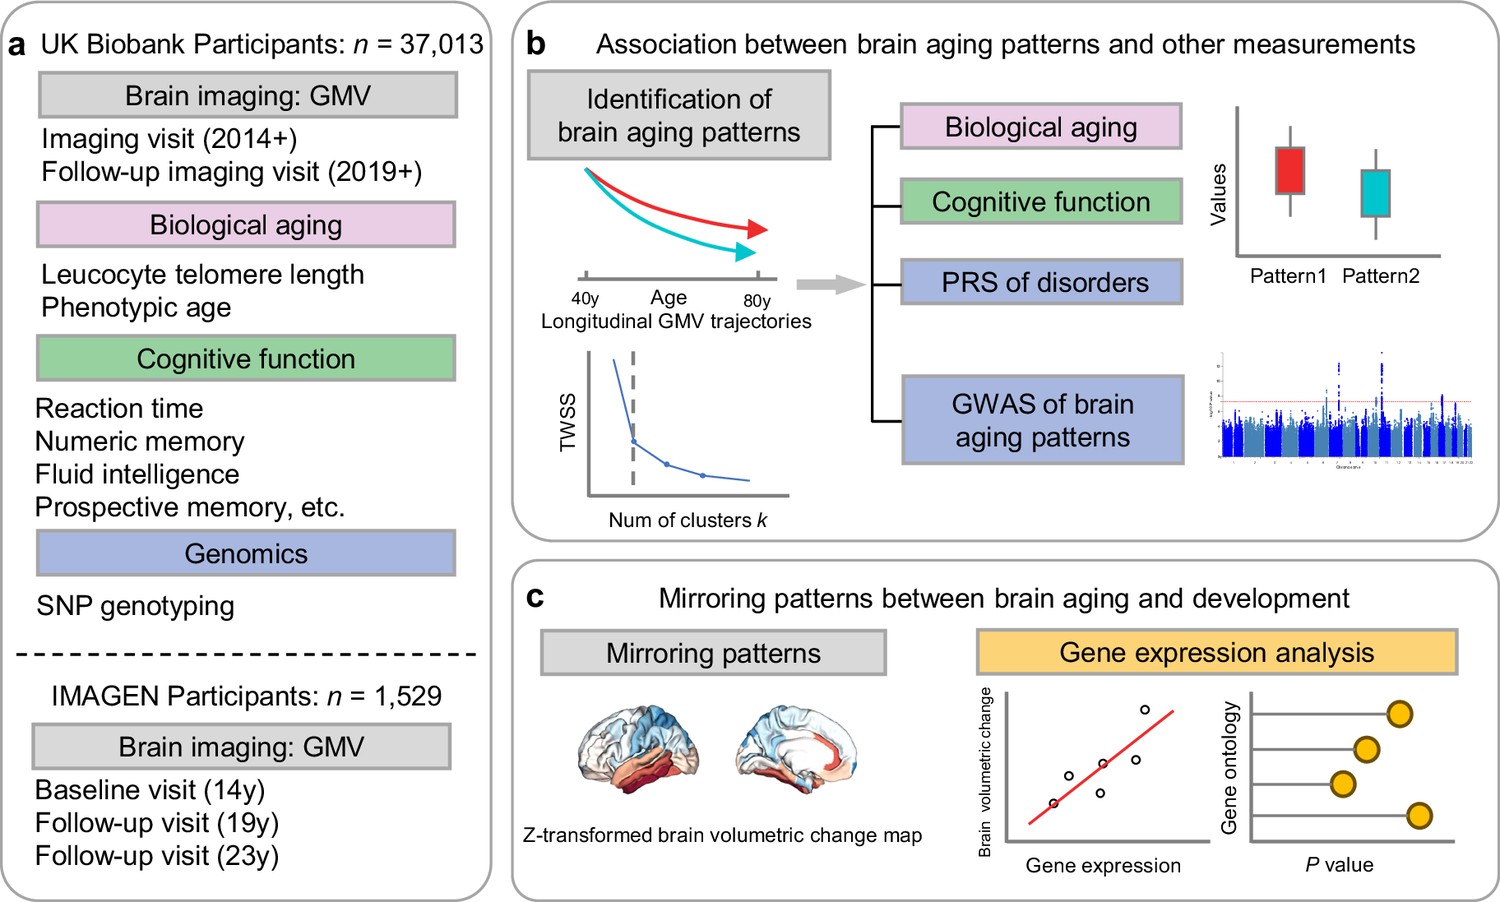
Overview of the study workflow.
(a) Population cohorts (UK Biobank and IMAGEN) and data sources (brain imaging, biological aging biomarkers, cognitive functions, genomic data) involved in this study. (b) Brain aging patterns were identified using longitudinal trajectories of the whole brain GMV, which enabled the capturing of long-term and individualized variations compared to only use cross-sectional data, and associations between brain aging patterns and other measurements (biological aging, cognitive functions and PRS of major neuropsychiatric disorders) were investigated. (c) Mirroring patterns between brain aging and brain development was investigated using z-transformed brain volumetric change map and gene expression analysis.
Figure 2
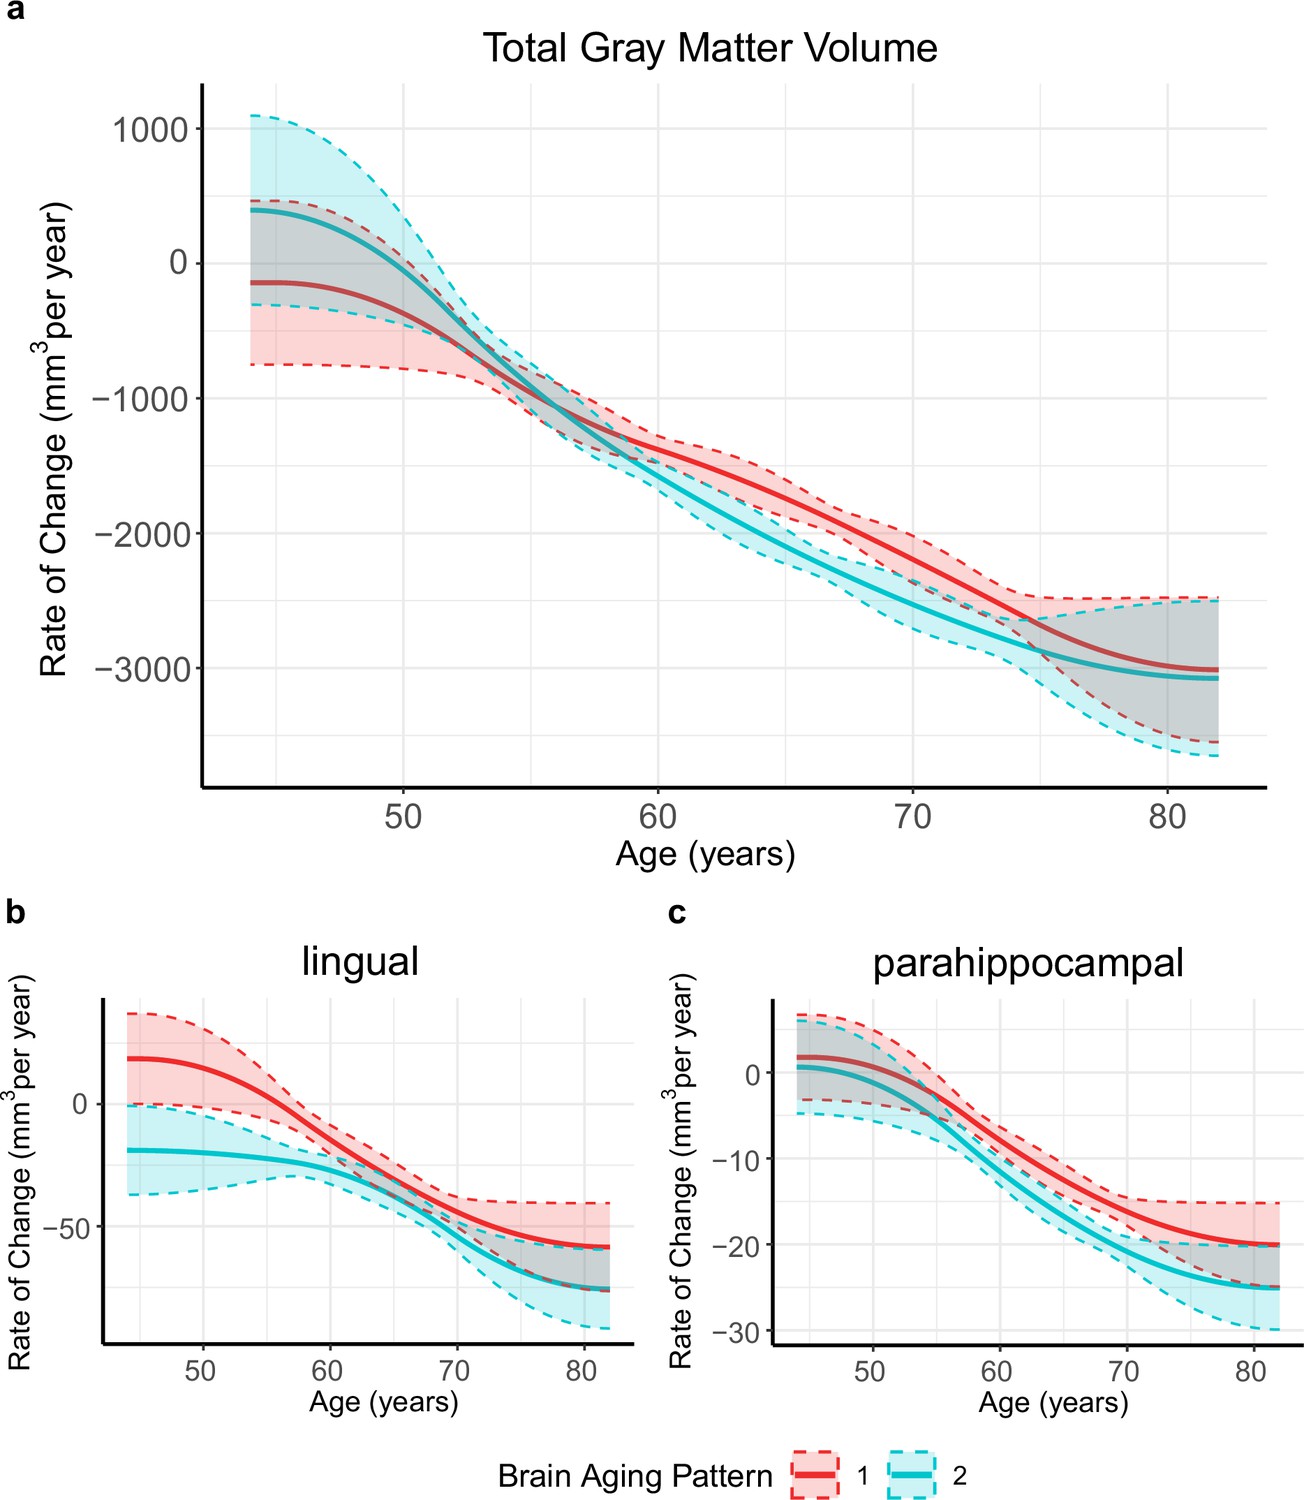
Global (a) and selected regional (b, c) cortical gray matter volume rate of change among participants with brain aging patterns 1 (red) and 2 (blue).
Rates of volumetric change for total gray matter and each ROI were estimated using GAMM, which incorporates both cross-sectional between-subject variation and longitudinal within-subject variation from 40,921 observations and 37,013 participants. Covariates include sex, assessment center, handedness, ethnic, and ICV. Shaded areas around the fit line denotes 95% CI.
-
Figure 2—source data 1
Related to Figure 2.
Global (a) and selected regional (b, c) cortical gray matter volume rate of change among participants with brain aging patterns 1 (red) and 2 (blue).
- https://cdn.elifesciences.org/articles/94970/elife-94970-fig2-data1-v1.xlsx
Figure 3
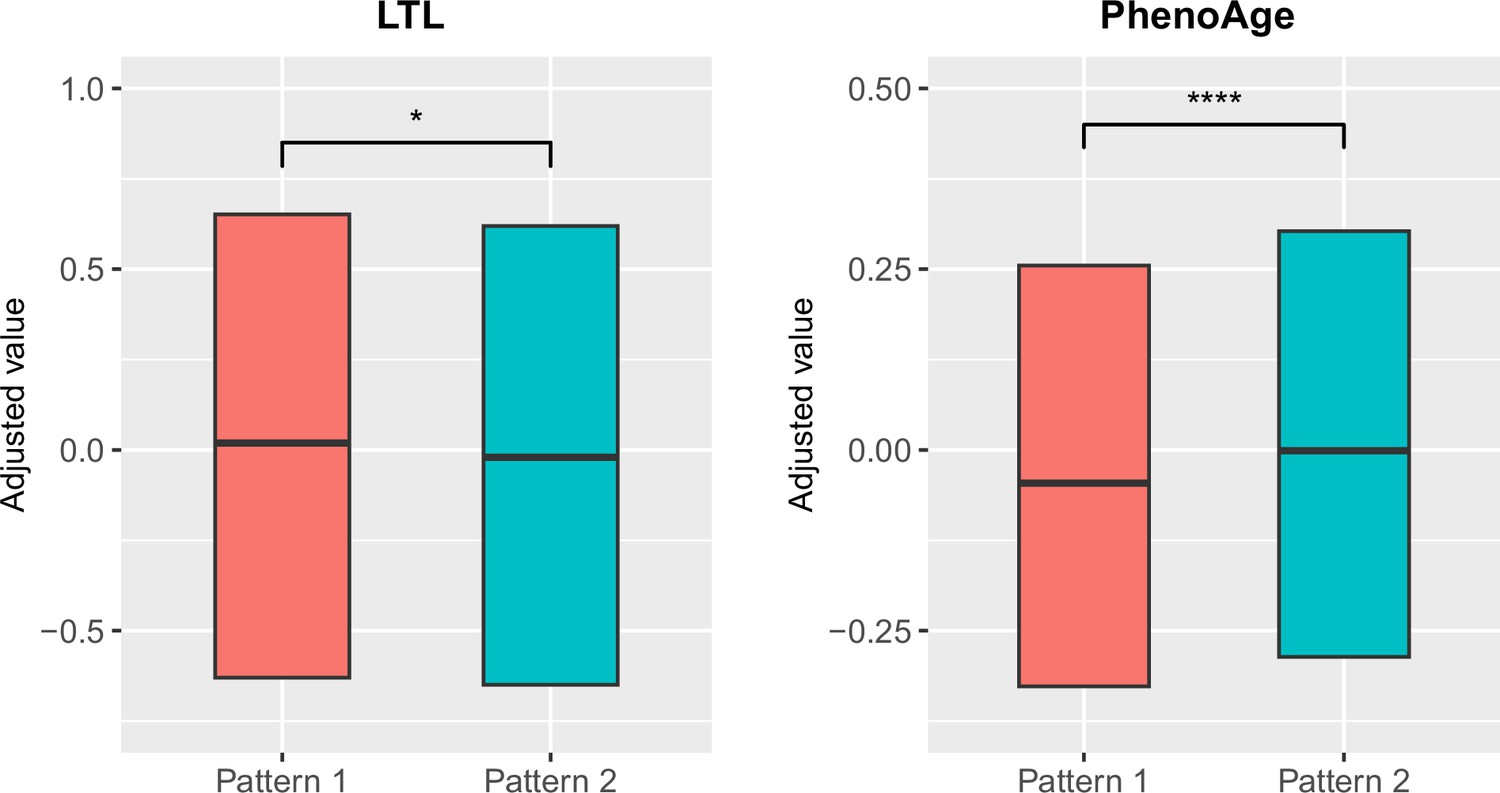
Distributions of biological aging biomarkers (leucocyte telomere length (LTL) and PhenoAge) among participants with brain aging patterns 1 and 2.
Boxes represent the interquartile range (IQR), lines within the boxes indicate the median. Two-sided p values were obtained by comparing LTL or PhenoAge Levine et al., 2018 between brain aging patterns using unadjusted multivariate linear regression models. Results remained significant when adjusting for sex, age, ethnic, BMI, smoking status and alcohol intake frequency in the LTL model Demanelis et al., 2020 and sex, age, ethnic, BMI, smoking status, alcohol frequency and education years in PhenoAge model. Stars indicate statistical significance after Bonferroni correction. ****: p ≤ 0.0001, *: p ≤ 0.05.
-
Figure 3—source data 1
Related to Figure 3.
Distributions of biological aging biomarkers (leucocyte telomere length (LTL) and PhenoAge) among participants with brain aging patterns 1 and 2.
- https://cdn.elifesciences.org/articles/94970/elife-94970-fig3-data1-v1.xlsx
Figure 4
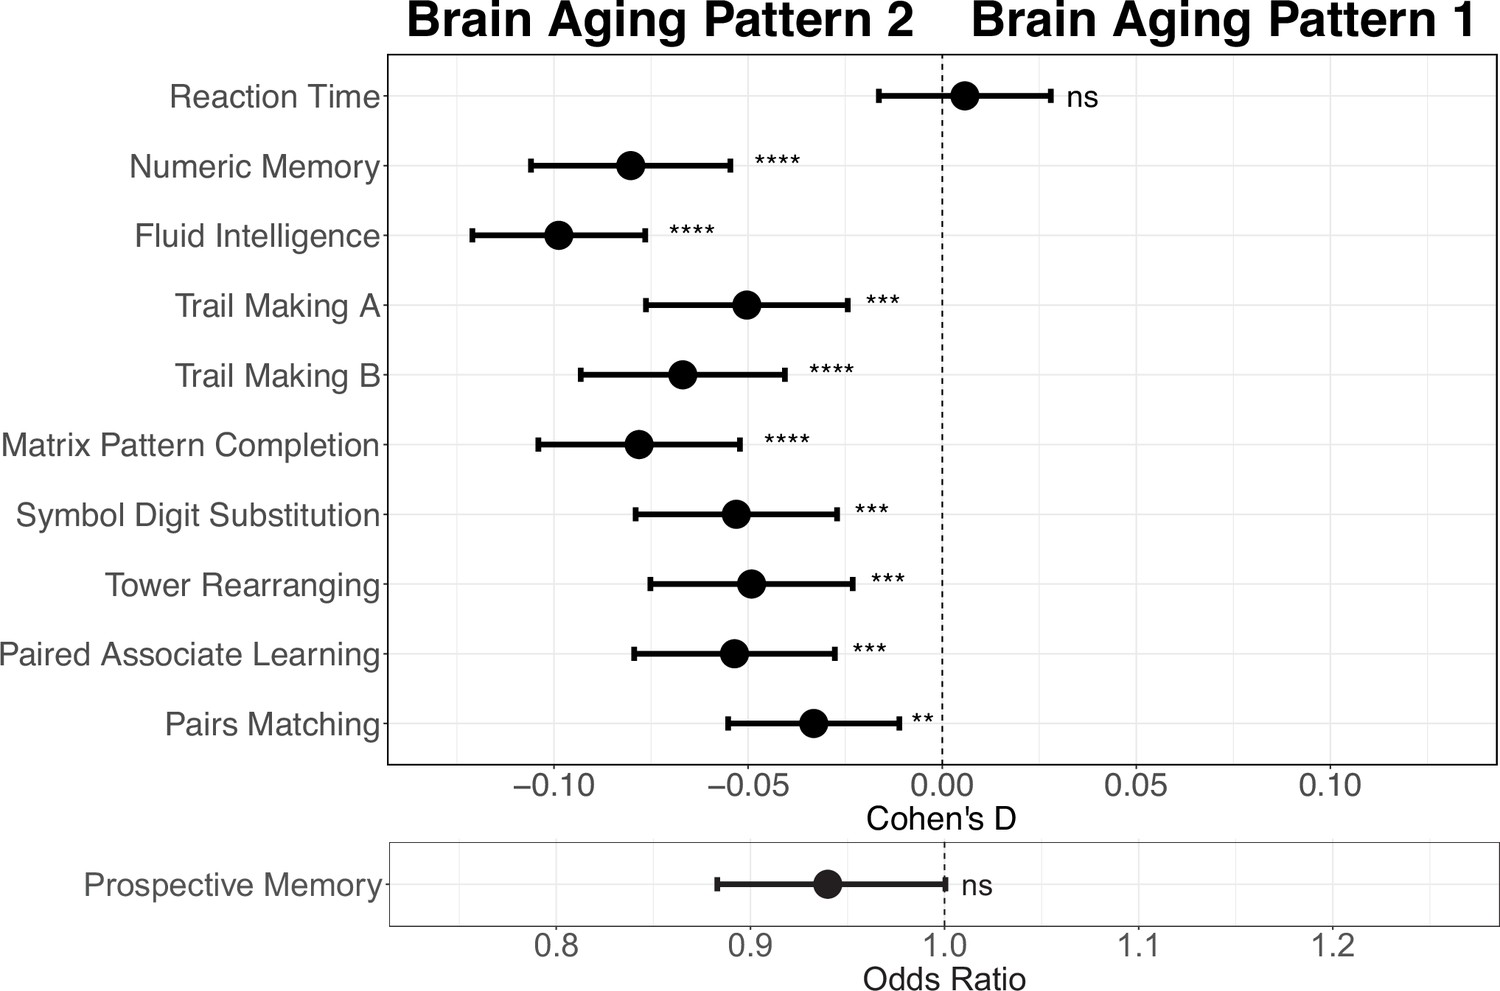
Effect size (Cohen’s D or odds ratio) for comparing the cognitive functions between participants with brain aging patterns 1 and 2.
Results were adjusted such that negative Cohen’s D and Odds Ratio less than 1 indicate worse cognitive performances in brain aging pattern 2 compared to pattern 1. Width of the lines extending from the center point represent 95% confidence interval. Two-sided p values were obtained using both unadjusted and adjusted (for sex, age, and TDI, education and income) multivariate regression models. Stars indicate statistical significance after FDR correction for 11 comparisons. ****: p ≤ 0.0001, ***: p ≤ 0.001, **: p ≤ 0.01, ns: p>0.05.
-
Figure 4—source data 1
Related to Figure 4.
Effect size (Cohen’s D or odds ratio) for comparing the cognitive functions between participants with brain aging patterns 1 and 2.
- https://cdn.elifesciences.org/articles/94970/elife-94970-fig4-data1-v1.xlsx
Figure 5
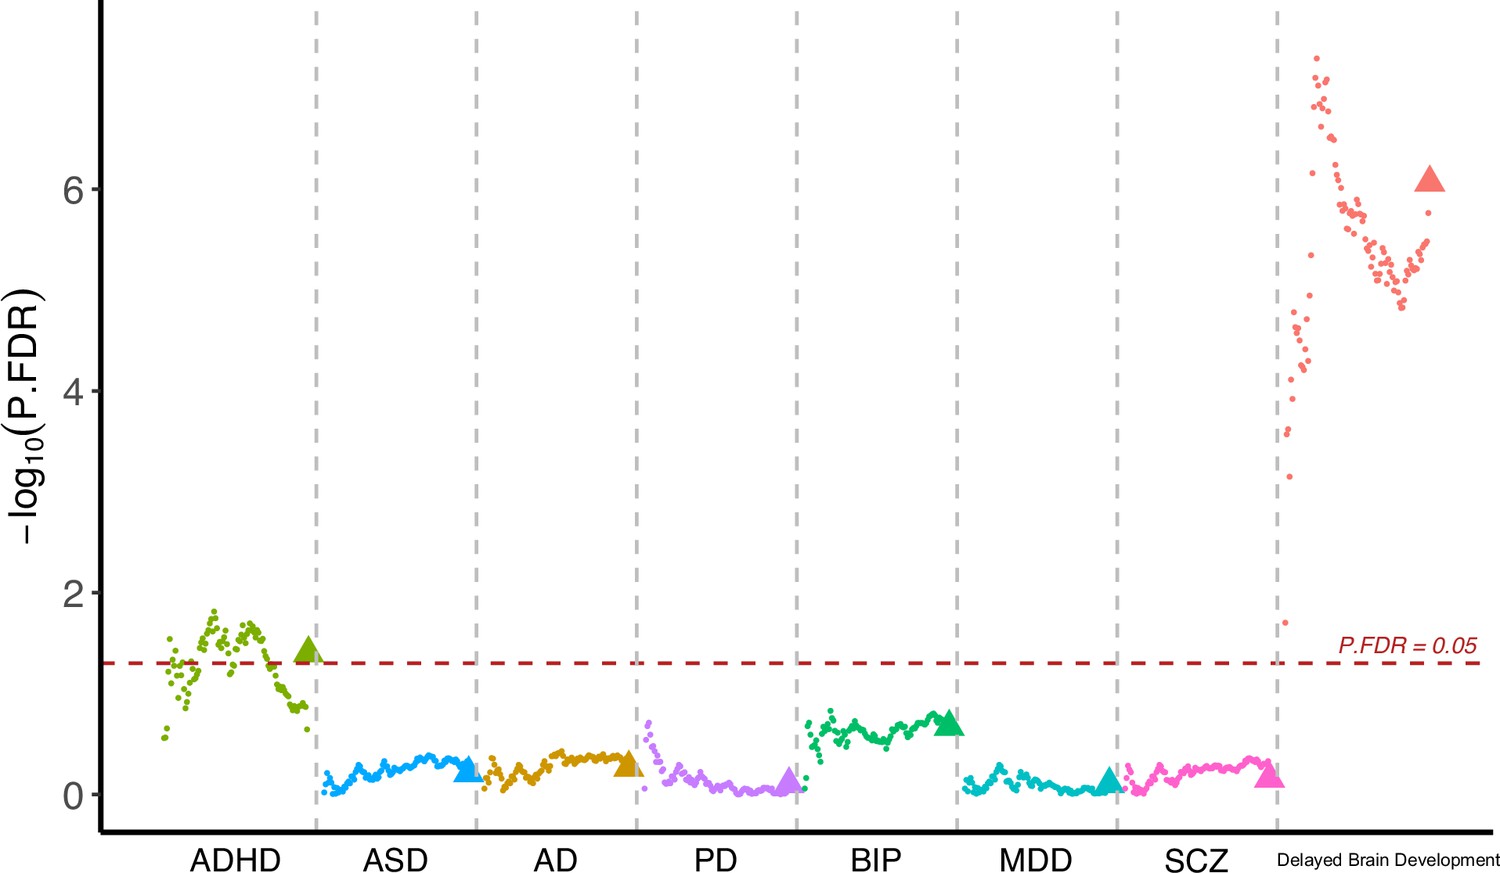
Participants with accelerated brain aging (brain aging pattern 2) had significantly increased genetic liability to ADHD and delayed brain development.
Polygenic risk score (PRS) for ADHD, ASD, AD, PD, BIP, MDD, SCZ and delayed brain development (unpublished GWAS) were calculated at different p-value thresholds from 0.005 to 0.5 at an interval of 0.005. Vertical axis represents negative logarithm of P values comparing PRS in brain aging pattern 2 relative to pattern 1. Red horizontal dashed line indicates FDR corrected p value of 0.05. Colors represent traits and dots within the same color represent different p value thresholds. The trigonometric symbol indicates the average PRS across all p-value thresholds for the same trait.
-
Figure 5—source data 1
Related to Figure 5.
Participants with accelerated brain aging (brain aging pattern 2) had significantly increased genetic liability to ADHD and delayed brain development.
- https://cdn.elifesciences.org/articles/94970/elife-94970-fig5-data1-v1.xlsx
Figure 6
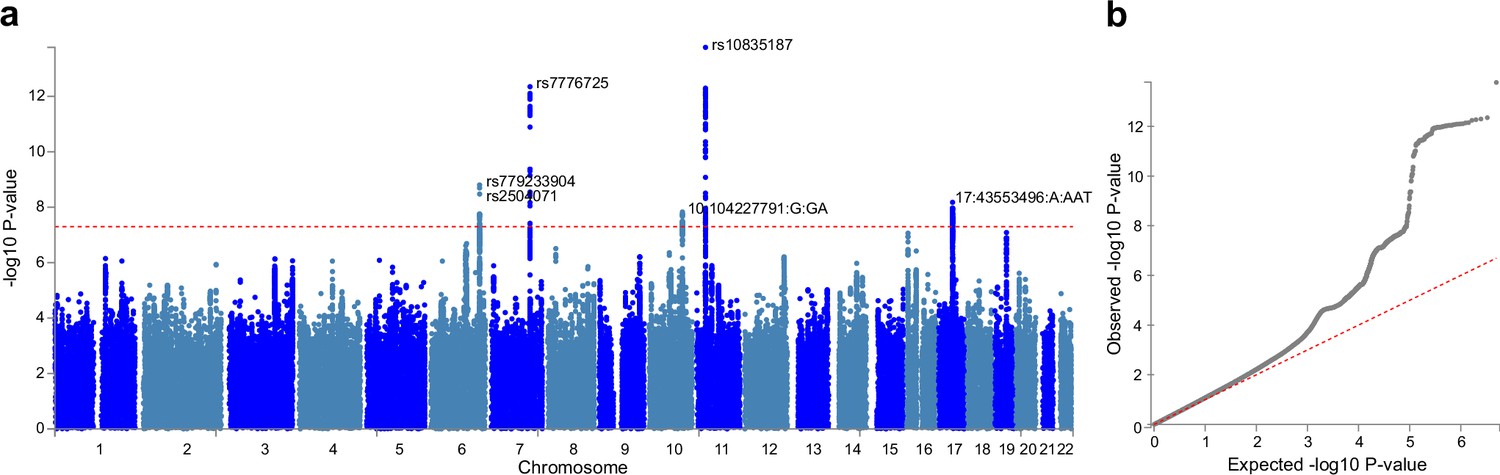
Genome-wide association study (GWAS) identified 6 independent SNPs associated with accelerated brain aging.
Total GMV at 60 years old was estimated for each participant using mixed effect models allowing for individualized baseline GMV and GMV change rate, and was used as the phenotype in the GWAS. (a) At genome-wide significance level (p=5×10⁻⁸, red dashed line), rs10835187 and rs7776725 loci were identified to be associated with accelerated brain aging. (b) Quantile–quantile plot showed that the most significant p values deviate from the null, suggesting that results are not unduly inflated.
Figure 7
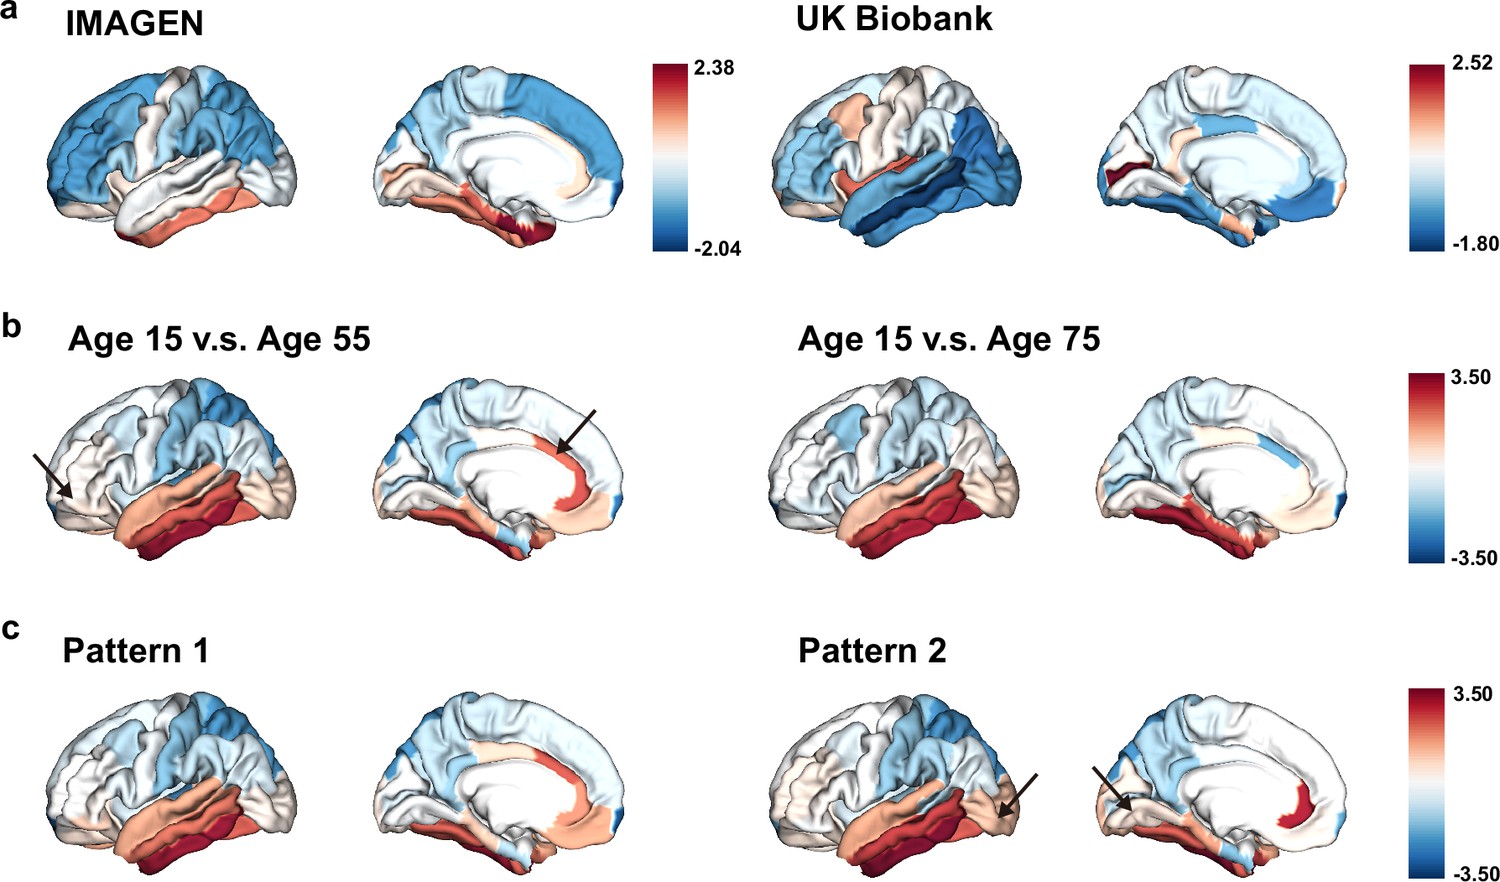
The ‘last in, first out’ mirroring patterns between brain development and brain aging.
(a) The annual percentage volume change (APC) was calculated for each ROI and standardized across the whole brain in adolescents (IMAGEN, left) and mid-to-late aged adults (UK Biobank, right), respectively. For adolescents, ROIs of in red indicate delayed structural brain development, while for mid-to-late aged adults, ROIs in blue indicate accelerated structural brain aging. (b) Estimated APC in brain development versus early aging (55 years old, left), and versus late aging (75 years old, right). ROIs in red indicate faster GMV decrease during brain aging and slower GMV decrease during brain development, that is stronger mirroring effects between brain development and brain aging. (c) Mirroring patterns between brain development and brain aging were more manifested in participants with accelerated aging (brain aging pattern 2). The arrows point to ROIs with more pronounced mirroring patterns in each subfigure.
-
Figure 7—source data 1
Related to Figure 7.
The ‘last in, first out’ mirroring patterns between brain development and brain aging.
- https://cdn.elifesciences.org/articles/94970/elife-94970-fig7-data1-v1.xlsx
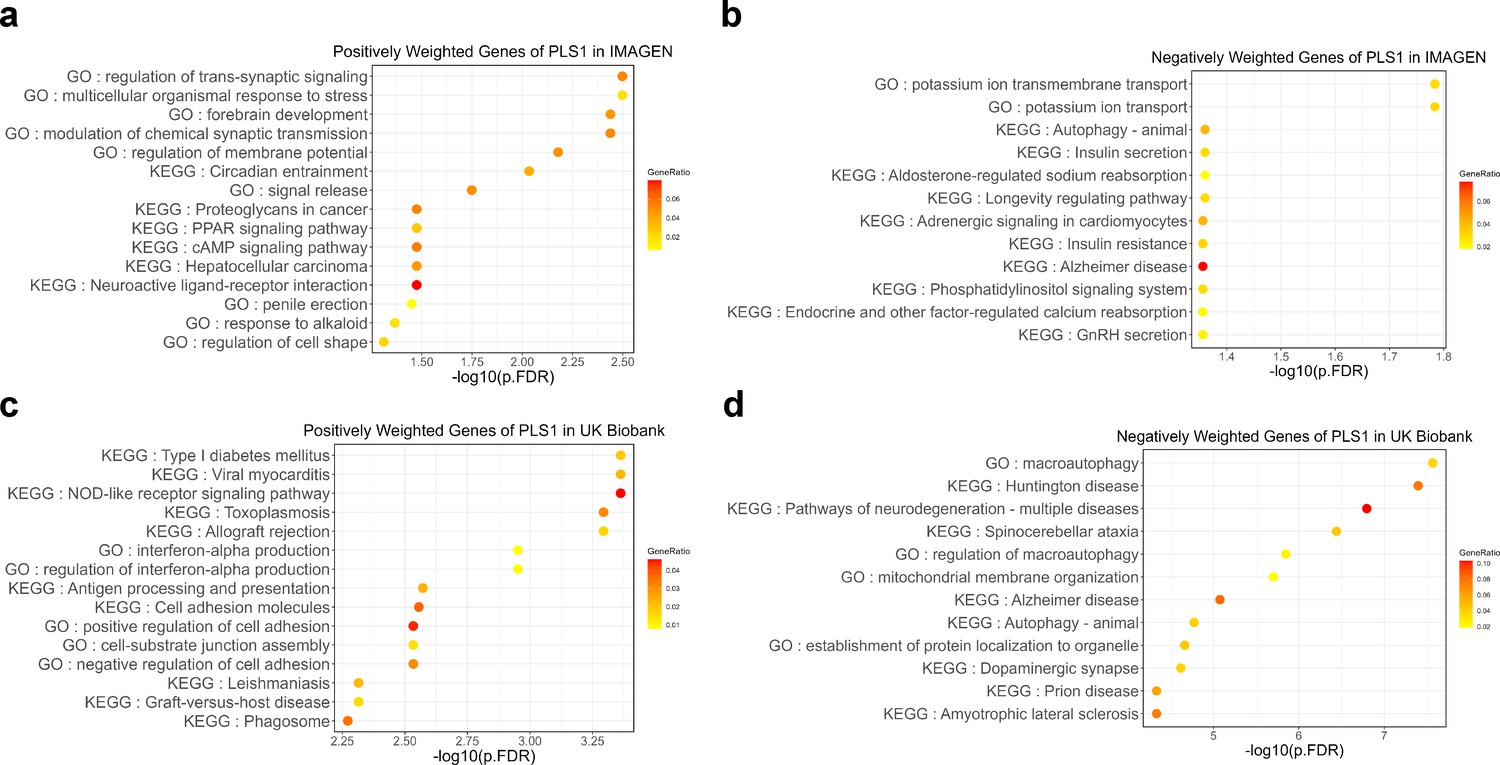
Figure 8
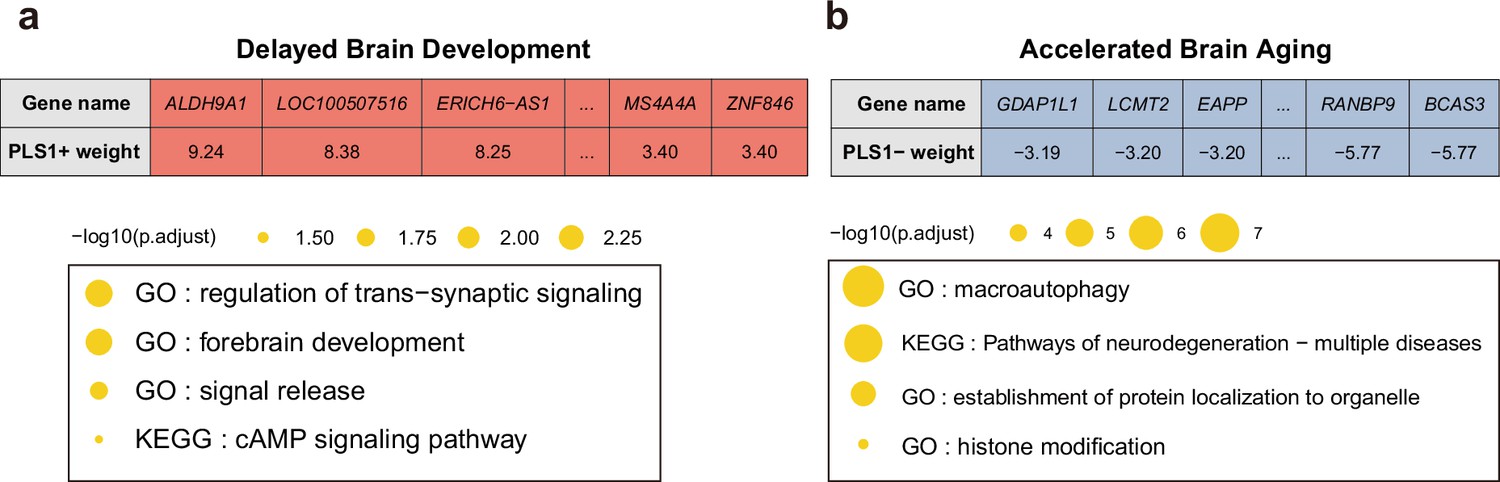
Functional enrichment of gene transcripts significantly associated with delayed brain development and accelerated brain aging.
(a) 990 genes were spatially correlated with the first PLS component of delayed structural brain development, and were enriched for trans-synaptic signal regulation, forebrain development, signal release and cAMP signaling pathway. (b) 2293 genes were spatially correlated the first PLS component of accelerated structural brain aging, and were enriched for macroautophagy, pathways of neurodegeneration, establishment of protein localization to organelle and histone modification. Size of the circle represents number of genes in each term and P values were corrected using FDR for multiple comparisons.
-
Figure 8—source data 1
Related to Figure 8.
Functional enrichment of gene transcripts significantly associated with delayed brain development and accelerated brain aging. Each gene’s contribution to the first PLS component for IMAGEN and UKB.
- https://cdn.elifesciences.org/articles/94970/elife-94970-fig8-data1-v1.xlsx
-
Figure 8—source data 2
Related to Figure 8.
Functional enrichment of gene transcripts significantly associated with delayed brain development and accelerated brain aging. Gene set enrichment for genes spatially positively correlated with the first PLS component in IMAGEN and negatively correlated with the first PLS component in UKB.
- https://cdn.elifesciences.org/articles/94970/elife-94970-fig8-data2-v1.xlsx
Appendix 1—figure 1
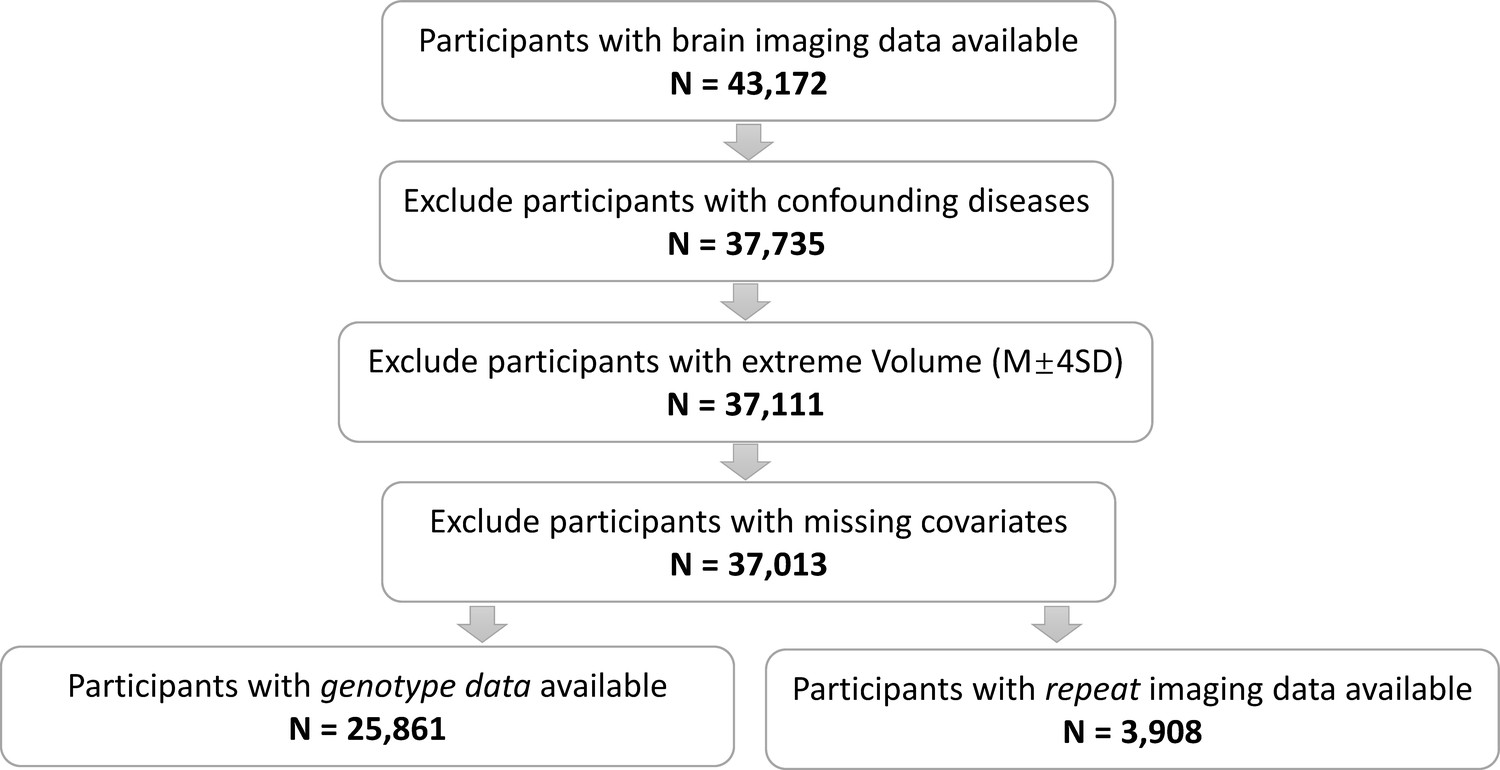
The sample selection workflow.
Appendix 1—figure 2
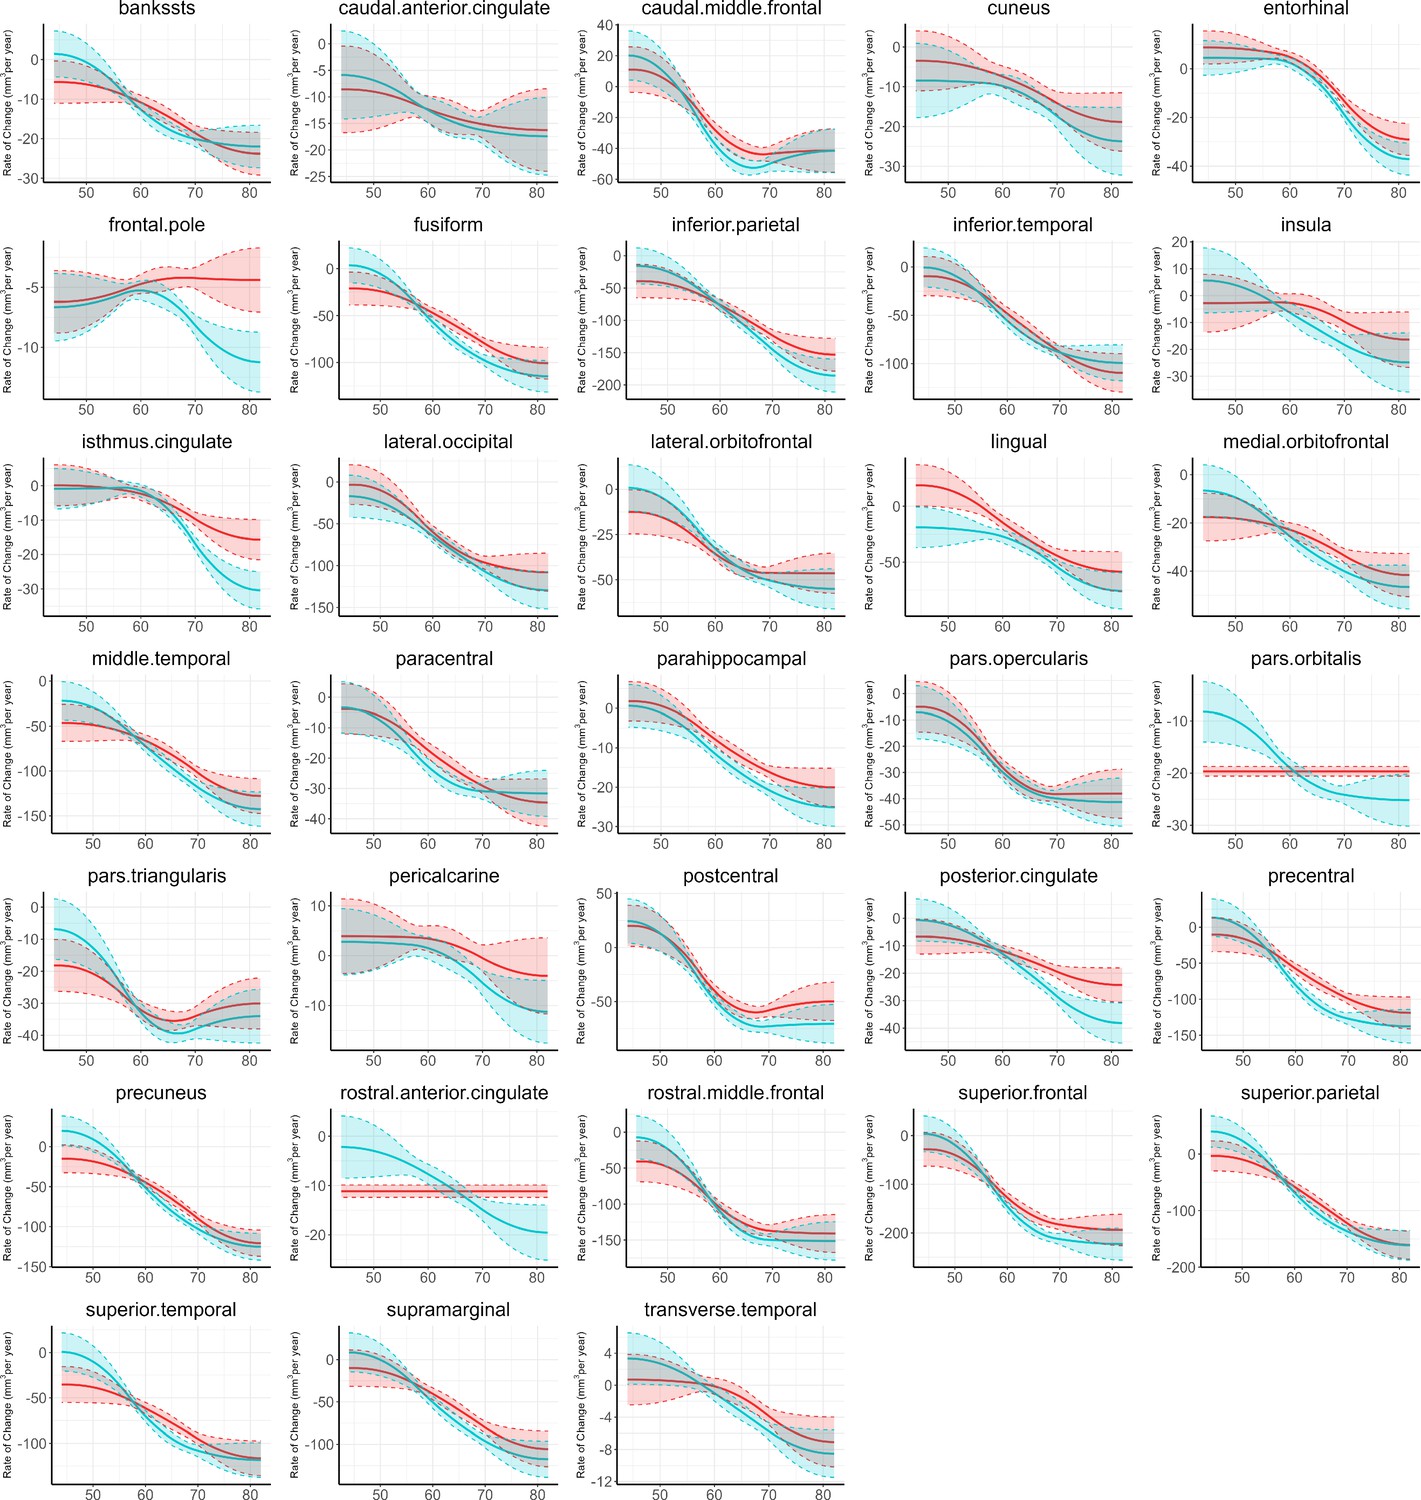
Estimated rates of change in regional volumes for 33 bilateral brain regions.
Appendix 1—figure 3
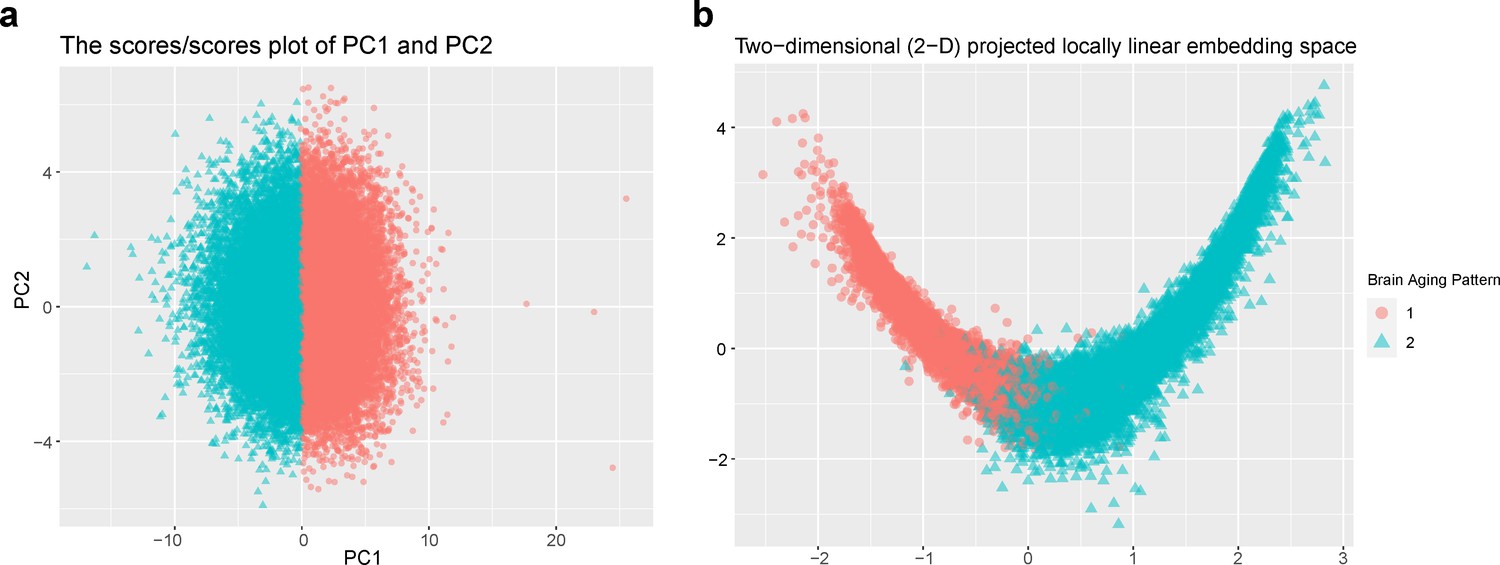
Stratification of the identified brain aging patterns using linear and non-linear dimensionality reduction methods.
Appendix 1—figure 4
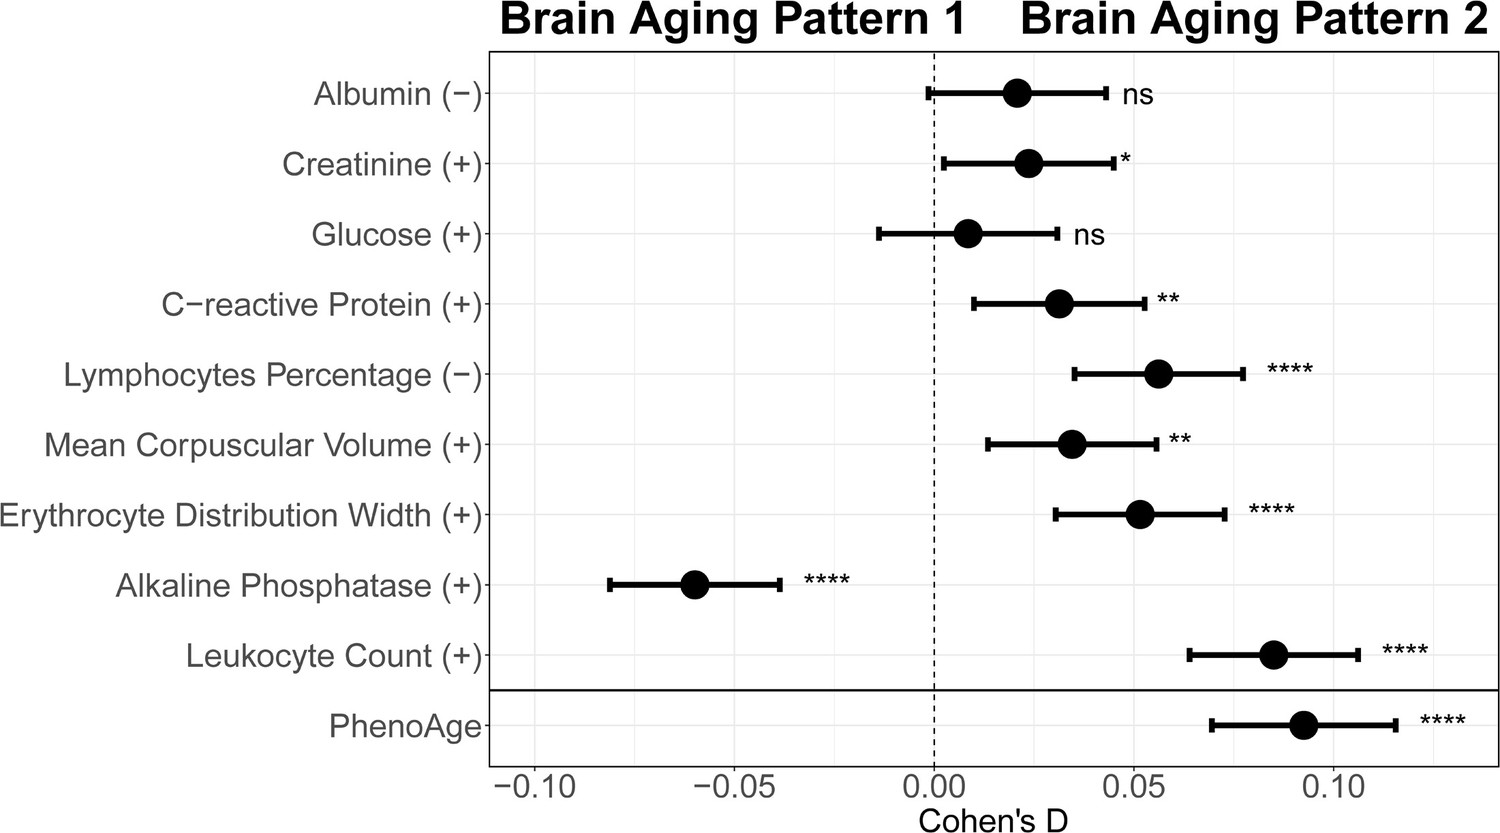
Effect size for comparing each individual blood biochemical metric (used to calculate the PhenoAge) between participants with brain aging patterns 1 and 2.
Appendix 1—figure 5
Gene set enrichment of Kyoto Encyclopedia of Genes and Genomes (KEGG) pathways and gene ontology (GO) of biological processes.
Appendix 1—figure 6
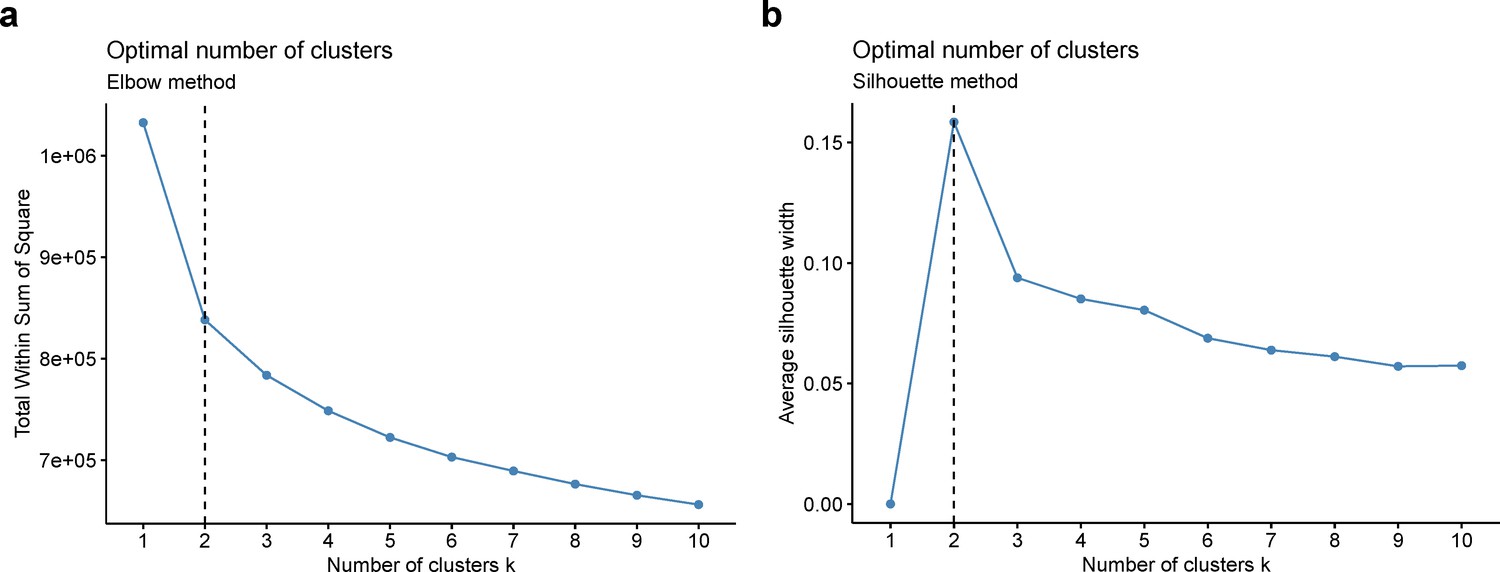
Optimal number of clusters was chosen using elbow method (a) and silhouette method (b).
Author response image 1
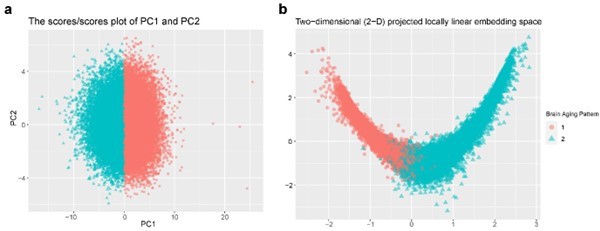
Stratification of the identified brain aging patterns using linear and non-linear dimensionality reduction methods.
(a) The principal component space of PC1 and PC2, and (b) two-dimensional projected locally linear embedding space derived from brain volumetric measures. Points have been colored and shaped according to grouping labels of the brain aging patterns.
Author response image 2

Total gray matter volume (TGMV) (a) and the estimated rate of change (b) for females (red) and males (blue).
Rates of volumetric change for total gray matter and each ROI were estimated using GAMM, which incorporates both cross-sectional between-subject variation and longitudinal withinsubject variation from 22,067 observations for 19,958 females, and 18,854 observations for 17,055 males. Covariates include assessment center, handedness, ethnic, and ICV. Shaded areas around the fit line denotes 95% CI.
Author response image 3

Distributions of biological aging biomarkers (leucocyte telomere length (LTL) and PhenoAge) among participants with brain aging patterns 1 and 2.
Author response image 4

The “last in, first out” mirroring patterns between brain development and brain aging.
Tables
Appendix 1—table 1
ICD-10 primary and secondary diagnostic codes for exclusion criteria.
| Condition | Code |
|---|---|
| Malignant neoplasm | C70, C71 |
| Dementia | F00, F01, F02, F03, F04 |
| Mental and behavioural disorders due to psychoactive substance use | F10-F19 |
| Schizophrenia, schizotypal and delusional disorders | F20-F29 |
| Mood [affective] disorders | F30-F39 |
| Mental retardation | F70-F79 |
| Disorders of psychological development | F80-F89 |
| Hyperkinetic disorders | F90 |
| Inflammatory diseases of the central nervous system | G00-G09 |
| Systemic atrophies primarily affecting the central nervous system | G10, G11, G122, G13 |
| Extrapyramidal and movement disorders | G20, G21, G22, G23 |
| Other degenerative diseases of the nervous system | G30-G32 |
| Demyelinating diseases of the central nervous system | G35-G37 |
| Episodic and paroxysmal disorders | G40, G41, G45, G46 |
| Infantile cerebral palsy | G80 |
| Cerebrovascular diseases | I60-I69 |
| Down’s syndrome | Q90 |
| Intracranial injury | S06 |
Appendix 1—table 2
Self-reported illness codes for exclusion criteria.
| Field ID | Condition | Code |
|---|---|---|
| 20001 | Brain cancer/primary malignant brain tumour | 1032 |
| Meningeal cancer/malignant meningioma | 1031 | |
| 20002 | Benign neuroma | 1683 |
| Brain abscess/intracranial abscess | 1245 | |
| Brain haemorrhage | 1491 | |
| Cerebral aneurysm | 1425 | |
| Cerebral palsy | 1433 | |
| Chronic/degenerative neurological problem | 1258 | |
| dementia/alzheimers/cognitive impairment | 1263 | |
| Encephalitis | 1246 | |
| Epilepsy | 1264 | |
| Fracture skull/head | 1626 | |
| Head injury | 1266 | |
| Ischaemic stroke | 1583 | |
| Meningioma/benign meningeal tumour | 1659 | |
| Meningitis | 1247 | |
| Motor Neurone Disease | 1259 | |
| Multiple Sclerosis | 1261 | |
| Nervous system infection | 1244 | |
| Neurological injury/trauma | 1240 | |
| Other demyelinating disease (not Multiple Sclerosis) | 1397 | |
| Other neurological problem | 1434 | |
| Parkinson’s Disease | 1262 | |
| Spina Bifida | 1524 | |
| Stroke | 1081 | |
| Subarachnoid haemorrhage | 1086 | |
| Subdural haemorrhage/haematoma | 1083 | |
| Transient ischaemic attack | 1082 |
Appendix 1—table 3
Cortical and subcortical brain regions.
| Desikan–Killiany Atlas |
|---|
| bankssts caudal anterior cingulate caudal middle frontal cuneus entorhinal fusiform inferior parietal inferior temporal isthmus cingulate lateral occipital lateral orbitofrontal lingual medial orbitofrontal middle temporal parahippocampal paracentral pars opercularis pars orbitalis pars triangularis pericalcarine postcentral posterior cingulate precentral precuneus rostral anterior cingulate rostral middle frontal superior frontal superior parietal superior temporal supramarginal frontal pole transverse temporal insula |
| ASEG Atlas |
| thalamus proper caudate putamen pallidum hippocampus amygdala accumbens area |
Appendix 1—table 4
Loadings matrix for the first 15 principal components.
| PC1 | PC2 | PC3 | PC4 | PC5 | PC6 | PC7 | PC8 | PC9 | PC10 | PC11 | PC12 | PC13 | PC14 | PC15 | |
|---|---|---|---|---|---|---|---|---|---|---|---|---|---|---|---|
| Cortical | |||||||||||||||
| bankssts | 0.12 | –0.25 | 0.01 | 0.30 | –0.13 | 0.01 | 0.09 | 0.34 | 0.04 | 0.05 | –0.10 | 0.16 | –0.09 | –0.20 | 0.02 |
| caudal.anterior.cingulate | 0.12 | –0.06 | –0.02 | 0.13 | 0.39 | 0.28 | 0.13 | –0.09 | –0.37 | 0.24 | 0.05 | 0.03 | –0.04 | –0.13 | 0.07 |
| caudal.middle.frontal | 0.15 | 0.01 | –0.10 | –0.11 | 0.34 | –0.21 | 0.10 | 0.06 | 0.03 | –0.28 | –0.23 | –0.20 | 0.24 | 0.00 | 0.25 |
| cuneus | 0.13 | 0.47 | –0.01 | 0.06 | –0.01 | 0.00 | 0.07 | 0.12 | 0.01 | 0.07 | 0.12 | –0.05 | –0.09 | 0.08 | –0.07 |
| entorhinal | 0.09 | 0.07 | 0.13 | 0.08 | 0.10 | 0.17 | –0.53 | –0.18 | 0.06 | 0.04 | –0.19 | –0.10 | 0.13 | 0.01 | –0.04 |
| fusiform | 0.18 | –0.03 | 0.01 | 0.13 | –0.02 | 0.02 | –0.20 | –0.02 | 0.15 | 0.30 | –0.01 | –0.28 | –0.23 | 0.08 | 0.21 |
| inferior.parietal | 0.15 | –0.18 | 0.01 | 0.39 | –0.09 | 0.01 | 0.14 | –0.04 | 0.16 | 0.05 | –0.20 | –0.02 | –0.15 | –0.02 | 0.02 |
| inferior.temporal | 0.16 | –0.13 | 0.01 | 0.26 | –0.01 | 0.15 | –0.04 | –0.10 | 0.14 | –0.08 | –0.08 | –0.25 | 0.20 | 0.29 | –0.01 |
| isthmus.cingulate | 0.15 | 0.23 | 0.02 | 0.11 | –0.14 | –0.03 | 0.08 | –0.03 | –0.23 | –0.07 | –0.22 | 0.16 | 0.43 | 0.04 | 0.11 |
| lateral.occipital | 0.16 | 0.30 | 0.00 | 0.12 | –0.02 | 0.02 | 0.05 | 0.10 | 0.16 | 0.18 | 0.06 | –0.23 | –0.23 | 0.12 | 0.17 |
| lateral.orbitofrontal | 0.22 | –0.04 | –0.08 | –0.17 | –0.05 | 0.15 | –0.02 | –0.15 | 0.09 | –0.02 | –0.01 | 0.40 | –0.01 | 0.22 | 0.17 |
| lingual | 0.12 | 0.43 | 0.03 | 0.14 | –0.01 | –0.02 | 0.07 | 0.11 | –0.01 | –0.03 | –0.10 | 0.16 | 0.02 | –0.09 | –0.08 |
| medial.orbitofrontal | 0.21 | –0.06 | –0.06 | –0.06 | –0.05 | 0.10 | –0.01 | –0.13 | 0.18 | –0.06 | 0.13 | 0.17 | 0.05 | 0.01 | –0.25 |
| middle.temporal | 0.17 | –0.17 | –0.01 | 0.27 | –0.14 | 0.10 | 0.21 | 0.25 | 0.09 | –0.15 | –0.09 | 0.04 | 0.07 | 0.05 | –0.11 |
| parahippocampal | 0.12 | 0.09 | 0.13 | 0.05 | 0.06 | 0.14 | –0.46 | 0.02 | –0.02 | 0.09 | –0.22 | 0.09 | 0.03 | –0.32 | 0.02 |
| paracentral | 0.19 | –0.05 | –0.10 | –0.07 | 0.18 | –0.23 | –0.11 | –0.06 | 0.01 | 0.03 | –0.02 | 0.06 | –0.35 | –0.01 | –0.35 |
| pars.opercularis | 0.16 | –0.02 | –0.06 | –0.23 | –0.19 | 0.10 | 0.14 | 0.01 | –0.16 | –0.13 | –0.43 | –0.29 | –0.16 | –0.06 | 0.00 |
| pars.orbitalis | 0.18 | 0.02 | –0.05 | –0.17 | –0.11 | 0.24 | 0.03 | –0.17 | 0.23 | 0.08 | 0.01 | 0.41 | –0.14 | 0.05 | 0.24 |
| pars.triangularis | 0.16 | 0.02 | –0.03 | –0.35 | –0.26 | 0.23 | 0.13 | –0.05 | –0.06 | –0.06 | –0.25 | –0.17 | –0.21 | –0.08 | –0.05 |
| pericalcarine | 0.10 | 0.47 | –0.01 | 0.08 | –0.01 | 0.01 | 0.09 | 0.13 | –0.02 | –0.01 | 0.02 | 0.08 | –0.03 | 0.03 | –0.17 |
| postcentral | 0.20 | –0.04 | –0.11 | 0.06 | 0.16 | –0.29 | –0.09 | 0.12 | 0.08 | 0.03 | –0.09 | 0.10 | 0.04 | 0.01 | 0.04 |
| posterior.cingulate | 0.18 | –0.08 | –0.04 | 0.02 | 0.24 | 0.09 | 0.08 | –0.02 | –0.30 | 0.01 | –0.07 | 0.10 | –0.05 | –0.12 | –0.31 |
| precentral | 0.21 | –0.01 | –0.10 | –0.08 | 0.28 | –0.29 | –0.09 | 0.08 | 0.15 | –0.05 | –0.15 | 0.13 | –0.06 | 0.05 | 0.12 |
| precuneus | 0.20 | 0.02 | –0.02 | 0.13 | –0.24 | –0.26 | 0.01 | –0.35 | –0.20 | –0.04 | 0.06 | –0.04 | 0.00 | 0.03 | 0.07 |
| rostral.anterior.cingulate | 0.15 | –0.07 | –0.07 | 0.05 | 0.31 | 0.21 | 0.15 | –0.05 | –0.30 | 0.13 | 0.11 | –0.06 | 0.00 | 0.18 | 0.15 |
| rostral.middle.frontal | 0.20 | 0.02 | –0.05 | –0.05 | 0.10 | 0.14 | 0.22 | –0.11 | 0.17 | –0.11 | 0.24 | –0.14 | 0.19 | –0.22 | 0.14 |
| superior.frontal | 0.22 | –0.03 | –0.09 | –0.21 | 0.14 | –0.13 | –0.01 | 0.06 | 0.20 | –0.18 | 0.06 | –0.11 | 0.02 | 0.00 | –0.16 |
| superior.parietal | 0.17 | 0.02 | –0.05 | 0.14 | –0.18 | –0.29 | 0.01 | –0.45 | –0.16 | 0.00 | 0.14 | –0.08 | –0.08 | –0.06 | 0.04 |
| superior.temporal | 0.21 | –0.13 | –0.02 | –0.06 | –0.10 | 0.01 | –0.07 | 0.40 | –0.07 | 0.13 | 0.24 | –0.05 | 0.02 | –0.06 | 0.08 |
| supramarginal | 0.17 | –0.15 | –0.08 | 0.06 | –0.24 | –0.23 | –0.13 | 0.03 | –0.21 | 0.04 | 0.11 | 0.10 | 0.14 | –0.08 | –0.06 |
| frontal.pole | 0.16 | 0.03 | –0.10 | 0.01 | 0.00 | 0.16 | 0.03 | –0.13 | 0.28 | 0.05 | 0.28 | –0.16 | 0.26 | –0.38 | –0.22 |
| transverse.temporal | 0.15 | –0.01 | –0.10 | –0.27 | –0.17 | –0.10 | –0.16 | 0.25 | –0.22 | 0.19 | 0.24 | –0.10 | 0.09 | 0.04 | 0.16 |
| insula | 0.19 | –0.08 | 0.01 | –0.22 | –0.12 | 0.10 | –0.07 | 0.11 | –0.06 | 0.15 | –0.08 | 0.00 | 0.19 | 0.16 | –0.23 |
| Subcortical | |||||||||||||||
| thalamus.proper | 0.09 | –0.02 | 0.31 | –0.08 | 0.03 | –0.08 | 0.08 | 0.00 | 0.02 | –0.21 | 0.11 | 0.10 | –0.19 | –0.37 | 0.33 |
| caudate | 0.06 | –0.03 | 0.32 | –0.12 | 0.02 | –0.10 | 0.15 | –0.02 | 0.11 | 0.31 | –0.11 | 0.09 | 0.27 | 0.14 | 0.12 |
| putamen | 0.08 | –0.03 | 0.42 | –0.12 | 0.03 | –0.13 | 0.13 | –0.03 | 0.05 | 0.22 | –0.05 | –0.14 | 0.07 | –0.02 | –0.17 |
| pallidum | 0.03 | –0.03 | 0.42 | –0.07 | 0.00 | –0.13 | 0.16 | –0.06 | 0.04 | 0.20 | –0.07 | 0.00 | 0.04 | –0.20 | –0.06 |
| hippocampus | 0.12 | 0.01 | 0.33 | 0.04 | –0.02 | 0.11 | –0.20 | 0.08 | –0.16 | –0.39 | 0.09 | 0.03 | –0.11 | –0.03 | 0.05 |
| amygdala | 0.13 | –0.03 | 0.31 | 0.05 | –0.01 | 0.12 | –0.13 | 0.09 | –0.07 | –0.35 | 0.25 | –0.09 | –0.02 | 0.24 | –0.01 |
| accumbens.area | 0.11 | –0.05 | 0.31 | –0.02 | 0.12 | –0.07 | 0.11 | –0.04 | 0.00 | –0.03 | 0.10 | 0.09 | –0.14 | 0.34 | –0.18 |
Appendix 1—table 5
Baseline and demographic characteristics for participants in the total population and stratified by brain aging patterns.
| Total (n=37,013) | Pattern 1 (n=18,929)Pattern 2 (n=18,084) | ||
|---|---|---|---|
| Age (years), mean (SD) | 63.9 (7.63) | 63.9 (7.64) | 63.8 (7.63) |
| Female, n (%) | 19,958 (53.9) | 10,117 (53.4) | 9,841 (54.4) |
| Ethnicity, n (%) | |||
| White | 34,219 (92.5) | 17,509 (92.5) | 16,710 (92.4) |
| Mixed | 1,137 (3.1) | 573 (3.0) | 564 (3.1) |
| Asian or Asian British | 1,210 (3.3) | 612 (3.2) | 598 (3.3) |
| Other | 447 (1.2) | 235 (1.2) | 212 (1.2) |
| Smoking status, n (%)* | |||
| Never smoker | 23,633 (64.4) | 12,269 (65.4) | 11,364 (63.4) |
| Previous smoker | 12,213 (33.3) | 6,085 (32.4) | 6,128 (34.2) |
| Current smoker | 833 (2.3) | 414 (2.2) | 419 (2.3) |
| TDI, mean (SD)† | –1.94 (2.69) | –1.97 (2.66) | –1.90 (2.71) |
| BMI (kg/m2), mean (SD)‡ | 26.4 (4.32) | 26.3 (4.17) | 26.5 (4.46) |
| Years of Schooling, mean (SD)§ | 16.8 (4.32) | 16.9 (4.29) | 16.8 (4,35) |
-
TDI = Townsend Deprivation Index, BMI = Body Mass Index.
-
*
Missing 334
-
†
Missing 36
-
‡
Missing 1937
-
§
Missing 337
Appendix 1—table 6
Associations between results of biological aging biomarkers and subgroups stratified by whole-brain TGMV trajectories.
Cohen’s d measures the standardized difference of means between brain aging pattern 2 and brain aging pattern 1.
| Biological aging biomarkers | Brain aging pattern 1 | Brain aging pattern 2 | ||||
|---|---|---|---|---|---|---|
| N | Mean(SD) | N | Mean(SD) | |||
| LTL | 17,691 | 0.083 (0.98) | 16,876 | 0.055 (0.97) | ||
| PhenoAge | 15,228 | 41.35 (8.17) | 14,323 | 41.58 (8.32) | ||
| Biological aging biomarkers | Unadjusted | Adjusted | ||||
| Cohen’s d (95% CI) | p | P.Bonferroni | Cohen’s d (95% CI) | p | P.Bonferroni | |
| LTL | –0.028 (-0.049,–0.007) | 0.009 | 0 | –0.030 (-0.051,–0.009) | 0.006 | 0.011 |
| PhenoAge | 0.027 (0.004, 0.050) | 0.019 | 0 | 0.092 (0.070, 0.116) | 3.05E-15 | 6.11E-15 |
Appendix 1—table 7
Associations between results of cognitive function tests and subgroups stratified by whole-brain TGMV trajectories.
Cohen’s d measures the standardized difference of means between brain aging pattern 2 and brain aging pattern 1.
| Cognitive functions | Brain aging pattern 1 | Brain aging pattern 2 | ||||
|---|---|---|---|---|---|---|
| N | Mean(SD) | N | Mean(SD) | |||
| Reaction time | 17,749 | –594.70 (108.15) | 16,831 | –594.68 (110.50) | ||
| Numeric memory | 13,350 | 6.82 (1.26) | 12,346 | 6.72 (1.27) | ||
| Fluid intelligence | 17,580 | 6.73 (2.06) | 16,612 | 6.53 (2.04) | ||
| Trail making A | 13,052 | –224.50 (84.82) | 12,036 | –227.56 (84.85) | ||
| Trail making B | 12,743 | –563.06 (246.74) | 11,753 | –576.55 (260.75) | ||
| Matrix pattern completion | 13,064 | 8.07 (2.11) | 12,064 | 7.91 (2.14) | ||
| Symbol digit substitution | 13,077 | 19.08 (5.15) | 12,056 | 18.87 (5.35) | ||
| Tower rearranging | 12,952 | 9.96 (3.20) | 11,958 | 9.83 (3.23) | ||
| Paired associate learning | 13,184 | 7.01 (2.59) | 12,198 | 6.88 (2.65) | ||
| Prospective memory | 17,831 | N/A | 16,949 | N/A | ||
| Pairs matching | 17,840 | –3.58 (2.90) | 16,956 | –3.67 (2.94) | ||
| Cognitive functions | Unadjusted | Adjusted | ||||
| Cohen’s d (95% CI) | P | P.FDR | Cohen’s d (95% CI) | P | P.FDR | |
| Reaction time | 0.000 (-0.021, 0.021) | 0.99 | 0.99 | 0.006 (-0.016, 0.028) | 0.61 | 0.61 |
| Numeric memory | –0.082 (-0.106,–0.057) | 5.97E-11 | 3.28E-10 | –0.080 (-0.106,–0.055) | 8.99E-10 | 4.95E-09 |
| Fluid intelligence | –0.102 (-0.123,–0.080) | 5.94E-21 | 6.54E-20 | –0.99 (-0.121,–0.077) | 3.30E-18 | 3.63E-17 |
| Trail making A | –0.036 (-0.061,–0.011) | 0.004 | 0.006 | –0.050 (-0.074,–0.024) | 1.46E-04 | 2.29E-04 |
| Trail making B | –0.053 (-0.078,–0.028) | 3.16E-05 | 8.68E-05 | –0.067 (-0.093,–0.041) | 6.16E-07 | 1.69E-06 |
| Matrix pattern completion | –0.076 (-0.101,–0.051) | 1.84E-09 | 6.74E-09 | –0.078 (-0.104,–0.052) | 3.67E-09 | 1.35E-08 |
| Symbol digit substitution | –0.040 (-0.065,–0.015) | 0.002 | 0.002 | –0.053 (-0.079,–0.027) | 6.15E-05 | 1.13E-04 |
| Tower rearranging | –0.041 (-0.066,–0.016) | 0.001 | 0.002 | –0.049 (-0.075,–0.023) | 2.18E-04 | 3.00E-04 |
| Paired associate learning | –0.051 (-0.076,–0.027) | 4.64E-05 | 1.02E-04 | –0.054 (-0.079,–0.028) | 4.89E-05 | 1.08E-04 |
| Prospective memory | OR: 0.943 (0.891, 0.999) | 0.047 | 0.052 | OR: 0.940 (0.883, 1.000) | 0.052 | 0.057 |
| Pairs matching | –0.029 (-0.050,–0.008) | 0.006 | 0.008 | –0.033 (-0.055,–0.011) | 0.003 | 0.004 |
Appendix 1—table 8
Genome-wide association study details.
Loci associated with risk were thresholded at p<5×10⁻⁸, then distance-based clumping was used to define independently significant loci.
Appendix 1—table 9
Polygenic Risk Scores comparisons between two subgroups.
Data supporting these scores were obtained either entirely from external GWAS data (the Standard PRS set). The bold P values reflect significance after FDR correction.
| Trait | n1 | n2 | statistic | p | p.adjust |
|---|---|---|---|---|---|
| AAM | 18,429 | 17,586 | –2.218 | 0.027 | 0.080 |
| AMD | 18,429 | 17,586 | 1.753 | 0.080 | 0.169 |
| AD | 18,429 | 17,586 | 0.735 | 0.462 | 0.616 |
| AST | 18,429 | 17,586 | –0.861 | 0.389 | 0.543 |
| AF | 18,429 | 17,586 | –0.100 | 0.920 | 0.945 |
| BD | 18,429 | 17,586 | 3.557 | 3.75E-04 | 0.002 |
| BMI | 18,429 | 17,586 | –3.309 | 0.001 | 0.005 |
| CRC | 18,429 | 17,586 | –0.544 | 0.586 | 0.703 |
| BC | 18,429 | 17,586 | –3.140 | 0.002 | 0.008 |
| CVD | 18,429 | 17,586 | –2.104 | 0.035 | 0.091 |
| CED | 18,429 | 17,586 | 1.046 | 0.296 | 0.484 |
| CAD | 18,429 | 17,586 | –1.588 | 0.112 | 0.202 |
| CD | 18,429 | 17,586 | –0.094 | 0.925 | 0.945 |
| EOC | 18,429 | 17,586 | –2.183 | 0.029 | 0.080 |
| EBMDT | 18,429 | 17,586 | –11.343 | <1.00E-20 | <1.00E-20 |
| HBA1C_DF | 18,429 | 17,586 | –2.948 | 0.003 | 0.013 |
| HEIGHT | 18,429 | 17,586 | 6.658 | 2.81E-11 | 3.37E-10 |
| HDL | 18,429 | 17,586 | 0.884 | 0.377 | 0.543 |
| HT | 18,429 | 17,586 | –3.539 | 4.02E-04 | 0.002 |
| IOP | 18,429 | 17,586 | –1.605 | 0.109 | 0.202 |
| ISS | 18,429 | 17,586 | –2.383 | 0.017 | 0.056 |
| LDL_SF | 18,429 | 17,586 | –0.686 | 0.492 | 0.627 |
| MEL | 18,429 | 17,586 | 2.025 | 0.043 | 0.103 |
| MS | 18,429 | 17,586 | –0.069 | 0.945 | 0.945 |
| OP | 18,429 | 17,586 | 12.029 | <1.00E-20 | <1.00E-20 |
| PD | 18,429 | 17,586 | 1.456 | 0.145 | 0.249 |
| POAG | 18,429 | 17,586 | –0.856 | 0.392 | 0.543 |
| PC | 18,429 | 17,586 | –0.240 | 0.810 | 0.941 |
| PSO | 18,429 | 17,586 | –1.781 | 0.075 | 0.169 |
| RA | 18,429 | 17,586 | –2.437 | 0.015 | 0.053 |
| SCZ | 18,429 | 17,586 | 0.158 | 0.874 | 0.945 |
| SLE | 18,429 | 17,586 | 1.695 | 0.090 | 0.180 |
| T1D | 18,429 | 17,586 | 0.666 | 0.505 | 0.627 |
| T2D | 18,429 | 17,586 | –5.523 | 3.35E-08 | 3.02E-07 |
| UC | 18,429 | 17,586 | 0.883 | 0.377 | 0.543 |
| VTE | 18,429 | 17,586 | –0.170 | 0.865 | 0.945 |
Appendix 1—table 10
Polygenic Risk Scores comparisons between two subgroups.
Data supporting these scores were obtained external and internal UK Biobank data (the Enhanced PRS set). The bold p values reflect significance after FDR correction.
| Trait | n1 | n2 | statistic | p | p.adjust |
|---|---|---|---|---|---|
| AAM | 3,407 | 3,409 | –1.708 | 0.088 | 0.344 |
| AMD | 3,407 | 3,409 | 0.547 | 0.584 | 0.931 |
| AD | 3,407 | 3,409 | 0.756 | 0.450 | 0.820 |
| APOEA | 3,407 | 3,409 | 0.023 | 0.982 | 0.993 |
| APOEB | 3,407 | 3,409 | 0.119 | 0.905 | 0.968 |
| AST | 3,407 | 3,409 | 0.112 | 0.911 | 0.968 |
| AF | 3,407 | 3,409 | 1.306 | 0.192 | 0.600 |
| BD | 3,407 | 3,409 | 0.561 | 0.575 | 0.931 |
| BMI | 3,407 | 3,409 | –0.976 | 0.329 | 0.730 |
| CRC | 3,407 | 3,409 | 0.984 | 0.325 | 0.730 |
| BC | 3,407 | 3,409 | –0.995 | 0.320 | 0.730 |
| CAL | 3,407 | 3,409 | –1.786 | 0.074 | 0.326 |
| CVD | 3,407 | 3,409 | –0.009 | 0.993 | 0.993 |
| CED | 3,407 | 3,409 | 1.280 | 0.200 | 0.600 |
| CAD | 3,407 | 3,409 | 0.231 | 0.818 | 0.961 |
| DOA | 3,407 | 3,409 | –0.326 | 0.745 | 0.961 |
| EOC | 3,407 | 3,409 | –2.167 | 0.030 | 0.155 |
| EBMDT | 3,407 | 3,409 | –6.111 | 1.04E-09 | 2.65E-08 |
| EGCR | 3,407 | 3,409 | 0.413 | 0.680 | 0.961 |
| EGCY | 3,407 | 3,409 | –0.210 | 0.834 | 0.961 |
| HBA1C_DF | 3,407 | 3,409 | 0.130 | 0.896 | 0.968 |
| HEIGHT | 3,407 | 3,409 | 4.351 | 1.38E-05 | 2.35E-04 |
| HDL | 3,407 | 3,409 | 0.294 | 0.769 | 0.961 |
| HT | 3,407 | 3,409 | –0.884 | 0.377 | 0.743 |
| IOP | 3,407 | 3,409 | –2.366 | 0.018 | 0.151 |
| ISS | 3,407 | 3,409 | 0.066 | 0.947 | 0.986 |
| LDL_SF | 3,407 | 3,409 | –0.193 | 0.847 | 0.961 |
| MEL | 3,407 | 3,409 | 2.659 | 0.008 | 0.080 |
| MS | 3,407 | 3,409 | –2.293 | 0.022 | 0.151 |
| OTFA | 3,407 | 3,409 | 0.318 | 0.750 | 0.961 |
| OSFA | 3,407 | 3,409 | 0.770 | 0.441 | 0.820 |
| OP | 3,407 | 3,409 | 6.484 | 9.54E-11 | 4.87E-09 |
| PD | 3,407 | 3,409 | 1.041 | 0.298 | 0.730 |
| PDCL | 3,407 | 3,409 | 0.663 | 0.507 | 0.862 |
| PHG | 3,407 | 3,409 | 0.392 | 0.695 | 0.961 |
| PFA | 3,407 | 3,409 | 0.495 | 0.621 | 0.932 |
| POAG | 3,407 | 3,409 | –1.083 | 0.279 | 0.730 |
| PC | 3,407 | 3,409 | 0.675 | 0.500 | 0.862 |
| PSO | 3,407 | 3,409 | –2.234 | 0.026 | 0.151 |
| RMNC | 3,407 | 3,409 | 0.501 | 0.617 | 0.932 |
| RHR | 3,407 | 3,409 | –2.865 | 0.004 | 0.053 |
| RA | 3,407 | 3,409 | 0.297 | 0.766 | 0.961 |
| SCZ | 3,407 | 3,409 | –0.880 | 0.379 | 0.743 |
| SGM | 3,407 | 3,409 | –0.224 | 0.823 | 0.961 |
| SLE | 3,407 | 3,409 | 1.458 | 0.145 | 0.493 |
| TCH | 3,407 | 3,409 | 0.191 | 0.848 | 0.961 |
| TFA | 3,407 | 3,409 | 0.892 | 0.372 | 0.743 |
| TTG | 3,407 | 3,409 | 1.212 | 0.226 | 0.640 |
| T1D | 3,407 | 3,409 | 1.771 | 0.077 | 0.326 |
| T2D | 3,407 | 3,409 | –2.218 | 0.027 | 0.151 |
| VTE | 3,407 | 3,409 | –1.613 | 0.107 | 0.390 |
Appendix 1—table 11
Most significant single-variant associations (p < 510-8) detected in the GWAS analyses.
Six independent SNPs at genome-wide significance level were identified by linkage disequilibrium (LD) clumping (r2 < 0.1 within a 250 kb window). The location (chromosome [chr] and base position [bp]), alleles (A1 = effect allele and A2 = other allele), effect (β) and its standard error (β SE) with respect to A1, and association p-values from regression model of the variants are given, along with functional consequences of SNPs on gene by performing ANNOVAR.
| SNP | A1 | A2 | p-value | β | β SE | Location (chr:bp) | Gene symbol | Position relative to gene |
|---|---|---|---|---|---|---|---|---|
| rs10835187 | C | T | 1.70e-14 | –0.02558 | 0.003333 | 11:27505677 | LGR4, LIN7C | intergenic |
| rs7776725 | C | T | 4.47e-13 | –0.02640 | 0.003644 | 7:121033121 | FAM3C | intronic |
| rs779233904 | AAC | A | 1.57e-09 | 0.02083 | 0.003449 | 6:151910404 | CCDC170 | intronic |
| rs2504071 | T | C | 3.34e-09 | 0.01959 | 0.003311 | 6:152084862 | ESR1 | intronic |
| 17:43553496:A:AAT | A | AAT | 6.65e-09 | –0.02472 | 0.004261 | 17:43553496 | PLEKHM1 | intronic |
| 10:104227791:G:GA | GA | G | 1.48e-08 | –0.01889 | 0.003334 | 10:104227791 | TMEM180 | intronic |
Appendix 1—table 12
Association between gene expression profiles of mapped genes and estimated APC during brain development.
The bold p values reflect significance after the spatial permutation test.
| Gene Symbol | Spearman's ρ | p value | P.permutation |
|---|---|---|---|
| ACTR1A | 0.096 | 0.440 | 0.328 |
| ARHGAP27 | 0.051 | 0.684 | 0.445 |
| ARL17B | 0.047 | 0.705 | 0.452 |
| BDNF-AS | 0.256 | 0.038 | 0.038 |
| CCDC170 | 0.268 | 0.030 | 0.069 |
| ESR1 | 0.021 | 0.870 | 0.483 |
| FAM3C | –0.096 | 0.444 | 0.356 |
| KANSL1 | –0.262 | 0.034 | 0.073 |
| KANSL1-AS1 | 0.067 | 0.594 | 0.313 |
| LGR4 | 0.558 | 1.78E-06 | 2.50E-04 |
| LIN7C | 0.036 | 0.775 | 0.464 |
| LRRC37A4P | –0.272 | 0.027 | 0.148 |
| MAPT | 0.024 | 0.846 | 0.405 |
| PLEKHM1 | –0.276 | 0.025 | 0.109 |
| SPPL2C | 0.116 | 0.351 | 0.189 |
| STH | –0.147 | 0.238 | 0.277 |
| SUFU | 0.407 | 0.001 | 0.028 |
Appendix 1—table 13
Association between gene expression profiles of mapped genes and estimated APC during brain aging.
The bold p values reflect significance after the spatial permutation test.
| Gene Symbol | Spearman's ρ | Pvalue | P.permutation |
|---|---|---|---|
| ACTR1A | –0.235 | 0.058 | 0.052 |
| ARHGAP27 | 0.486 | 4.48E-05 | 5.50E-04 |
| ARL17B | 0.090 | 0.473 | 0.240 |
| BDNF-AS | 0.490 | 3.68E-05 | 1.50E-04 |
| CCDC170 | 0.206 | 0.098 | 0.075 |
| ESR1 | 0.532 | 6.02E-06 | 1.50E-04 |
| FAM3C | –0.366 | 0.003 | 0.005 |
| KANSL1 | 0.213 | 0.086 | 0.078 |
| KANSL1-AS1 | –0.262 | 0.034 | 0.059 |
| LGR4 | 0.070 | 0.576 | 0.348 |
| LIN7C | 0.177 | 0.154 | 0.120 |
| LRRC37A4P | 0.143 | 0.250 | 0.165 |
| MAPT | –0.287 | 0.020 | 0.022 |
| PLEKHM1 | 0.202 | 0.104 | 0.080 |
| SPPL2C | 0.211 | 0.089 | 0.059 |
| STH | –0.001 | 0.997 | 0.490 |
| SUFU | –0.036 | 0.773 | 0.373 |
Appendix 1—table 14
Model evaluation results using relative measures: AIC, BIC, likelihood ratio test and intra-class correlation (ICC).
| model | AIC | BIC | lrtest | ICC_adjusted | ICC_unadjusted |
|---|---|---|---|---|---|
| lmer_intr_thalamus.proper | 79444.24 | 79591.29 | 6.45E-15 | 0.8875 | 0.3958 |
| lmer_slope_thalamus.proper | 79382.89 | 79547.24 | 6.45E-15 | 0.8889 | 0.3986 |
| lmer_intr_caudate | 95845.48 | 95992.54 | 2.68E-71 | 0.9543 | 0.6824 |
| lmer_slope_caudate | 95524.49 | 95688.84 | 2.68E-71 | 0.9564 | 0.6817 |
| lmer_intr_putamen | 92106.06 | 92253.12 | 2.40E-42 | 0.9398 | 0.5946 |
| lmer_slope_putamen | 91918.4 | 92082.75 | 2.40E-42 | 0.9424 | 0.5933 |
| lmer_intr_pallidum | 90500.3 | 90647.36 | 4.21E-42 | 0.8859 | 0.5116 |
| lmer_slope_pallidum | 90313.76 | 90478.12 | 4.21E-42 | 0.8862 | 0.5093 |
| lmer_intr_hippocampus | 89833.92 | 89980.97 | 1.37E-08 | 0.9309 | 0.5505 |
| lmer_slope_hippocampus | 89801.71 | 89966.06 | 1.37E-08 | 0.9329 | 0.5505 |
| lmer_intr_amygdala | 89976.98 | 90124.03 | 4.01E-06 | 0.8697 | 0.4898 |
| lmer_slope_amygdala | 89956.13 | 90120.48 | 4.01E-06 | 0.8713 | 0.4897 |
| lmer_intr_accumbens.area | 96936.19 | 97083.24 | 1.69E-14 | 0.8228 | 0.5295 |
| lmer_slope_accumbens.area | 96876.77 | 97041.12 | 1.69E-14 | 0.8233 | 0.5310 |
| lmer_intr_bankssts | 97981.96 | 98129.01 | 0.001818 | 0.9339 | 0.6798 |
| lmer_slope_bankssts | 97973.34 | 98137.69 | 0.001818 | 0.9354 | 0.6814 |
| lmer_intr_caudal.anterior.cingulate | 109133.2 | 109280.3 | 0.131507 | 0.8638 | 0.7653 |
| lmer_slope_caudal.anterior.cingulate | 109133.2 | 109297.5 | 0.131507 | 0.8644 | 0.7659 |
| lmer_intr_caudal.middle.frontal | 93118.13 | 93265.19 | 8.31E-06 | 0.9227 | 0.5929 |
| lmer_slope_caudal.middle.frontal | 93098.74 | 93263.09 | 8.31E-06 | 0.9246 | 0.5949 |
| lmer_intr_cuneus | 101801.4 | 101948.5 | 0.014429 | 0.9242 | 0.7256 |
| lmer_slope_cuneus | 101796.9 | 101961.3 | 0.014429 | 0.9245 | 0.7262 |
| lmer_intr_entorhinal | 109404.9 | 109551.9 | 1.63E-14 | 0.8013 | 0.6908 |
| lmer_slope_entorhinal | 109345.4 | 109509.7 | 1.63E-14 | 0.8037 | 0.6928 |
| lmer_intr_fusiform | 87545.88 | 87692.93 | 9.17E-05 | 0.9139 | 0.5062 |
| lmer_slope_fusiform | 87531.28 | 87695.63 | 9.17E-05 | 0.9163 | 0.5074 |
| lmer_intr_inferior.parietal | 89044.43 | 89191.48 | 5.89E-14 | 0.9374 | 0.5564 |
| lmer_slope_inferior.parietal | 88987.51 | 89151.86 | 5.89E-14 | 0.9419 | 0.5603 |
| lmer_intr_inferior.temporal | 84066.47 | 84213.52 | 5.73E-07 | 0.9384 | 0.4956 |
| lmer_slope_inferior.temporal | 84041.73 | 84206.08 | 5.73E-07 | 0.9405 | 0.4977 |
| lmer_intr_isthmus.cingulate | 92442.12 | 92589.17 | 0.127191 | 0.9275 | 0.5862 |
| lmer_slope_isthmus.cingulate | 92442 | 92606.35 | 0.127191 | 0.9284 | 0.5869 |
| lmer_intr_lateral.occipital | 89550.4 | 89697.45 | 0.003943 | 0.9121 | 0.5273 |
| lmer_slope_lateral.occipital | 89543.33 | 89707.68 | 0.003943 | 0.9129 | 0.5282 |
| lmer_intr_lateral.orbitofrontal | 86224.13 | 86371.18 | 1.29E-08 | 0.8466 | 0.4323 |
| lmer_slope_lateral.orbitofrontal | 86191.79 | 86356.14 | 1.29E-08 | 0.8497 | 0.4345 |
| lmer_intr_lingual | 102605.2 | 102752.2 | 0.041242 | 0.9181 | 0.7268 |
| lmer_slope_lingual | 102602.8 | 102767.2 | 0.041242 | 0.9181 | 0.7272 |
| lmer_intr_medial.orbitofrontal | 89954.36 | 90101.41 | 2.25E-06 | 0.7832 | 0.4219 |
| lmer_slope_medial.orbitofrontal | 89932.35 | 90096.7 | 2.25E-06 | 0.7872 | 0.4241 |
| lmer_intr_middle.temporal | 83331.01 | 83478.06 | 0.0019 | 0.9177 | 0.4615 |
| lmer_slope_middle.temporal | 83322.48 | 83486.83 | 0.0019 | 0.9195 | 0.4629 |
| lmer_intr_parahippocampal | 108997.1 | 109144.2 | 4.99E-05 | 0.8686 | 0.7639 |
| lmer_slope_parahippocampal | 108981.3 | 109145.6 | 4.99E-05 | 0.8690 | 0.7639 |
| lmer_intr_paracentral | 98058.63 | 98205.68 | 0.015686 | 0.8695 | 0.5958 |
| lmer_slope_paracentral | 98054.32 | 98218.67 | 0.015686 | 0.8705 | 0.5960 |
| lmer_intr_pars.opercularis | 96829.05 | 96976.1 | 1.20E-12 | 0.9354 | 0.6658 |
| lmer_slope_pars.opercularis | 96778.15 | 96942.5 | 1.20E-12 | 0.9396 | 0.6698 |
| lmer_intr_pars.orbitalis | 96989.61 | 97136.67 | 1.39E-05 | 0.8785 | 0.5892 |
| lmer_slope_pars.orbitalis | 96971.25 | 97135.6 | 1.39E-05 | 0.8805 | 0.5912 |
| lmer_intr_pars.triangularis | 96637.58 | 96784.63 | 4.55E-18 | 0.9402 | 0.6710 |
| lmer_slope_pars.triangularis | 96561.72 | 96726.07 | 4.55E-18 | 0.9439 | 0.6748 |
| lmer_intr_pericalcarine | 105115.9 | 105263 | 0.022841 | 0.9429 | 0.8190 |
| lmer_slope_pericalcarine | 105112.4 | 105276.7 | 0.022841 | 0.9441 | 0.8200 |
| lmer_intr_postcentral | 91605.6 | 91752.65 | 0.000549 | 0.8764 | 0.5189 |
| lmer_slope_postcentral | 91594.59 | 91758.94 | 0.000549 | 0.8789 | 0.5203 |
| lmer_intr_posterior.cingulate | 96853.73 | 97000.78 | 2.21E-19 | 0.8913 | 0.6014 |
| lmer_slope_posterior.cingulate | 96771.82 | 96936.17 | 2.21E-19 | 0.8949 | 0.6022 |
| lmer_intr_precentral | 91186.59 | 91333.64 | 2.61E-12 | 0.8478 | 0.4864 |
| lmer_slope_precentral | 91137.25 | 91301.6 | 2.61E-12 | 0.8504 | 0.4864 |
| lmer_intr_precuneus | 84734.58 | 84881.63 | 1.23E-08 | 0.9088 | 0.4708 |
| lmer_slope_precuneus | 84702.16 | 84866.51 | 1.23E-08 | 0.9126 | 0.4730 |
| lmer_intr_rostral.anterior.cingulate | 95688.68 | 95835.73 | 2.64E-12 | 0.9093 | 0.6097 |
| lmer_slope_rostral.anterior.cingulate | 95639.36 | 95803.72 | 2.64E-12 | 0.9122 | 0.6129 |
| lmer_intr_rostral.middle.frontal | 80873.84 | 81020.89 | 2.57E-17 | 0.9137 | 0.4354 |
| lmer_slope_rostral.middle.frontal | 80801.44 | 80965.79 | 2.57E-17 | 0.9191 | 0.4395 |
| lmer_intr_superior.frontal | 79730.6 | 79877.65 | 1.25E-11 | 0.8921 | 0.4038 |
| lmer_slope_superior.frontal | 79684.38 | 79848.73 | 1.25E-11 | 0.8972 | 0.4060 |
| lmer_intr_superior.parietal | 92895.95 | 93043 | 8.55E-07 | 0.8899 | 0.5487 |
| lmer_slope_superior.parietal | 92872.01 | 93036.36 | 8.55E-07 | 0.8934 | 0.5512 |
| lmer_intr_superior.temporal | 86495.24 | 86642.29 | 0.003021 | 0.9148 | 0.4959 |
| lmer_slope_superior.temporal | 86487.64 | 86651.99 | 0.003021 | 0.9168 | 0.4971 |
| lmer_intr_supramarginal | 87390.39 | 87537.44 | 3.67E-13 | 0.9263 | 0.5221 |
| lmer_slope_supramarginal | 87337.12 | 87501.47 | 3.67E-13 | 0.9320 | 0.5258 |
| lmer_intr_frontal.pole | 110426.3 | 110573.4 | 1.95E-65 | 0.6907 | 0.5868 |
| lmer_slope_frontal.pole | 110132.3 | 110296.7 | 1.95E-65 | 0.6957 | 0.5882 |
| lmer_intr_transverse.temporal | 102753.2 | 102900.2 | 0.032413 | 0.9130 | 0.7247 |
| lmer_slope_transverse.temporal | 102750.3 | 102914.7 | 0.032413 | 0.9144 | 0.7258 |
| lmer_intr_insula | 88693.2 | 88840.26 | 7.61E-14 | 0.8263 | 0.4416 |
| lmer_slope_insula | 88636.79 | 88801.14 | 7.61E-14 | 0.8290 | 0.4420 |
Author response table 1
Contributions and effect directions of the first PLS components in brain development and brain aging of genes that mapped to GWAS significant SNP.
The bold P values reflect significance (P < 0.005, inclusion in the functional enrichment analysis) after FDR correction.
| IMAGEN | |||
|---|---|---|---|
| Gene | bootstrap.weights | pvalue | p.adjust |
| LGR4 | 3.70 | 2.17E-04 | 2.00E-03 |
| CCDC170 | 1.59 | 1.11E-01 | 2.41E-01 |
| SUFU | 1.35 | 1.77E-01 | 3.31E-01 |
| SPPL2C | 0.97 | 3.32E-01 | 5.04E-01 |
| ACTRIA | 0.94 | 3.49E-01 | 5.21E-01 |
| MAPT | 0.89 | 3.75E-01 | 5.46E-01 |
| KANSL1-AS1 | 0.76 | 4.50E-01 | 6.12E-01 |
| ARHGAP27 | 0.67 | 5.03E-01 | 6.58E-01 |
| LIN7C | 0.52 | 6.03E-01 | 7.39E-01 |
| ARL17B | 0.45 | 6.53E-01 | 7.76E-01 |
| ESRI | 0.16 | 8.75E-01 | 9.29E-01 |
| BDNF-AS | 0.00 | 9.99E-01 | 9.99E-01 |
| FAM3C | -0.10 | 9.20E-01 | 9.57E-01 |
| STH | -1.27 | 2.06E-01 | 3.68E-01 |
| PLEKHM1 | -2.39 | 1.70E-02 | 6.13E-02 |
| KANSLI | -2.40 | 1.65E-02 | 5.99E-02 |
| LRRC37A4P | -2.69 | 7.09E-03 | 3.13E-02 |
| UKBiobank | |||
| Gene | bootstrap.weights | pvalue | p.adjust |
| BDNF-AS | 4.73 | 2.25E-06 | 5.11E-05 |
| ARHGAP27 | 4.02 | 5.92E-05 | 4.38E-04 |
| ESRI | 3.91 | 9.31E-05 | 6.13E-04 |
| SPPL2C | 3.30 | 9.56E-04 | 3.69E-03 |
| SUFU | 2.20 | 2.79E-02 | 5.72E-02 |
| LIN7C | 2.15 | 3.14E-02 | 6.33E-02 |
| CCDC170 | 2.08 | 3.78E-02 | 7.34E-02 |
| LGR4 | 1.76 | 7.88E-02 | 1.35E-01 |
| ARL17B | 1.48 | 1.39E-01 | 2.13E-01 |
| PLEKHM1 | 0.69 | 4.93E-01 | 5.89E-01 |
| LRRC37A4P | 0.27 | 7.84E-01 | 8.39E-01 |
| KANSL1-AS1 | 0.17 | 8.63E-01 | 9.00E-01 |
| KANSLI | -0.56 | 5.75E-01 | 6.64E-01 |
| STH | -1.03 | 3.04E-01 | 4.01E-01 |
| MAPT | -1.38 | 1.67E-01 | 2.47E-01 |
| ACTRIA | -2.13 | 3.35E-02 | 6.67E-02 |
| FAM3C | -3.68 | 2.38E-04 | 1.23E-03 |
Additional files
Download links
A two-part list of links to download the article, or parts of the article, in various formats.
Downloads (link to download the article as PDF)
Open citations (links to open the citations from this article in various online reference manager services)
Cite this article (links to download the citations from this article in formats compatible with various reference manager tools)
Population clustering of structural brain aging and its association with brain development
eLife 13:RP94970.
https://doi.org/10.7554/eLife.94970.3


