Small RNAs from mitochondrial genome recombination sites are incorporated into T. gondii mitoribosomes
- Molecular Genetics, Humboldt University Berlin, Germany
- Biodiversity and Evolution, Humboldt University Berlin, Germany
Figures
Figure 1 with 1 supplement
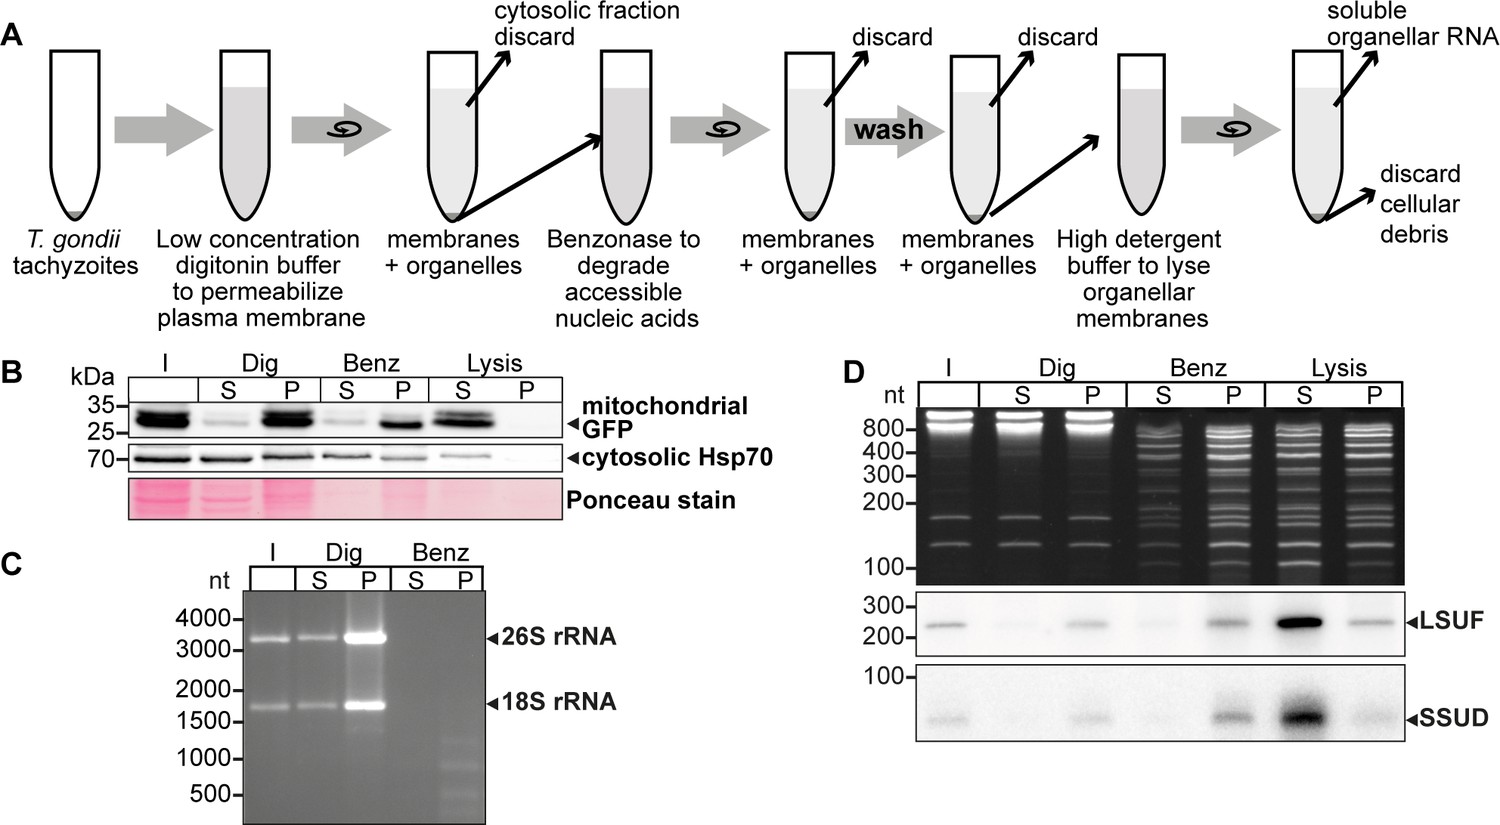
An experimental pipeline to enrich T. gondii mitochondrial RNAs.
(A) T. gondii tachyzoites were harvested and incubated in a buffer with digitonin for plasma membrane permeabilization. Subsequently, accessible nucleic acids were digested by benzonase. After removal of the benzonase and washing the pellet, the intact organelles were lysed by a high detergent buffer. Soluble nucleic acids were separated by centrifugation and extracted from the supernatant. (B) T. gondii cells expressing a mitochondrial-targeted GFP were subjected to organelle enrichment. GFP was tracked by immunoblotting (5% volume of each fraction was analyzed). The GFP signal remained in the pellet and only shifted into the supernatant after the lysis step. In contrast, much of the cytosolic HSP70 is removed during the procedure, indicating specific enrichment of mitochondria. (C) RNA extracted from selected fractions of the organelle enrichment protocol was analyzed by agarose gel electrophoresis. (D) RNA extracted from selected fractions of the organelle enrichment protocol was analyzed on a denaturing 10% PAGE gel and blotted onto a nylon membrane. Radiolabeled DNA oligonucleotide probes were used to detect the mitochondrial rRNA fragments SSUD (from the small subunit of the ribosome) and LSUF (large subunit of the ribosome). Both fragments were found in pellet fractions after digitonin treatment, where they were protected from benzonase digestion. They only shifted to the supernatant after lysis. This demonstrates that the mitochondria stay intact during the procedure.
-
Figure 1—source data 1
Raw gel and blot images.
Uncropped blots and gels accompanied by images indicating the areas shown in Figure 1B–D with a red rectangle. In addition, raw scan images are provided. If the scan contains multiple blots, the position of the blot of interest is indicated in the file name. Additionally, for immunoblots light image overlays depicting the membrane outline are provided.
- https://cdn.elifesciences.org/articles/95407/elife-95407-fig1-data1-v2.zip
Figure 1—figure supplement 1
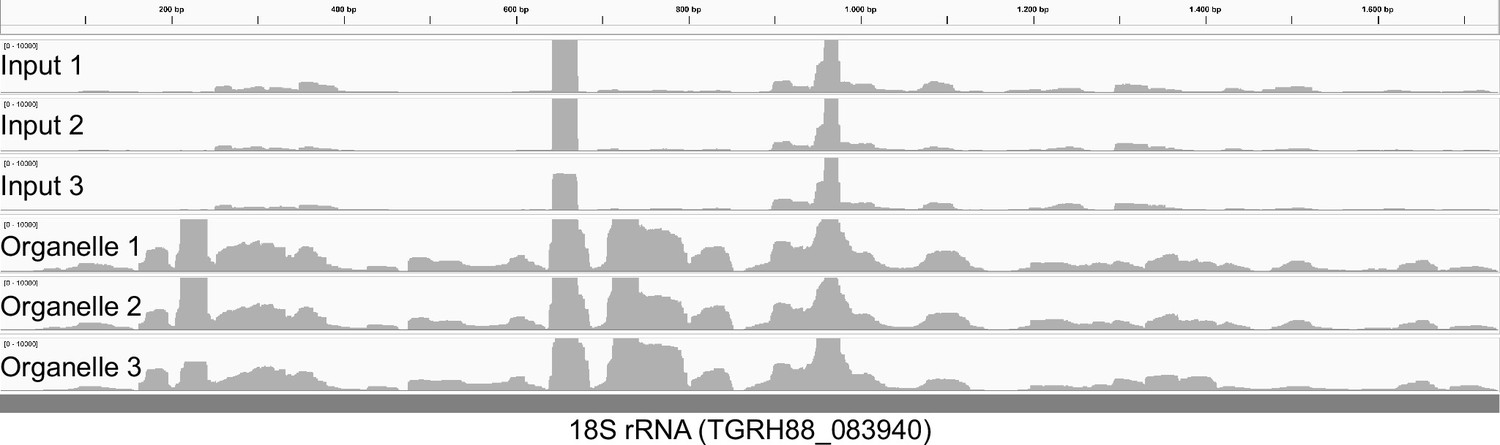
Small RNA (sRNA) sequence coverage of an 18 S rRNA gene.
Mapping of reads from input and enriched sRNA libraries to an 18 S rRNA gene demonstrates that the enriched libraries have a much higher coverage than input libraries. This suggests that the enrichment procedure generates cytosolic rRNA fragments that are co-purified, for example from partially digested, ER-membrane bound ribosomes. This pattern was observed for all cytosolic rRNAs (not shown). Since the benzonase does not degrade the cytosolic components entirely but creates a large number of smaller fragments, more reads for cytosolic rRNA were eventually found in the enriched RNA library than in the input library.
Figure 2 with 2 supplements
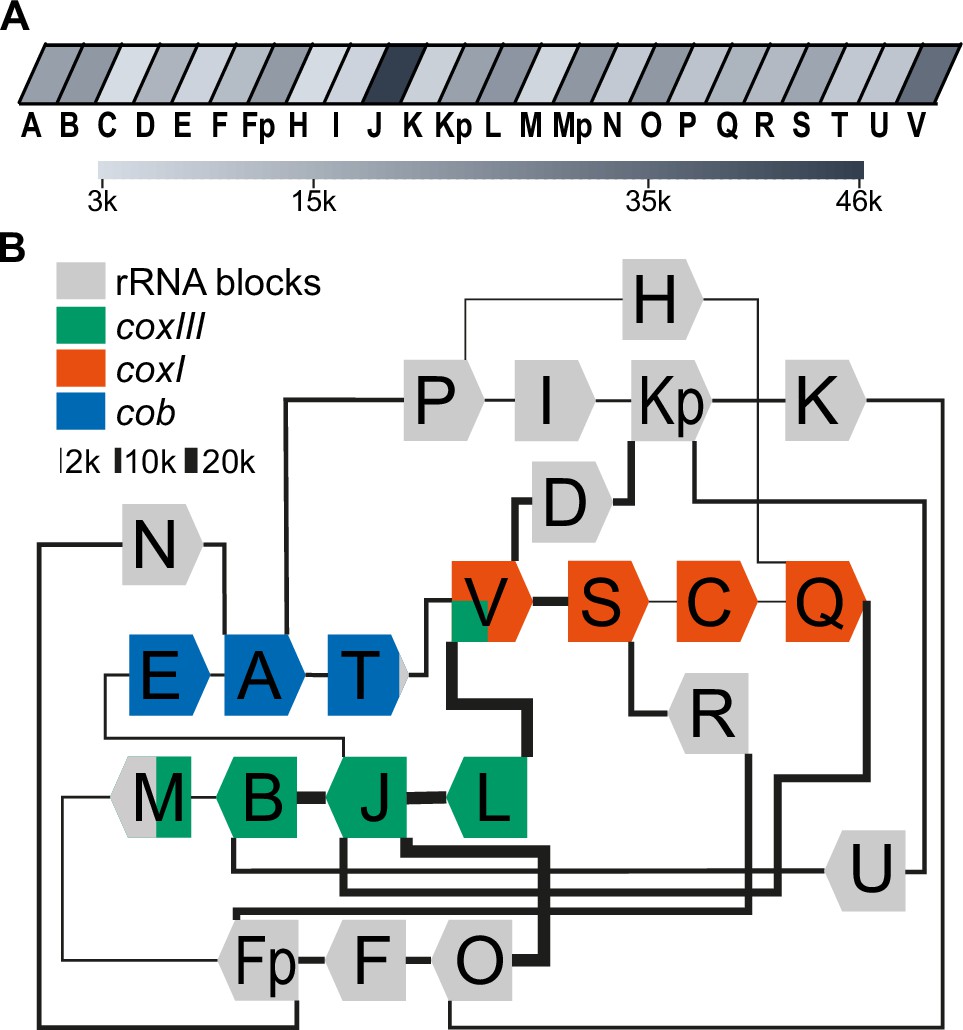
Long-read sequencing shows a specific system of block combinations.
(A) Oxford Nanopore sequencing technology (ONT) DNA sequencing results were analyzed for the number of block occurrences. The gray scale indicates how many times each of the mitochondrial sequence blocks was found in the mitochondrial ONT reads. (B) Map of the T. gondii mitochondrial genome representing block combinations occurring in mitochondrial ONT reads. The thickness of the connecting lines indicates the absolute number of occurrences for each combination.
Figure 2—figure supplement 1
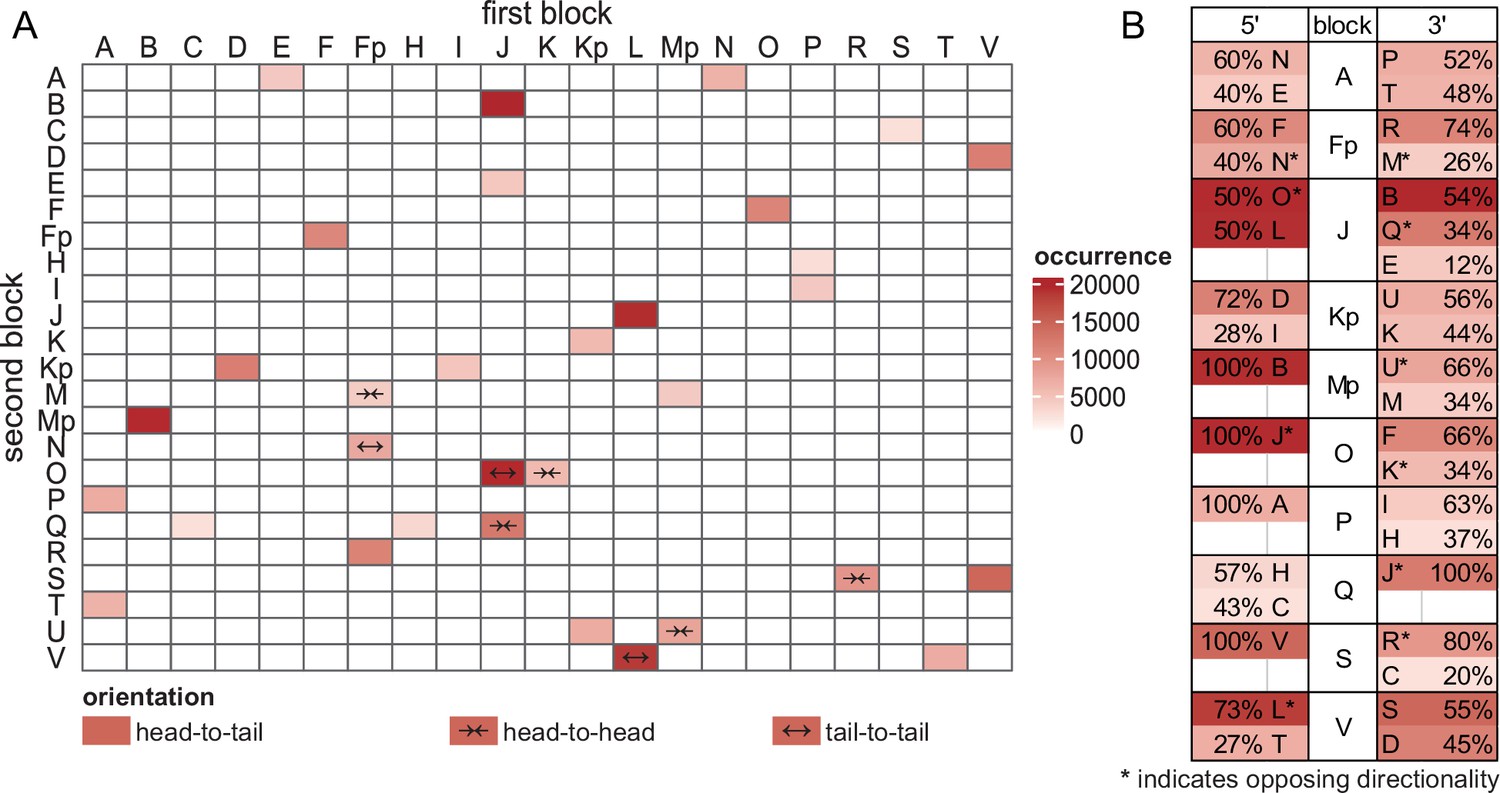
Counting of T. gondii mitochondrial sequence block organization.
Mitochondrial sequence blocks [1] were annotated on T. gondii mitochondrial Oxford Nanopore sequencing technology (ONT) reads with at least 75% similarity. The annotations and their respective directionality were extracted and all two-block combinations, separated by less than 10 bases, were quantified using a custom R script. Pairs occurring less than 50 times were identified as false positives and consequently removed from the figure. (A) Unordered heatmap of two-block combinations. 'Head-to-tail' denotes that the 3' end of the first block is followed by the 5' end of the second block, while 'head-to-head' indicates that the 3' end of the first block is followed by the 3' end of the second block. 'Tail-to-tail' indicates a proximity of 5' ends. (B) Block frequencies for all blocks neighbored by at least three other blocks. The colors represent the absolute number of respective neighbors, while the relative number of identified 5' and 3' neighbors is presented in percentage values. Asterisks are used to highlight opposing annotated directionalities.
Figure 2—figure supplement 2

Proposed changes to the sequence blocks previously annotated by Namasivayam et al., 2021 [1].
Figure 3 with 3 supplements
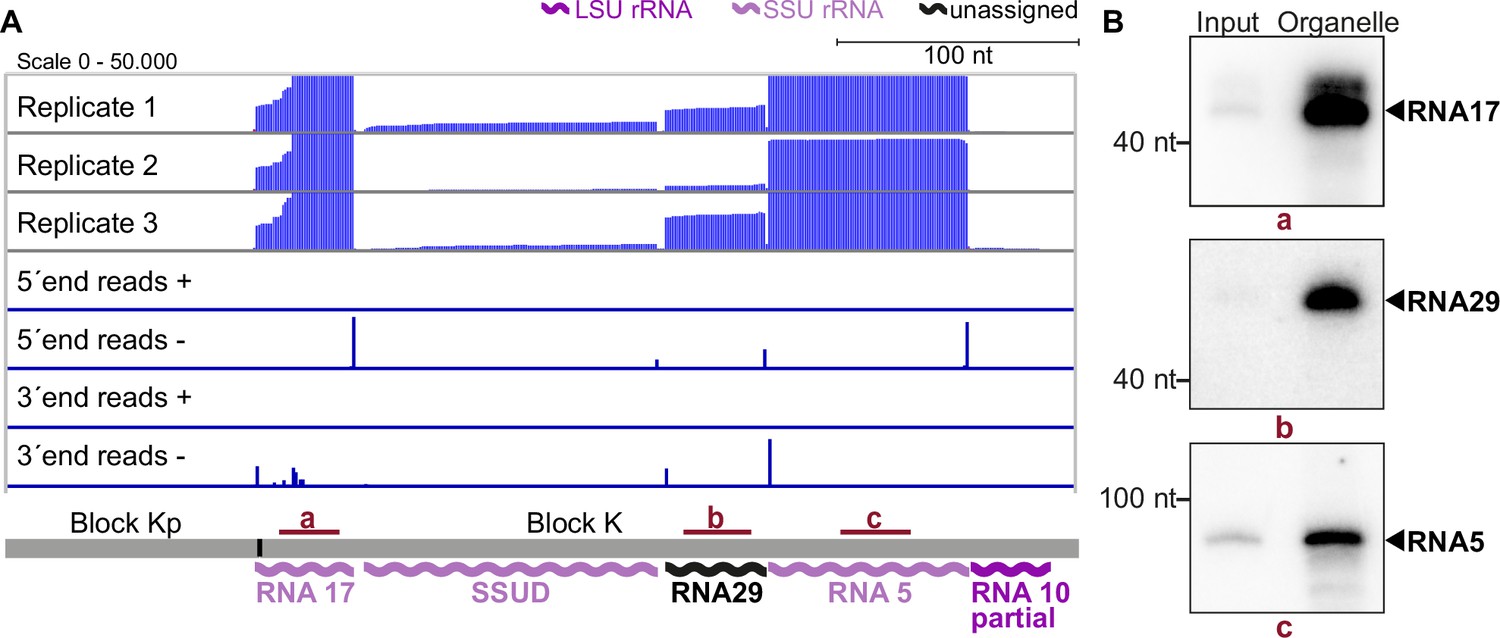
Small RNA sequencing identifies mitochondrial small RNAs.
(A) Upper three rows: excerpt of mapping results in three strand-specific small RNA sequencing replicates starting from total input RNA from our T. gondii organelle RNA preparation. Read depth was counted by the number of reads at each position. Note that the 5’-ends of the RNAs shown here are on the right. Lower four rows: only the terminal nucleotides of each read on the plus and minus strands of the genome are shown. The size and position of genes below the coverage graphs are all drawn to scale. Red bars with lowercase letters indicate the positions of probes used for detecting RNAs in RNA gel blot hybridizations shown in (B). (B) Equal quantities of total input RNA from T. gondii and from organelle preparations were loaded onto a denaturing PAGE gel and analyzed by RNA gel blot hybridization with the probes indicated.
-
Figure 3—source data 1
Raw blot images.
Uncropped blots accompanied by images indicating the areas shown in Figure 3B with a red rectangle. In addition, raw scan images are provided. If the scan contains multiple blots, the position of the blot of interest is indicated in the file name.
- https://cdn.elifesciences.org/articles/95407/elife-95407-fig3-data1-v2.zip
Figure 3—figure supplement 1
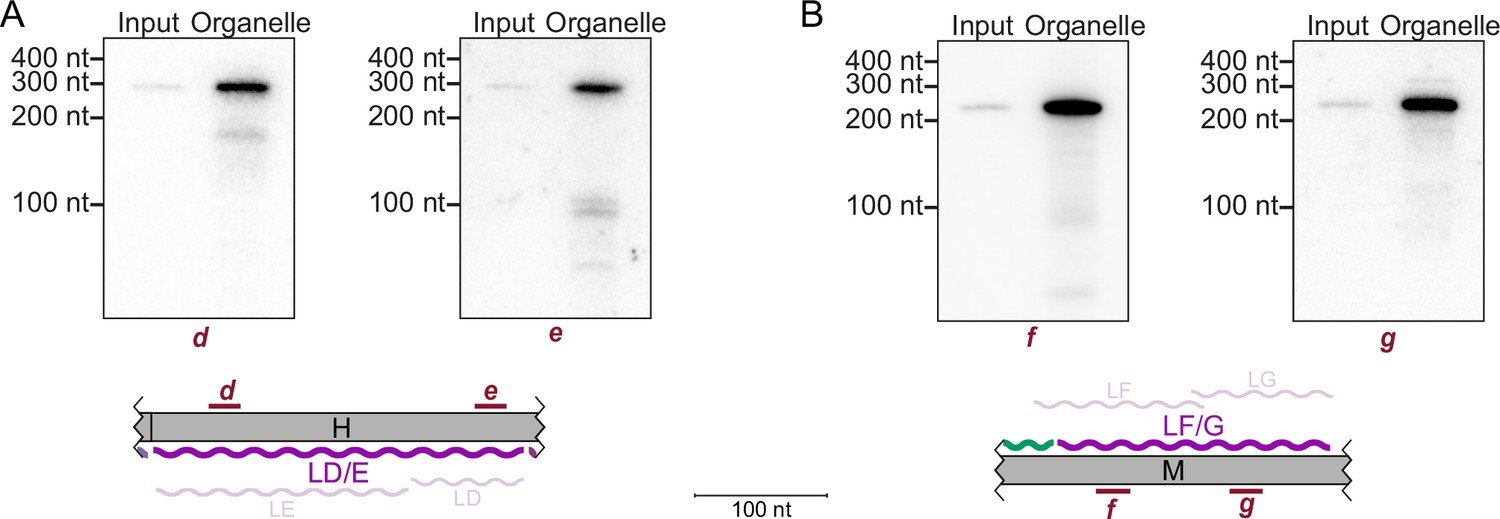
Detection of LSUD/E and LSUF/G transcripts.
(A) RNA gel blot hybridization of LSUE (left) and LSUD (right), which are located side-by-side on block H. LSUE and LSUD were both detected at a size of 300 nt with a much stronger signal in the organellar enriched RNA fraction than in the total input RNA. This length corresponds to a co-transcript of LSUE and LSUD. Signals for smaller RNAs were detected (probe d=~200 nt, probe e=100 nt), but to a much lesser extent than the longest fragment. Bottom: Schematic representation of the position of the LSUE (LE) and LSUD (LD) transcripts (light-colored wiggle lines) and the single LD/E transcript (dark-colored wiggle line) relative to genomic block H. Green wiggle-line: end of coxIII transcript. Red bars with lowercase letters indicate the positions of probes used for detecting RNAs in RNA gel blot hybridizations. (B) Same as in (A), but for the LSUF and LSUG RNAs. LSUF and LSUG were detected at a size of about 240 nt again with a much stronger signal in the organellar enriched RNA fraction and negligible amounts of smaller RNAs.
-
Figure 3—figure supplement 1—source data 1
Raw blot images.
Uncropped blots accompanied by images indicating the areas shown in Figure 3—figure supplement 1A–B with a red rectangle. In addition, raw scan images are provided. If the scan contains multiple blots, the position of the blot of interest is indicated in the file name.
- https://cdn.elifesciences.org/articles/95407/elife-95407-fig3-figsupp1-data1-v2.zip
Figure 3—figure supplement 2
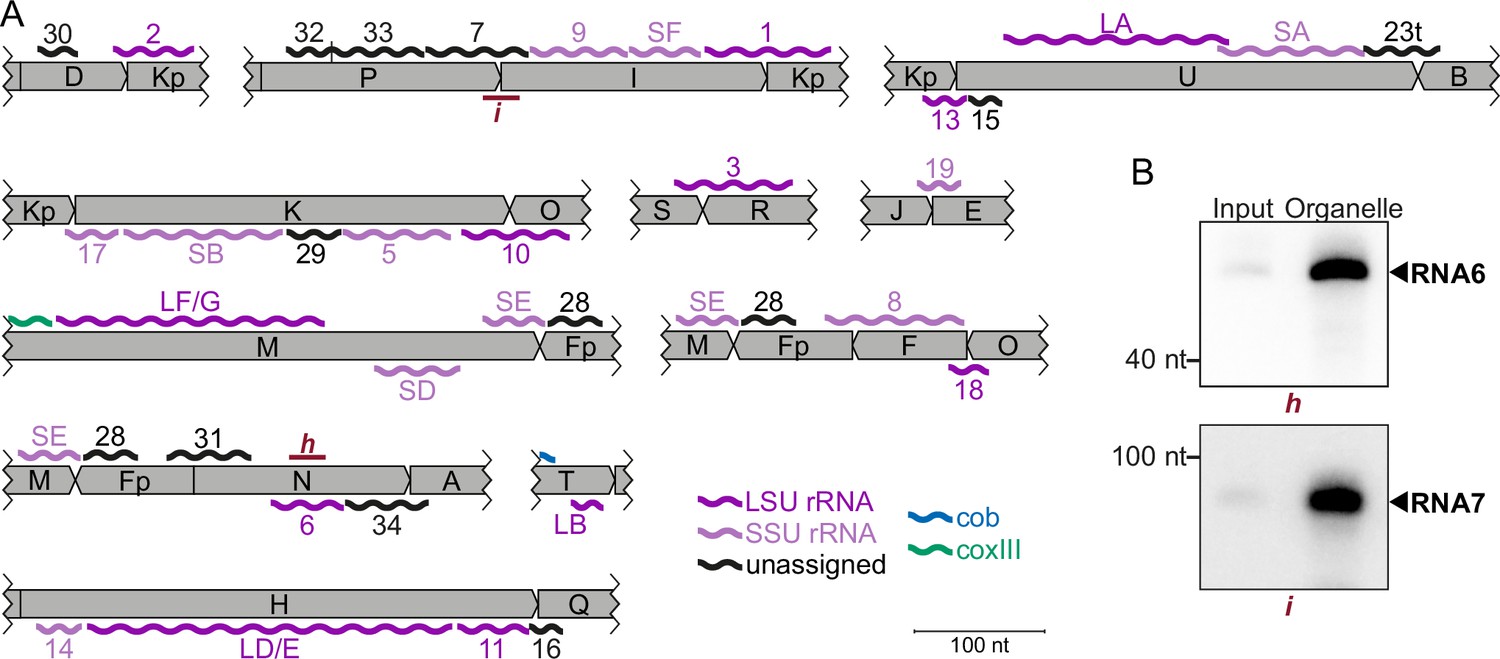
Overview of non-coding RNAs identified in T. gondii mitochondria.
(A) Schematic representation of the position of all non-coding transcripts in the T. gondii genome. Transcripts are shown as wiggle lines and are named according to prior nomenclature [2]. Assignment of transcripts to the large and the small rRNA are indicated by color. Red bars with lowercase letters indicate the positions of probes used for detecting RNAs in RNA gel blot hybridizations in (B). L/S=LSU/SSU = large/small subunit of the ribosome. (B) RNA gel blot hybridization of RNA6 and RNA7 using RNA extracts from input and organelle enriched fractions of the organelle enrichment protocol shown in Figure 1.
-
Figure 3—figure supplement 2—source data 1
Raw blot images.
Uncropped blots accompanied by images indicating the areas shown in Figure 3—figure supplement 2B with a red rectangle. In addition, raw scan images are provided. If the scan contains multiple blots, the position of the blot of interest is indicated in the file name.
- https://cdn.elifesciences.org/articles/95407/elife-95407-fig3-figsupp2-data1-v2.zip
Figure 3—figure supplement 3
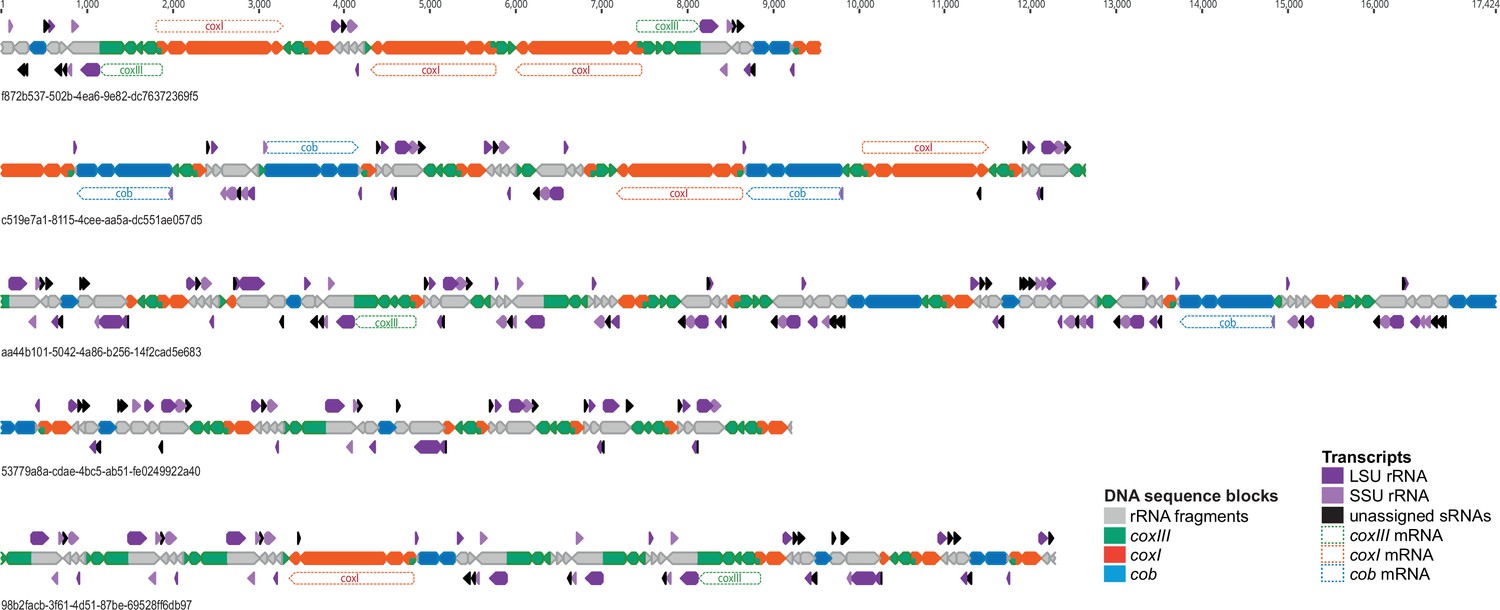
Mapping of small RNAs onto exemplary Oxford Nanopore sequencing technology (ONT) sequencing reads.
ONT sequencing reads are drawn to scale with block annotations indicated by a color code. Numbers below reads are unique identifiers in the published sequence read archive (acc. no PRJNA978626 at SRA). The blocks are shown as arrows to indicate the direction of blocks as previously defined [1]. Sequence blocks located on the ends of reads are incomplete. small RNAs (sRNAs) are shown above and below the ONT depending on which strand they belong. According to their homology to rRNAs, they are assigned either to the small (SSU) or the large (LSU) subunit, which is indicated by arrow color. Potential full-length mRNAs for the three reading frames are shown as well. Please note that the non-coding sequence blocks are almost fully covered by small RNA species and that full-length mRNAs can be produced from multiple locations.
Figure 4
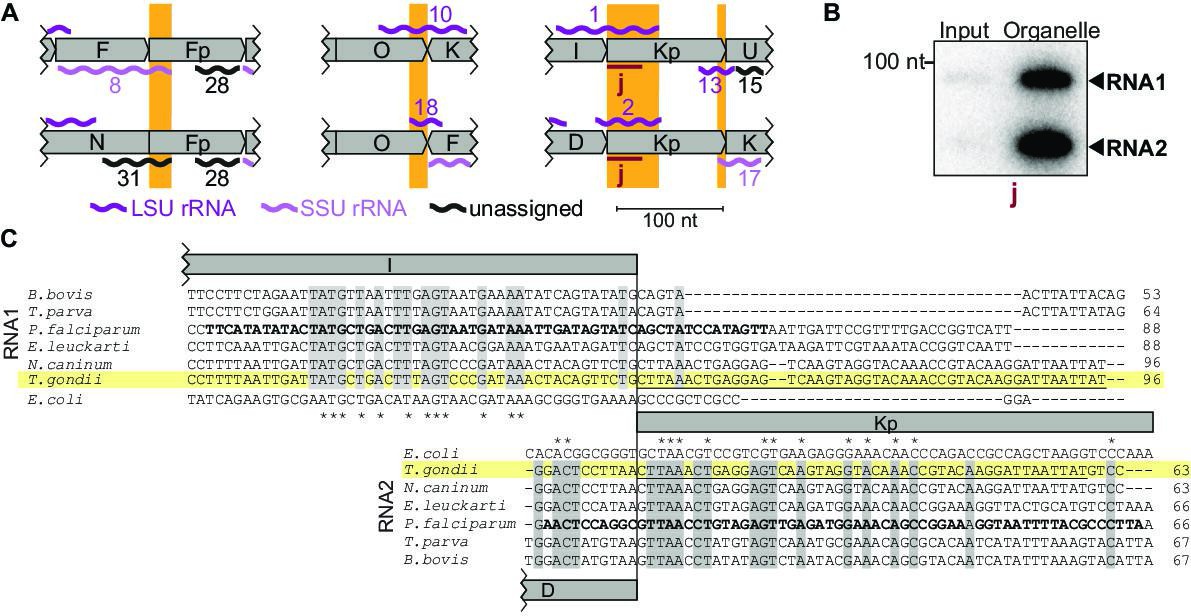
Noncoding RNAs at block borders.
(A) Schematic representation of three block borders that are used by different transcripts (sequences used for two transcripts are marked by orange rectangles). Transcripts are shown as wiggle lines and are named according to prior nomenclature (Namasivayam et al., 2021). Assignment of transcripts to the large and the small rRNA are indicated by color. The red bars with the lowercase letter ‘j’ indicate the position of the probe used for detecting RNA1 and RNA2 by RNA gel blot hybridization. LSU/SSU = large/small subunit of the ribosome. (B) RNA gel blot hybridization of RNA1 and RNA2 using RNA extracts from input and organelle-enriched fractions of the organelle enrichment protocol is shown in Figure 1. Equal RNA amounts were loaded. (C) Alignment of RNA1 (top) and RNA2 (bottom) sequences from different apicomplexan species. Sequence excerpts from E. coli 23 S rRNA (1240–1301 for RNA1, 944–1010 for RNA2) corresponding to sections of the alignment were added manually based on previous analyses (Feagin et al., 2012). Nucleotide positions conserved in all apicomplexans are shaded in gray. The residues in the P. falciparum sequence suggested to replace sequence elements in the E. coli 23 S rRNA structure (Feagin et al., 2012) are marked in bold. Residues conserved between apicomplexans and E. coli are marked with asterisks. Note that RNA1 and RNA2 are aligned according to their shared sequence in genomic block Kp.
-
Figure 4—source data 1
Raw blot images.
Uncropped blot accompanied by an image indicating the areas shown in Figure 4B with a red rectangle. In addition, the raw scan image is provided with the position of the blot of interest being indicated in the file name.
- https://cdn.elifesciences.org/articles/95407/elife-95407-fig4-data1-v2.zip
Figure 5 with 1 supplement
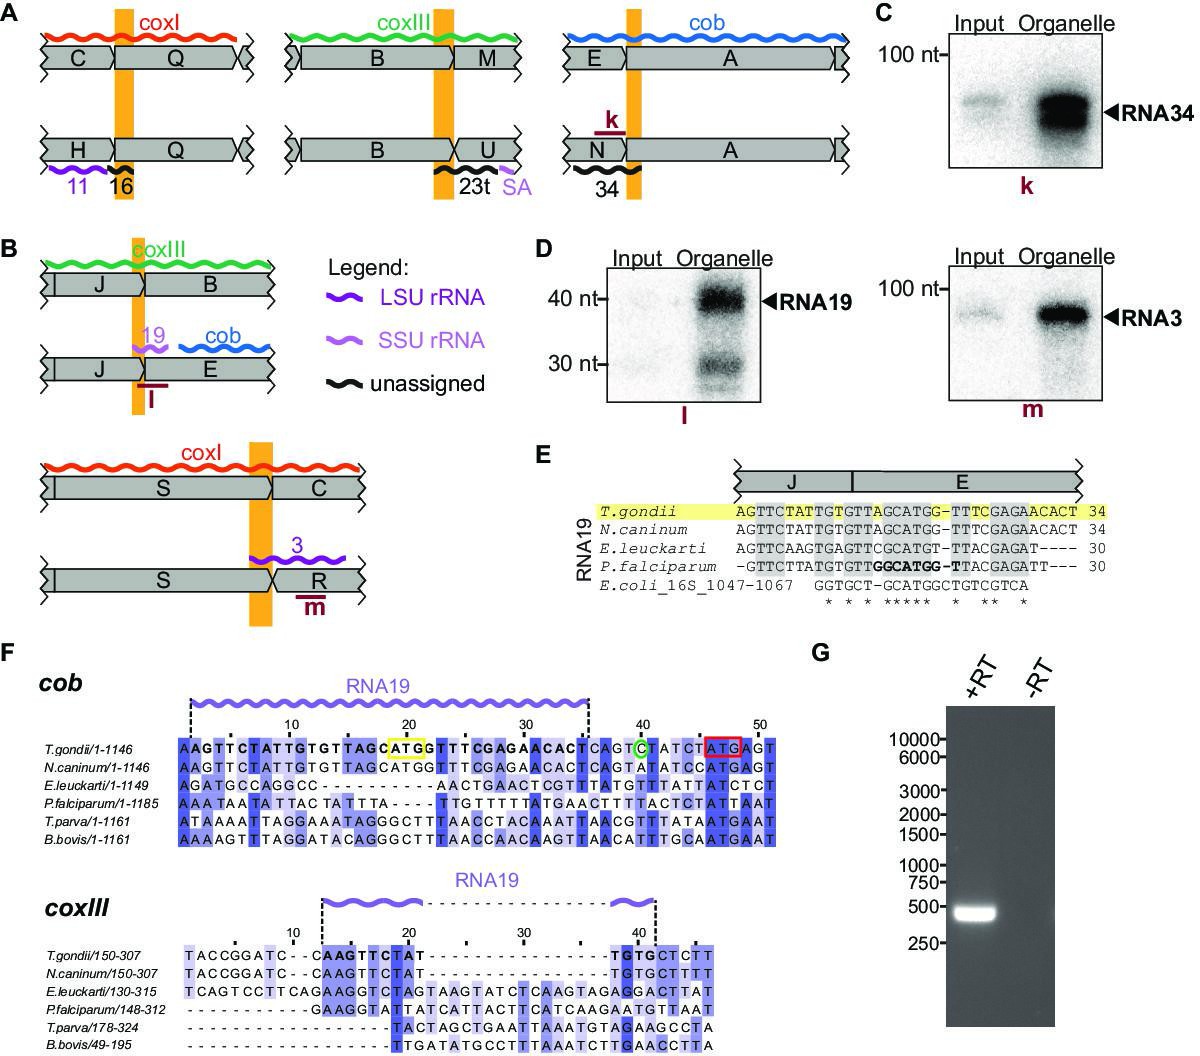
Small RNAs that consist of coding and non-protein-coding sequences at block borders.
(A) Schematic representation of the genomic position of three RNAs that are partially antisense to coding sequences. (B) Schematic representation of the genomic position of two RNAs that partially overlap with coding sequences. (C) RNA gel blot hybridization of RNA34. Equal amounts of RNA extracts from input and organelle-enriched fractions were analyzed. (D) RNA gel blot hybridization of RNA19 and RNA3 – for details see (E) Alignment of T. gondii RNA19 with homologous sequences from other apicomplexan species and from E. coli. (F) Alignment of a section of the coxIII and cob sequences from different apicomplexan species. Alignments were prepared using Clustal Omega (https://www.ebi.ac.uk/Tools/msa/clustalo/). Nucleotides of T. gondii RNA19 are marked in bold in both alignments and as a lilac wiggle line above the sequences. The sequences are interrupted by indels in coxIII and cob of other apicomplexans that have stand-alone RNA19 sequences (e.g. P. falciparum). Within the cob sequence, the RNA19 sequence covers an annotated start codon (Alday et al., 2017, yellow box; Namasivayam et al., 2021). However, an alternative start codon downstream has been suggested as well (red box, McFadden et al., 2000) and is in fact where sequence conservation starts. The green circle indicates the cob 5’ transcript terminus as determined by rapid amplification of cDNA ends (RACE) (see G). (G) Agarose gel analysis of 5’ RACE PCR products was performed to identify the cob 5’ transcript end. +RT and -RT indicates the presence or absence of reverse transcriptase, respectively.
-
Figure 5—source data 1
Raw gel and blot images.
Uncropped blots and gels accompanied by images indicating the areas shown in Figure 5C and D and -G with a red rectangle. In addition, raw scan images are provided.
- https://cdn.elifesciences.org/articles/95407/elife-95407-fig5-data1-v2.zip
Figure 5—figure supplement 1

Alignment of RNA3 sequences from different apicomplexan species.
Alignment of apicomplexan RNA3 sequences using Clustal Omega (https://www.ebi.ac.uk/Tools/msa/clustalo/). Sequence excerpts from E. coli corresponding to sections of the alignment were added manually based on previous analyses [2]. Nucleotide positions conserved in all apicomplexans are shaded in gray. The residues in the P. falciparum sequence suggested to replace sequence elements in the E. coli 23 S rRNA structure [2] are marked in bold. Residues conserved between apicomplexans and E. coli are marked with asterisks.
Figure 6 with 1 supplement
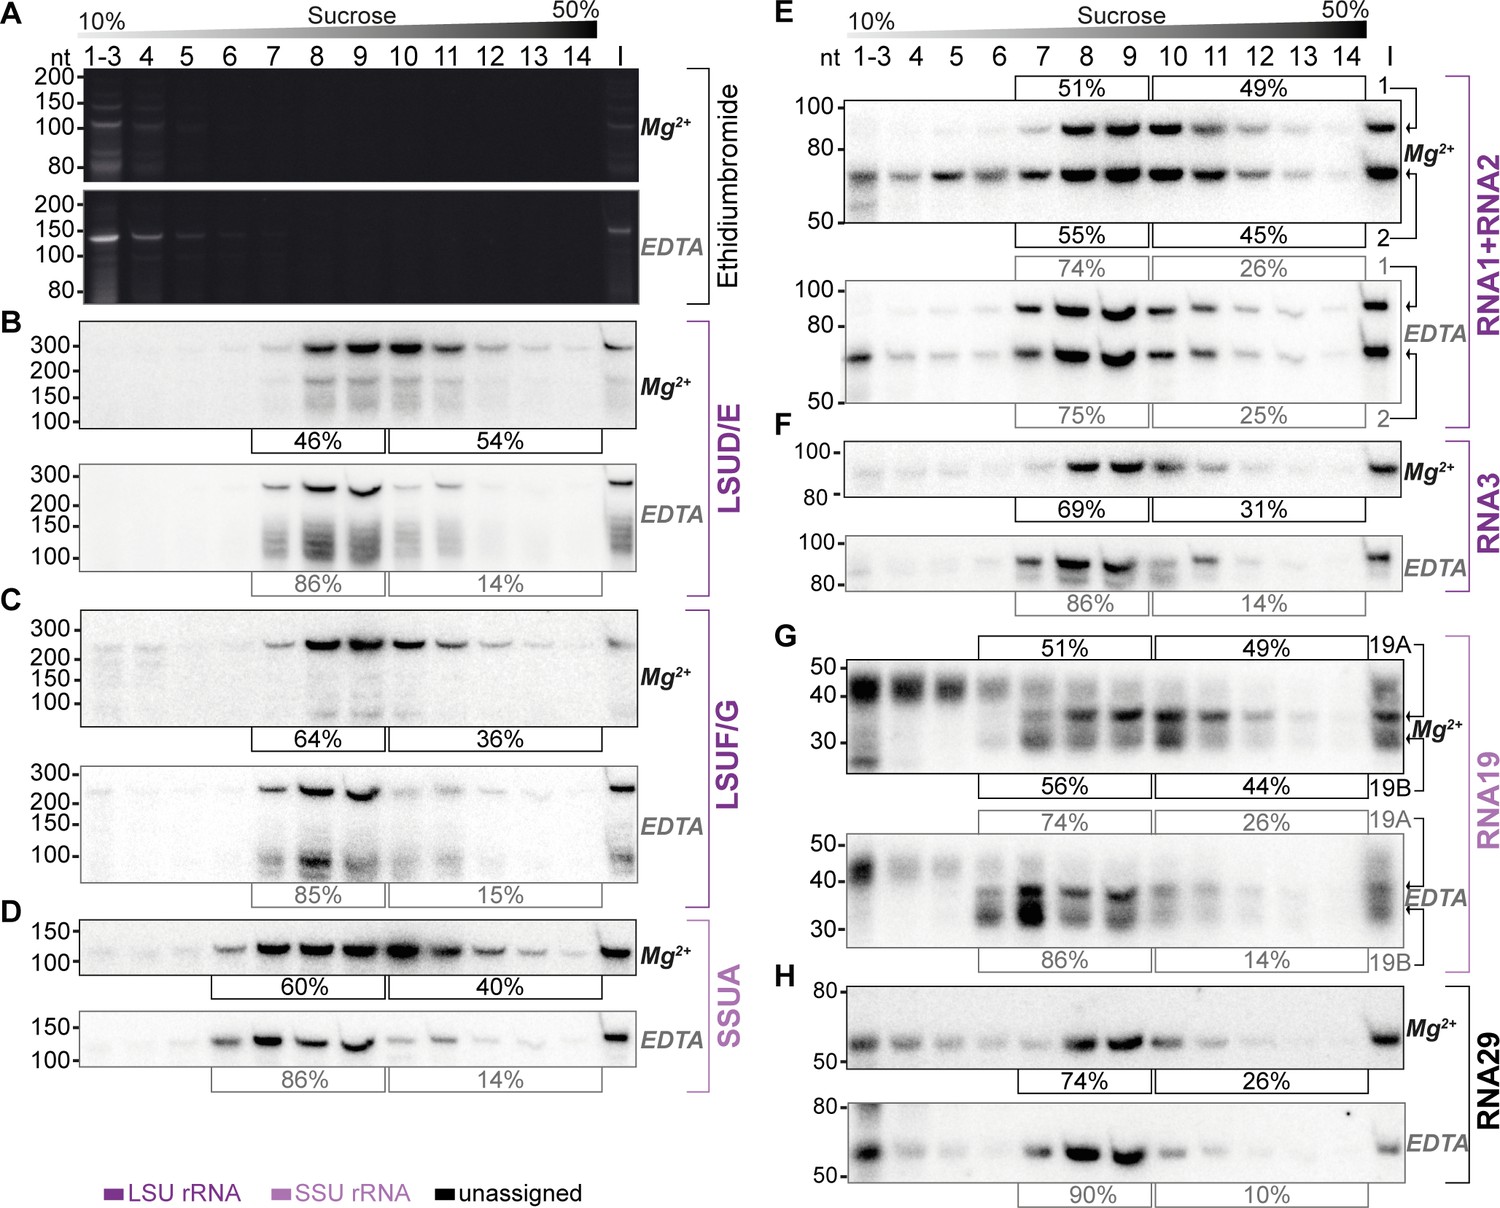
Sucrose density centrifugation analysis demonstrates the association of mitochondrial small RNAs with large molecular weight complexes.
T. gondii organelle-enriched extracts were fractionated by sucrose density gradient centrifugation and subsequently analyzed by RNA gel blot hybridization. Buffer conditions during the experiment were either 30 mM MgCl2, 100 mM KCl (labeled Mg2+ next to the blots), or 10 mM EDTA, 300 mM KCl (labeled EDTA next to the blots). (A) Prior to blotting, the gels were stained with ethidium bromide. Atop the gel images, a schematic representation illustrates the sucrose density gradient. Subsequent panels display a series of RNA gel blot hybridization assays. These assays were conducted on blots derived from the two ethidium bromide-stained gels presented in (A). Following each probe, the blot was stripped of its signal by employing a denaturing buffer. The oligonucleotides in these assays targeted LSUD/E (B), LSUF/G (C), SSUA (D), RNA1 +RNA2 (E), RNA3 (F), RNA19 (G), and RNA29 (H). Percentages in square brackets encircling each blot indicate the proportion of signal detected in fractions 7–9 or 6–9 for large subunit (LSU) or small subunit (SSU) small RNAs (sRNAs), respectively, versus signal intensity in fractions 10–14. ‘I’ corresponds to 10% of the lysate prior to gradient loading. The RNA names are color-coded to indicate homology: deep purple for RNAs with homology to E. coli rRNA from the large ribosomal subunit, light purple for those from the small subunit, and black for RNAs without previously noted homology.
-
Figure 6—source data 1
Raw blot images.
Uncropped blots accompanied by images indicating the areas shown in Figure 6A–D with a red rectangle. In addition, raw scan images are provided. If the scan contains multiple blots, the position of the blot of interest is indicated in the file name.
- https://cdn.elifesciences.org/articles/95407/elife-95407-fig6-data1-v2.zip
-
Figure 6—source data 2
Raw blot images.
Uncropped blots accompanied by images indicating the areas shown in Figure 6E–H with a red rectangle. In addition, raw scan images are provided. If the scan contains multiple blots, the position of the blot of interest is indicated in the file name.
- https://cdn.elifesciences.org/articles/95407/elife-95407-fig6-data2-v2.zip
Figure 6—figure supplement 1
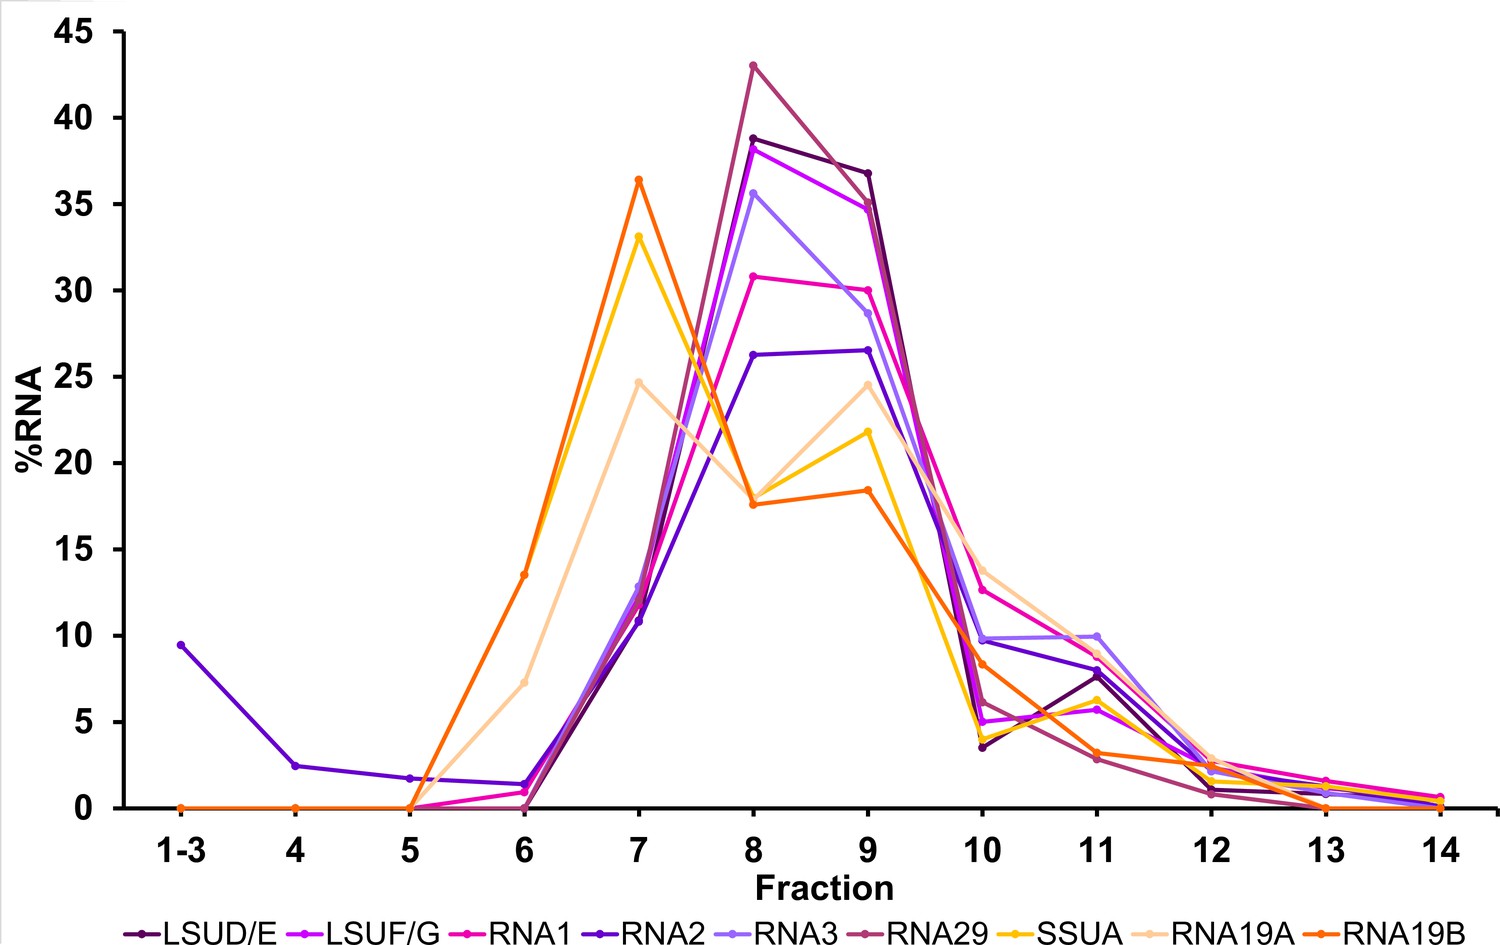
Migration patterns of mitochondrial small RNAs (sRNAs) in sucrose density gradients under Mg2+-depleted conditions.
The distribution of different small RNAs in sucrose density gradients, conducted in absence of Mg2+ and presence of 10 mM EDTA, was analyzed by RNA gel blot hybridizations (Figure 6). Signals were quantified and visualized for each small RNA as a percentage of RNA per fraction. Small RNAs assigned to the ribosomal SSU are visualized in orange hues, while those allocated to the ribosomal large subunit (LSU) are shown in lilac shades. Signals for small subunit (SSU) rRNAs start in fraction 6 and peak in fraction 7 whereas LSU signals start in fraction 7 and peak in fraction 8 and 9.
Figure 7
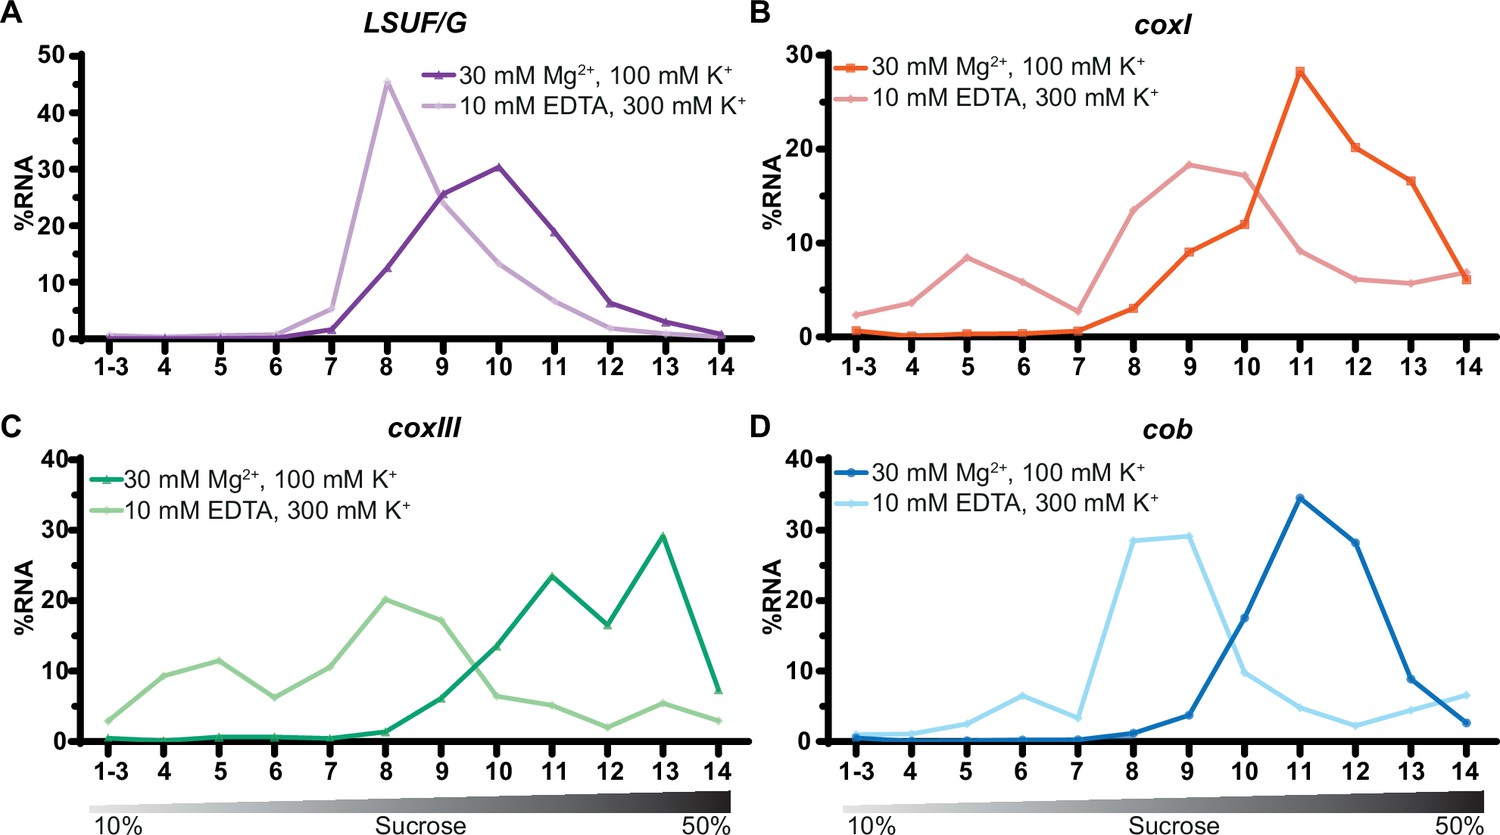
Sucrose density centrifugation analysis of mitochondrial mRNAs.
T. gondii organelle-enriched extracts treated with standard salt concentrations or with an Mg2+-depleted buffer, respectively, were fractionated by sucrose density gradient centrifugation and subsequently analyzed by RT-qPCR. Data was normalized using human estrogen receptor 1 (ESR1) as an external spike-in control. Relative quantities per amplicon are visualized as percentage of RNA per fraction. All three mRNAs (shown in panel B-D) and one large subunit (LSU) rRNA fragment serving as a control (LSUF/G shown in panel A) were analyzed from a single sucrose gradient fractionation. The gradient density is shown schematically below the graphs.
Figure 8 with 1 supplement
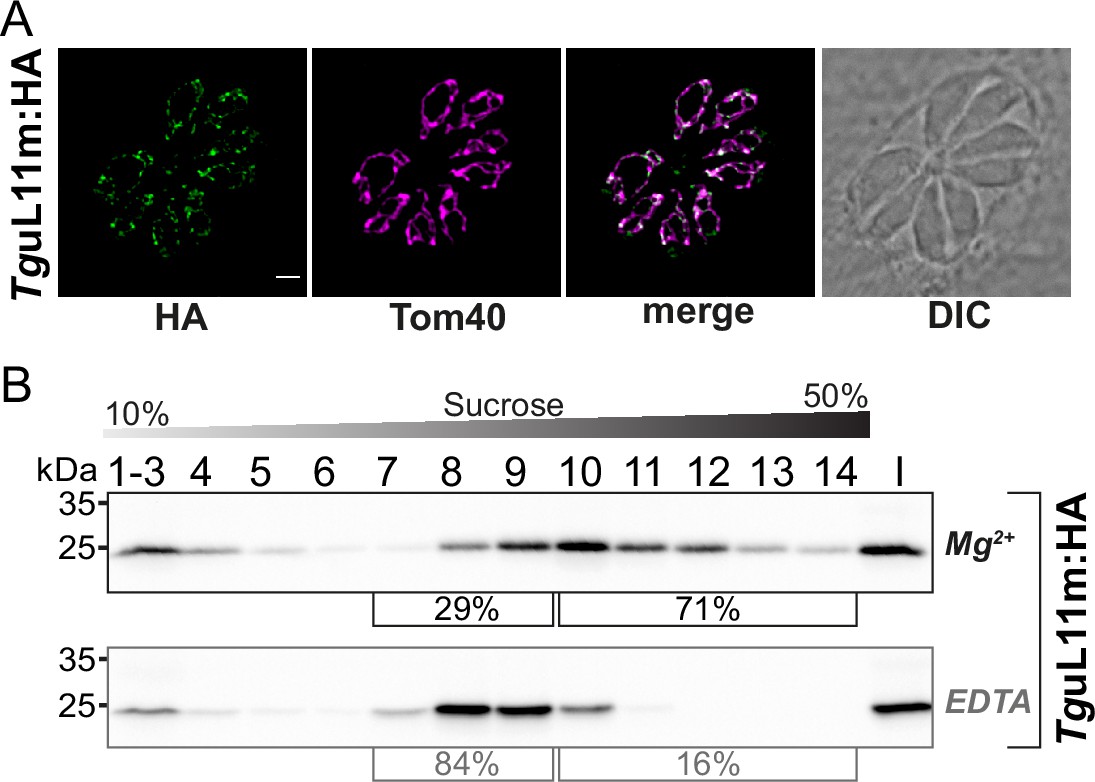
Analysis of the putative mitoribosomal protein L11.
(A) T. gondii parasites expressing TguL11m:HA were subjected to immunofluorescence assays. These assays were conducted using an anti-HA antibody, visualized in the green channel. The mitochondria within these samples were identified using an antibody against the outer membrane protein Tom40, shown in the magenta channel. (B) For the analysis of HA-tagged mitochondrial ribosomal protein L11 (TguL11m:HA), sucrose density centrifugation was employed. Organelle-enriched extracts from T. gondii lines were either untreated (Mg2+) or treated with EDTA. Subsequently, these extracts were fractionated via a sucrose gradient. The fractions obtained were analyzed using SDS-PAGE, followed by immunoblot analysis. TguL11m:HA was detected using an antibody against HA. Percentages in square brackets show the proportion of signal detected in fractions 7–9 versus signal intensity in fractions 10–14. 'I' indicates 10% of the input material for the centrifugation.
-
Figure 8—source data 1
Raw blot images.
Uncropped immunoblots accompanied by images indicating the areas shown in Figure 8B with a red rectangle. In addition, raw scan images and light image overlays depicting the membrane outline are provided.
- https://cdn.elifesciences.org/articles/95407/elife-95407-fig8-data1-v2.zip
Figure 8—figure supplement 1
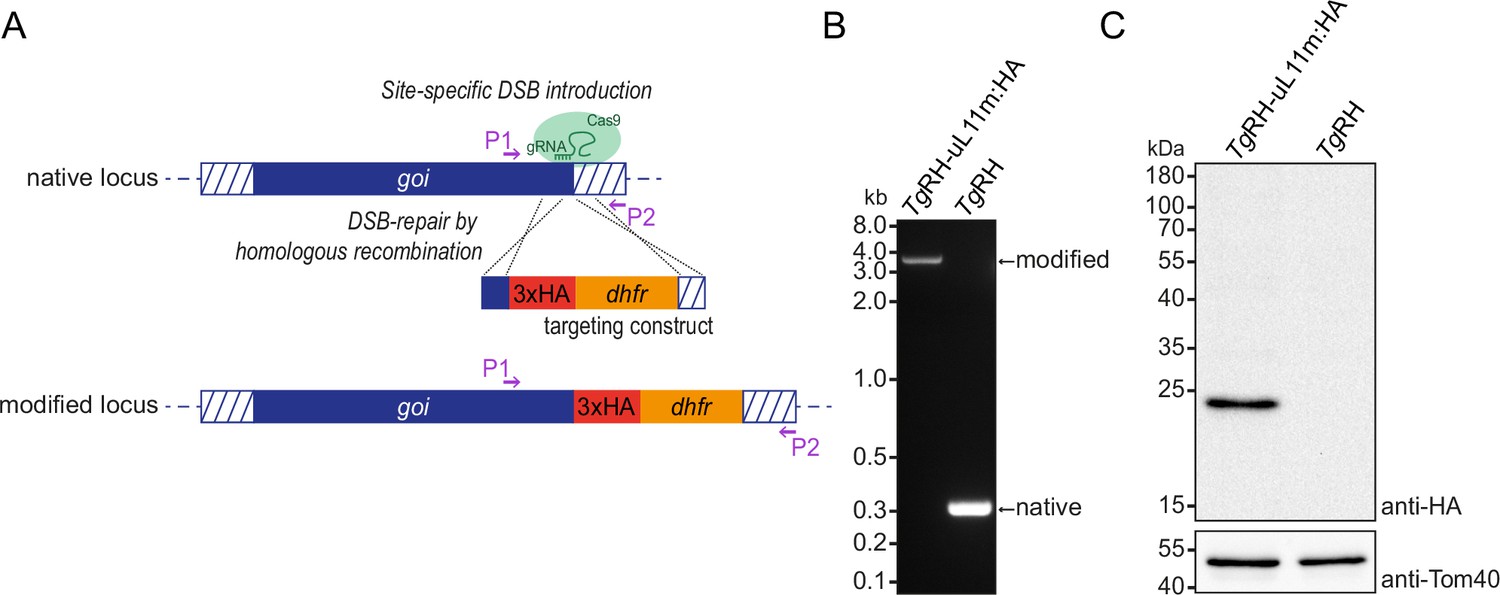
Generation of a tagged ribosomal protein TgRH-uL11mHA.
(A) The 3’ replacement sequence consists of homologous regions to the gene of interest, here TgRH-uL11mHA, and includes the HA-tag in frame with the reading frame at the native locus as well as the dhfr marker gene. This is introduced via homologous recombination induced by a CRISPR/Cas-mediated double-stranded break in the target sequence to yield the modified locus. (B) A PCR using primers P1 and P2 (see A) on the parental strain TgRH and the modified strain TgRH-uL11mHA demonstrates successful modification of the target locus. (C) An immunoblot analysis of TgRH-uL11m:HA-expressing parasites and parental strain TgRH parasites was performed using an anti-HA antibody and as a loading control, an anti-Tom40 antibody.
-
Figure 8—figure supplement 1—source data 1
Raw gel and blot images.
Uncropped blots and gels accompanied by images indicating the areas shown in Figure 8—figure supplement 1B–C with a red rectangle. In addition, raw scan images are provided. Additionally, for immunoblots light image overlays depicting the membrane outline are provided.
- https://cdn.elifesciences.org/articles/95407/elife-95407-fig8-figsupp1-data1-v2.zip
Additional files
-
Supplementary file 1
Oxford Nanopore sequencing technology (ONT) sequencing mapping statistics on nuclear and organellar genomes.
- https://cdn.elifesciences.org/articles/95407/elife-95407-supp1-v2.docx
-
Supplementary file 2
Read length distribution of T. gondii mitochondrial Oxford Nanopore sequencing technology (ONT) reads.
- https://cdn.elifesciences.org/articles/95407/elife-95407-supp2-v2.docx
-
Supplementary file 3
Mitochondrial sequence block frequencies in Oxford Nanopore sequencing technology (ONT) DNA sequencing data.
- https://cdn.elifesciences.org/articles/95407/elife-95407-supp3-v2.docx
-
Supplementary file 4
Sequence block combinations identified in T. gondii mitochondrial Oxford Nanopore sequencing technology (ONT) reads using a custom R script.
Combinations that were found less than 50 times are considered false positives and shown in gray.
- https://cdn.elifesciences.org/articles/95407/elife-95407-supp4-v2.docx
-
Supplementary file 5
Fraction of reads containing full-length open reading frames.
- https://cdn.elifesciences.org/articles/95407/elife-95407-supp5-v2.docx
-
Supplementary file 6
Mapping statistics of the RNA-seq data on the different genomes/sequence blocks.
After filtering the raw reads against the nuclear rRNA genes, the remaining reads were mapped against the three subgenomes of T. gondii RH-88.
- https://cdn.elifesciences.org/articles/95407/elife-95407-supp6-v2.docx
-
Supplementary file 7
List of mitochondrial non-coding RNAs identified by small RNA (sRNA) sequencing.
- https://cdn.elifesciences.org/articles/95407/elife-95407-supp7-v2.docx
-
Supplementary file 8
Overview of mitochondrial non-coding RNAs identified in P. falciparum.
- https://cdn.elifesciences.org/articles/95407/elife-95407-supp8-v2.docx
-
Supplementary file 9
List of oligonucleotides used in this study.
- https://cdn.elifesciences.org/articles/95407/elife-95407-supp9-v2.docx
-
MDAR checklist
- https://cdn.elifesciences.org/articles/95407/elife-95407-mdarchecklist1-v2.pdf
Download links
A two-part list of links to download the article, or parts of the article, in various formats.
Downloads (link to download the article as PDF)
Open citations (links to open the citations from this article in various online reference manager services)
Cite this article (links to download the citations from this article in formats compatible with various reference manager tools)
Small RNAs from mitochondrial genome recombination sites are incorporated into T. gondii mitoribosomes
eLife 13:e95407.
https://doi.org/10.7554/eLife.95407


