PI3K/HSCB axis facilitates FOG1 nuclear translocation to promote erythropoiesis and megakaryopoiesis
- Key Laboratory of Molecular Epigenetics of the Ministry of Education, Northeast Normal University, China
- School of Chemistry, Northeast Normal University, China
- School of Life Science, Northeast Normal University, China
Figures
Figure 1 with 2 supplements
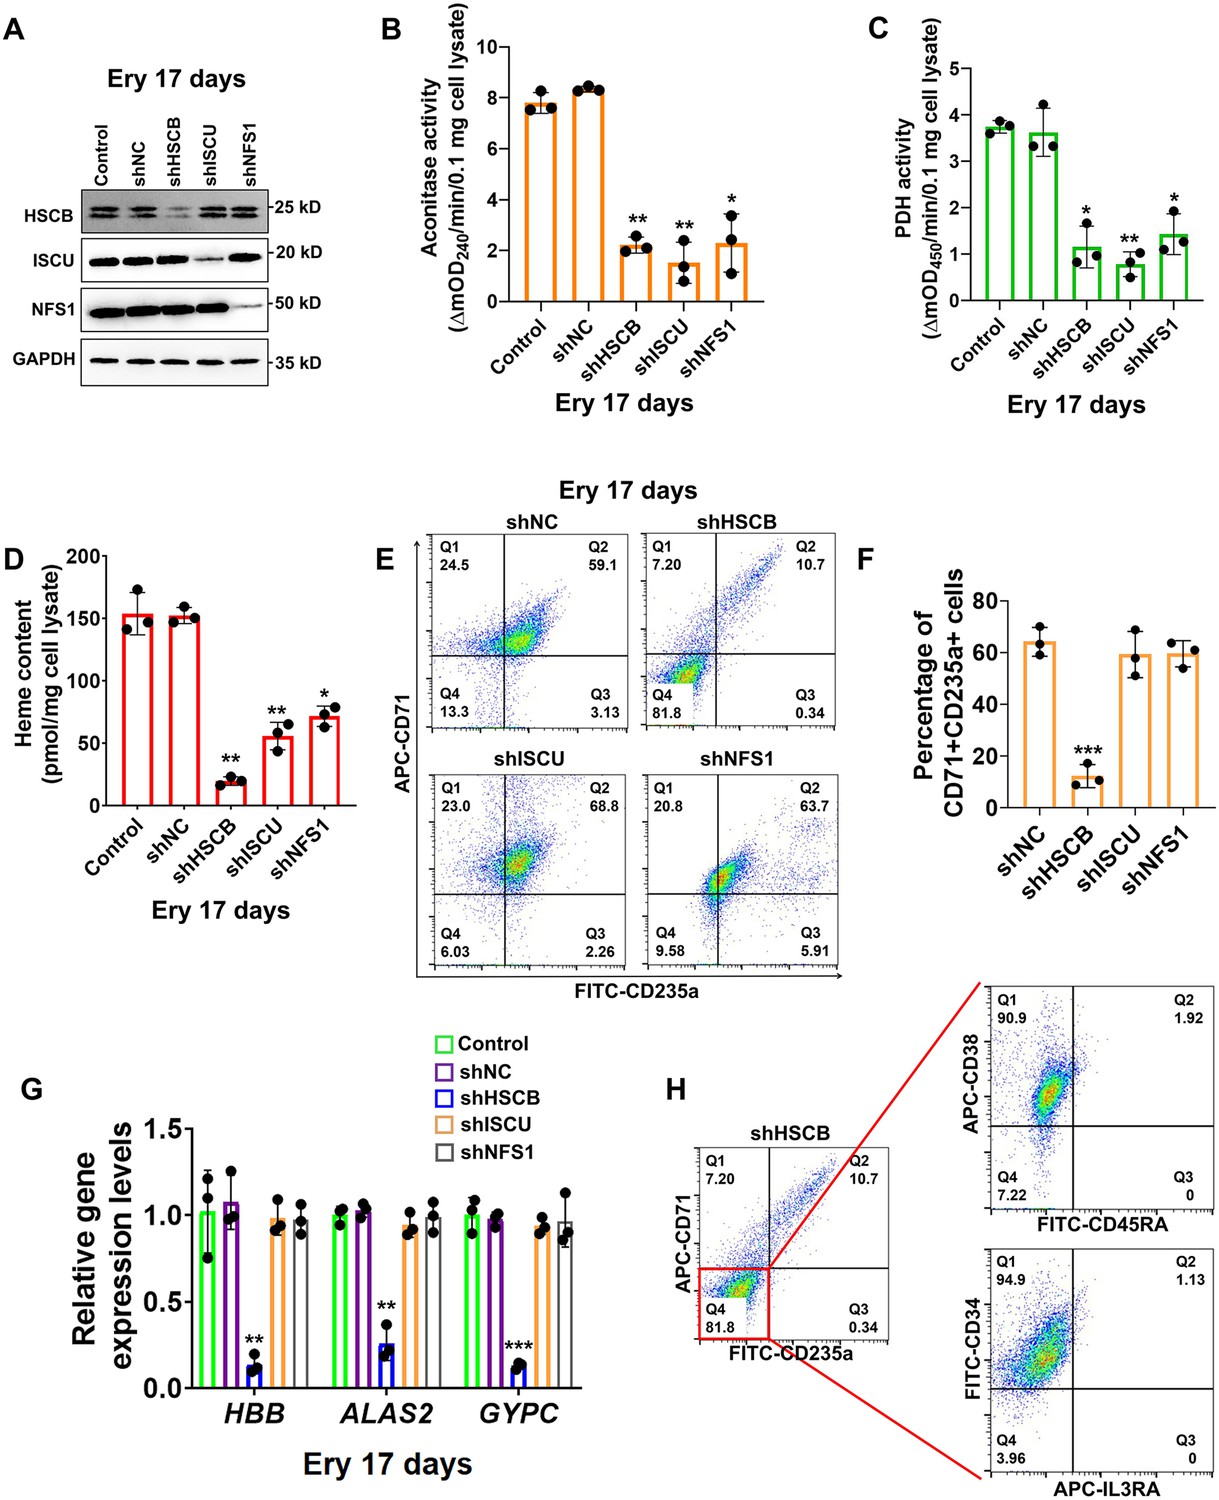
Heat shock cognate B (HSCB) played an important iron–sulfur cluster (ISC) delivery independent function during erythropoiesis of CD34+CD90+hematopoietic stem cells (HSCs).
(A) Western blotting analyses on Ery 17 days verified the efficacy of short hairpin RNA (shRNA) knockdown maintained throughout the experimental period. (B) Aconitase activity, (C) pyruvate dehydrogenase (PDH) activity, and (D) heme content of the shHSCB, shISCU, and shNFS1 groups were significantly lower than those of the shNC group, indicating inhibited ISC biogenesis in the shHSCB, shISCU, and shNFS1 groups. (E) Representative flow cytometry scatter plots and (F) statistics of three biologically independent flow cytometry assays displaying the percentages of CD71+CD235a+progenitors in the shNC, shHSCB, shISCU, and shNFS1 groups. (G) Quantitative real-time PCR (qRT-PCR) analyses of the mRNA levels of HBB, ALAS2, and GYPC genes for the shNC, shHSCB, shISCU, and shNFS1 groups. The flow cytometry and qRT-PCR results, respectively, signified significantly decreased percentages of CD71+CD235a+progenitors and significantly lower mRNA levels of the erythroid-specific genes in the shHSCB group compared with the shNC group, revealing inhibited erythropoiesis of the shHSCB group of Ery 17 days. (H) Flow cytometry scatter plots showing that the majority of CD71−CD235a− cells from the shHSCB group were CD34+CD38+CD45RA−IL3RA−. Error bars denote standard deviations; *, **, and ***, respectively, denote p values less than 0.05, 0.01, and 0.001 relative to the shNC groups, two-sided Student’s t test.
-
Figure 1—source data 1
Labeled and raw Western blots for Figure 1A.
- https://cdn.elifesciences.org/articles/95815/elife-95815-fig1-data1-v1.zip
Figure 1—figure supplement 1
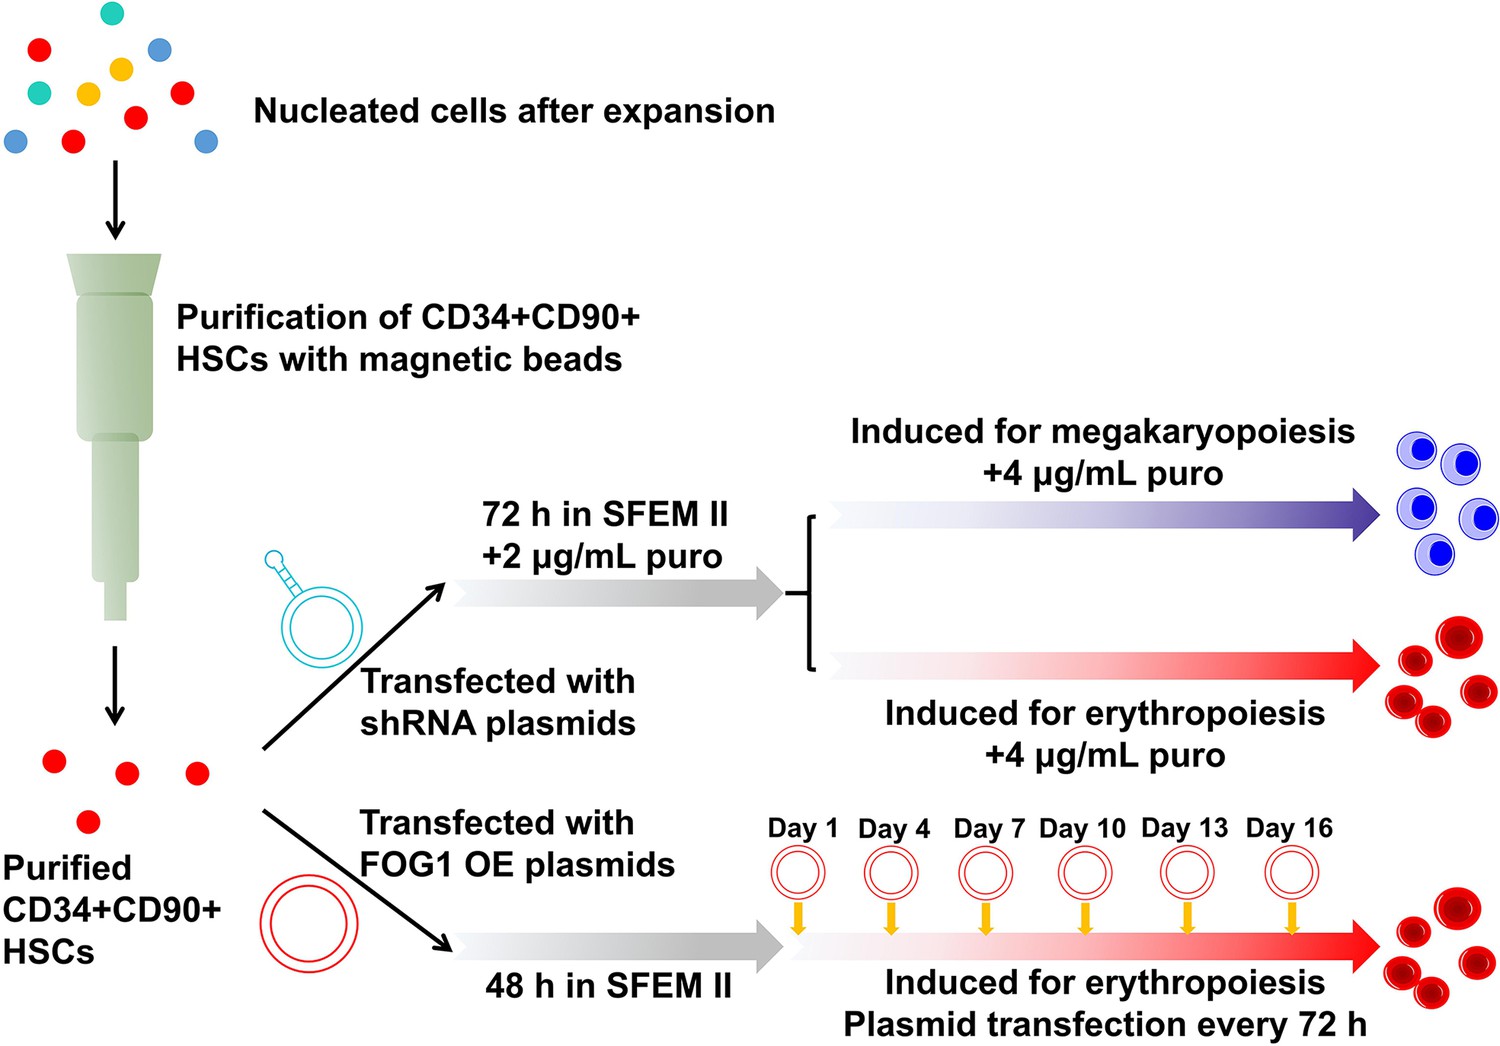
A schematic diagram for work flows of gene knockdown and overexpression experiments in CD34+CD90+HSCs and the downstream progenitors.
Figure 1—figure supplement 2
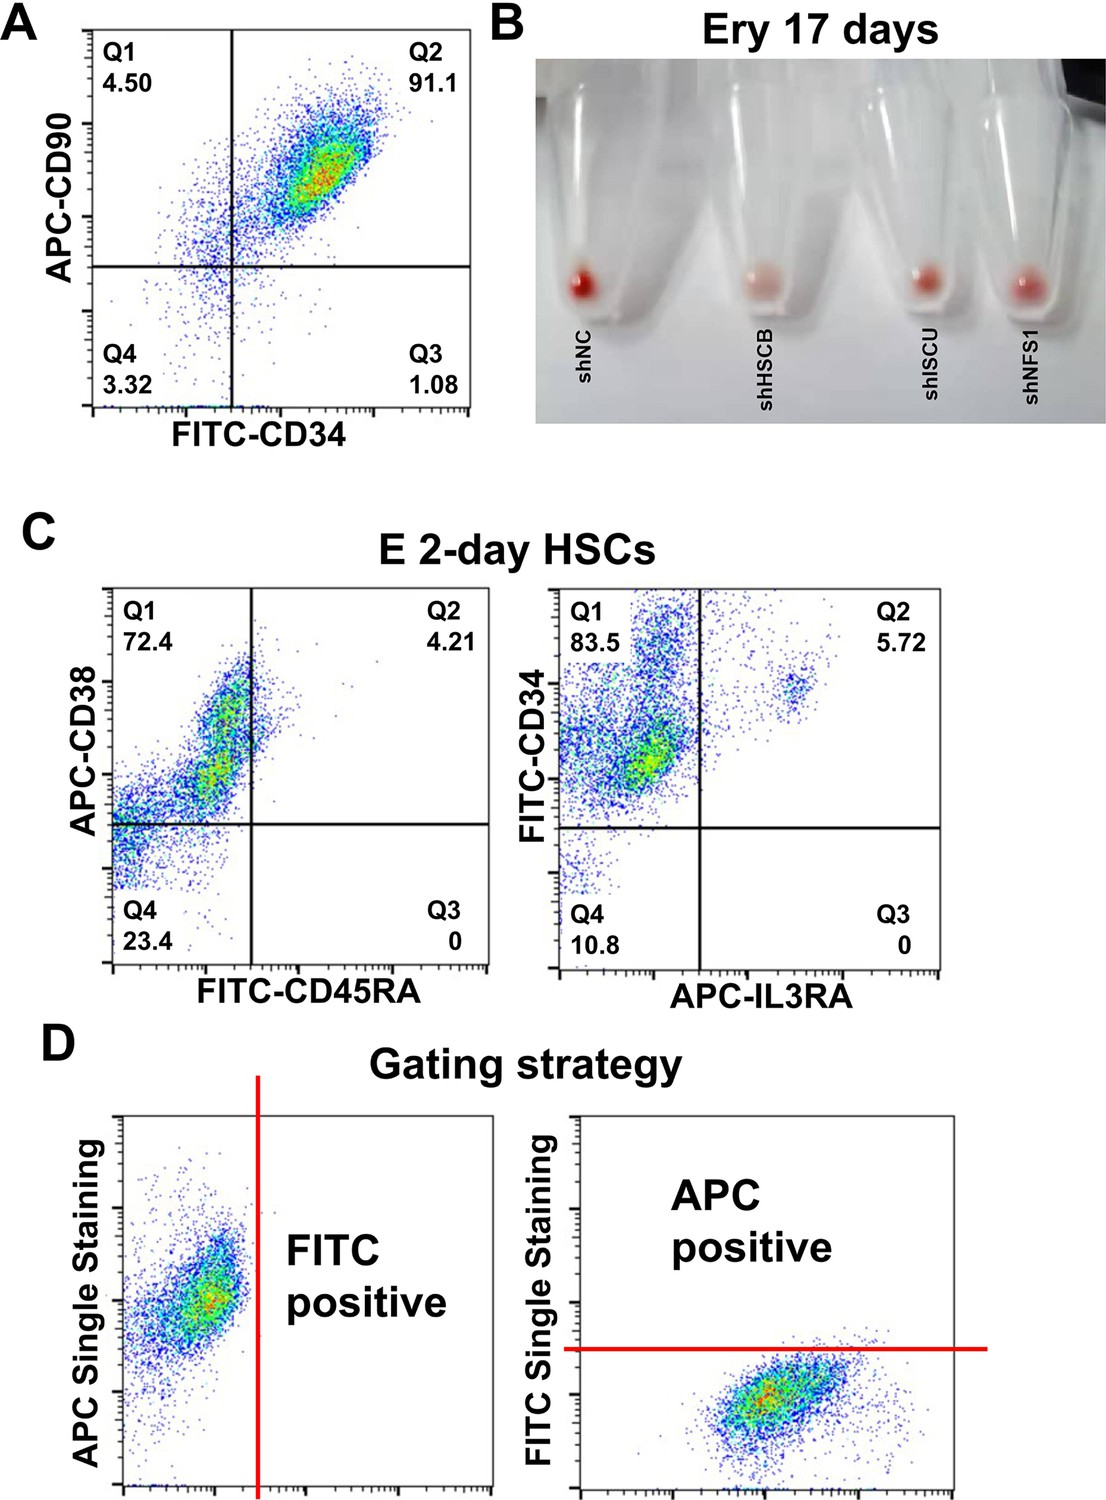
Characterization of CD34+CD90+HSCs before and after induction for erythropoiesis.
(A) Flow cytometry scatter plots showing the high purity of CD34+CD90+HSCs after cell sorting. (B) Photographs showing the color of pellets from 106 cells for the shNC, shHSCB, shISCU, and shNFS1 groups of Ery 17 days. (C) Flow cytometry scatter plots showing that the majority of E 2-day hematopoietic stem cells (HSCs) were CD34+CD38+CD45RA−IL3RA−. (D) Flow cytometry gating strategy for cell populations.
Figure 2
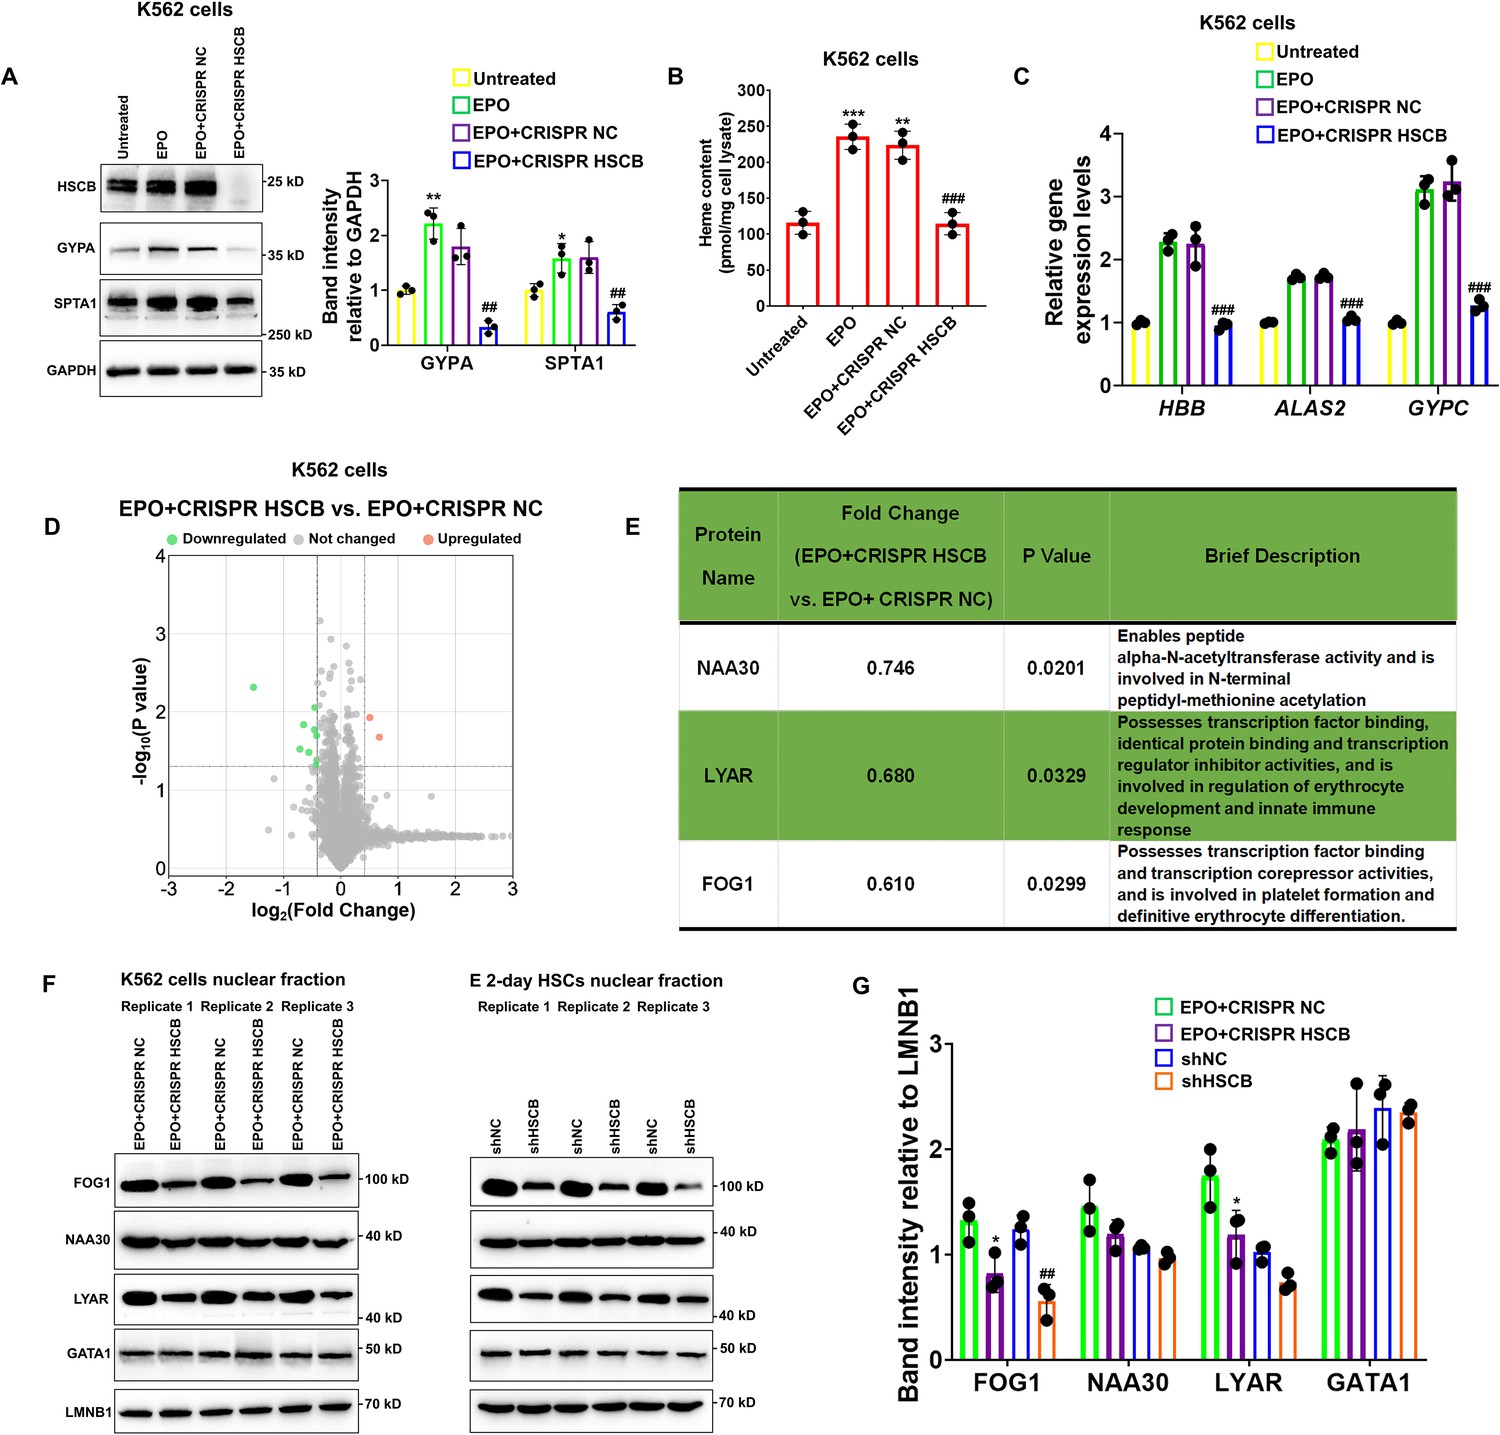
Knockout of heat shock cognate B (HSCB) with the CRISPR–Cas9 technique impaired erythropoietin (EPO)-induced erythropoiesis of K562 cells.
(A) Western blotting analyses exhibited successful knockout of HSCB and decreased levels of erythrocyte membrane proteins (GYPA and SPTA1) in the EPO+CRISPR HSCB K562 cells. Error bars denote standard deviations; * and **, respectively, signify p values less than 0.05 and 0.01 compared with the Untreated group, while ## means p < 0.01 relative to the EPO+CRISPR NC group, two-sided Student’s t test. (B) Heme contents and (C) mRNA levels of the erythroid-specific genes were significantly lower in the EPO+CRISPR HSCB group than in the EPO+CRISPR NC group. Error bars denote standard deviations; ** and ***, respectively, represent p values less than 0.01 and 0.001 compared with the Untreated group, while ### means p < 0.001 relative to the EPO+CRISPR NC group, two-sided Student’s t test. (D) A volcano plot for the differentially expressed nuclear proteins (DENPs) detected by tandem mass tag-based mass spectrometry (TMT-MS) assays and (E) detailed information of the bona fide DENPs between the EPO+CRISPR NC and EPO+CRISPR HSCB groups. (F) Western blotting and (G) the corresponding band intensity analyses for FOG1, NAA30, LYAR, and GATA1 proteins in the nuclear fractions of the EPO+CRISPR NC and EPO+CRISPR HSCB K562 cells and shNC and shHSCB E 2-day HSCs. Friend of GATA1 (FOG1) was identified as the only nuclear protein expressed at significantly different levels in both K562 cells and E 2-day HSCs after HSCB knockout or knockdown. Error bars denote standard deviations; * represents p < 0.05 relative to the EPO+CRISPR NC group, while ## means p < 0.01 compared with the shNC group, two-sided Student’s t test.
-
Figure 2—source data 1
Labeled and raw Western blots for Figure 2A, F.
- https://cdn.elifesciences.org/articles/95815/elife-95815-fig2-data1-v1.zip
Figure 3
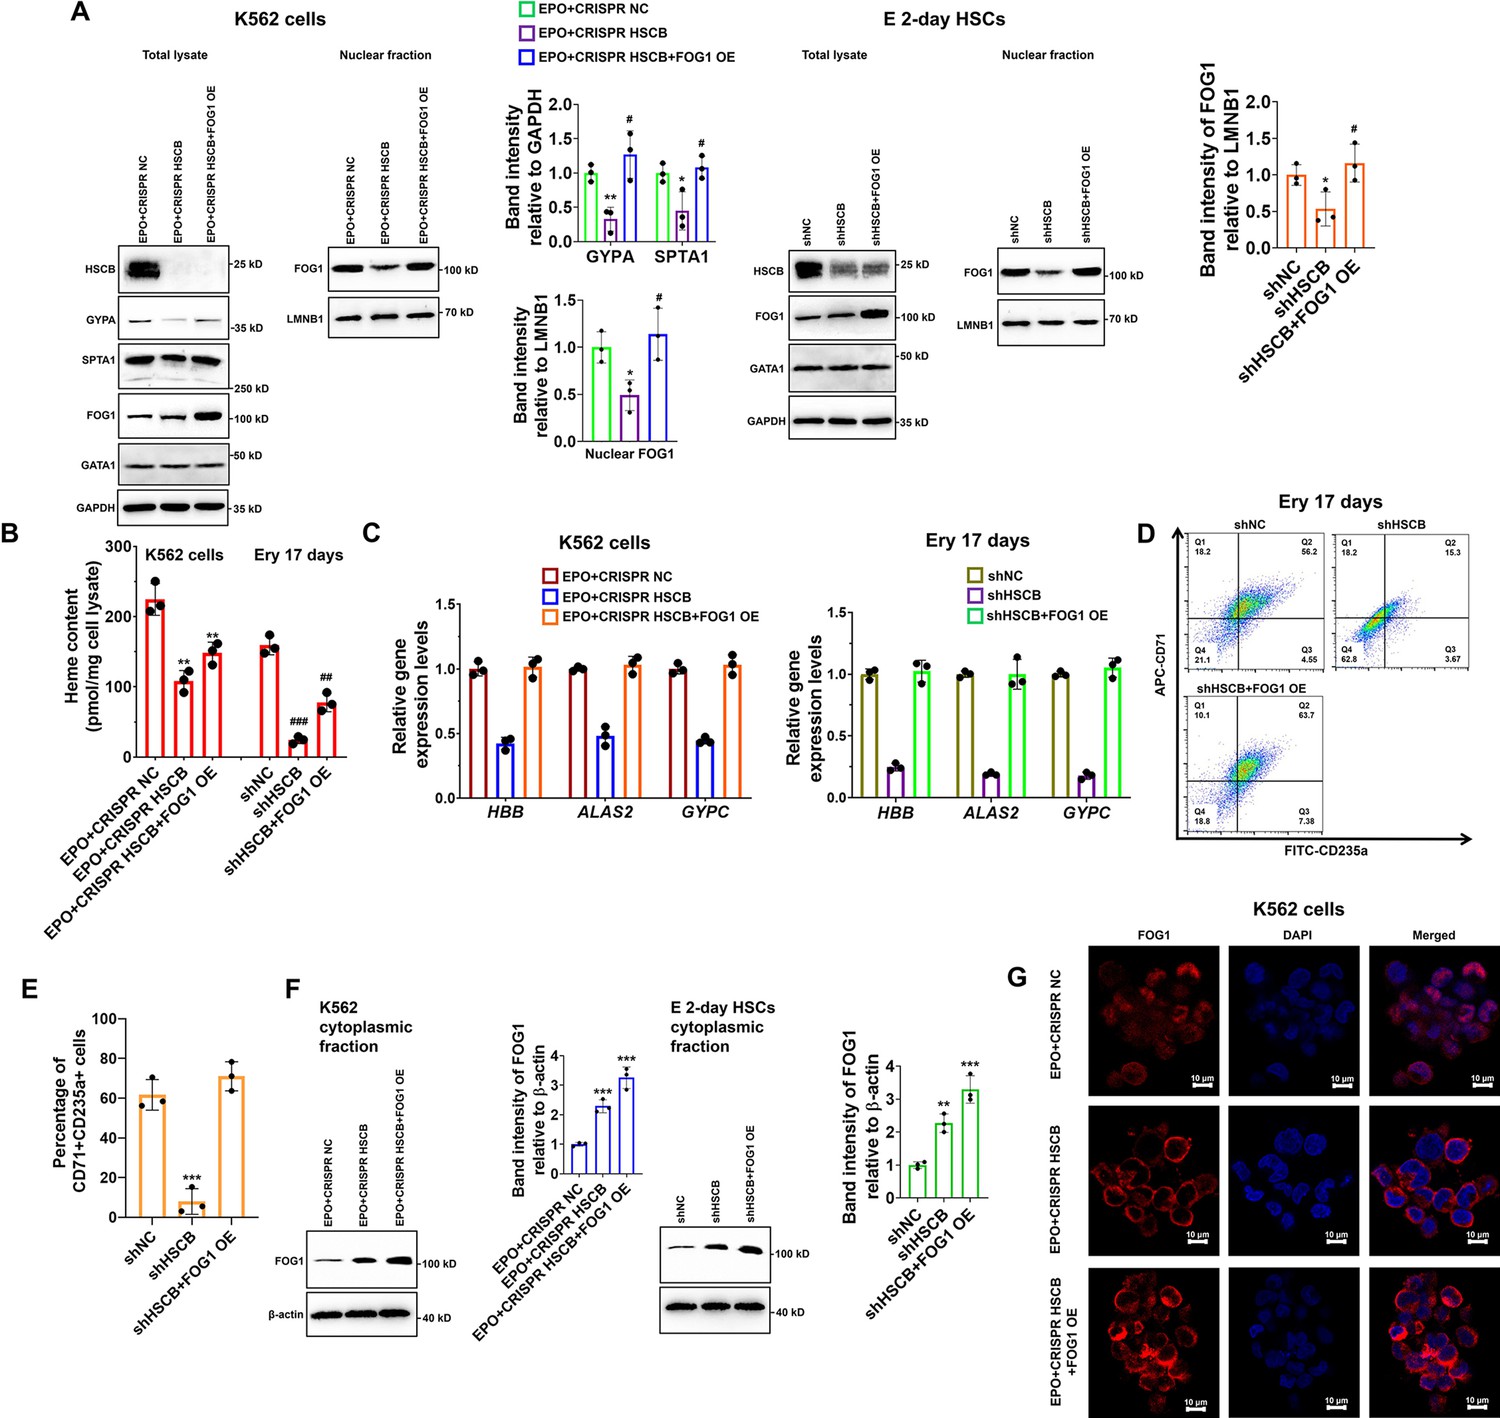
Impaired FOG1 nuclear translocation was responsible for the inhibited erythropoiesis of heat shock cognate B (HSCB)-deficient K562 cells and hematopoietic stem cells (HSCs).
(A) Western blotting analyses indicated that FOG1 overexpression increased the levels of nuclear FOG1 in HSCB-deficient erythropoietin (EPO)-induced K562 cells and E 2-day HSCs, as well as the levels of erythrocyte membrane proteins in HSCB-deficient EPO-induced K562 cells without significantly affecting the expression level of GATA1. Error bars denote standard deviations; * and **, respectively, represent p values less than 0.05 and 0.01 compared with the EPO+CRISPR NC or shNC group, while # denotes p < 0.05 relative to the EPO+CRISPR HSCB or shHSCB group, two-sided Student’s t test. (B) Heme contents in the EPO+CRISPR NC, EPO+CRISPR HSCB and EPO+CRISPR HSCB+FOG1 OE groups of K562 cells, as well as in the shNC, shHSCB, and shHSCB+FOG1 OE groups of Ery 17 days. Error bars denote standard deviations; ** denotes p < 0.01 relative to the EPO+CRISPR NC group, while ## and ###, respectively, represent p values less than 0.01 and 0.001 compared with the shNC group, two-sided Student’s t test. (C) qRT-PCR analyses on HSCB-deficient EPO-induced K562 cells and HSCB-deficient Ery 17 days demonstrated resumed mRNA expression levels of erythroid-specific genes after FOG1 overexpression. (D) Representative flow cytometry scatter plots and (E) statistics of three biologically independent flow cytometry assays showing that the percentages of CD71+CD235a+progenitors among HSCB-deficient Ery 17 days recovered after FOG1 overexpression. Error bars denote standard deviations; *** signifies p < 0.001 relative to the shNC group, two-sided Student’s t test. (F) Western blotting analyses of cytoplasmic FOG1 and (G) immunofluorescence (IF) assays for FOG1 revealed inhibited FOG1 nuclear translocation in HSCB-deficient EPO-induced K562 cells and E 2-day HSCs (scale bars = 10 μm). Error bars denote standard deviations; ** and *** in panel (F), respectively, represent p values less than 0.01 and 0.001 compared with the EPO+CRISPR NC or shNC group, two-sided Student’s t test.
-
Figure 3—source data 1
Labeled and raw Western blots for Figure 3A, F.
- https://cdn.elifesciences.org/articles/95815/elife-95815-fig3-data1-v1.zip
Figure 4 with 1 supplement
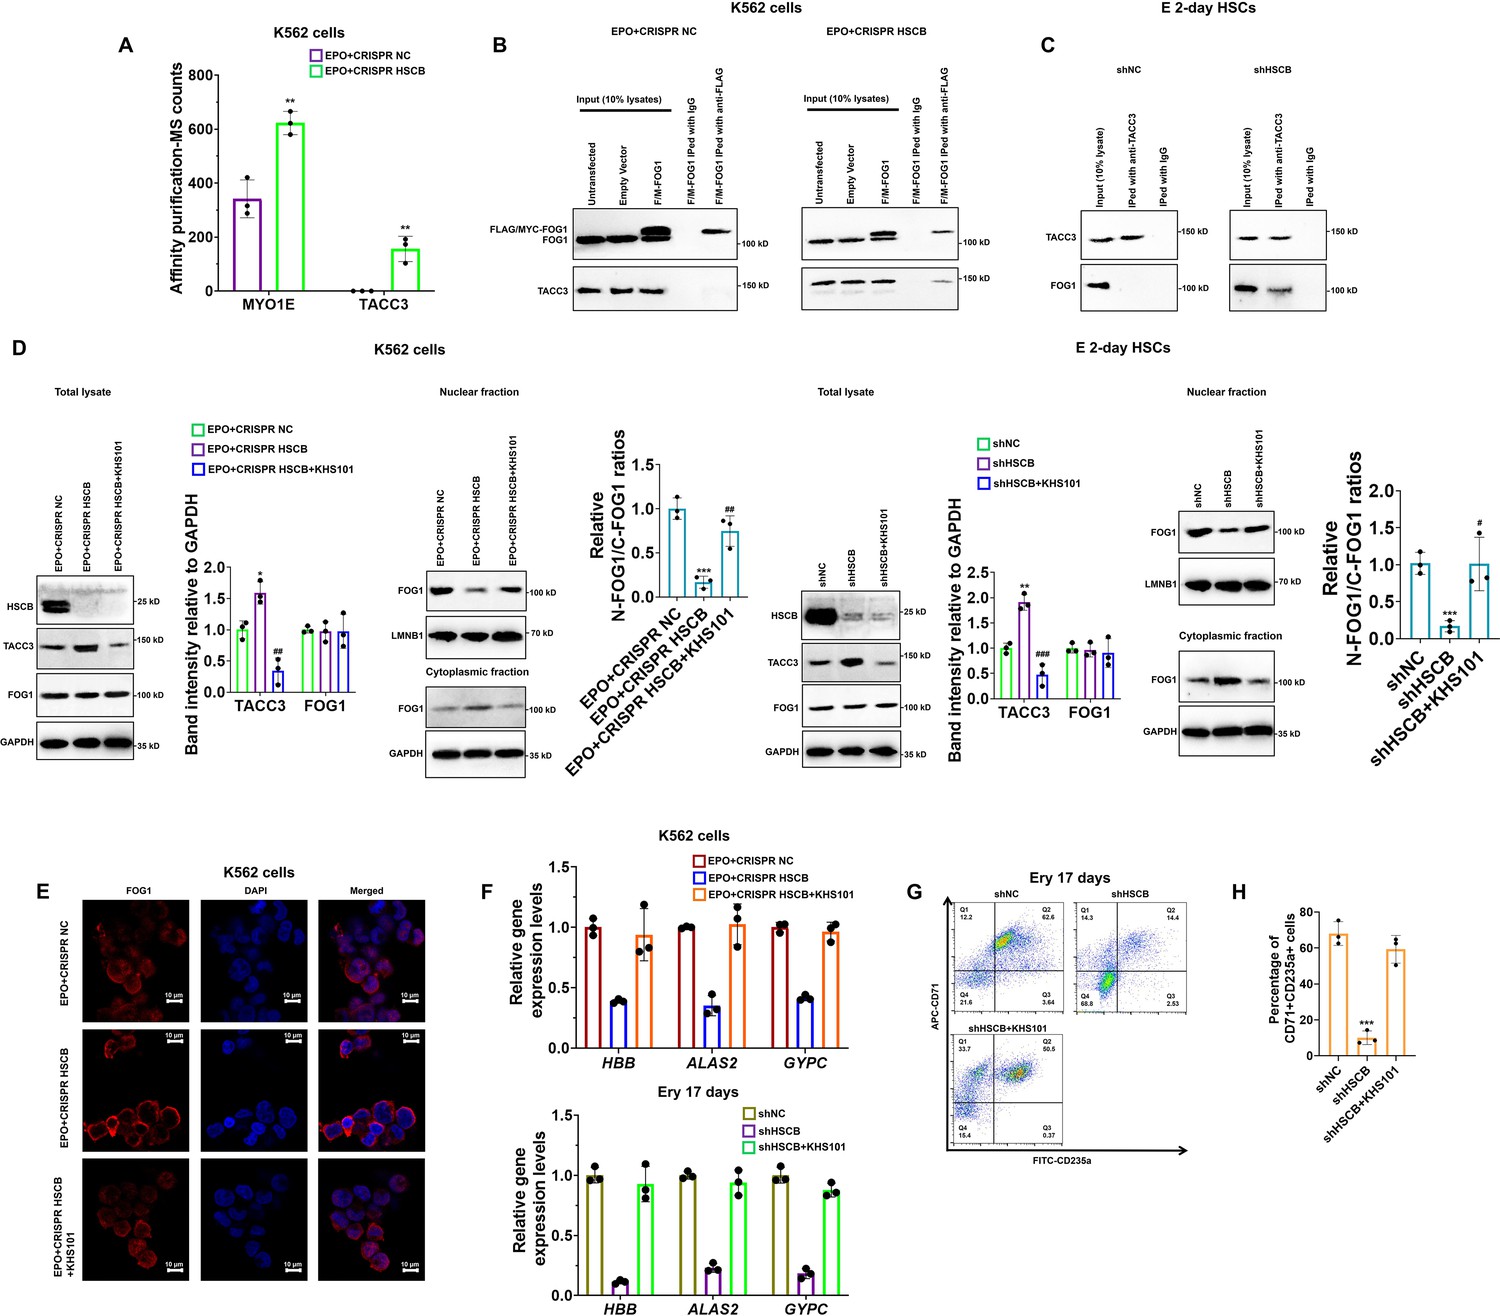
Deficiency of heat shock cognate B (HSCB) blocked FOG1 nuclear translocation by enhancing its interaction with transforming acidic coiled-coil containing protein 3 (TACC3).
(A) A histogram showing the two differential binding proteins (DBPs) of FOG1 between the EPO+CRISPR NC and EPO+CRISPR HSCB groups. Error bars denote standard deviations; ** signifies p < 0.01 compared with the EPO+CRISPR NC group, two-sided Student’s t test. Co-immunoprecipitation (co-IP) assays in (B) K562 cells and (C) E 2-day hematopoietic stem cells (HSCs) indicated that HSCB deficiency promoted the binding between FOG1 and TACC3. (D) Western blotting analyses on K562 cells and E 2-day HSCs and (E) immunofluorescence (IF) assays on K562 cells revealed that treatment with KHS101, a small-molecule inhibitor that could reduce the activity and protein abundance of TACC3, decreased TACC3 protein levels and increased relative nuclear FOG1 (N-FOG1) to cytoplasmic FOG1 (C-FOG1) ratios. Scale bars for IF assays indicate 10 μm. Error bars denote standard deviations; * and ** in panel (D), respectively, denote p values less than 0.05 and 0.01 compared with the EPO+CRISPR NC or shNC group, while #, ##, and ### , respectively, mean p < 0.05, p < 0.01, and p < 0.001 relative to the EPO+CRISPR HSCB or shHSCB group, two-sided Student’s t test. (F) qRT-PCR analyses on HSCB-deficient erythropoietin (EPO)-induced K562 cells and HSCB-deficient Ery 17 days demonstrated recovered mRNA expression levels of erythroid-specific genes after KHS101 treatment. (G) Representative flow cytometry scatter plots and (H) statistics of three biologically independent flow cytometry assays showing that the percentages of CD71+CD235a+progenitors among HSCB-deficient Ery 17 days recovered after KHS101 treatment. Error bars denote standard deviations; *** means p < 0.001 compared with the shNC group, two-sided Student’s t test.
-
Figure 4—source data 1
Labeled and raw Western blots for Figure 4B–D.
- https://cdn.elifesciences.org/articles/95815/elife-95815-fig4-data1-v1.zip
Figure 4—figure supplement 1
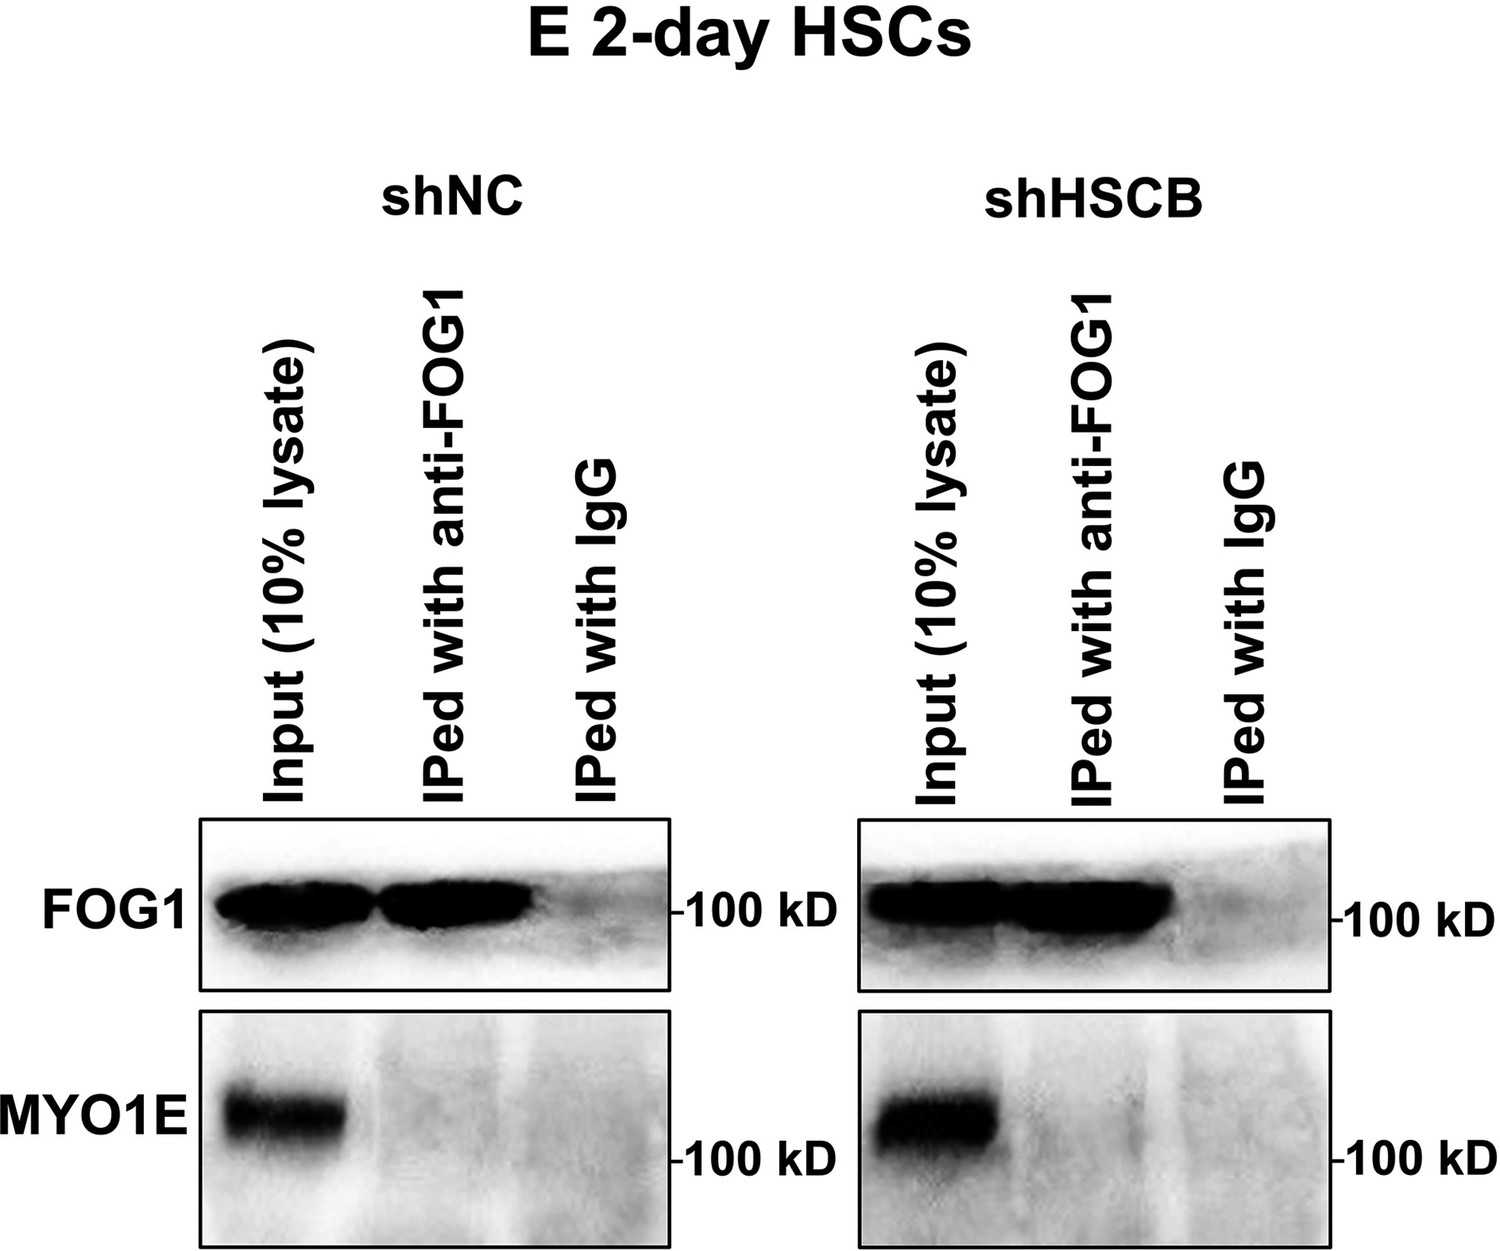
Co-immunoprecipitation (co-IP) assays detected no interaction between FOG1 and MYO1E in the shNC and shHSCB groups of E 2-day hematopoietic stem cells (HSCs).
-
Figure 4—figure supplement 1—source data 1
Labeled and raw Western blots for Figure 4—figure supplement 1.
- https://cdn.elifesciences.org/articles/95815/elife-95815-fig4-figsupp1-data1-v1.zip
Figure 5
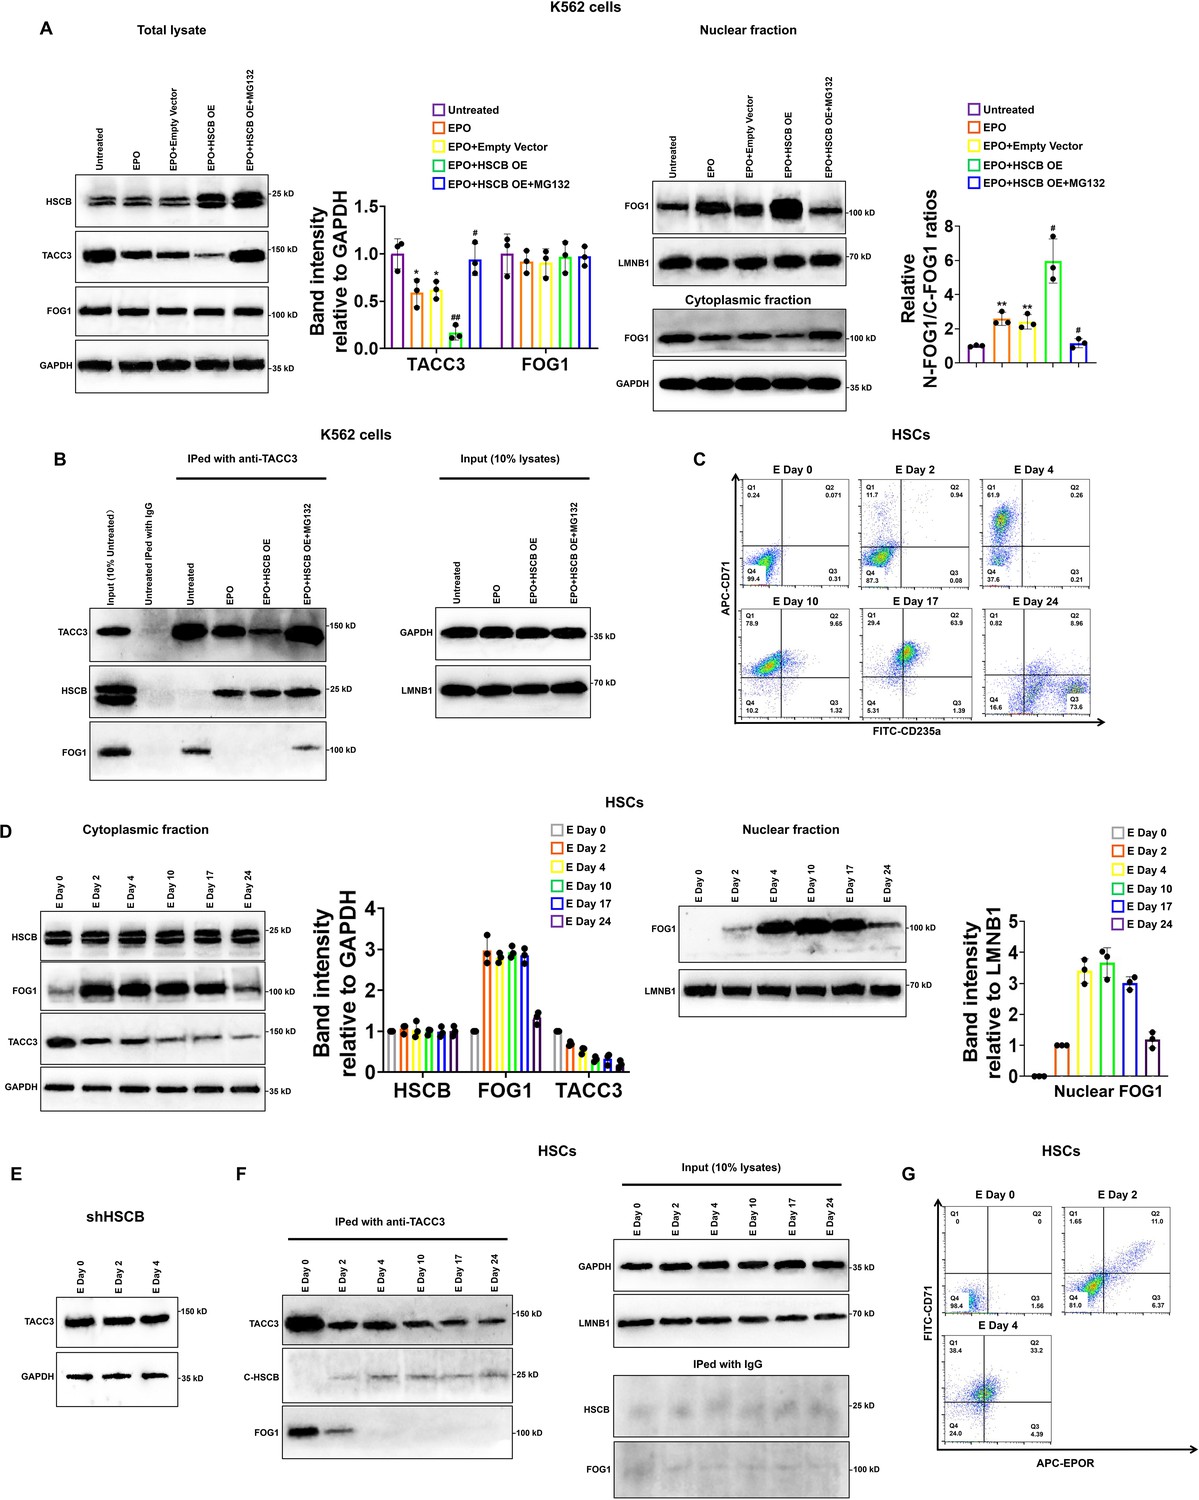
Heat shock cognate B (HSCB) bound with and mediated the proteasomal degradation of TACC3 to facilitate FOG1 nuclear translocation upon erythropoietin (EPO)/erythropoietin receptor (EPOR) signaling activation.
(A) Western blotting analyses indicated that EPO treatment decreased the level of TACC3 and increased the relative N-FOG1/C-FOG1 ratio, HSCB overexpression augmented the effects of EPO treatment on the protein level of TACC3 and FOG1 nuclear translocation, whereas treatment with the proteasome inhibitor MG132 abrogated the effects of EPO treatment + HSCB overexpression on the protein level of TACC3 and FOG1 nuclear translocation. Error bars denote standard deviations; * and **, respectively, represent p values less than 0.05 and 0.01 compared with the Untreated group, while # and ##, respectively, mean p < 0.05 and p < 0.01 relative to the EPO+Empty Vector group, two-sided Student’s t test. (B) Co-immunoprecipitation (co-IP) results showing that TACC3 interacted with HSCB when the K562 cells were treated with EPO, whereas it interacted with FOG1 in the untreated and EPO+HSCB OE + MG132 K562 cells. (C) Flow cytometry scatter plots exhibiting the levels of CD71 and CD235a on the cell surface of CD34+CD90+HSCs induced for erythropoiesis for 0, 2, 4, 10, 17, and 24 days. The flow cytometry analyses were repeated twice with similar findings to ensure reproducibility. (D) Western blotting analyses of the levels of cytoplasmic FOG1, TACC3, and nuclear FOG1 in CD34+CD90+HSCs induced for erythropoiesis for 0, 2, 4, 10, 17, and 24 days. (E) Western blotting analyses of the level of TACC3 in HSCB-deficient HSCs induced for erythropoiesis for 0, 2, and 4 days. (F) Co-IP analyses of the binding affinities of TACC3 with HSCB and FOG1 in CD34+CD90+HSCs induced for erythropoiesis for 0, 2, 4, 10, 17, and 24 days. (G) Flow cytometry scatter plots showing the levels of CD71 and EPOR on the cell surface of CD34+CD90+HSCs induced for erythropoiesis for 0, 2, and 4 days. The Western blotting, co-IP, and flow cytometry data highlighted that the EPO/EPOR signaling was indispensable for the functionalization of HSCB in CD34+CD90+HSCs induced for erythropoiesis.
-
Figure 5—source data 1
Labeled and raw Western blots for Figure 5A, B, D–F.
- https://cdn.elifesciences.org/articles/95815/elife-95815-fig5-data1-v1.zip
Figure 6 with 2 supplements
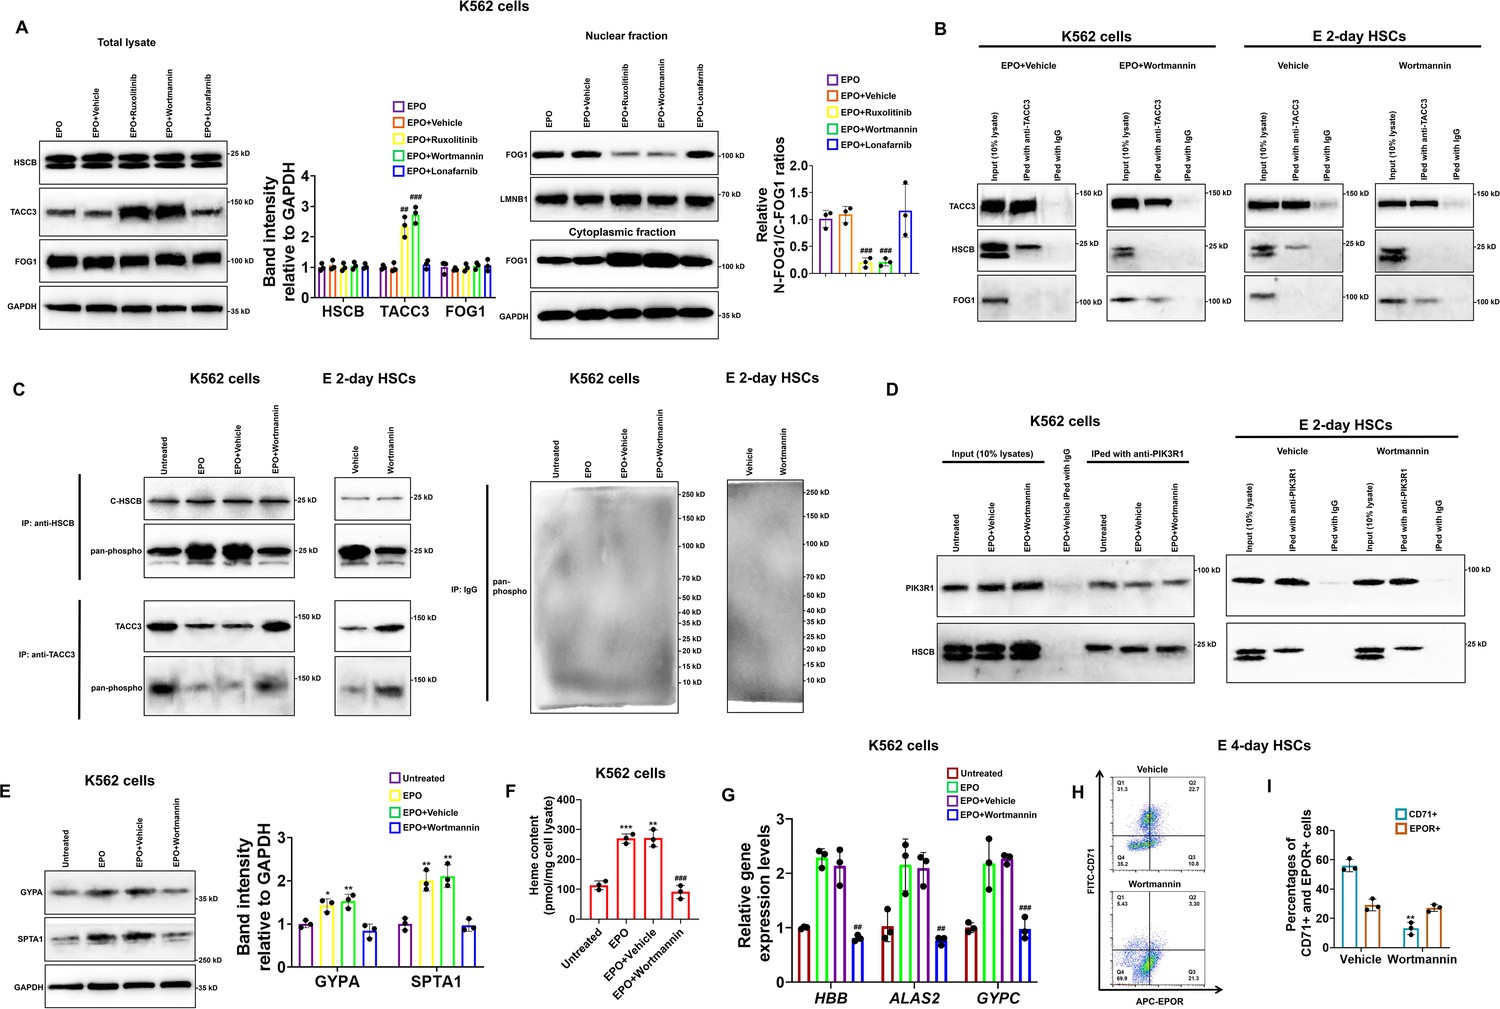
Heat shock cognate B (HSCB) phosphorylation by phosphoinositol-3-kinase (PI3K) was necessary for its functionalization during erythropoiesis of K562 cells and CD34+CD90+HSCs.
(A) Western blotting analyses demonstrated that treatment with ruxolitinib and wortmannin, which are, respectively, inhibitors against Janus tyrosine kinase 2 (JAK2) and PI3K, increased the protein level of TACC3 and decreased FOG1 nuclear translocation. Error bars denote standard deviations; #, ## , and ###, respectively, mean p < 0.05, p < 0.01, and p < 0.001 relative to the EPO+Vehicle group, two-sided Student’s t test. (B, C) Co-immunoprecipitation (co-IP) assays reflected that wortmannin treatment impaired the interaction between TACC3 and HSCB, promoted the binding between TACC3 and FOG1, and reduced the phosphorylation level of cytosolic HSCB in erythropoietin (EPO)-induced K562 cells and E 2-day hematopoietic stem cells (HSCs). (D) Co-IP experiments verified the physical interaction between cytosolic HSCB and the P85-alpha subunit of PI3K (PIK3R1). (E) Western blotting, (F) heme content, and (G) qRT-PCR assays confirmed that wortmannin treatment inhibited the erythroid differentiation of EPO-induced K562 cells. Error bars denote standard deviations; *, **, and ***, respectively, denote p values less than 0.05, 0.01, and 0.001 relative to the Untreated group, while ## and ###, respectively, represent p values less than 0.01 and 0.001 compared with the EPO+Vehicle group, two-sided Student’s t test. (H) Representative flow cytometry scatter plots and (I) statistics of three biologically independent flow cytometry assays exhibiting significantly reduced percentages of CD71+ cells among E 4-day HSCs in the Wortmannin group. Error bars denote standard deviations; ** means p < 0.01 compared with the Vehicle group, two-sided Student’s t test.
-
Figure 6—source data 1
Labeled and raw Western blots for Figure 6A–E.
- https://cdn.elifesciences.org/articles/95815/elife-95815-fig6-data1-v1.zip
Figure 6—figure supplement 1
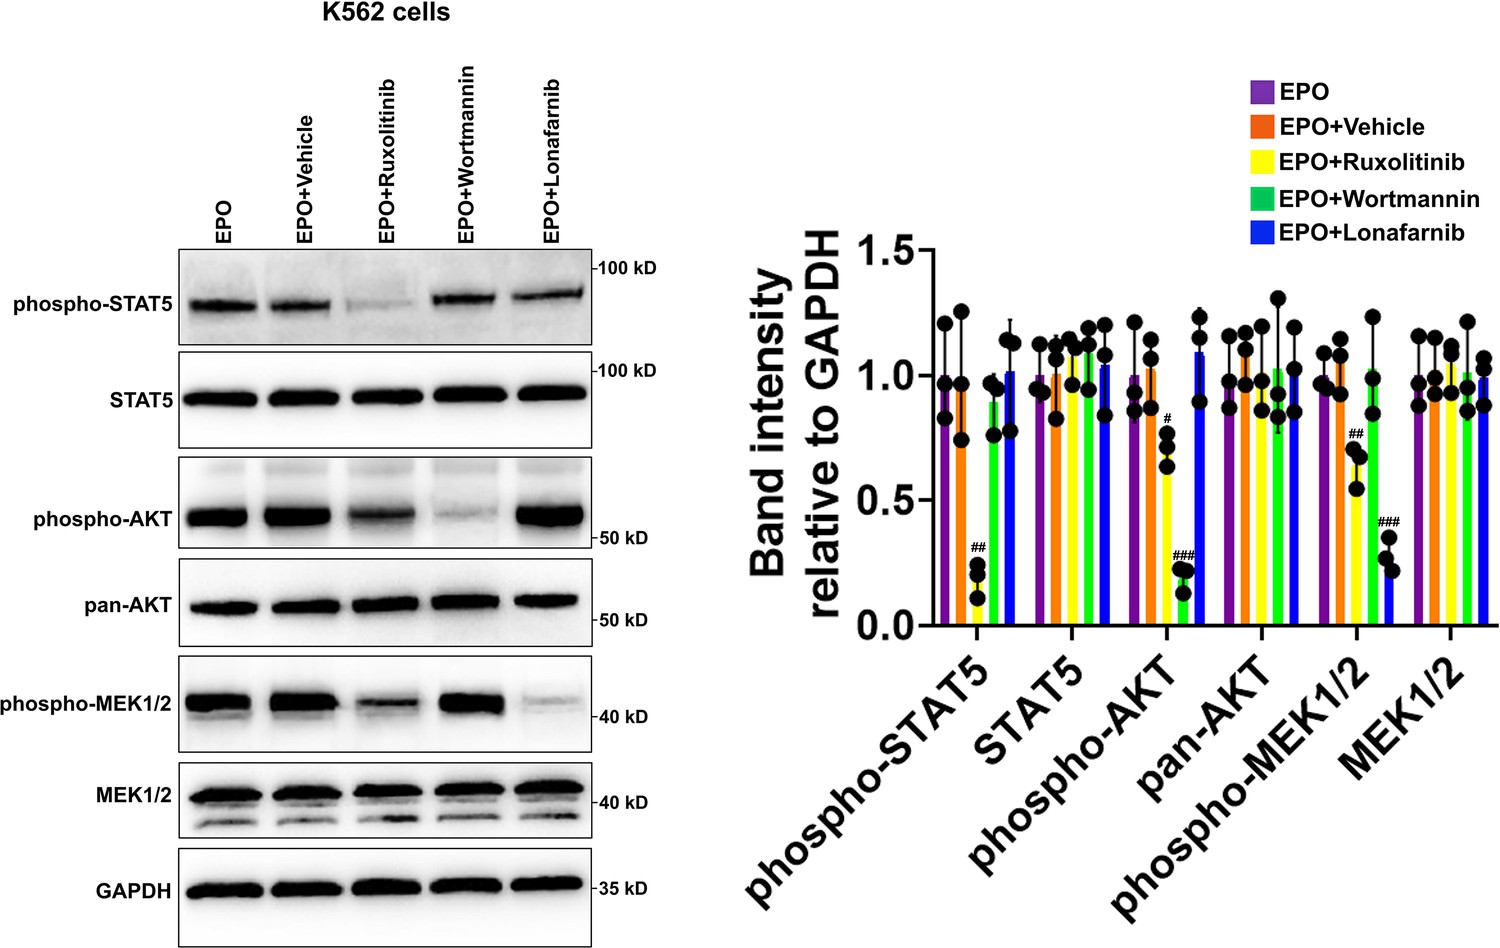
Western blotting data verified the effects of ruxolitinib, wortmannin, and lonafarnib treatments on erythropoietin (EPO)-induced K562 cells.
Scale bars represent standard deviations; #, ##, and ###, respectively, denote p values less than 0.05, 0.01, and 0.001 relative to the EPO+Vehicle group, two-sided Student’s t tests. N = 3 independent biological replicates for this figure.
-
Figure 6—figure supplement 1—source data 1
Labeled and raw Western blots for Figure 6—figure supplement 1.
- https://cdn.elifesciences.org/articles/95815/elife-95815-fig6-figsupp1-data1-v1.zip
Figure 6—figure supplement 2
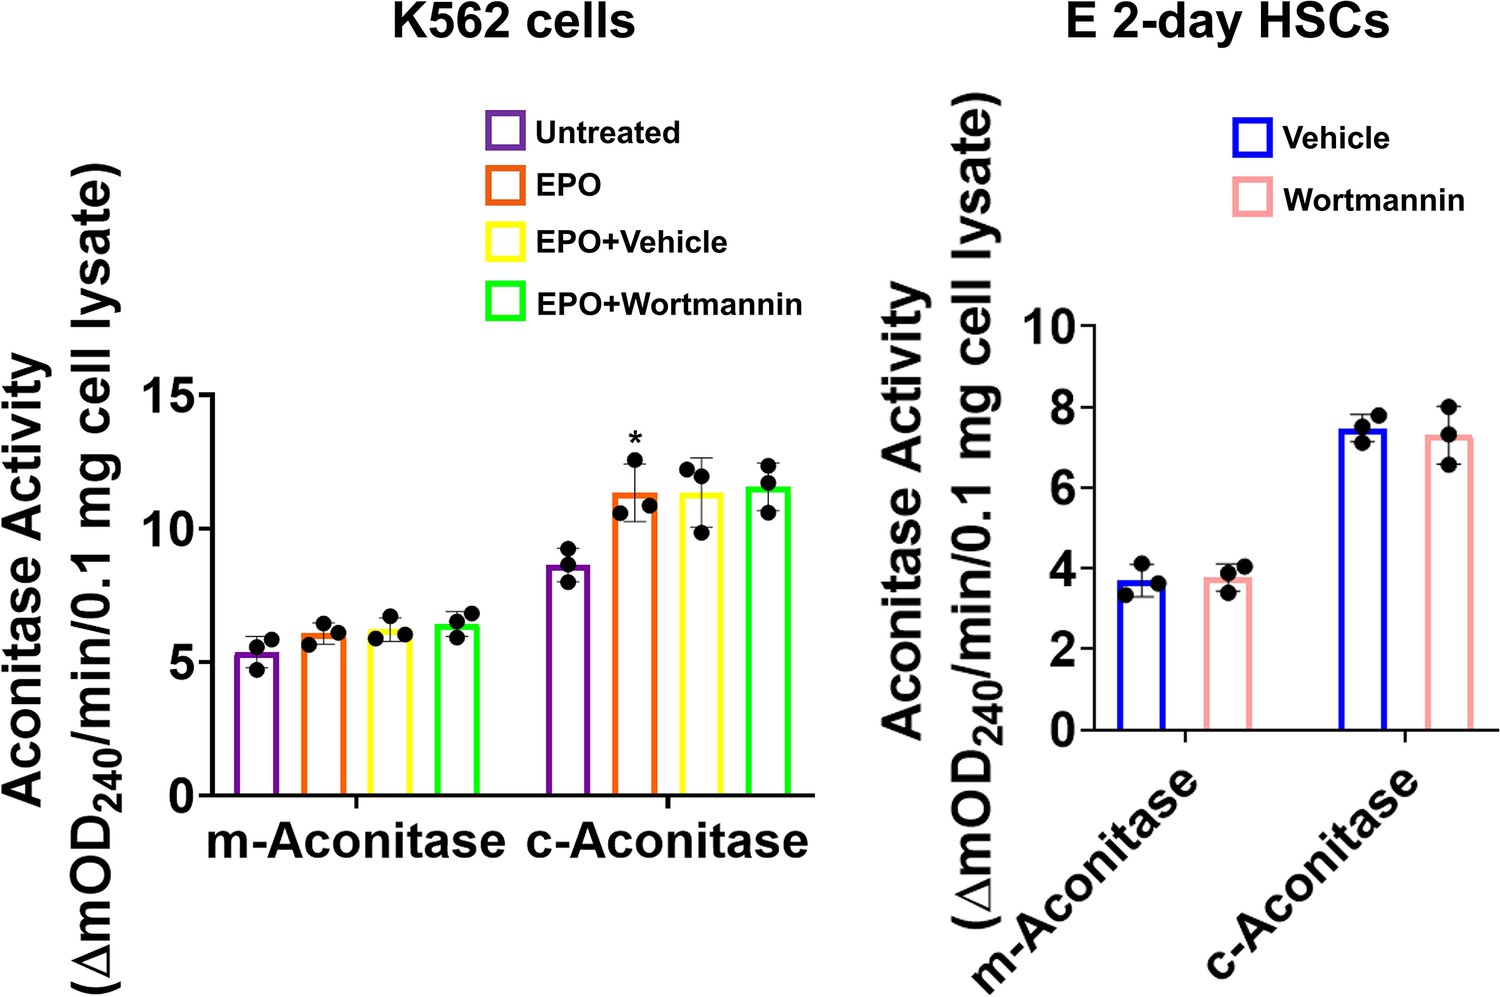
Mitochondrial and cytosolic aconitase activities of Untreated, EPO, EPO+Vehicle, and EPO+Wortmannin groups of K562 cells as well as Vehicle and Wortmannin groups of E 2-day hematopoietic stem cells (HSCs).
Scale bars represent standard deviations; * represents p < 0.05 relative to the Untreated group, two-sided Student’s t tests. N = 3 independent biological replicates for this figure.
Figure 7 with 1 supplement
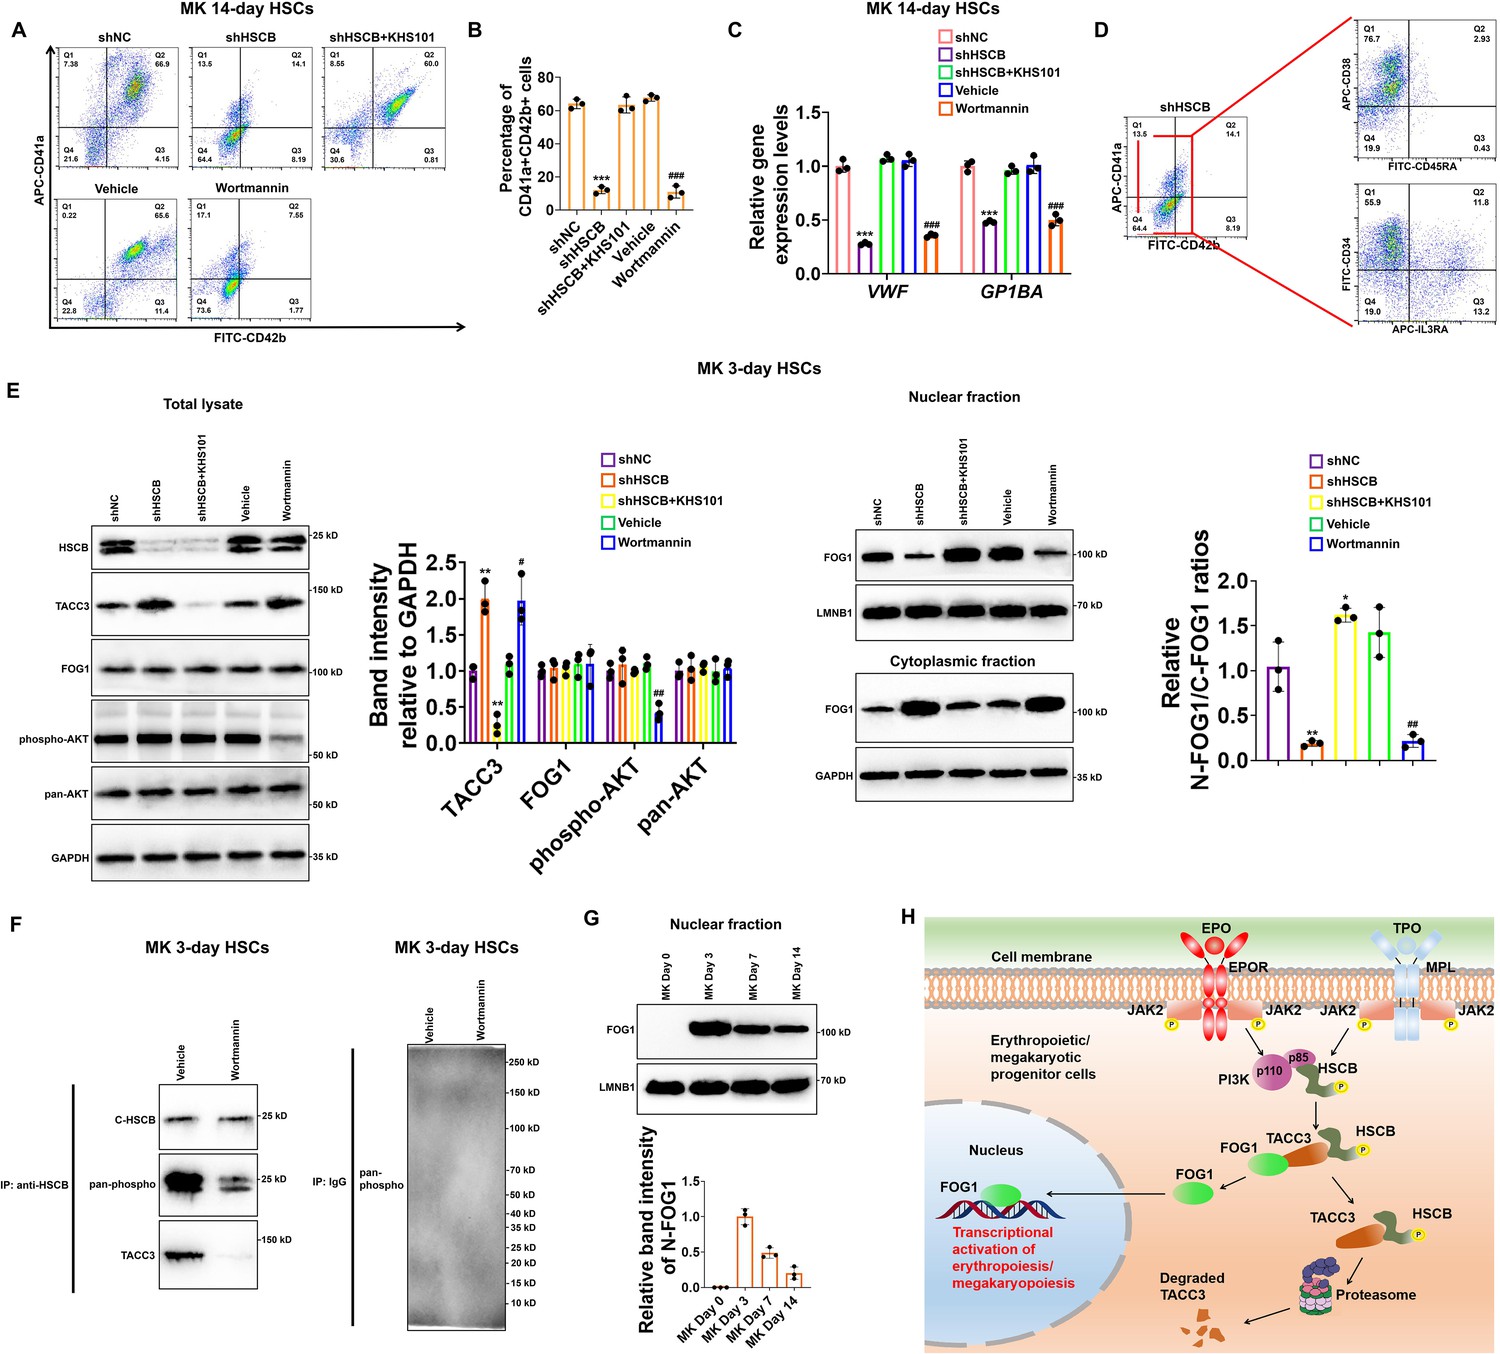
Megakaryopoiesis of CD34+CD90+HSCs also required the activation of the phosphoinositol-3-kinase (PI3K)–heat shock cognate B (HSCB) signaling axis.
(A) Representative flow cytometry scatter plots and (B) statistics of three biologically independent flow cytometry assays revealing significantly reduced percentages of CD41a+CD42b+ cells among the MK 14-day hematopoietic stem cells (HSCs) in the shHSC and Wortmannin groups. (C) qRT-PCR assays indicated decreased mRNA expression levels of megakaryocyte-specific genes VWF and GP1BA in the MK 14-day HSCs of the shHSC and Wortmannin groups. Error bars denote standard deviations; *** and ###, respectively, denote p < 0.001 relative to the shNC and Vehicle groups, two-sided Student’s t test. (D) Flow cytometry scatter plots showing that the majority of cells from the shHSCB group of MK 14-day HSCs were CD34+CD38+CD45RA−IL3RA−. (E) Western blotting analyses demonstrated that both knocking down HSCB and wortmannin treatment could increase the protein level of TACC3 while reduce FOG1 nuclear translocation, whereas treating HSCB-deficient HSCs with KHS101 decreased the protein level of TACC3 while enhanced FOG1 nuclear translocation in MK 3-day HSCs. Error bars denote standard deviations; *, ** and ***, respectively, represent p values less than 0.05, 0.01 and 0.001 compared with the shNC group, while # and ##, respectively, mean p < 0.05 and p < 0.01 relative to the Vehicle group, two-sided Student’s t test. (F) Co-immunoprecipitation (co-IP) analyses revealed decreased phosphorylation level of cytosolic HSCB and impaired interaction between HSCB and TACC3 in MK 3-day HSCs treated with wortmannin. (G) Western blotting analyses of nuclear FOG1 levels in CD34+CD90+HSCs induced for megakaryopoiesis for 0, 3, 7, and 14 days. (H) A schematic diagram summarizing the main findings of this study.
-
Figure 7—source data 1
Labeled and raw Western blots for Figure 7E–G.
- https://cdn.elifesciences.org/articles/95815/elife-95815-fig7-data1-v1.zip
Figure 7—figure supplement 1
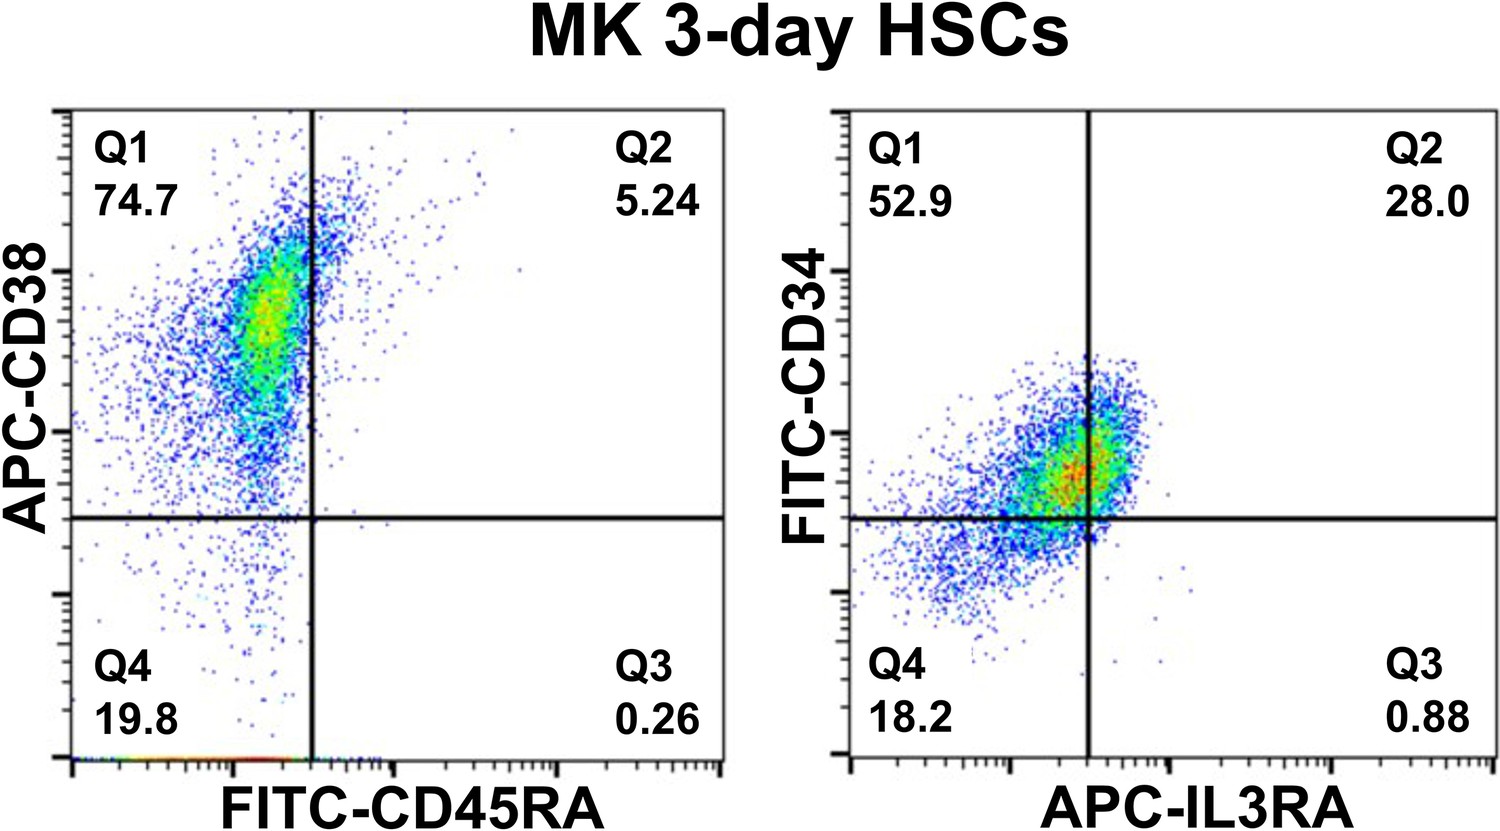
Flow cytometry scatter plots showing that the majority of MK 3-day hematopoietic stem cells (HSCs) were CD34+CD38+CD45RA−IL3RA−.
Additional files
-
Supplementary file 1
Information for primary antibodies and primers used in this study.
Table 1. Primary antibodies used in this study. Table 2. Primers used in the qRT-PCR assays.
- https://cdn.elifesciences.org/articles/95815/elife-95815-supp1-v1.docx
-
Supplementary file 2
Supplementary Dataset 1 displaying the downregulated DENPs between the EPO+CRISPR NC and EPO+CRISPR HSCB groups of K562 cells.
- https://cdn.elifesciences.org/articles/95815/elife-95815-supp2-v1.xls
-
Supplementary file 3
Supplementary Dataset 2 displaying the upregulated DENPs between the EPO+CRISPR NC and EPO+CRISPR HSCB groups of K562 cells.
- https://cdn.elifesciences.org/articles/95815/elife-95815-supp3-v1.xls
-
Supplementary file 4
Supplementary Dataset 3 showing the full lists of FOG1-binding partners in the EPO+CRISPR NC group of K562 cells.
- https://cdn.elifesciences.org/articles/95815/elife-95815-supp4-v1.xlsx
-
Supplementary file 5
Supplementary Dataset 4 showing the full lists of FOG1-binding partners in the EPO+CRISPR HSCB group of K562 cells.
- https://cdn.elifesciences.org/articles/95815/elife-95815-supp5-v1.xlsx
-
Supplementary file 6
Supplementary Dataset 5 displaying the full list of proteins detected by the tandem mass tag-based mass spectrometry analysis of nuclear fractions of the EPO+CRISPR NC and EPO +CRISPR HSCB groups of K562 cells.
- https://cdn.elifesciences.org/articles/95815/elife-95815-supp6-v1.xls
-
MDAR checklist
- https://cdn.elifesciences.org/articles/95815/elife-95815-mdarchecklist1-v1.pdf
Download links
A two-part list of links to download the article, or parts of the article, in various formats.
Downloads (link to download the article as PDF)
Open citations (links to open the citations from this article in various online reference manager services)
Cite this article (links to download the citations from this article in formats compatible with various reference manager tools)
PI3K/HSCB axis facilitates FOG1 nuclear translocation to promote erythropoiesis and megakaryopoiesis
eLife 13:RP95815.
https://doi.org/10.7554/eLife.95815.3


