Spatiotemporal changes in Netrin/Dscam1 signaling dictate axonal projection direction in Drosophila small ventral lateral clock neurons
- School of Life Science and Technology, the Key Laboratory of Developmental Genes and Human Disease, Southeast University, China
- Co-innovation Center of Neuroregeneration, Nantong University, China
Figures
Figure 1 with 1 supplement
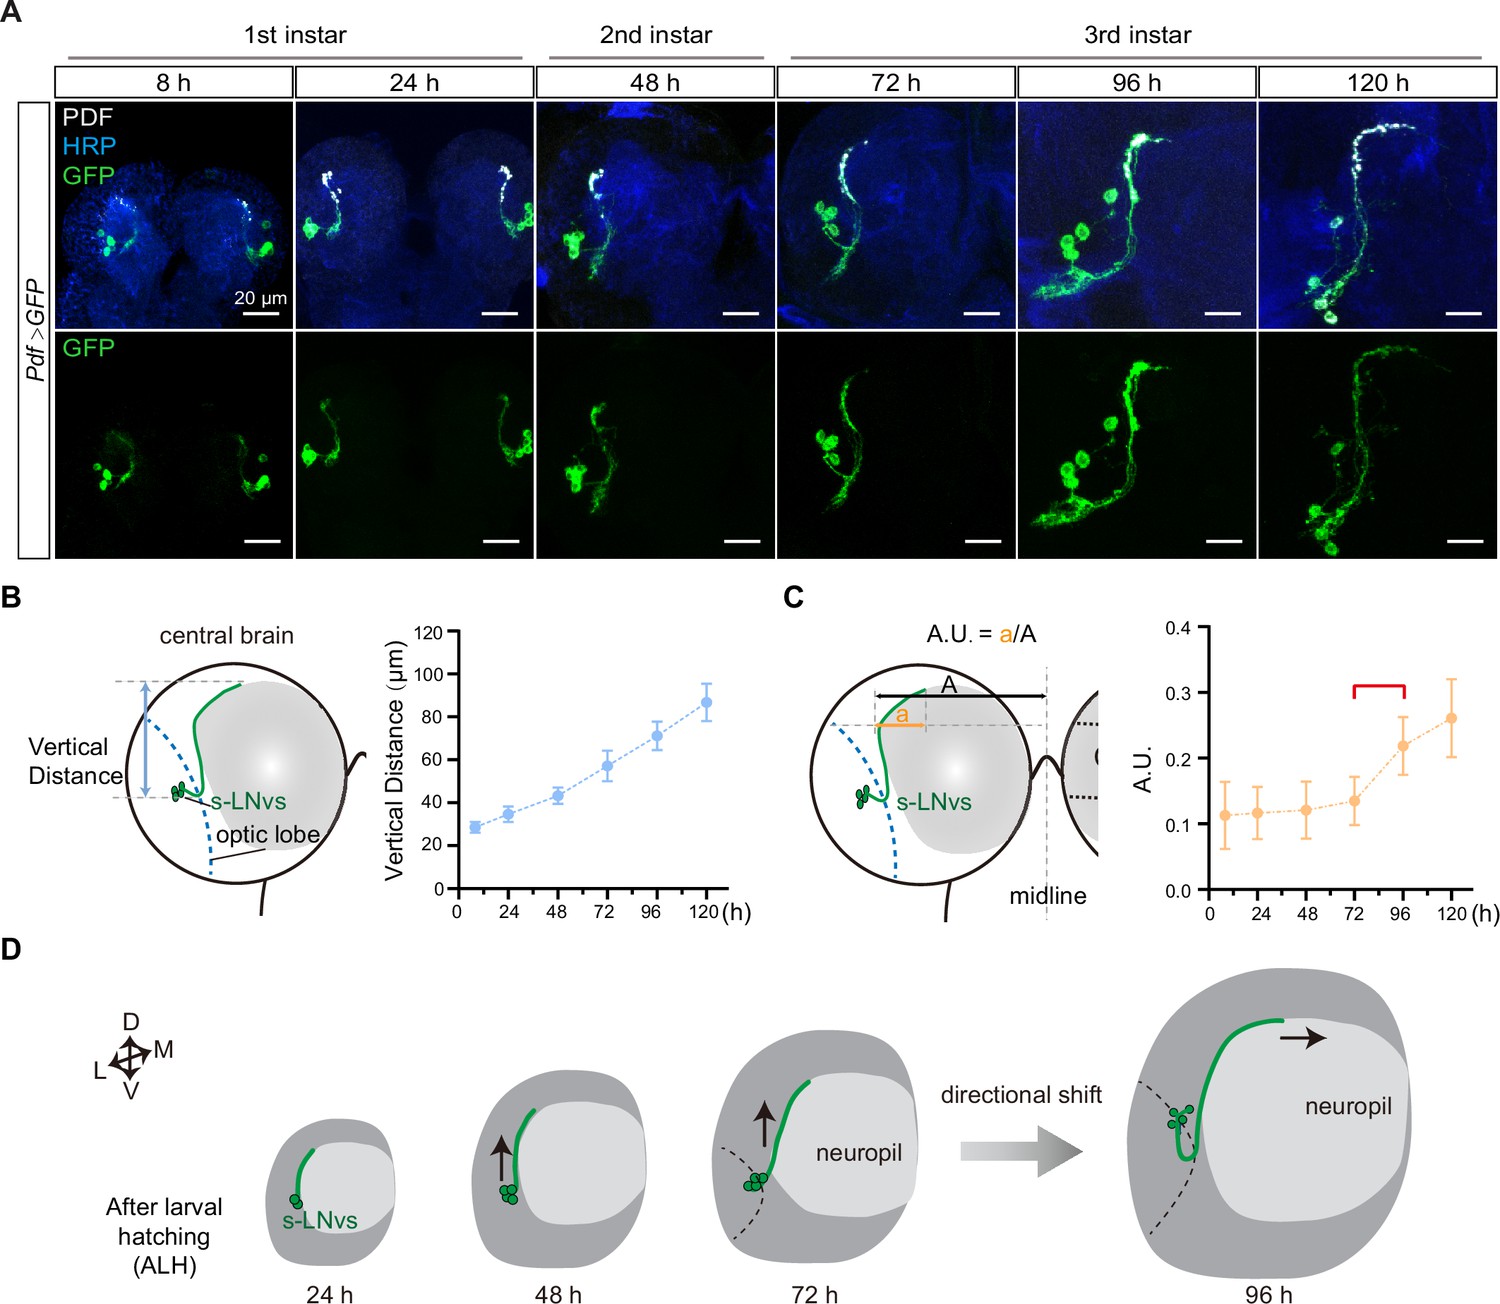
Small ventral lateral clock neurons (s-LNvs) axon projection dynamics during the larval stage.
(A) Images showing the growth process of s-LNvs during larval development. Larval brains were stained with anti-PDF (white) and horseradish peroxidase (HRP, blue) antibodies. Different time points indicate the hours after larval hatching (ALH). (B) Left panel: schematic diagram illustrating the method used to measure the degree of vertical projection. One hemisphere of the larvae brain is depicted. Larval neuropil (gray), s-LNvs (green), and optic lobe (blue). Right panel: graphs showing the average vertical projection length at different developmental stages, presented as mean ± standard deviation (SD). (C) Left panel: schematic diagram illustrating the method used to measure the degree of horizontal projection. Right panel: graphs showing the average horizontal projection (A.U.: arbitrary unit) at different developmental stages, presented as mean ± SD. The red line segment indicates the stage at which the axonal projection undergoes a directional transition. (D) Schematic representation of s-LNvs vertical to horizontal projection directional shift during 72–96 hr ALH. One hemisphere of the larvae brain (gray), larval neuropil (white), and s-LNvs (green). For (B, C), 8 hr (n = 7), 24 hr (n = 10), 48 hr (n = 14), 72 hr (n = 16), 96 hr (n = 13), 120 hr (n = 16).
Figure 1—figure supplement 1
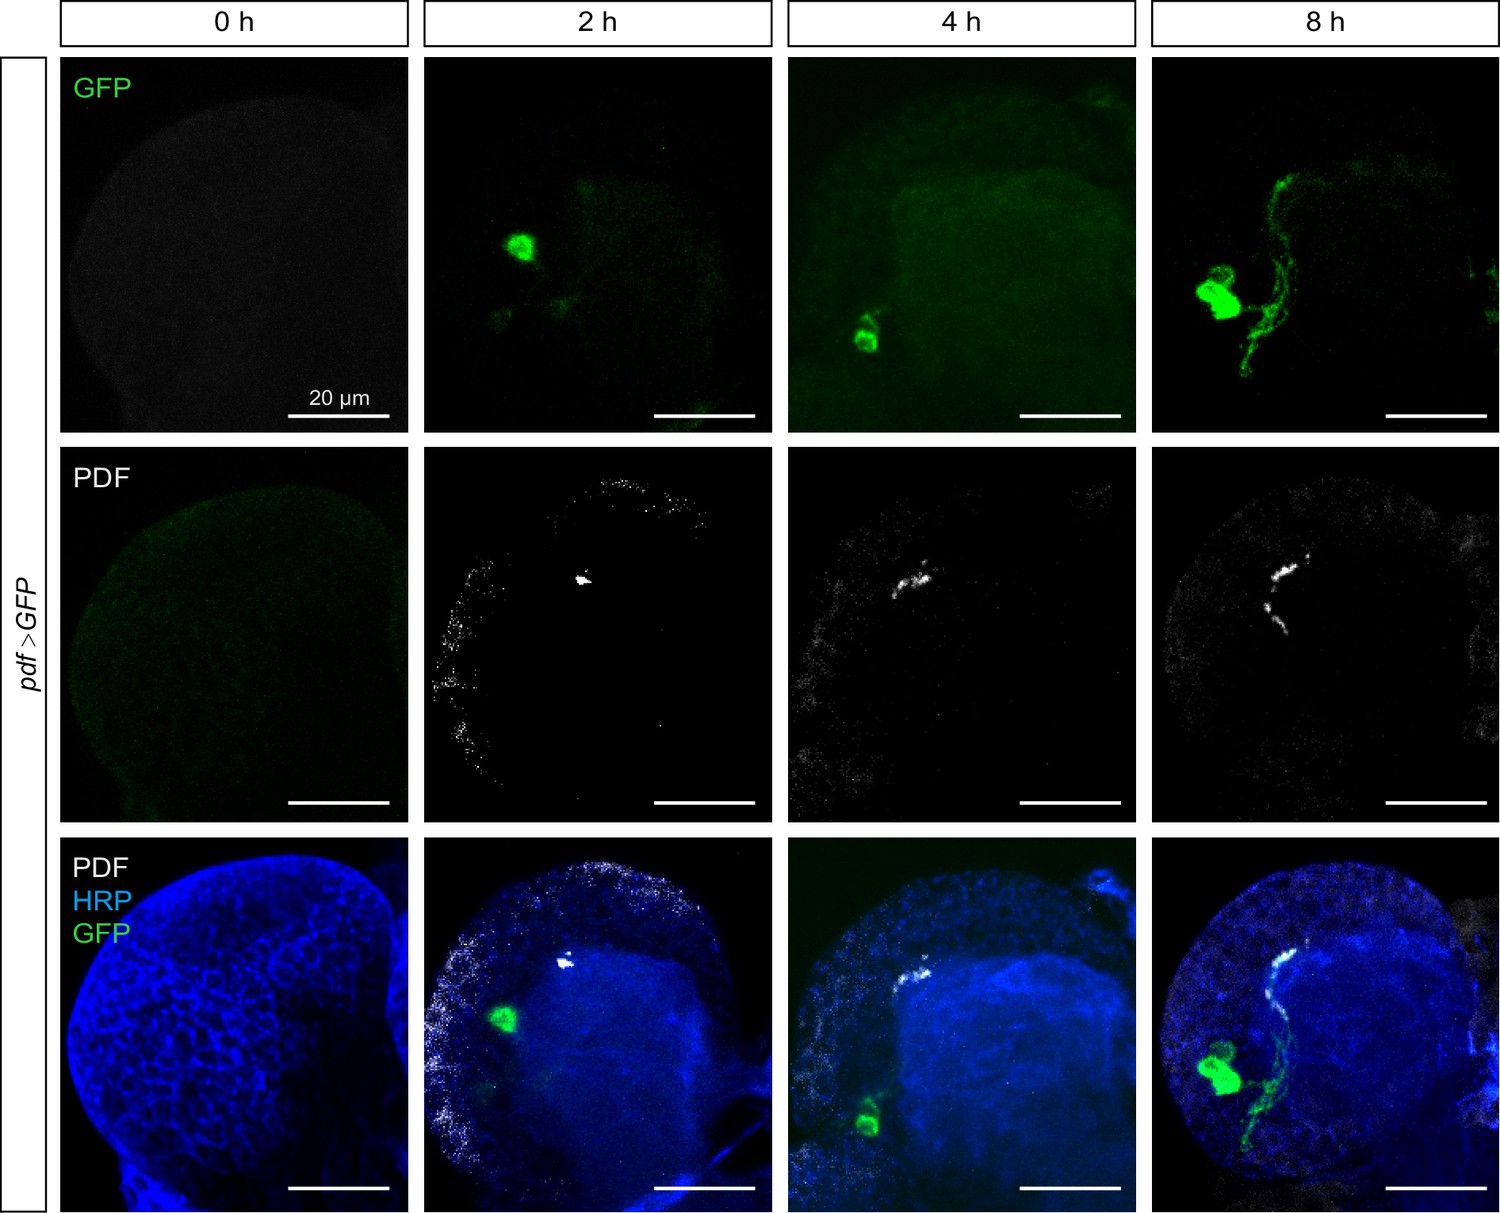
Small ventral lateral clock neuron (s-LNv) projection in the early larval stage.
Images showing the growth process of s-LNvs during the early larval stage. Larval brains were stained with anti-PDF (white) and HRP (blue) antibodies. Different time points indicate the hours after larval hatching (ALH).
Figure 2 with 1 supplement
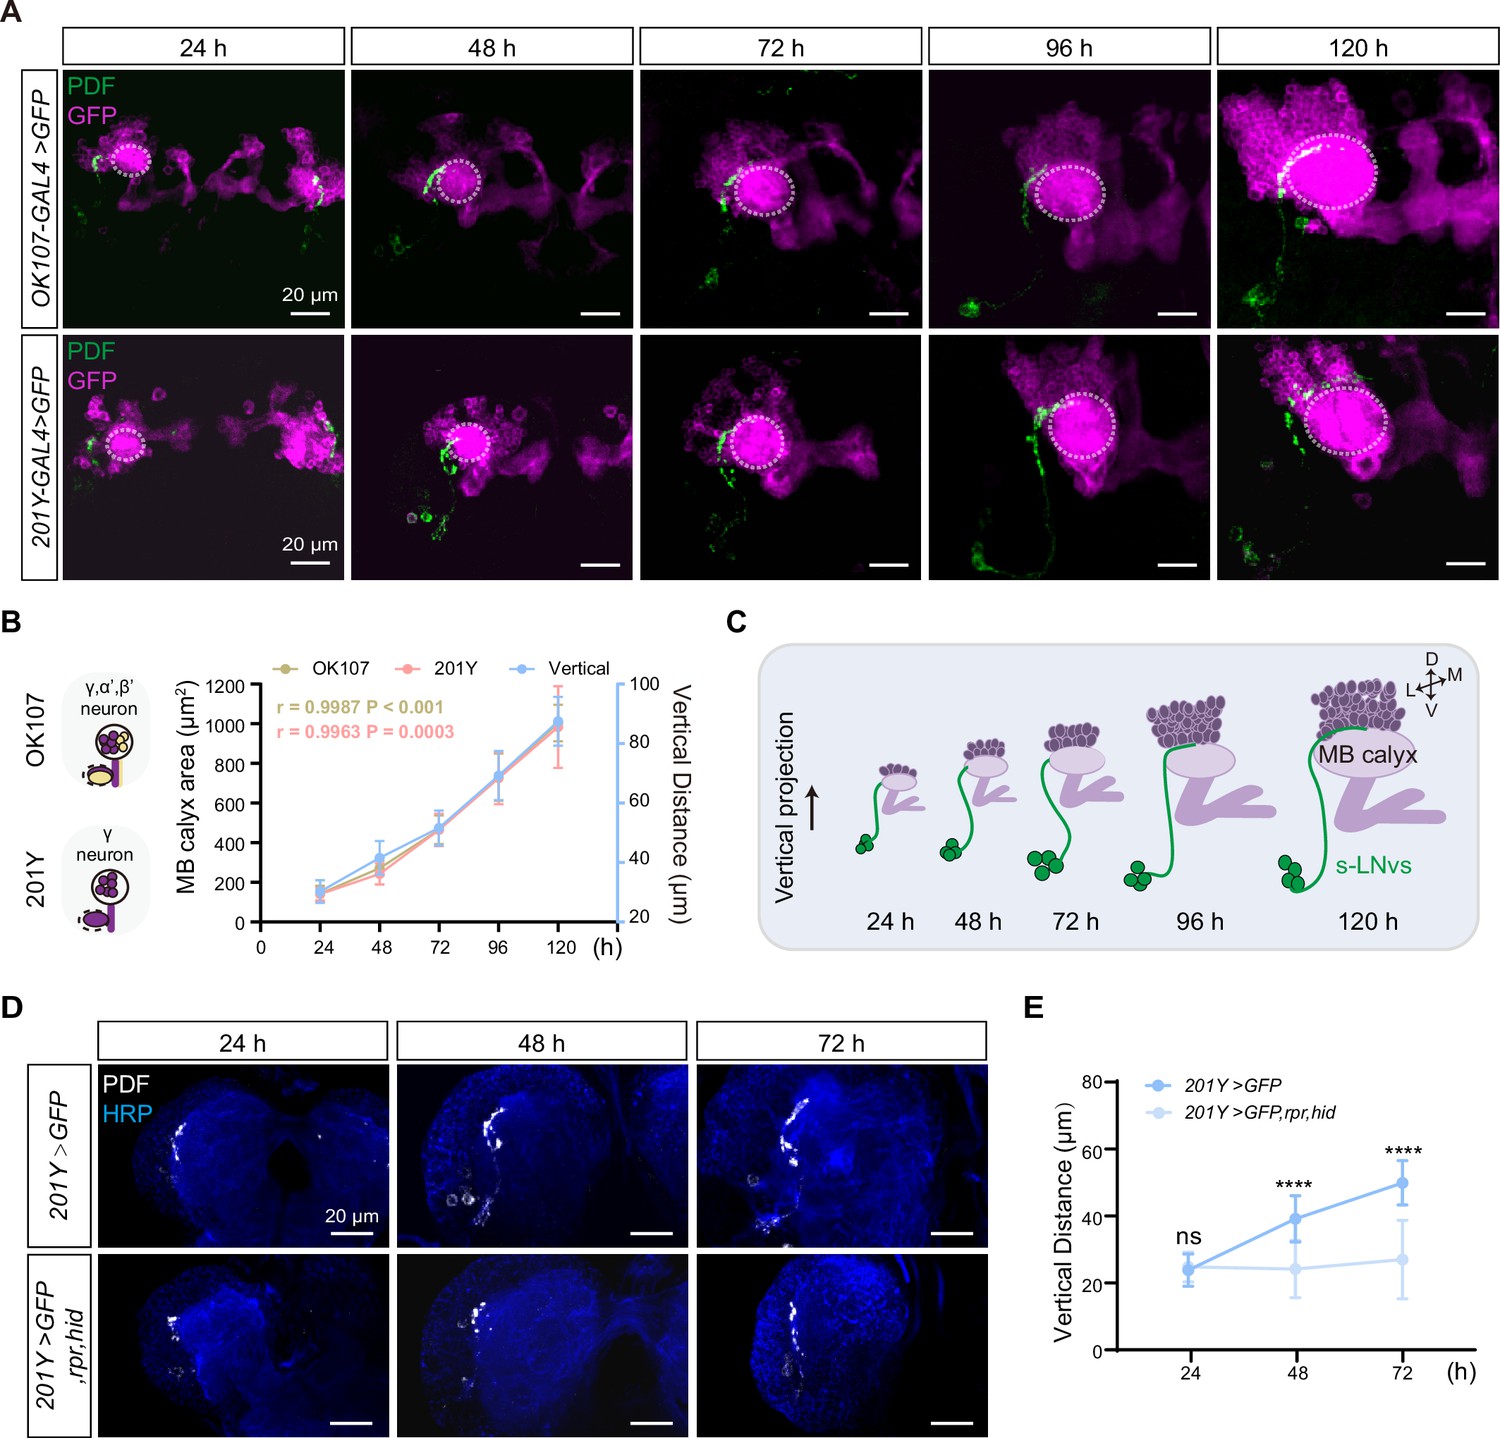
Development of vertical projection process alongside mushroom body (MB) growth.
(A) Spatial position relationship between calyx and small ventral lateral clock neurons (s-LNvs). Top: OK107-GAL4 labels the calyx of MB γ and α′β′ neurons, while s-LNvs are labeled by the pigment-dispersing factor (PDF) antibody. Bottom: Tab2–201Y-GAL4 labels calyx of MB γ neurons, with s-LNvs labeled by the PDF antibody. Larvae brains were stained with anti-PDF (green) and GFP (magenta) antibodies. Different time indicated hours after larval hatching (ALH). The white dotted line indicates the calyx region. (B) Graphs showing the MB calyx’s area and vertical projection length averaged over different development stage are presented as mean ± standard deviation (SD). OK107: 24 hr (n = 10), 48 hr (n = 8), 72 hr (n = 12), 96 hr (n = 12), 120 hr (n = 9). Pearson’s r = 0.9987, p < 0.0001. Tab2-201Y: 24 hr (n = 6), 48 hr (n = 12), 72 hr (n = 13), 96 hr (n = 13), 120 hr (n = 11). Pearson’s r = 0.9963, p = 0.0003. (C) Schematic representation of complementary development of s-LNvs vertical projection and MB calyx. MB (purple), s-LNvs (green). (D) Images of MB ablation in the developing larval stages. Larvae brains were stained with anti-PDF (white) and HRP (blue) antibodies. Different time indicated hours ALH. (E) Quantification of vertical projection length in Control (Tab2-201Y >GFP) and Ablation (Tab2-201Y >GFP,rpr,hid) flies. Data are presented as mean ± SD. Control: 24 hr (n = 6), 48 hr (n = 14), 72 hr (n = 13), Ablation: 24 hr (n = 6), 48 hr (n = 12), 72 hr (n = 12). Two-tailed Student’s t tests were used. ns, p > 0.05; ****p < 0.0001.
Figure 2—figure supplement 1
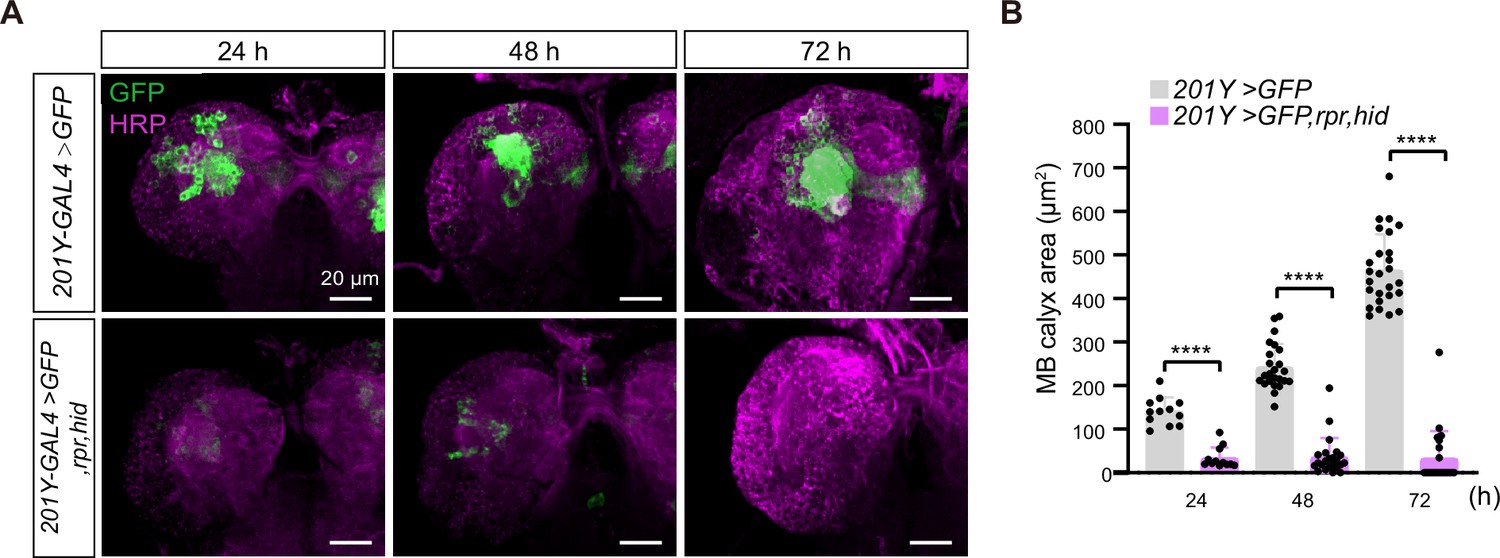
Validation of mushroom body (MB) ablation efficiency.
(A) Images of MB ablation in the developing larval stages. Larvae brains were stained with anti-GFP (green) and HRP (magenta) antibodies. Different time indicated after larval hatching (ALH). (B) Quantification of MB calyx area in Control (201Y>GFP) and Ablation (201Y>GFP,rpr,hid) flies. Data are presented as mean ± standard deviation (SD). Control: 24 hr (n = 6), 48 hr (n = 12), 72 hr (n = 13), Ablation: 24 hr (n = 6), 48 hr (n = 12), 72 hr (n = 12). Two-tailed Student’s t tests, ****p < 0.0001.
Figure 3 with 2 supplements
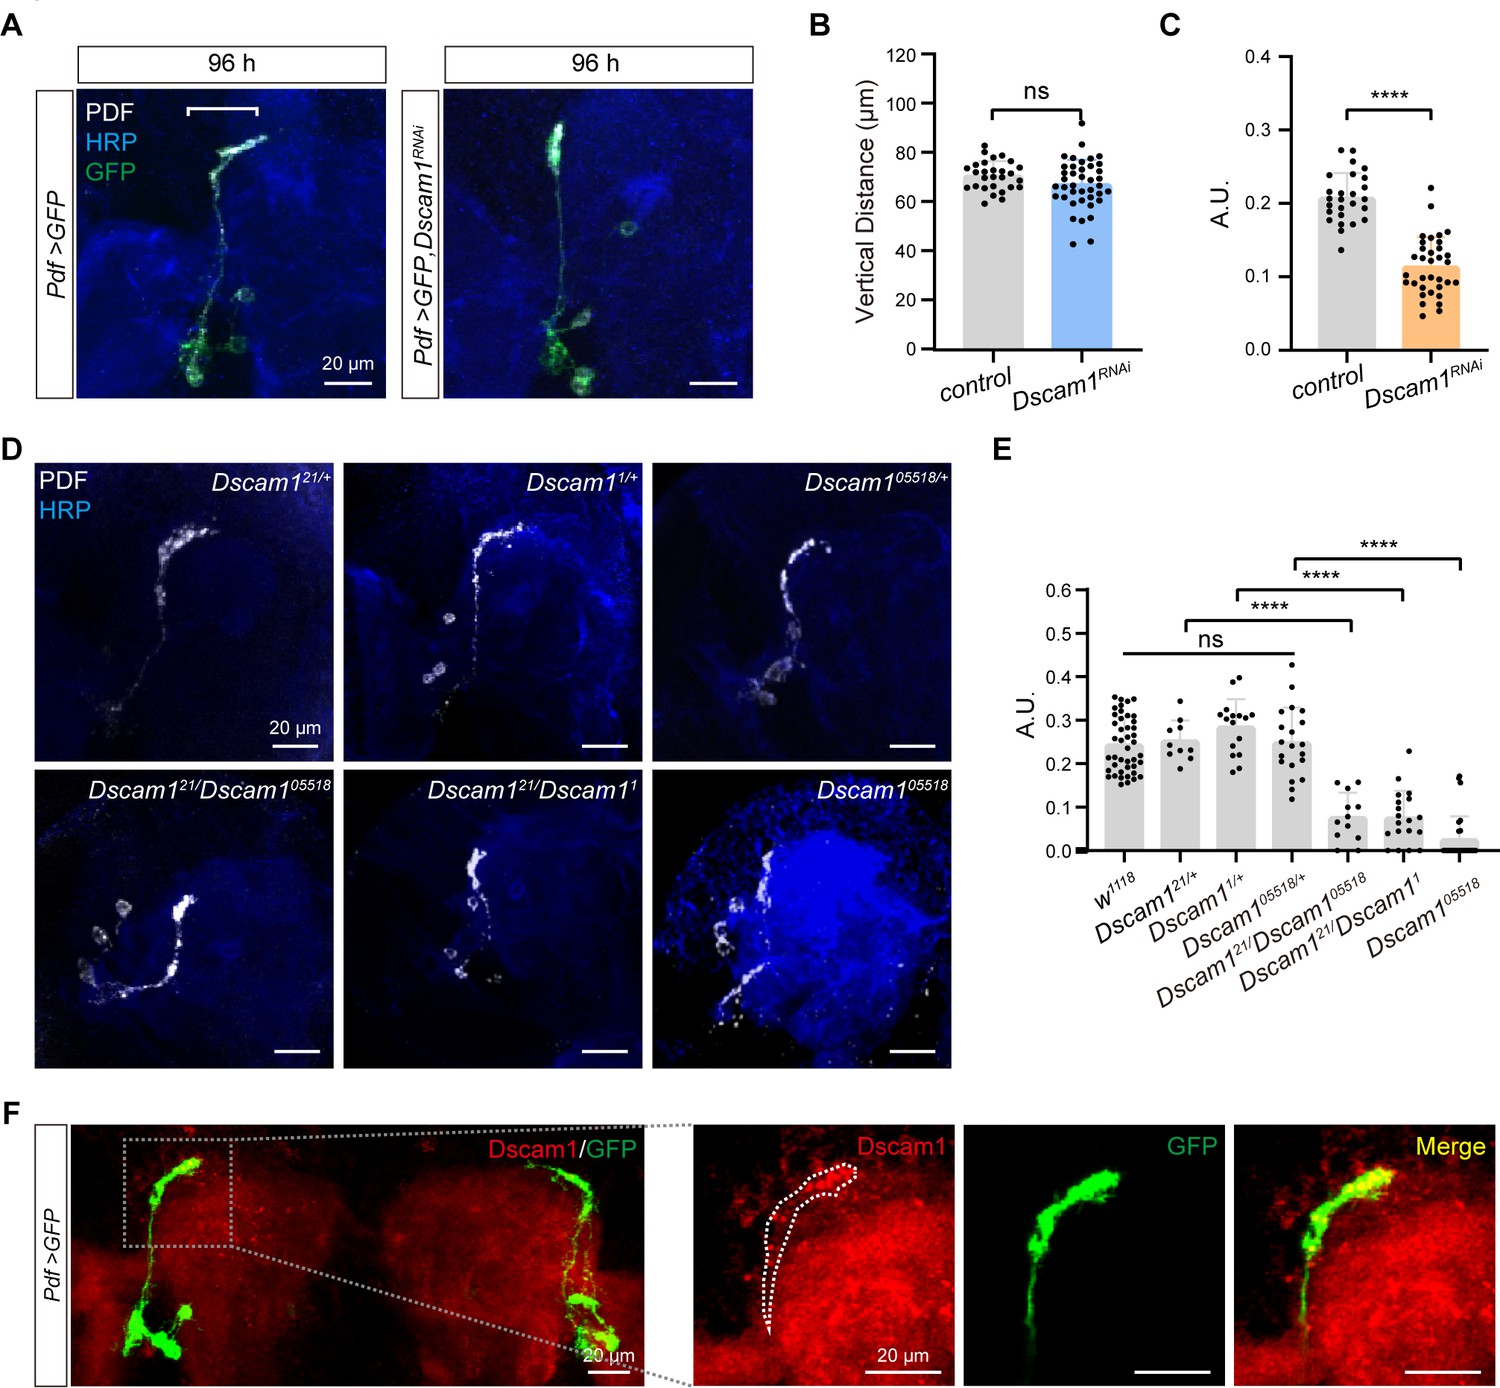
Critical role of Dscam1 in small ventral lateral clock neuron (s-LNv) axonal horizontal projection.
(A) Images of s-LNvs in Pdf >GFP and Pdf >GFP, Dscam1RNAi fly. White line segment represents the horizontal projection distance of s-LNvs. Larvae brains were stained with anti-PDF (white) and HRP (blue) antibodies at 96 hr after larval hatching (ALH). Pdf >GFP (n = 13), Pdf >GFP, Dscam1RNAi (n = 15). (B) Quantification of vertical projection length in Pdf >GFP and Pdf >GFP, Dscam1RNAi flies. Data are presented as mean ± standard deviation (SD). Two-tailed Student’s t tests, ns, p > 0.05. (C) Quantification of horizontal A.U. in Pdf >GFP and Pdf >GFP, Dscam1RNAi flies. Data are presented as mean ± SD. Two-tailed Student’s t tests, ****p < 0.0001. (D) Images of Dscam1 mutant s-LNvs projection phenotype. Larvae brains were collected at late third larvae. Heads were stained with anti-PDF (white) and HRP (blue) antibodies. (E) Quantification of horizontal A.U. in Dscam1 mutant flies. Data are presented as mean ± SD. w1118 (n = 22) Dscam121/+ (n = 5), Dscam11/+ (n = 8), Dscam105518/+ (n = 10), Dscam121/Dscam105518 (n = 6), Dscam121/Dscam11 (n = 10), Dscam105518 (n = 14). One-way analysis of variance (ANOVA) with Tukey’s post hoc, ns, p > 0.05, ****p < 0.0001. (F) Endogenous Dscam1 co-localizes with the s-LNvs axon terminal. Pdf >GFP fly heads were collected at 120 hr ALH and stained with anti-Dscam1 (red). The white dotted line indicates the s-LNvs axon.
Figure 3—figure supplement 1
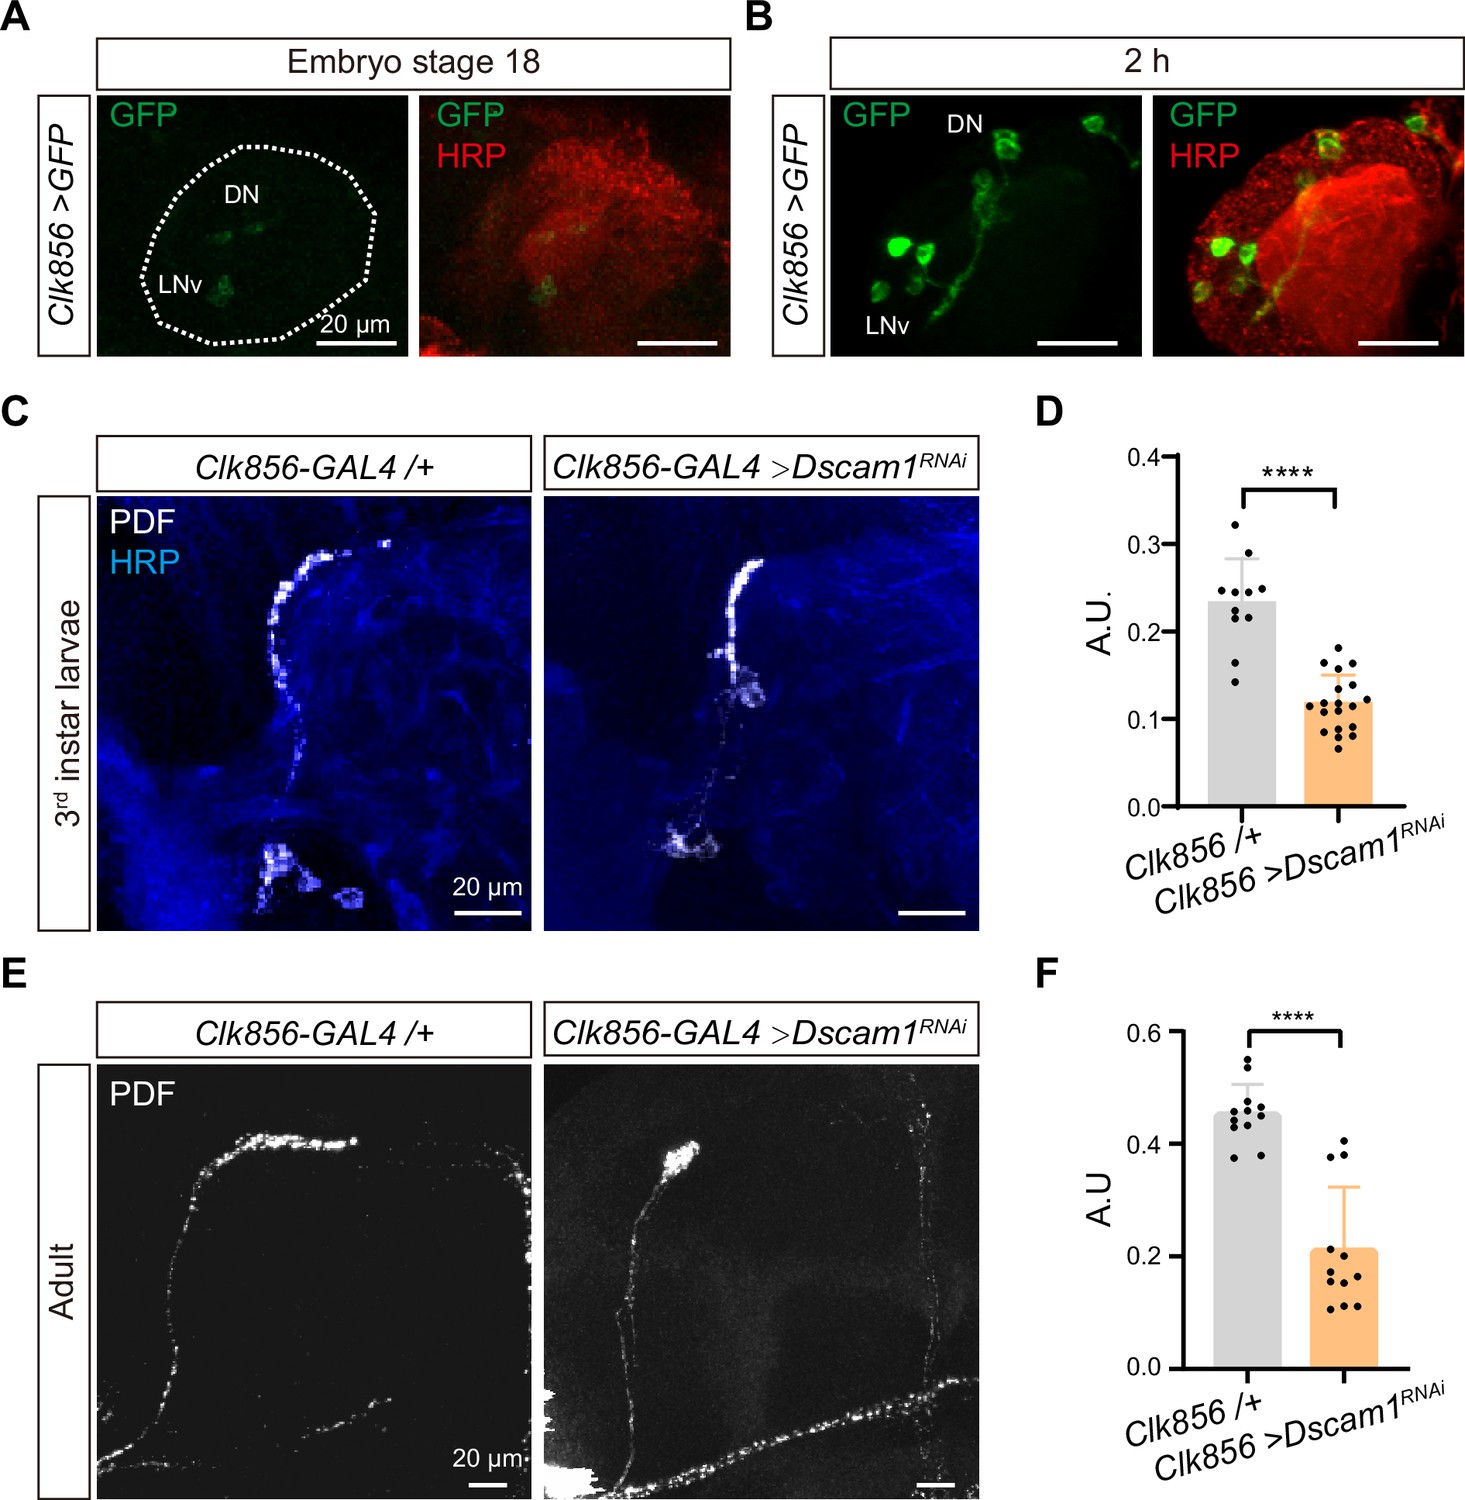
Knockdown of Dscam1 with Clk856-GAL4 shortens small ventral lateral clock neuron (s-LNv) axon horizontal projection.
(A) Images of immunostained in Clk856-GAL4>UAS-GFP at embryo stage 18. Heads were stained with anti-GFP (green) and HRP (red) antibodies. (B) Images of immunostained in Clk856-GAL4>UAS-GFP at 2 hr after larval hatching (ALH). Heads were stained with anti-GFP (green) and HRP (red) antibodies. (C) Immunostaining images of Clk856-GAL4 knockdown of Dscam1. Larvae brains were collected at late third larvae. Heads were stained with anti-PDF (white) and HRP (blue) antibodies. (D) Quantification of horizontal A.U. in Clk856-GAL4 knockdown of Dscam1. Data are presented as mean ± standard deviation (SD). Clk856-GAL4/+ (n = 6), Clk856-GAL4>Dscam1RNAi (n = 10). Two-tailed Student’s t tests, ****p < 0.0001. (E) Immunostaining images of Clk856-GAL4 knockdown of Dscam1. Brains were collected at adult. Heads were stained with anti-PDF (white) antibody. (F) Quantification of horizontal A.U. in Clk856-GAL4 knockdown of Dscam1. Data are presented as mean ± SD. Clk856-GAL4/+ (n = 6), Clk856-GAL4>Dscam1RNAi (n = 6). Two-tailed Student’s t tests, ****p < 0.0001.
Figure 3—figure supplement 2
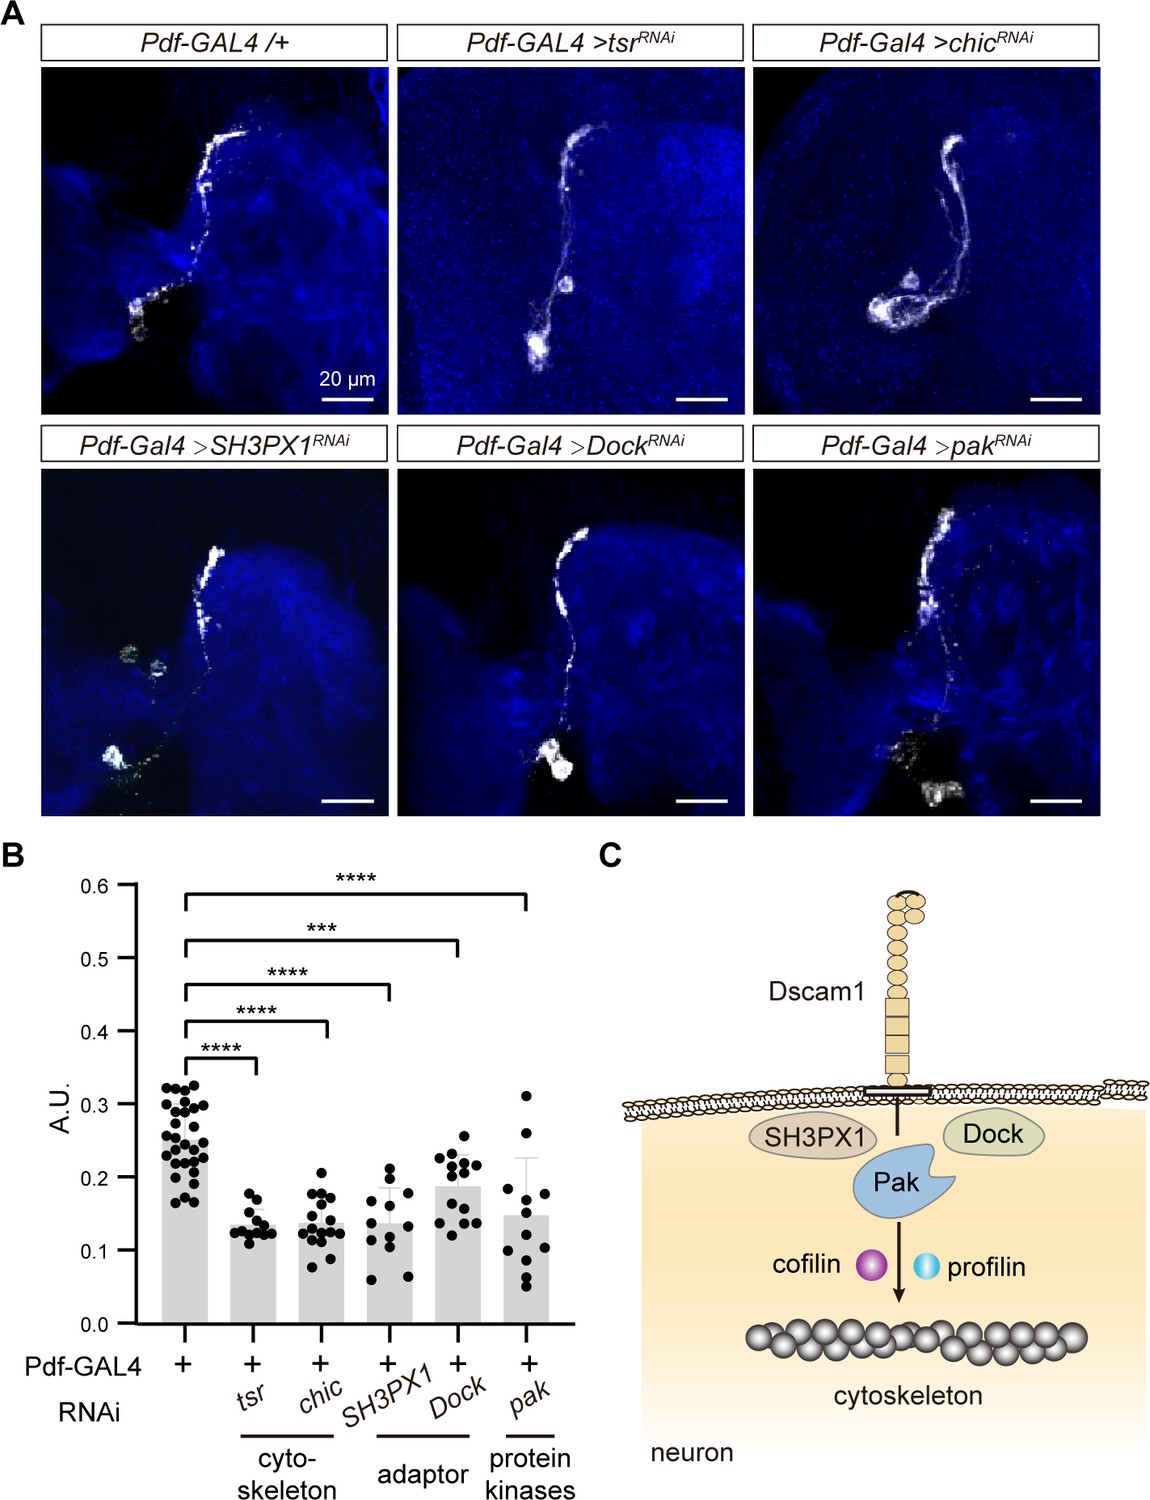
Dscam1 and its downstream signaling pathway in small ventral lateral clock neuron (s-LNv) axonal horizontal projection.
(A) Immunostaining images of Pdf-GAL4 knockdown of cytoskeleton-associated regulatory proteins and Dscam1 interaction molecule. Larvae brains were collected at late third larvae. Heads were stained with anti-PDF (white) and HRP (blue) antibodies. (B) Quantification of horizontal A.U. in Pdf-GAL4 knockdown of Dscam1 interaction molecule and cytoskeleton-associated regulatory proteins. Data are presented as mean ± standard deviation (SD). Pdf-GAL4/+ (n = 14), Pdf-GAL4 >tsrRNAi (n = 6), Pdf-GAL4 >chicRNAi (n = 8), Pdf-GAL4 >SH3PX1RNAi (n = 6), Pdf-GAL4 >DockRNAi (n = 7), Pdf-GAL4 >pakRNAi (n = 6). One-way analysis of variance (ANOVA) with Dunnett’s post hoc, ***p < 0.001, ****p < 0.0001. (C) Schematic representation of Dscam1 mediates s-LNvs horizontal projection downstream signaling pathways. Dscam1 (brown) activates the downstream signaling cascade involving Dock (cyan), SH3PX1 (yellow), Pak (blue), and cofilin/profilin (depicted in purple and blue balls, respectively). These signaling events induce alterations in cell cytoskeleton proteins (gray balls), facilitating the guidance of horizontal projection.
Figure 4 with 1 supplement
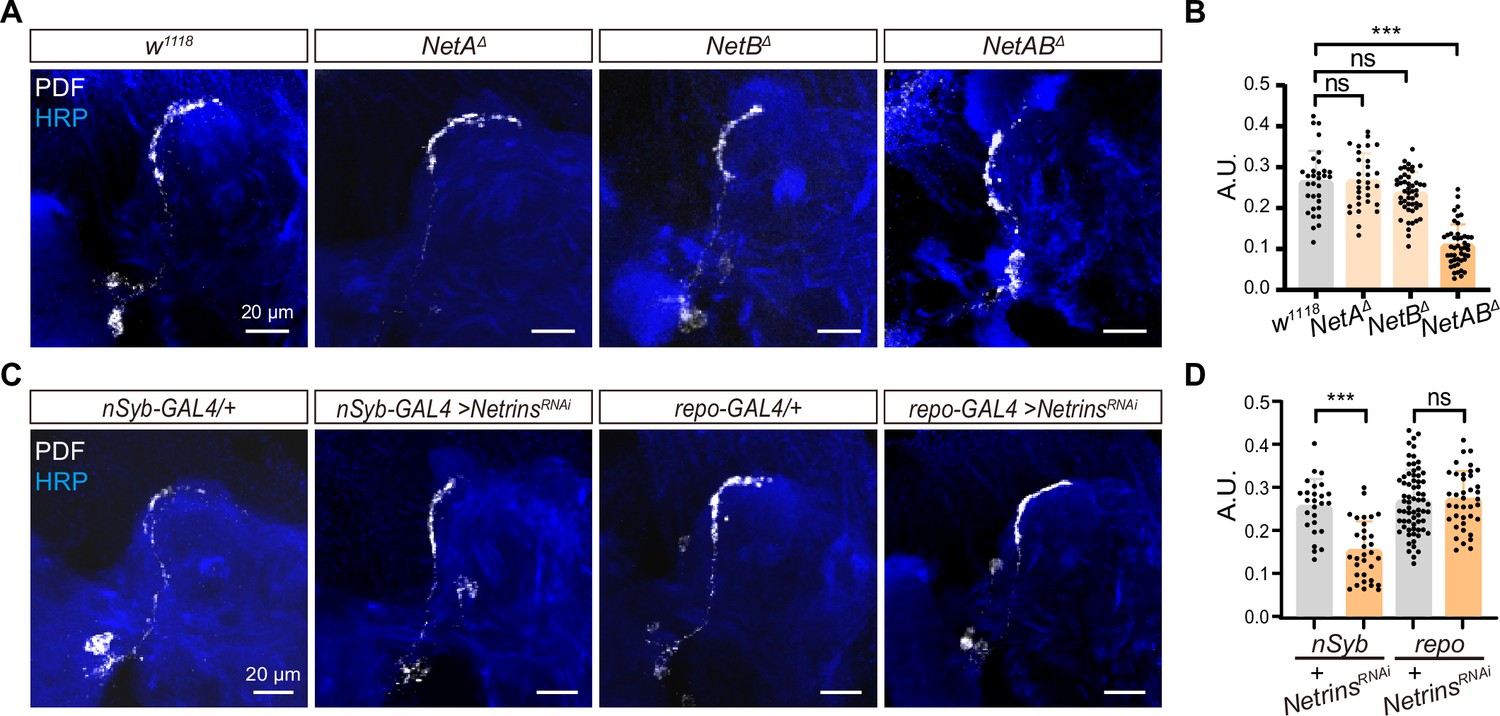
Neuron-derived Netrin guides small ventral lateral clock neurons (s-LNvs) horizontal projection.
(A) Images of immunostained in w1118, NetAΔ, NetBΔ, and NetABΔ fly. Larvae brains were collected at late third larvae. Heads were stained with anti-PDF (white) and HRP (blue) antibodies. (B) Quantification of horizontal A.U. w1118, NetAΔ, NetBΔ, and NetABΔ fly. Data are presented as mean ± standard deviation (SD), w1118 (n = 17), NetAΔ (n = 15), NetBΔ (n = 24), NetABΔ (n = 23). One-way analysis of variance (ANOVA) with Dunnett’s post hoc, ns, p > 0.05, ***p < 0.001. (C) Images of immunostained in nSyb-GAL4 and repo-GAL4 knockdown Netrins. Larvae brains were collected at late third larvae heads were stained with anti-PDF (white) and HRP (blue) antibodies. (D) Quantification of horizontal A.U. in nSyb-GAL4 and repo-GAL4 knockdown Netrins fly. Data are presented as mean ± SD. nSyb-GAL4/+ (n = 13), nSyb-GAL4 >NetrinsRNAi (n = 16), repo-GAL4/+ (n = 34), repo-GAL4 >NetrinsRNAi (n = 20). Two-tailed Student’s t tests, ns, p > 0.05, ***p < 0.001.
Figure 4—figure supplement 1
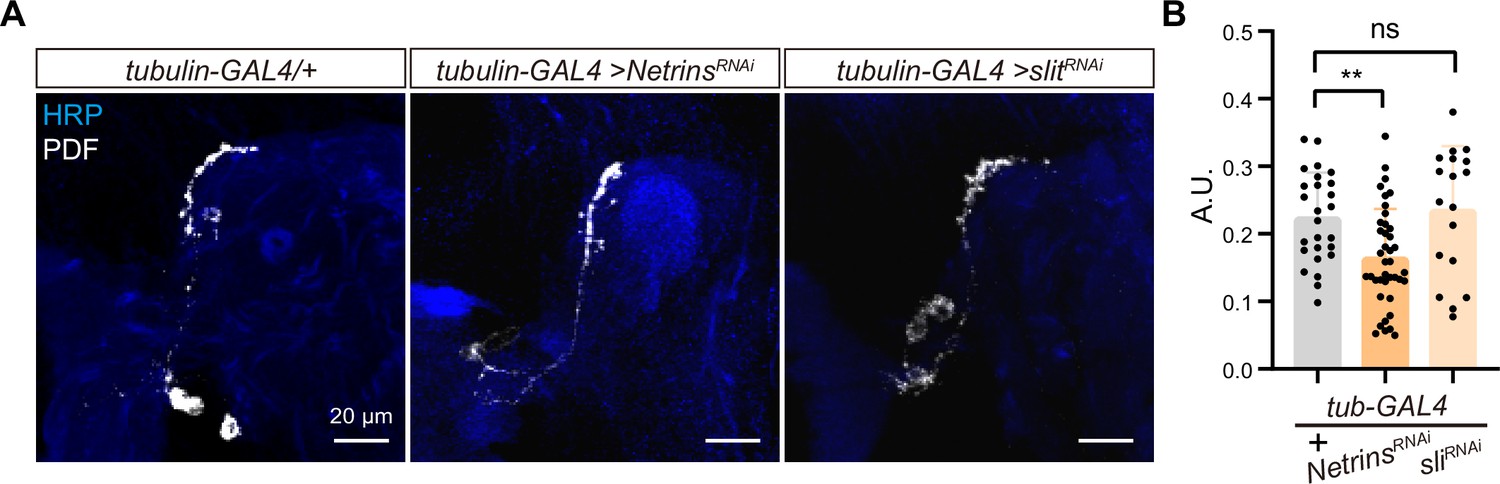
Identifying the upstream signal of Dscam1.
(A) Images of immunostained in tubulin-GAL4/+, tubulin-GAL4 >NetrinsRNAi, tubulin-GAL4 >slitRNAi fly. Larvae brains were heads were collected at late third larvae. Head stained with anti-PDF (white) and HRP (blue) antibodies. (B) Quantification of horizontal A.U. in tubulin-GAL4/+, tubulin-GAL4 >NetrinsRNAi, tubulin-GAL4 >slitRNAi fly. Data are presented as mean ± standard deviation (SD). tubulin-GAL4/+ (n = 13), tubulin-GAL4 >NetrinsRNAi (n = 20), tubulin-GAL4 >slitRNAi (n = 9). One-way analysis of variance (ANOVA) with Dunnett’s post hoc, ns, p > 0.05, **p < 0.01.
Figure 5 with 1 supplement
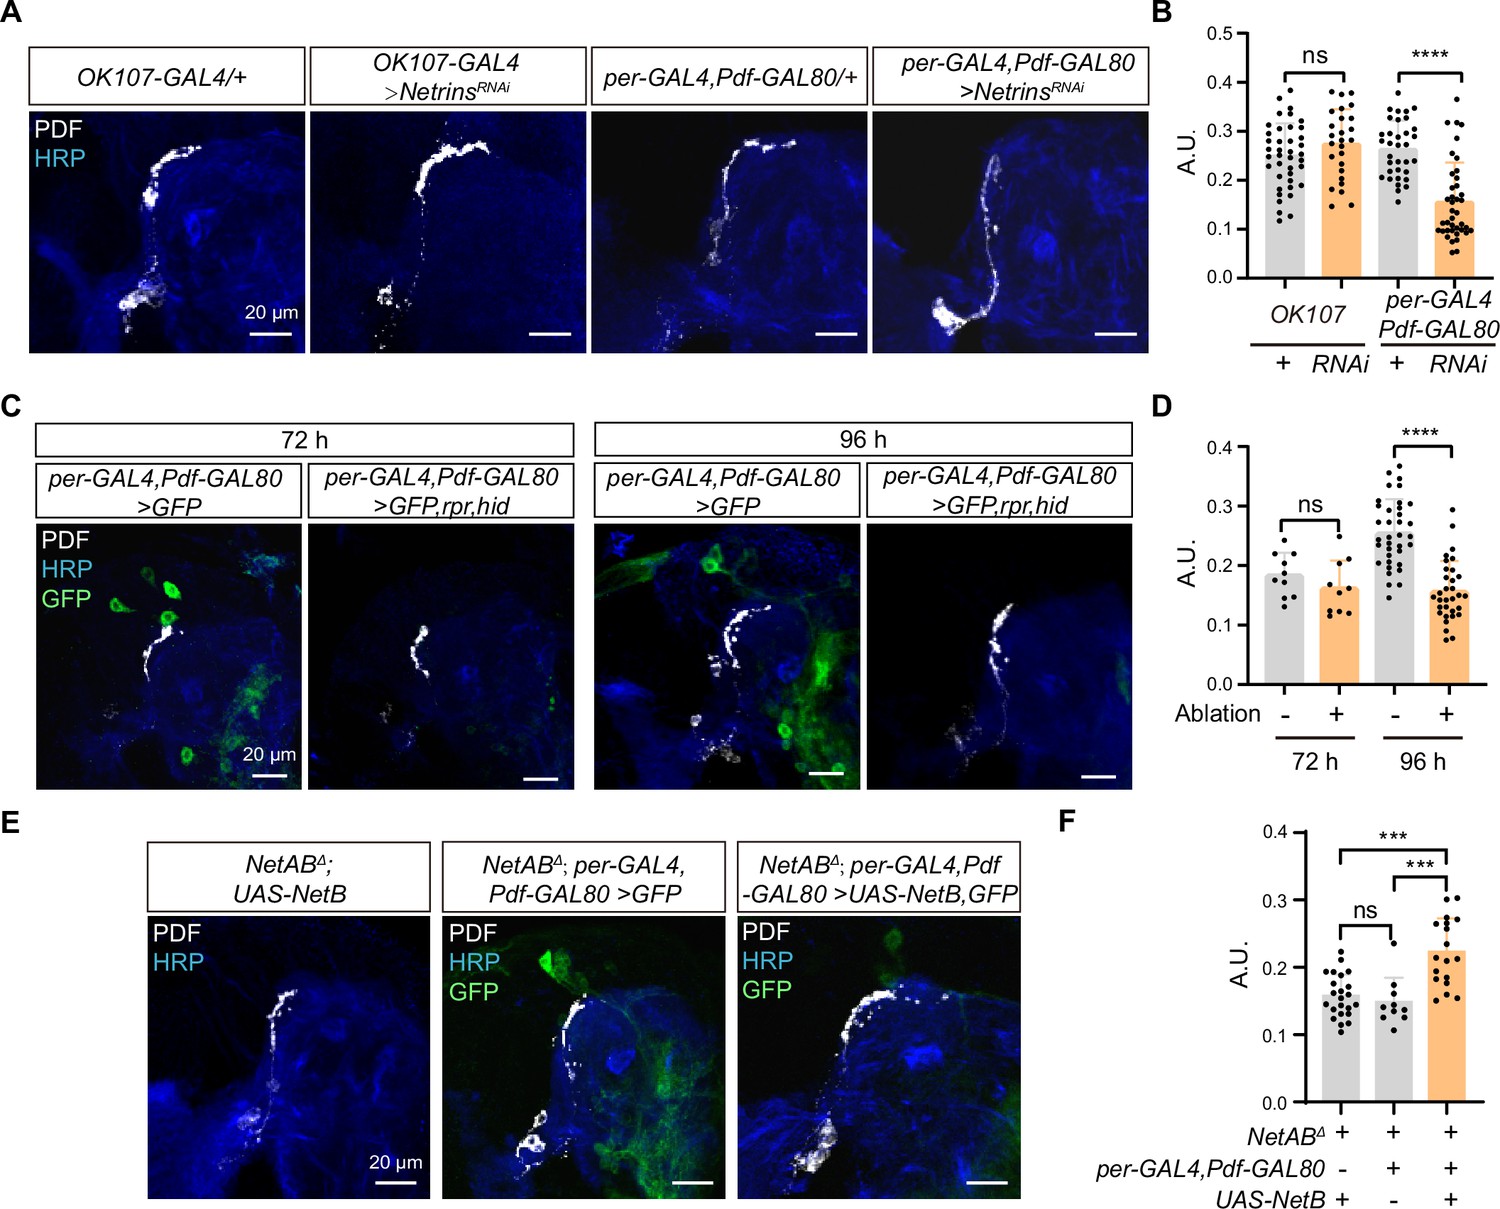
Netrin secreted by dorsal clock neurons (DNs) guides time-specific horizontal projection of small ventral lateral clock neurons (s-LNvs).
(A) Images of immunostained in OK107-GAL4 and per-GAL4, Pdf-GAL80 knockdown Netrins. Larvae brains were collected at late third larvae. Heads were stained with anti-PDF (white) and HRP (blue) antibodies. (B) Quantification of horizontal A.U. in OK107-GAL4 and per-GAL4, Pdf-GAL80 knockdown Netrins fly. Data are presented as mean ± standard deviation (SD). OK107-GAL4/+ (n = 20), OK107-GAL4>NetrinsRNAi (n = 13). per-GAL4, Pdf-GAL80/+ (n = 18), per-GAL4, Pdf-GAL80 >NetrinsRNAi (n = 16). Two-tailed Student’s t tests for OK107-GAL4 knockdown Netrins, ns, p > 0.05. Mann–Whitney test for per-GAL4, Pdf-GAL80 knockdown Netrins, ****p < 0.0001. (C) Images of DN ablation in the developing larval stages. Larvae brains were stained with anti-PDF (white) and HRP (blue) antibodies. Different time indicated hours ALH. (D) Quantification of horizontal A.U. in Control (per-GAL4, Pdf-GAL80 >GFP) and Ablation (per-GAL4, Pdf-GAL80 >GFP,rpr,hid) flies. Data are presented as mean ± SD. Control: 72 hr (n = 5), 96 hr (n = 12), Ablation: 72 hr (n = 5), 96 hr (n = 10). Two-tailed Student’s t tests were used to compare conditions. ns, p > 0.05, ****p < 0.0001. (E) Images of immunostained in per-GAL4, Pdf-GAL80 overexpress NetB in NetABΔ. Larvae brains were collected at late third larvae. Heads were stained with anti-PDF (white) and HRP (blue) antibodies. (F) Quantification of horizontal A.U. in per-GAL4, Pdf-GAL80 overexpress NetB in NetABΔ. Data are presented as mean ± SD. NetABΔ, UAS-NetB (n = 12), NetABΔ, per-GAL4,Pdf-GAL80 /+ (n = 5), NetABΔ,per-GAL4,Pdf-GAL80 >UAS NetB (n = 9). One-way analysis of variance (ANOVA) with Bonferroni post hoc, ns, p > 0.05, ***p < 0.001.
Figure 5—figure supplement 1
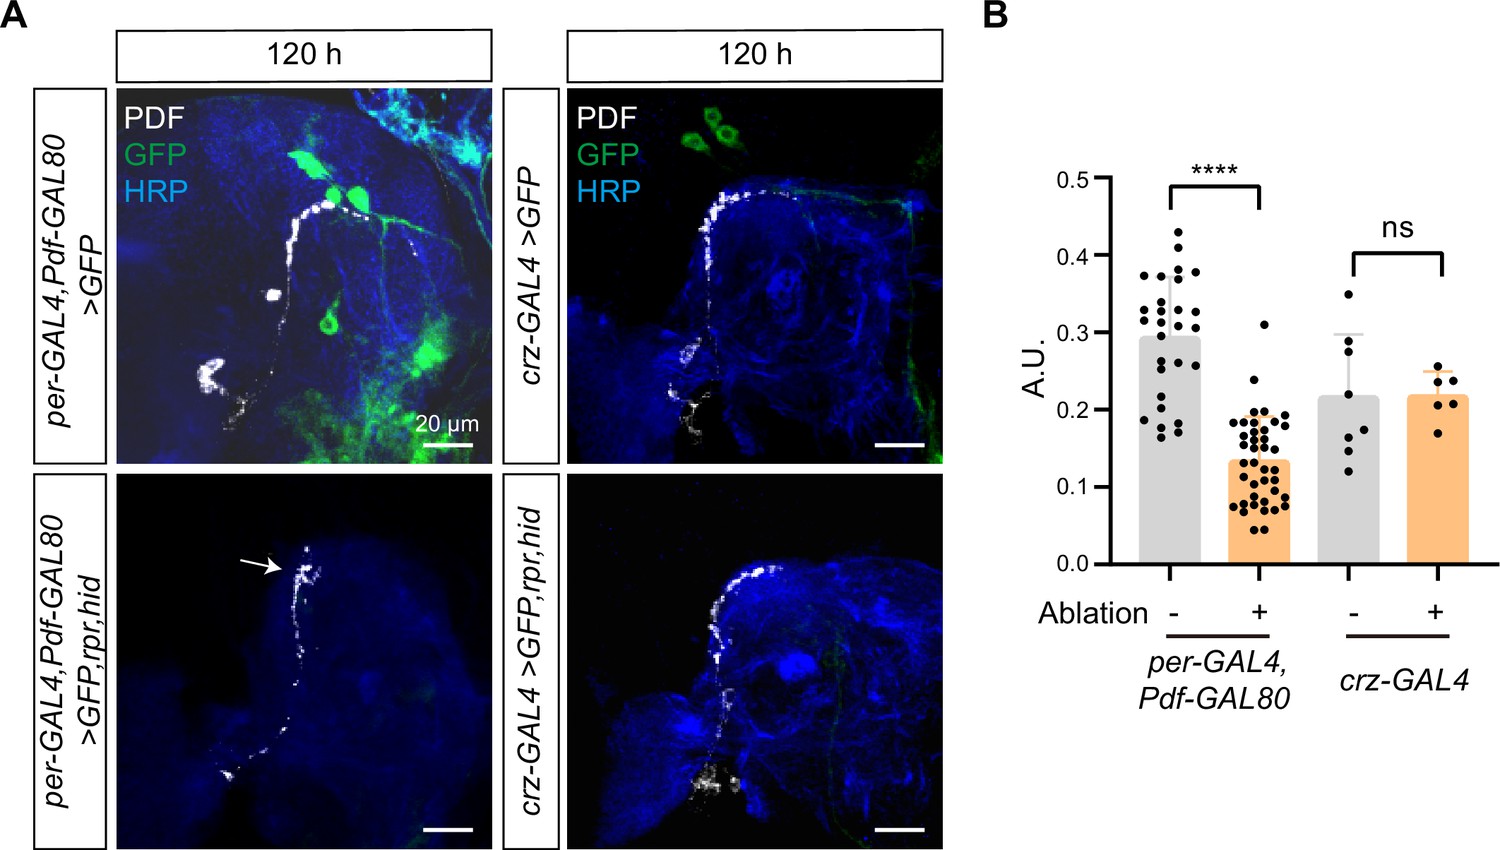
Ablation of dorsal clock neurons (DNs) leads to reduced small ventral lateral clock neurons (s-LNvs) horizontal projection.
(A) Images of per-GAL4, pdf-GAL80, and crz-GAL4 ablation. Larvae brains were stained with anti-PDF (white) and HRP (blue) antibodies at 120 hr after larval hatching (ALH). (B) Quantification of horizontal A.U. in per-GAL4, Pdf-GAL80, and crz-GAL4 ablation fly. Data are presented as mean ± standard deviation (SD). per-GAL4, Pdf-GAL80 >GFP (n = 14), per-GAL4, Pdf-GAL80 >GFP,rpr,hid (n = 20), crz-GAL4 >GFP (n = 4), crz-GAL4 >GFP,rpr,hid (n = 3). Two-tailed Student’s t tests, ns, p > 0.05; ****p < 0.0001.
Figure 6 with 1 supplement
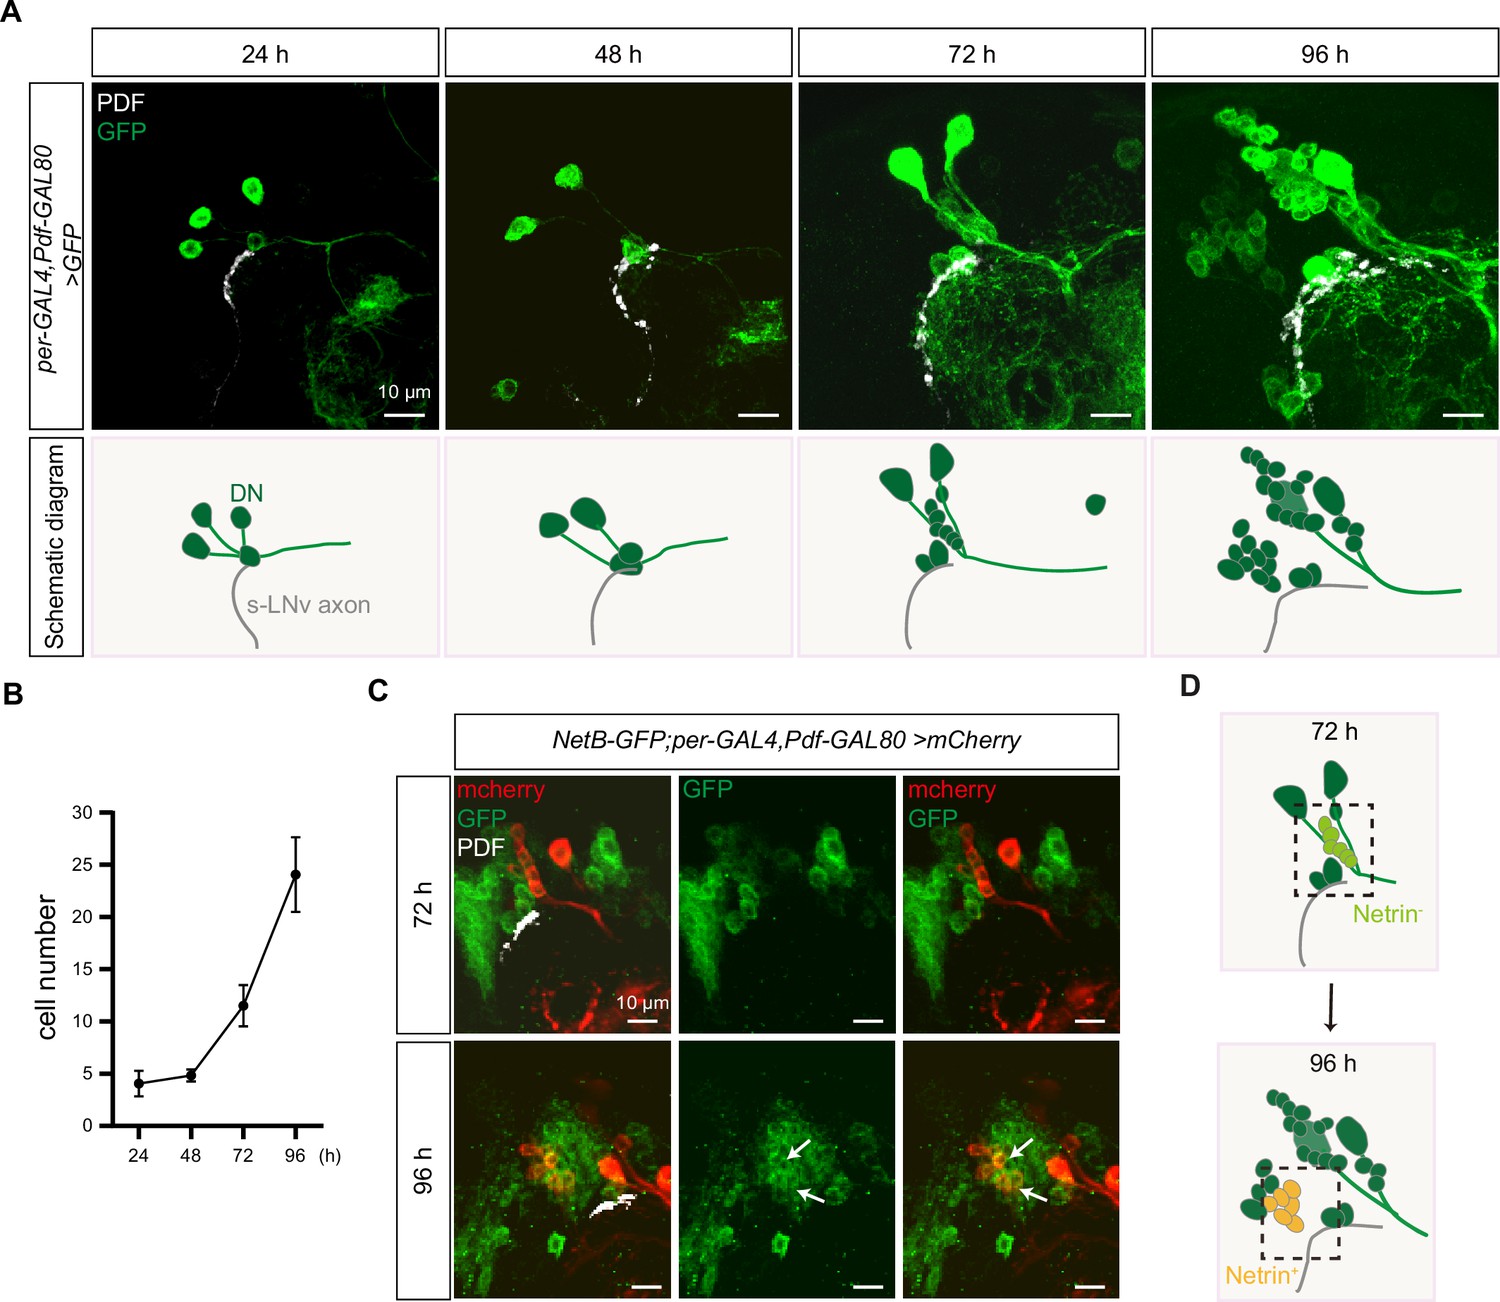
Dynamic changes in dorsal clock neurons (DNs) coordinated with small ventral lateral clock neurons (s-LNvs) axonal targeting.
(A) Top: images of s-LNvs axon and DNs growth process in the developing larval stages. Larvae brains were stained with anti-PDF (white) and GFP (green) antibodies. Different time indicated hours after larval hatching (ALH) are shown. Bottom: schematic diagram of s-LNvs horizontal projection and the corresponding increase in the number of DN neurons. s-LNvs axon (gray), DN neurons (green). (B) Quantification of the number of DN neurons labeled by per-GAL4, Pdf-GAL80 at different developmental stages. Data are presented as mean ± standard deviation (SD). (C) Images of newborn DN neurons were co-localized with Netrin-B at different developmental times. Larvae brains were stained with anti-GFP (green), mcherry (red), and PDF (white) antibodies. Different time indicated hours ALH. The white arrow demarcates the co-localization of red and green signals. (D) Schematic representation s-LNvs projection directional transition and the corresponding increase in the number of DN neurons. s-LNvs axon (gray), DN neurons (green), and newborn DN neurons (light green at 72 hr, orange at 96 hr).
Figure 6—figure supplement 1
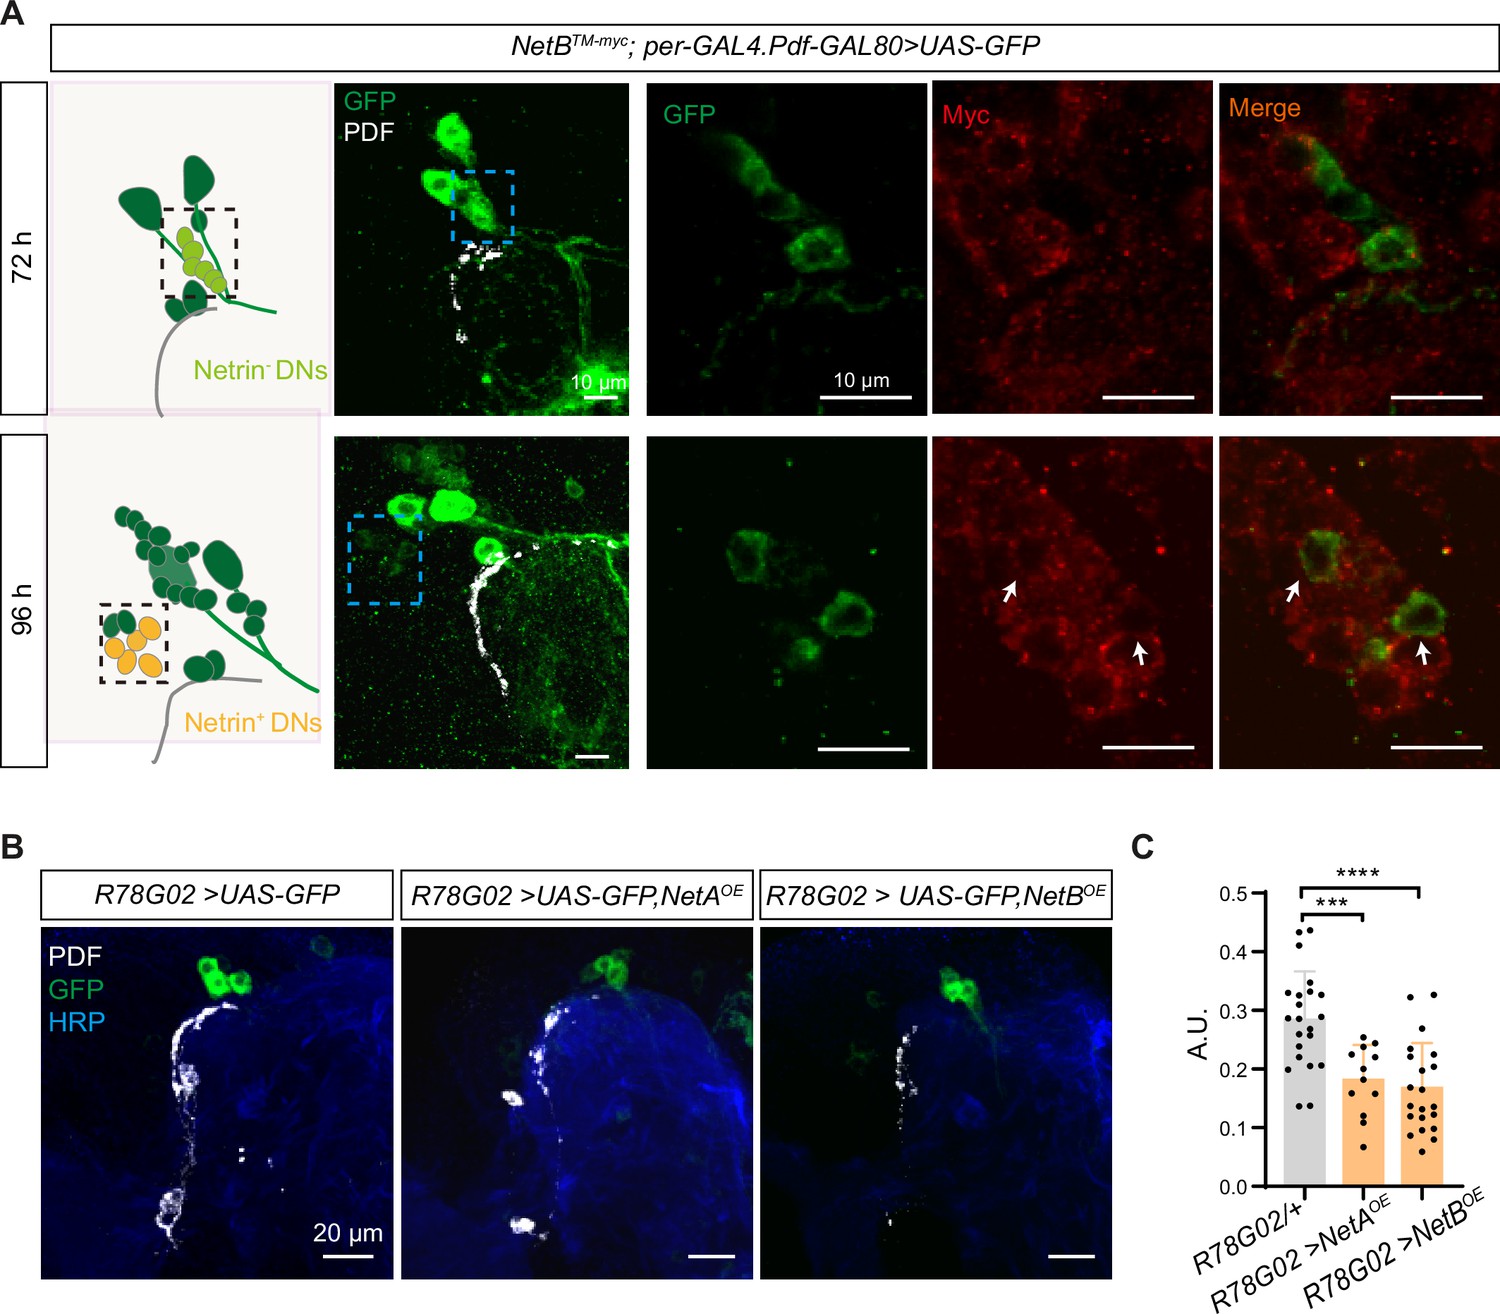
Anterior Netrin ectopic expression reduces horizontal projection length.
(A) Left: schematic and image representation small ventral lateral clock neurons (s-LNvs) projection directional transition and the corresponding increase in the number of dorsal clock neurons (DNs). s-LNvs axon (gray), DN neurons (green), and newborn DN neurons (light green at 72 hr, orange at 96 hr). Larvae brains were stained with anti-PDF (white) and GFP (green) antibodies. The blue box indicates the area magnified in the right panel. Right: images of DN neurons were co-localized with Netrin-B at different developmental times. Larvae brains were stained with anti-Myc (red) and GFP (green) antibodies. Different time indicated after larval hatching (ALH). The white arrow demarcates the co-localization of red and green signals. (B) Images of Netrin ectopic expressed in R78G02-GAL4. Larvae brains were collected at late third larvae. Heads were stained with anti-PDF (white) and HRP (blue) antibodies. (C) Quantification of horizontal A.U. in Netrin ectopic expressed in R78G02-GAL4 fly. Data are presented as mean ± standard deviation (SD). R78G0-GAL4/+ (n = 11), R78G02-GAL4>UAS-NetAOE (n = 6), R78G02-GAL4>UAS-NetBOE (n = 11). One-way analysis of variance (ANOVA) with Dunnett’s post hoc, ***p < 0.001, ****p < 0.0001.
Figure 7
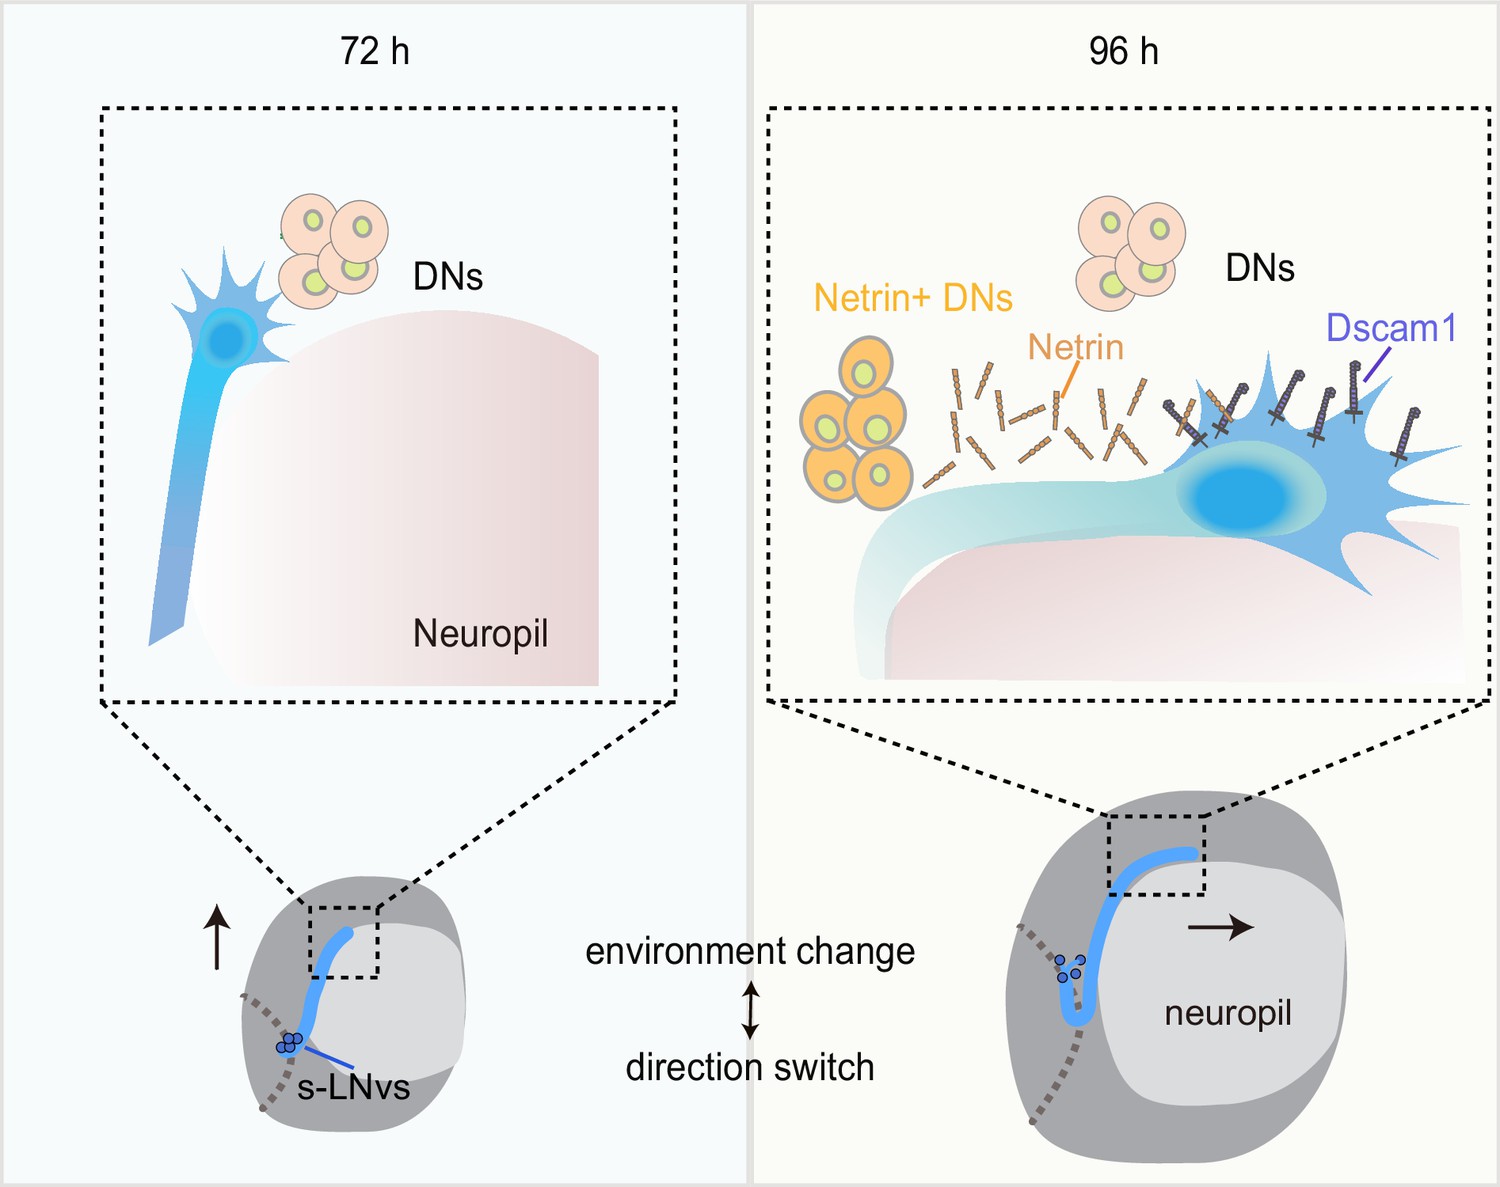
Dynamic cellular molecular environment during the small ventral lateral clock neuron (s-LNv) projection directional shift.
Cartoon depicting the dynamic cellular molecular microenvironment during the axonal projection directional shift from vertical to horizontal projection in s-LNvs. 72 and 96 hr represent 72 and 96 hr after larval hatching, respectively. s-LNvs (blue), neuropile (pink), brain lobe (gray circle), dorsal clock neurons (DNs; orange and light orange circles), optic lobe (gray dotted line), Netrin (orange combination molding), and Dscam1 (purple).
Tables
Key resources table
| Reagent type (species) or resource | Designation | Source or reference | Identifiers | Additional information |
|---|---|---|---|---|
| Genetic reagent (D. melanogaster) | Pdf-GAL4 | Bloomington Drosophila Stock Center | RRID:BDSC_6900 | |
| Genetic reagent (D. melanogaster) | nSyb-GAL4 | Bloomington Drosophila Stock Center | RRID:BDSC_51941 | |
| Genetic reagent (D. melanogaster) | repo-GAL4 | Bloomington Drosophila Stock Center | RRID:BDSC-7415 | |
| Genetic reagent (D. melanogaster) | OK107-GAL4 | Kyoto Stock Center | DGRC-106098 | |
| Genetic reagent (D. melanogaster) | Tab2-201Y-G AL4 | Bloomington Drosophila Stock Center | RRID:BDSC-4440 | |
| Genetic reagent (D. melanogaster) | Tubulin-GAL4 | Bloomington Drosophila Stock Center | RRID:BDSC-5138 | |
| Genetic reagent (D. melanogaster) | per-GAL4 | Bloomington Drosophila Stock Center | RRID:BDSC-7127 | |
| Genetic reagent (D. melanogaster) | MB247-GAL4 | Bloomington Drosophila Stock Center | RRID:BDSC-50742 | |
| Genetic reagent (D. melanogaster) | Crz-GAL4 | Bloomington Drosophila Stock Center | RRID:BDSC-51976 | |
| Genetic reagent (D. melanogaster) | Pdf-GAL80 | Bloomington Drosophila Stock Center | RRID:BDSC-80940 | |
| Genetic reagent (D. melanogaster) | UAS--mCD8-GFP | Bloomington Drosophila Stock Center | RRID:BDSC-5137 | |
| Genetic reagent (D. melanogaster) | UAS--mCD8-GFP | Bloomington Drosophila Stock Center | RRID:BDSC-5130 | |
| Genetic reagent (D. melanogaster) | UAS--mCD8-RFP | Bloomington Drosophila Stock Center | RRID:BDSC-27392 | |
| Genetic reagent (D. melanogaster) | lexAop-mCD8-GFP | Bloomington Drosophila Stock Center | RRID:BDSC-32207 | |
| Genetic reagent (D. melanogaster) | Clk856-GAL4 | Bloomington Drosophila Stock Center | RRID:BDSC-93198 | |
| Genetic reagent (D. melanogaster) | UAS-rprC;;UAS-hid | Gifted from Yufeng Pan | N/A | |
| Genetic reagent (D. melanogaster) | Dscam11 | Bloomington Drosophila Stock Center | RRID:BDSC-5934 | |
| Genetic reagent (D. melanogaster) | Dscam121 | Gifted from Haihuai He | N/A | |
| Genetic reagent (D. melanogaster) | Dscam105518 | Bloomington Drosophila Stock Center | RRID:BDSC-11412 | |
| Genetic reagent (D. melanogaster) | NetAΔ | Bloomington Drosophila Stock Center | RRID:BDSC-66878 | |
| Genetic reagent (D. melanogaster) | NetBΔ | Bloomington Drosophila Stock Center | RRID:BDSC-66879 | |
| Genetic reagent (D. melanogaster) | NetABΔ | Bloomington Drosophila Stock Center | RRID:BDSC-66877 | |
| Genetic reagent (D. melanogaster) | NetB-GFP | Bloomington Drosophila Stock Center | RRID:BDSC-67644 | |
| Genetic reagent (D. melanogaster) | NetBtm | Bloomington Drosophila Stock Center | RRID:BDSC-66880 | |
| Genetic reagent (D. melanogaster) | UAS-Dscam1RNAi | Tsinghua Fly Center | THU3896 | |
| Genetic reagent (D. melanogaster) | UAS-NetARNAi | Tsinghua Fly Center | THU1972 | |
| Genetic reagent (D. melanogaster) | UAS-NetBRNAi | Tsinghua Fly Center | TH201500623.S | |
| Genetic reagent (D. melanogaster) | UAS-slitRNAi | Tsinghua Fly Center | THU1910 | |
| Genetic reagent (D. melanogaster) | UAS-pakRNAi | Tsinghua Fly Center | TH201500668.S | |
| Genetic reagent (D. melanogaster) | UAS-DockRNAi | Tsinghua Fly Center | THU2815 | |
| Genetic reagent (D. melanogaster) | UAS-SH3PX1RNAi | Tsinghua Fly Center | THU2738 | |
| Genetic reagent (D. melanogaster) | UAS-tsrRNAi | Tsinghua Fly Center | THU0972 | |
| Genetic reagent (D. melanogaster) | UAS-chicRNAi | Tsinghua Fly Center | THU0986 | |
| Antibody | anti-PDF (mouse monoclonal) | DSHB | C7; RRID:AB_760350 | IF(1:300) |
| Antibody | anti-HRP (rabbit monoclonal) | Jackson Immuno Research | Cat# 323-005-021, RRID:AB_2314648 | IF(1:500) |
| Antibody | anti-GFP FLUR 488 (rabbit polyclonal) | Invirtrogen | Cat# A-21311, RRID:AB_221477 | IF(1:200) |
| Antibody | anti-RFP (rabbit polyclonal) | Rockland | Cat# 600-401-379, RRID:AB_2209751 | IF(1:500) |
| Antibody | anti-GFP (chicken polyclonal) | Invirtrogen | Cat# A10262, RRID:AB_2534023 | IF(1:2000) |
| Antibody | anti-Myc (rabbit polyclonal) | Cell Signaling Technology | Cat# 9402, RRID:AB_2151827 | IF(1:200) |
| Antibody | Anti-Dscam1 18 mAb (mouse monoclonal) | Gift from Tzumin Lee (Yu et al., 2009) | N/A | IF(1:20) |
| Antibody | Goat Anti-Rabbit IgG H&L (Alexa Fluor 555) | Abcam | Cat# ab150078; RRID:AB_2722519 | IF(1:200) |
| Antibody | Goat Anti-Mouse IgG H&L (Alexa Fluor 647) | Abcam | Cat# ab150115, RRID:AB_2687948 | IF(1:200) |
| Antibody | Goat Anti-Rabbit IgG H&L (Alexa Fluor 488) preadsorbed | Abcam | Cat# ab150081; RRID:AB_2734747 | IF(1:200) |
| Antibody | Goat Anti-Mouse IgG H&L (Alexa Fluor 488) | Abcam | Cat# ab150113; RRID:AB_2576208 | IF(1:200) |
| Antibody | Goat Anti-Chicken IgY H&L (Alexa Fluor 488) | Abcam | Cat# ab150169; RRID:AB_2636803 | IF(1:200) |
| Recombinant DNA reagent | pUAST-HA-NetA (plasmid) | Gift from Duan R | N/A | |
| Recombinant DNA reagent | pUAST-HA-NetB (plasmid) | Gift from Duan R | N/A | |
| Software, algorithm | GraphPad Prism 8.0.2 | GraphPad | RRID:SCR_002798 | |
| Software, algorithm | Zeiss LSM Image Browser | Zeiss | https://www.zeiss.com/microscopy/int/downloads/lsm-5-series.html | |
| Software, algorithm | fiji | ImageJ | RRID:SCR_002285 |
Additional files
-
Supplementary file 1
Full genotypes of the flies that are shown in the main figures and figure supplements.
- https://cdn.elifesciences.org/articles/96041/elife-96041-supp1-v1.xlsx
-
Supplementary file 2
List of genes used for RNA-interfering (RNAi) screen.
- https://cdn.elifesciences.org/articles/96041/elife-96041-supp2-v1.xlsx
-
MDAR checklist
- https://cdn.elifesciences.org/articles/96041/elife-96041-mdarchecklist1-v1.docx
Download links
A two-part list of links to download the article, or parts of the article, in various formats.
Downloads (link to download the article as PDF)
Open citations (links to open the citations from this article in various online reference manager services)
Cite this article (links to download the citations from this article in formats compatible with various reference manager tools)
Spatiotemporal changes in Netrin/Dscam1 signaling dictate axonal projection direction in Drosophila small ventral lateral clock neurons
eLife 13:RP96041.
https://doi.org/10.7554/eLife.96041.3


