The full-length BEND2 protein is dispensable for spermatogenesis but required for setting the ovarian reserve in mice
- Genome Integrity and Instability Group, Institut de Biotecnologia i Biomedicina, Universitat Autònoma de Barcelona, Spain
- Department of Cell Biology, Physiology, and Immunology, Cytology and Histology Unit, Universitat Autònoma de Barcelona, Spain
- Molecular Mechanisms Program, Centro de Investigación del Cáncer and Instituto de Biología Molecular y Celular del Cáncer (CSIC-Universidad de Salamanca), Spain
- Institut de Biotecnologia i de Biomedicina, Universitat Autònoma de Barcelona, Spain
- Centro de Investigación Biomédica en Red de Bioingeniería, Biomateriales y Nanomedicina, Instituto de Salud Carlos III, Spain
- Departament de Genètica i de Microbiologia, Universitat Autònoma de Barcelona, Spain
- Servei de Cultius Cel·lulars, Producció d'Anticossos i Citometria, Universitat Autònoma de Barcelona, Spain
- Transgenic Animal Unit, Center of Animal Biotechnology and Gene Therapy, Universitat Autònoma de Barcelona, Spain
Figures
Figure 1 with 1 supplement
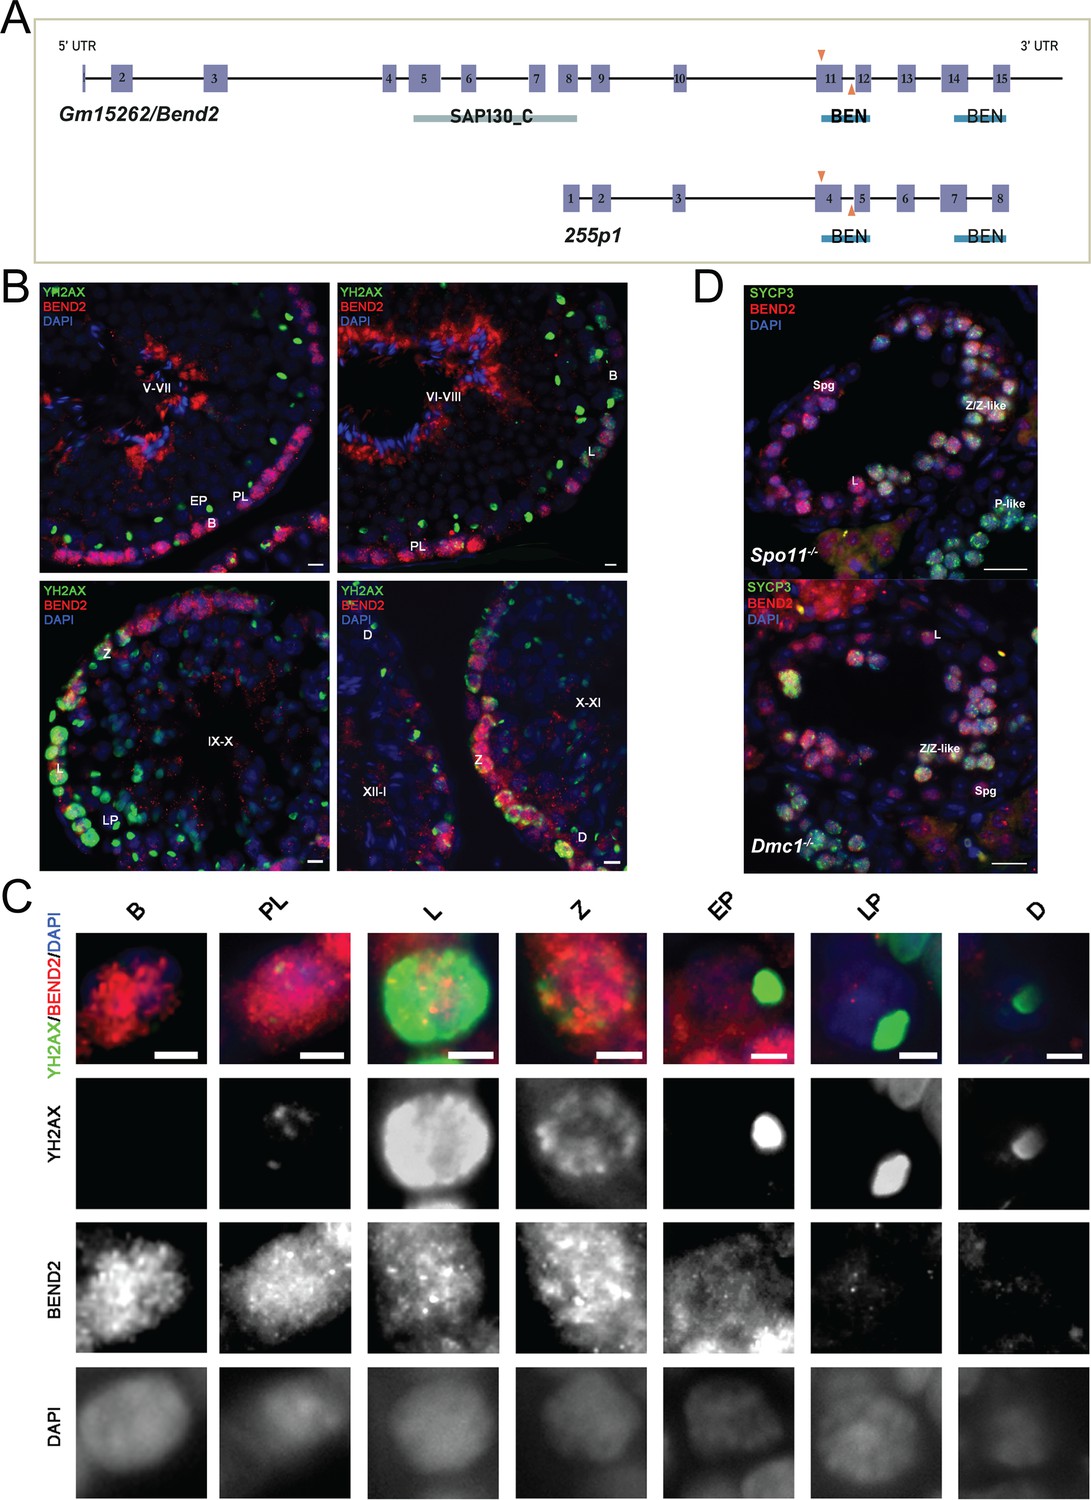
Expression of BEND2 during spermatogenesis.
(A) Schematic representation of mouse Gm15262/Bend2 and its novel splice variant 255 p1. The exons are shown as purple boxes. The predicted domains are labeled below the exons. SAP130_C: C-terminal domain of histone deacetylase complex subunit SAP130; BEN: BEN domain. A pair of gRNAs (orange arrows) target exon 11 of Bend2 within the first BEN domain to generate the Bend2D11 mutation by CRISPR/Cas9. The in-house BEND2 antibody is generated using full-length 255P1 sequence as immunogen. (B) BEND2 localization in wild-type mouse testis. Staging of the seminiferous epithelium is based on the localization of spermatocytes (indicated by the expression and localization of YH2AX (green)) and spermatids (indicated by DAPI). The tubule stage is shown in uppercase Roman numerals. Scale bar, 20 µm. (C) Magnification of BEND2-positive cells from testis sections. Expression of BEND2 was characterized in cells along spermatogenesis from spermatogonia to late diplotene spermatocyte. Scale bar, 10 µm. (D) BEND2 localization in SPO11- and DMC1-deficient testis. In these cases, SYCP3 (green) was used to identify spermatocytes. Scale bar, 50 µm. Spg: spermatogonia; B: B-type spermatogonia; PL: pre-leptotene spermatocyte; L: leptotene spermatocyte; Z: zygotene spermatocyte; Z-like: zygotene-like spermatocyte; EP: early pachytene spermatocyte; LP: late pachytene spermatocyte; P-like: pachytene-like spermatocyte; D: diplotene spermatocyte.
Figure 1—figure supplement 1
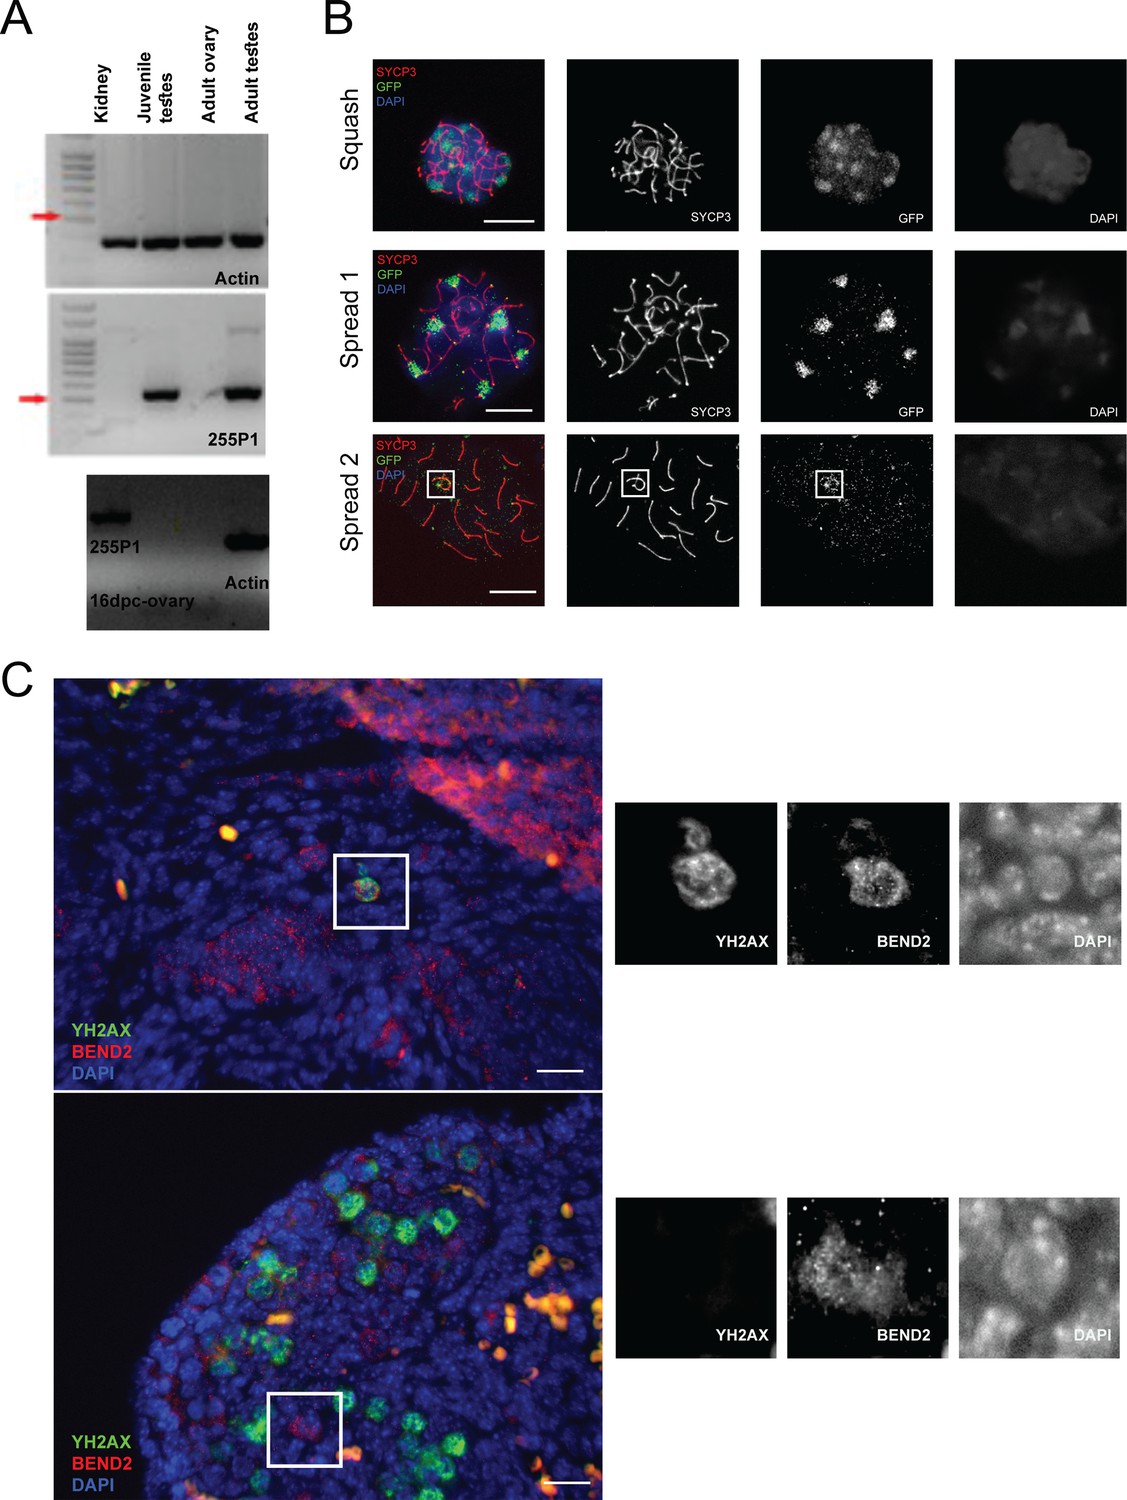
Expression and localization of Bend2 (A) Expression of 255P1 in mouse gonads and somatic tissues by RT-PCR.
Actin-400bp; 255P1-576bp.(B) Expression pattern of EGFP-255P1 in mouse testis. Representative images of spermatocyte squash and spread stained against SYCP3 and GFP. DNA is counterstained with DAPI (blue). Squash: patch-like signals at the heterochromatic region. Spread 1: cell exhibiting clear foci signals at telomeres along with patch-like signals. Spread 2: cell exhibiting foci signals at the chromosomal telomeres and axes. Signal accumulation at XY chromosomes (white square). Scale bar, 10 µm. (C) BEND2 localization in 16 dpc wild-type mouse ovary. 16 dpc ovary sections were treated with antigen retrieval using Tris-EDTA buffer and stained with BEND2 (red) antibody and YH2AX (green) antibody. Strong BEND2 signals were occasionally found in early meiotic prophase oocytes (upper) and oogonia (lower) before DSBs appeared. Scale bar, 20 µm.
-
Figure 1—figure supplement 1—source data 1
Source images for Figure 1—figure supplement 1A.
- https://cdn.elifesciences.org/articles/96052/elife-96052-fig1-figsupp1-data1-v1.zip
-
Figure 1—figure supplement 1—source data 2
Source images for Figure 1—figure supplement 1A.
- https://cdn.elifesciences.org/articles/96052/elife-96052-fig1-figsupp1-data2-v1.zip
Figure 2
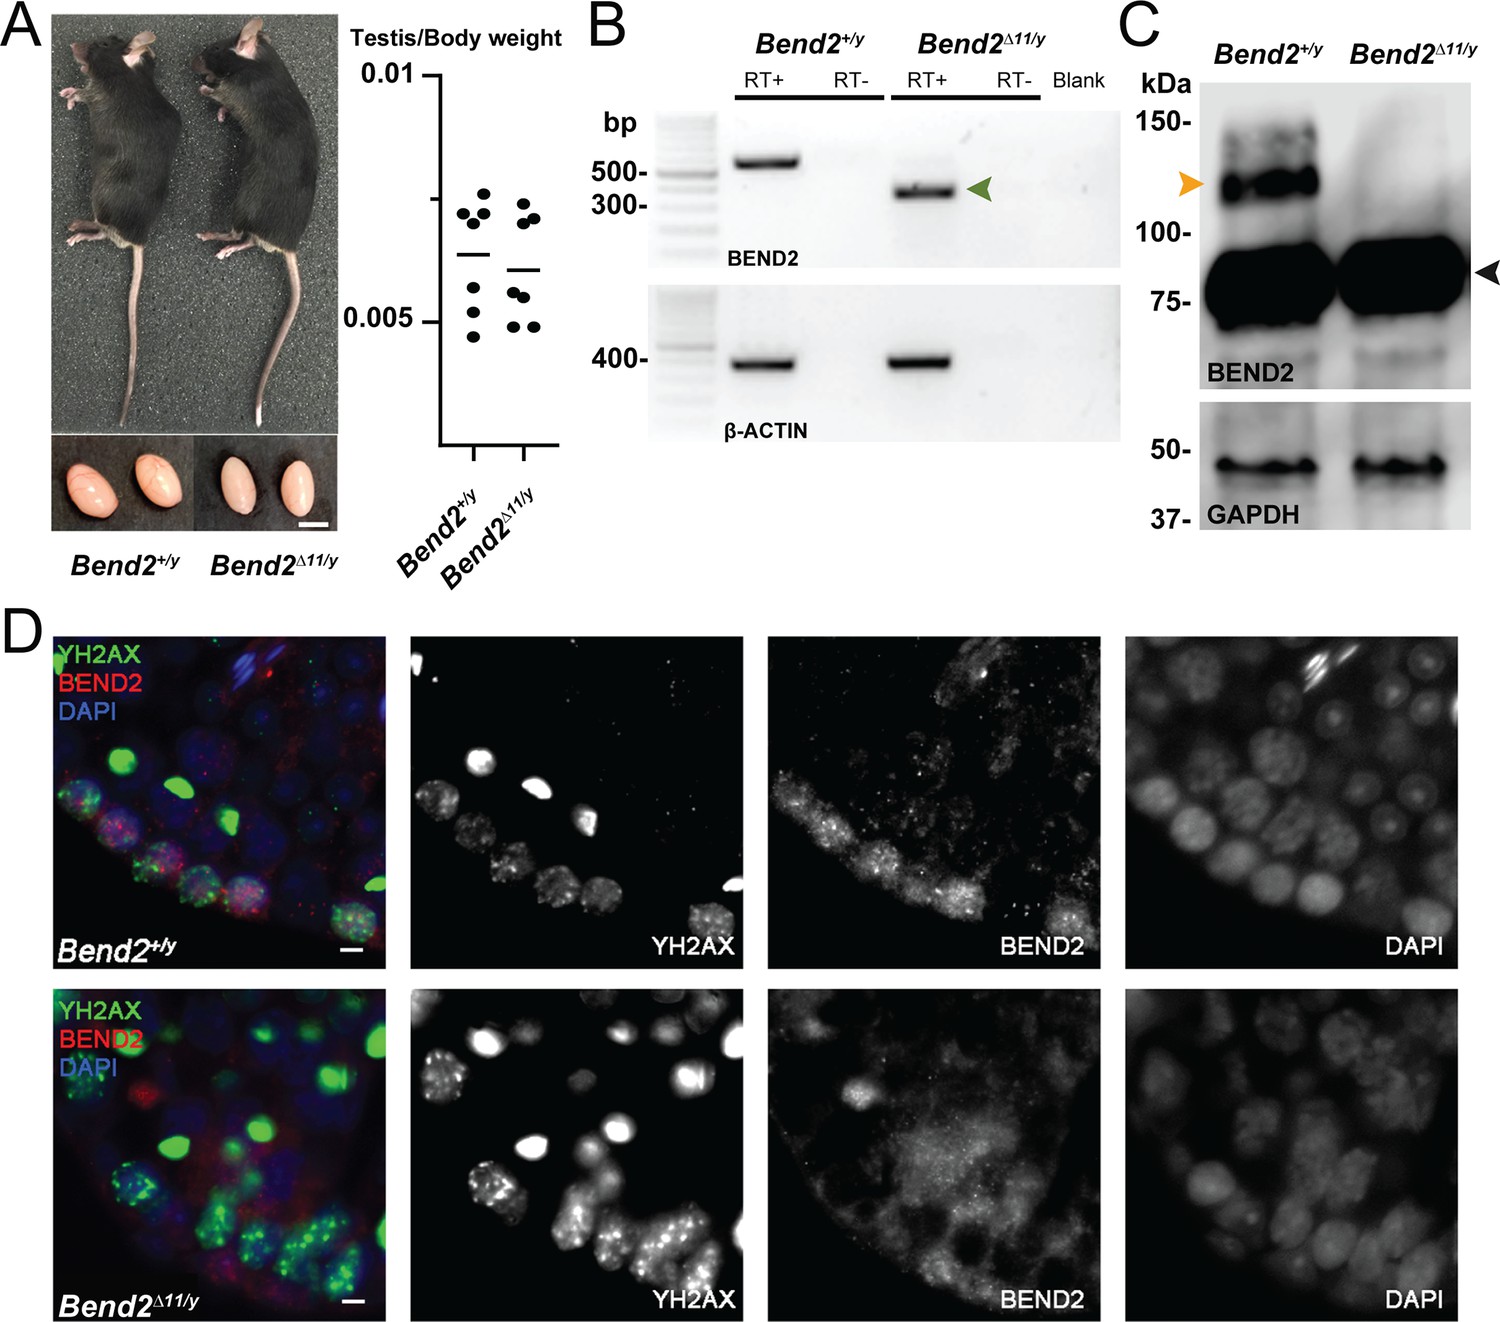
Disruption of BEND2 in Bend2D11/y mice.
(A) Mouse appearance and testis size. Scale bar, 5 mm. (B) Bend2 expression in testis by RT-PCR. The expected size of the wild-type (WT) allele was 576 bp. Sanger sequencing results showed that the amplified DNA in the mutated allele (372 bp, green arrowhead) was from an mRNA that resulted from skipping exon 11 of Bend2. (C) Detection of BEND2 by WB from testis protein extracts. The orange arrowhead indicates the full-length BEND2 protein band. An extra protein band ~75 kDa (black arrowhead) was also detected in both wild-type and mutant testes. (D) Detection of BEND2 by IF. Testis sections were treated with antigen retrieval using Tris-EDTA buffer before staining against BEND2 (red) and SYCP3 (green). The BEND2 staining observed in the Bend2 mutants closely resembles background staining (not shown), suggesting that the cytoplasmic signal might be nonspecific. Scale bar, 10 µm.
-
Figure 2—source data 1
Source images for Figure 2B.
- https://cdn.elifesciences.org/articles/96052/elife-96052-fig2-data1-v1.zip
-
Figure 2—source data 2
Source images for Figure 2B.
- https://cdn.elifesciences.org/articles/96052/elife-96052-fig2-data2-v1.zip
Figure 3
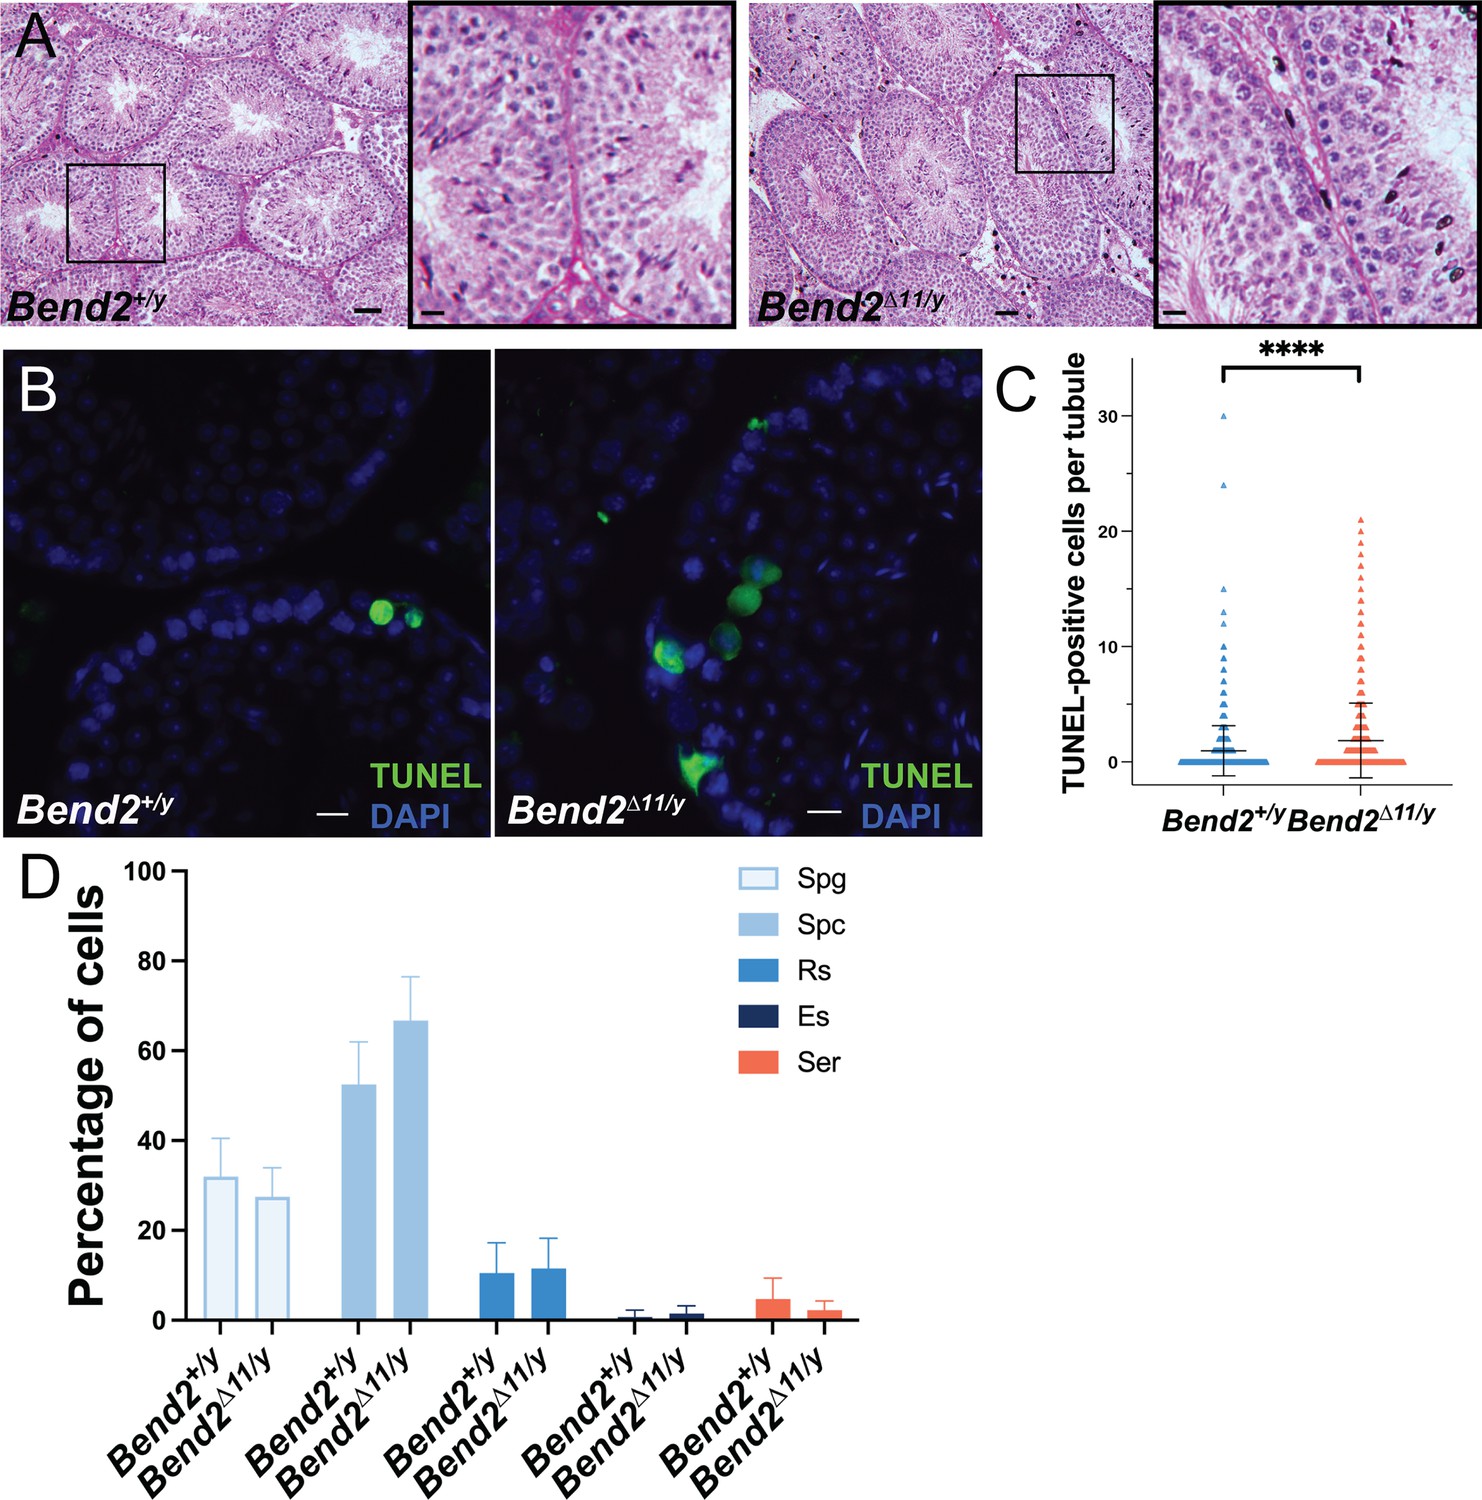
The full-length BEND2 is dispensable to complete spermatogenesis in mice.
(A) Representative PAS-H stained mouse testis sections. The square in the left image shows the zoomed images on the right. Scale bar on the right images, 20 µm. (B) Apoptosis detection on testis sections by TUNEL assay. Scale bar, 20 µm. (C) Quantification of TUNEL-positive cells. The horizontal lines represent the mean ± SD. N=1,125 for Bend2+/y; N=1195 for Bend2D11/y, ****p<0.0001 t-test. (D) Classification of TUNEL-positive cells. The columns and error lines indicate the mean ± SD. N=4, p>0.05 One-Way ANOVA.
Figure 4 with 2 supplements
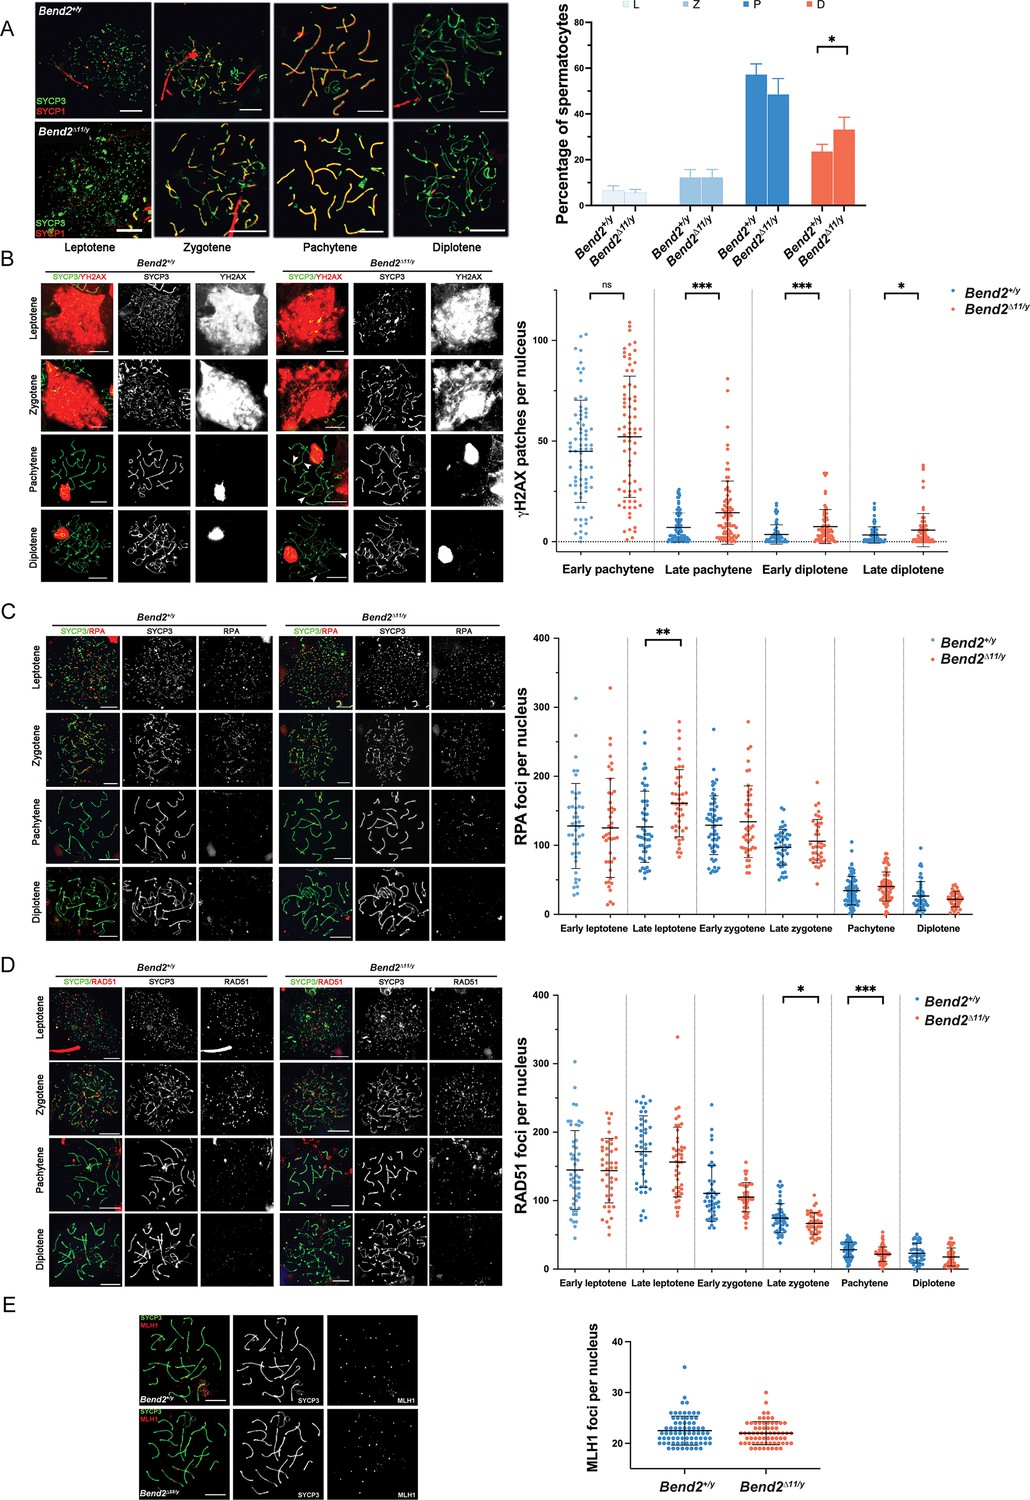
Bend2D11/y males display minor recombination defects.
(A) Chromosomal synapsis in spermatocytes. Representative images of SYCP3 and SYCP1 staining in spermatocyte nuclei from the stages shown (left). Meiotic prophase staging of spermatocytes (right). L: leptotene, Z: zygotene, P: pachytene, D: diplotene. The columns and lines indicate the mean and SD. N=4, *p=0.019 One-Way ANOVA. (B) Examination of DSBs in Bend2D11/y spermatocytes. Representative images of YH2AX staining in spermatocyte nuclei along meiotic prophase (left). Increased YH2AX signals are detected during late prophase in Bend2D11/y spermatocyte (white arrowhead). Quantification of YH2AX patches in spermatocyte nuclei per sub-stages (right). The patches were counted manually using the same method for every pair of control and mutant mice. From left to right, N=76/74, 86/83, 73/75, and 78/81, ***p=0.0001 (late pachytene) and 0.0007 (early diplotene), *p=0.0222 t-test. Analysis of replication protein A (RPA) (C) and RAD51 (D) foci counts in control and Bend2D11/y spermatocytes. RPA and RAD51 foci were counted using ImageJ with the same method for every Bend2+/y and Bend2D11/y mice pair. From left to right, N=44/43, 51/43, 59/46, 45/39, 81/77, and 48/43, **p=0.0015 for RPA quantification; N=52/43, 42/46, 44/46, 51/45, 77/73, and 45/49, *p=0.0428 and ***p=0.0002 for RAD51 quantification; t-test. (C) Examination of CO formation in Bend2D11/y spermatocytes. Representative images of MLH1 in control and mutant spermatocyte nuclei (left). Quantification of MLH1 foci in spermatocyte nuclei (right). Only spermatocytes containing ≥19 MLH1 foci/nucleus were counted. N=74 for Bend2+/y and 68 for Bend2D11/y, p>0.05 Mann-Whitney test. The horizontal lines represent mean ± SD (B–E). Scale bar, 10 µm.
Figure 4—figure supplement 1
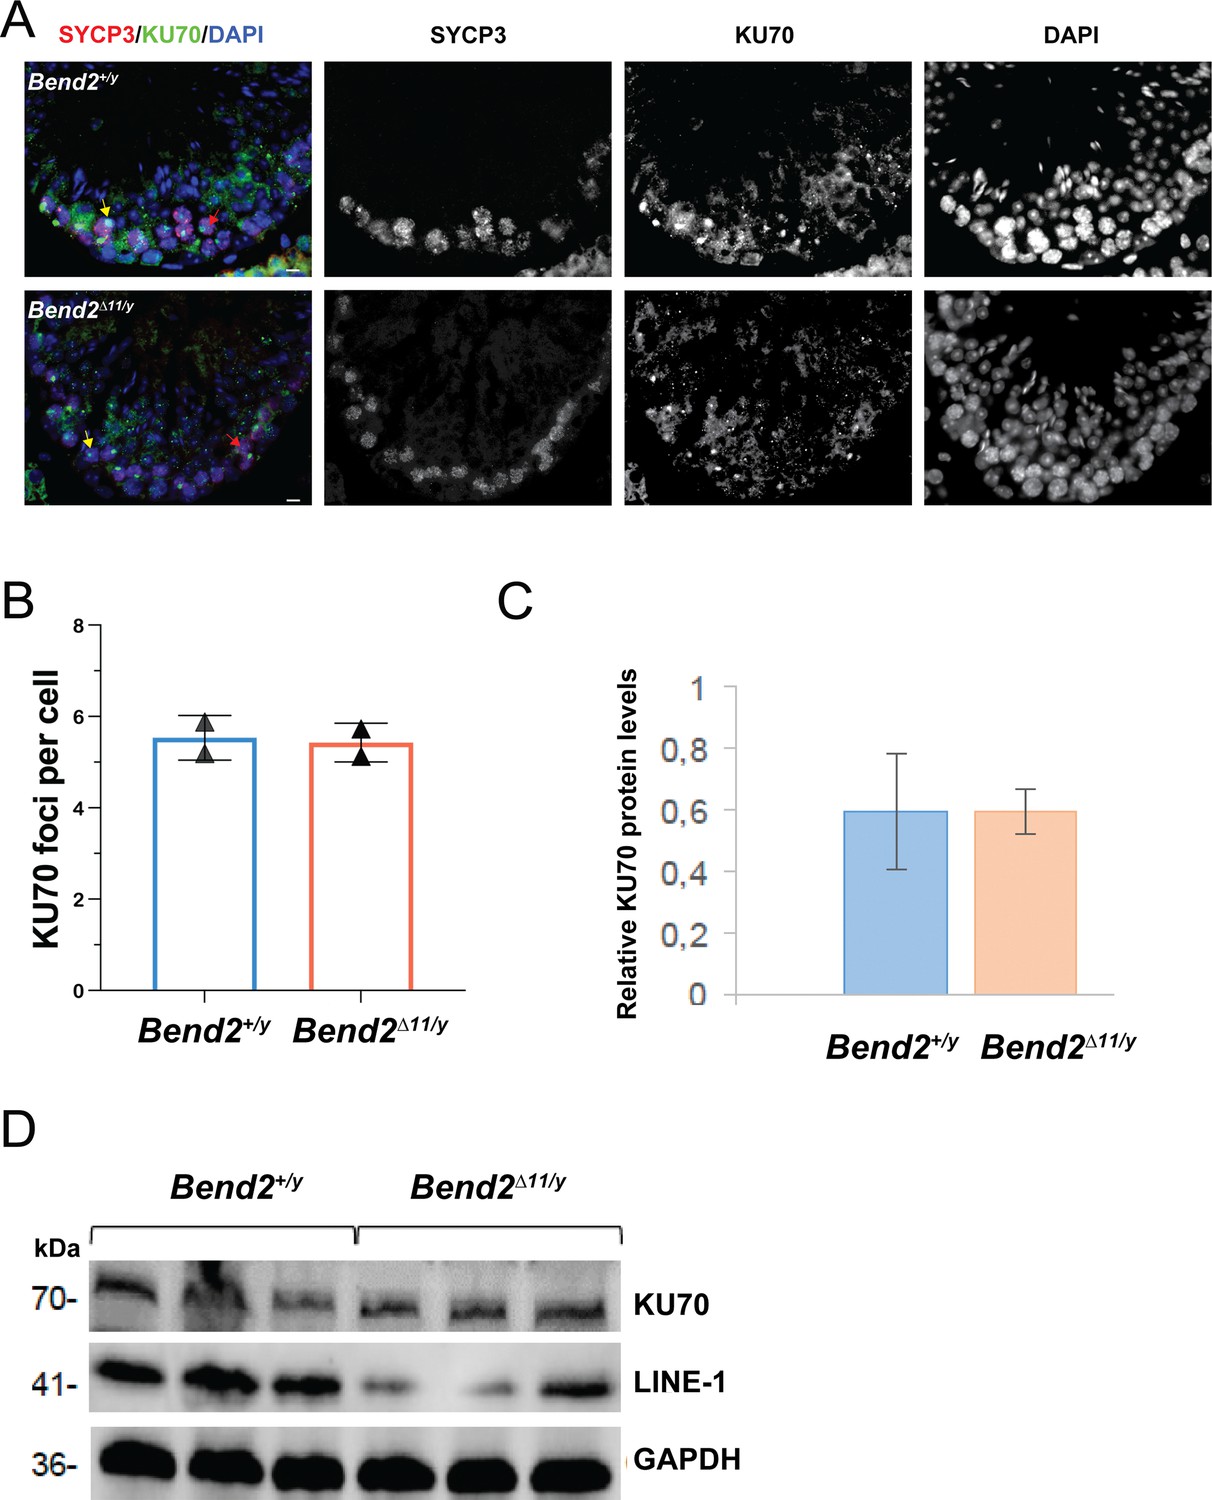
Examination of the non-homologous end joining (NHEJ) pathway activity in Bend2D11/y mice.
(A) Representative images of Ku70 expression pattern in wild-type and Bend2D11/y testis. Scale bar, 40 μm. Yellow arrows indicate the Ku70-positive sex body, and red arrows are two examples of Ku70 foci. (B) Quantification of Ku70 foci in pachytene and diplotene spermatocytes. Foci colocalizing on SYCP3 were counted manually from at least 40 cells per animal. The columns and lines indicate the mean and SD (N=2). (C) Western blot analysis of Ku70 and LINE-1 proteins. (D) Quantification of relative Ku70 protein levels by WB. The columns and lines indicate the mean and SD (N=3).
-
Figure 4—figure supplement 1—source data 1
Source images for Figure 4D.
- https://cdn.elifesciences.org/articles/96052/elife-96052-fig4-figsupp1-data1-v1.zip
-
Figure 4—figure supplement 1—source data 2
Source images for Figure 4D.
- https://cdn.elifesciences.org/articles/96052/elife-96052-fig4-figsupp1-data2-v1.zip
Figure 4—figure supplement 2
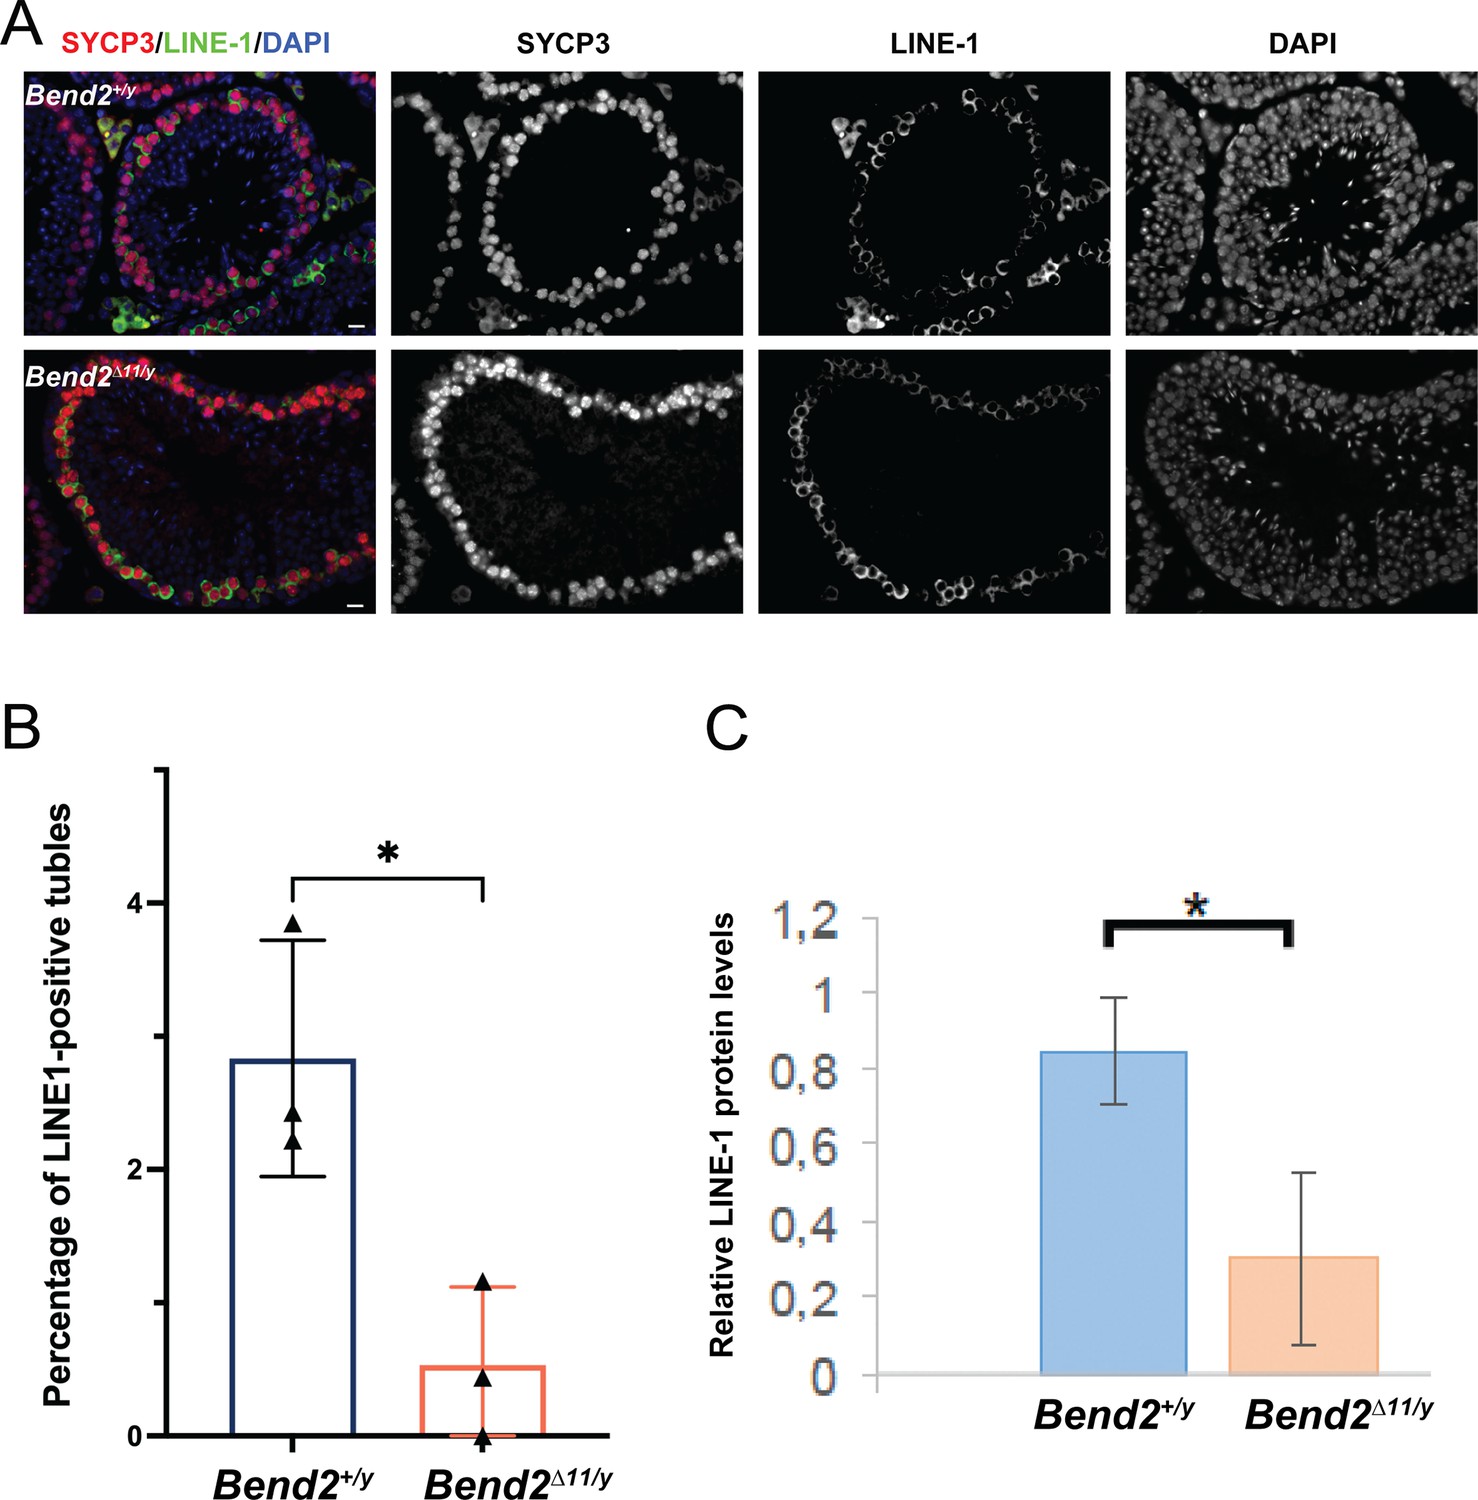
Analysis of LINE-1 retrotransposon expression in Bend2D11/y mice.
(A) Representative images of LINE-1 expression pattern in wild-type and Bend2D11/y testis. Scale bar, 40 μm. Quantification of LINE-1 positive tubules (B) and relative protein levels in Bend2D11/y animals from Figure S2 (C). The columns and lines indicate the mean and SD (N=3). *p=0.046 (B) and *p=0.02 (C) t-test.
Figure 5 with 2 supplements
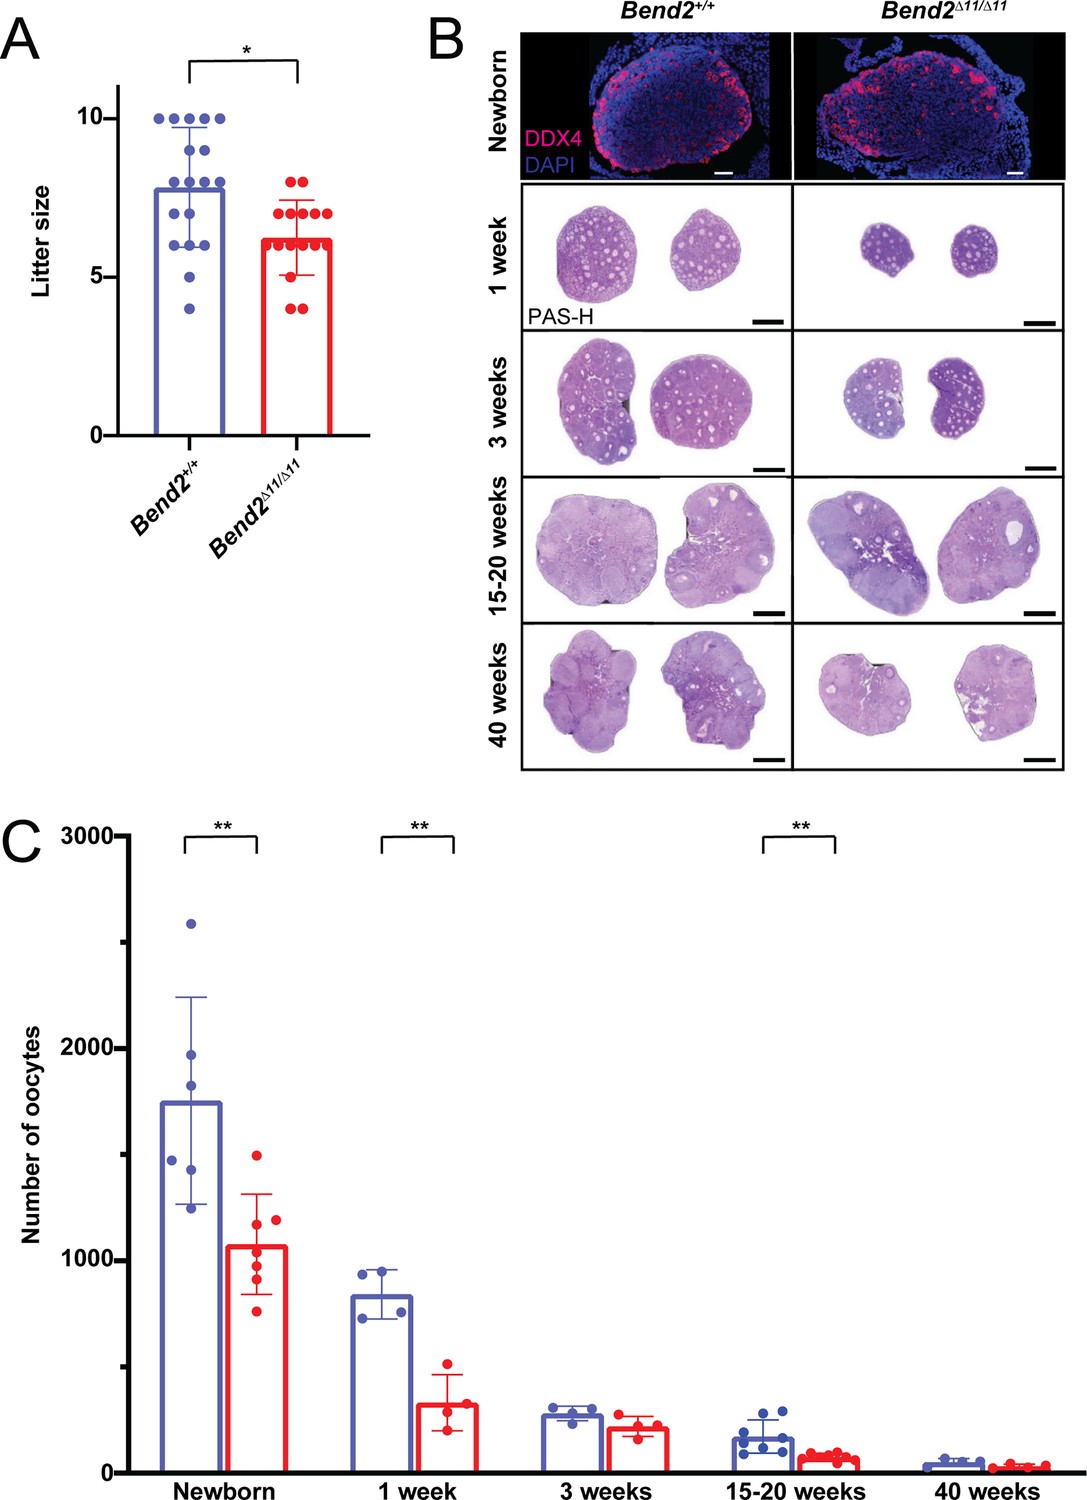
Oogenesis is altered in Bend2 mutant females.
(A) Fertility evaluation of Bend2D11/D11 females. Two-month-old Bend2D11/D11 females were crossed with wild-type males for 5 months; litter size data of four animals per genotype were collected for analysis. *p=0.0069, t-test. (B) DDX4-stained and Periodic Acid Schiff-Hematoxylin (PAS-H) stained histological ovary sections from females at different ages. Scale bars, 50 µm for Immunofluorescent images and 0.5 mm for the PAS-H stained ones. (C) Quantification of the number of oocytes found in the analyzed ovaries of newborn, one, three, 15–20, and 40 weeks old mice. The columns and lines indicate the mean and SD. **p=0.0075, 0.0012, and 0.0040; t-test.
Figure 5—figure supplement 1
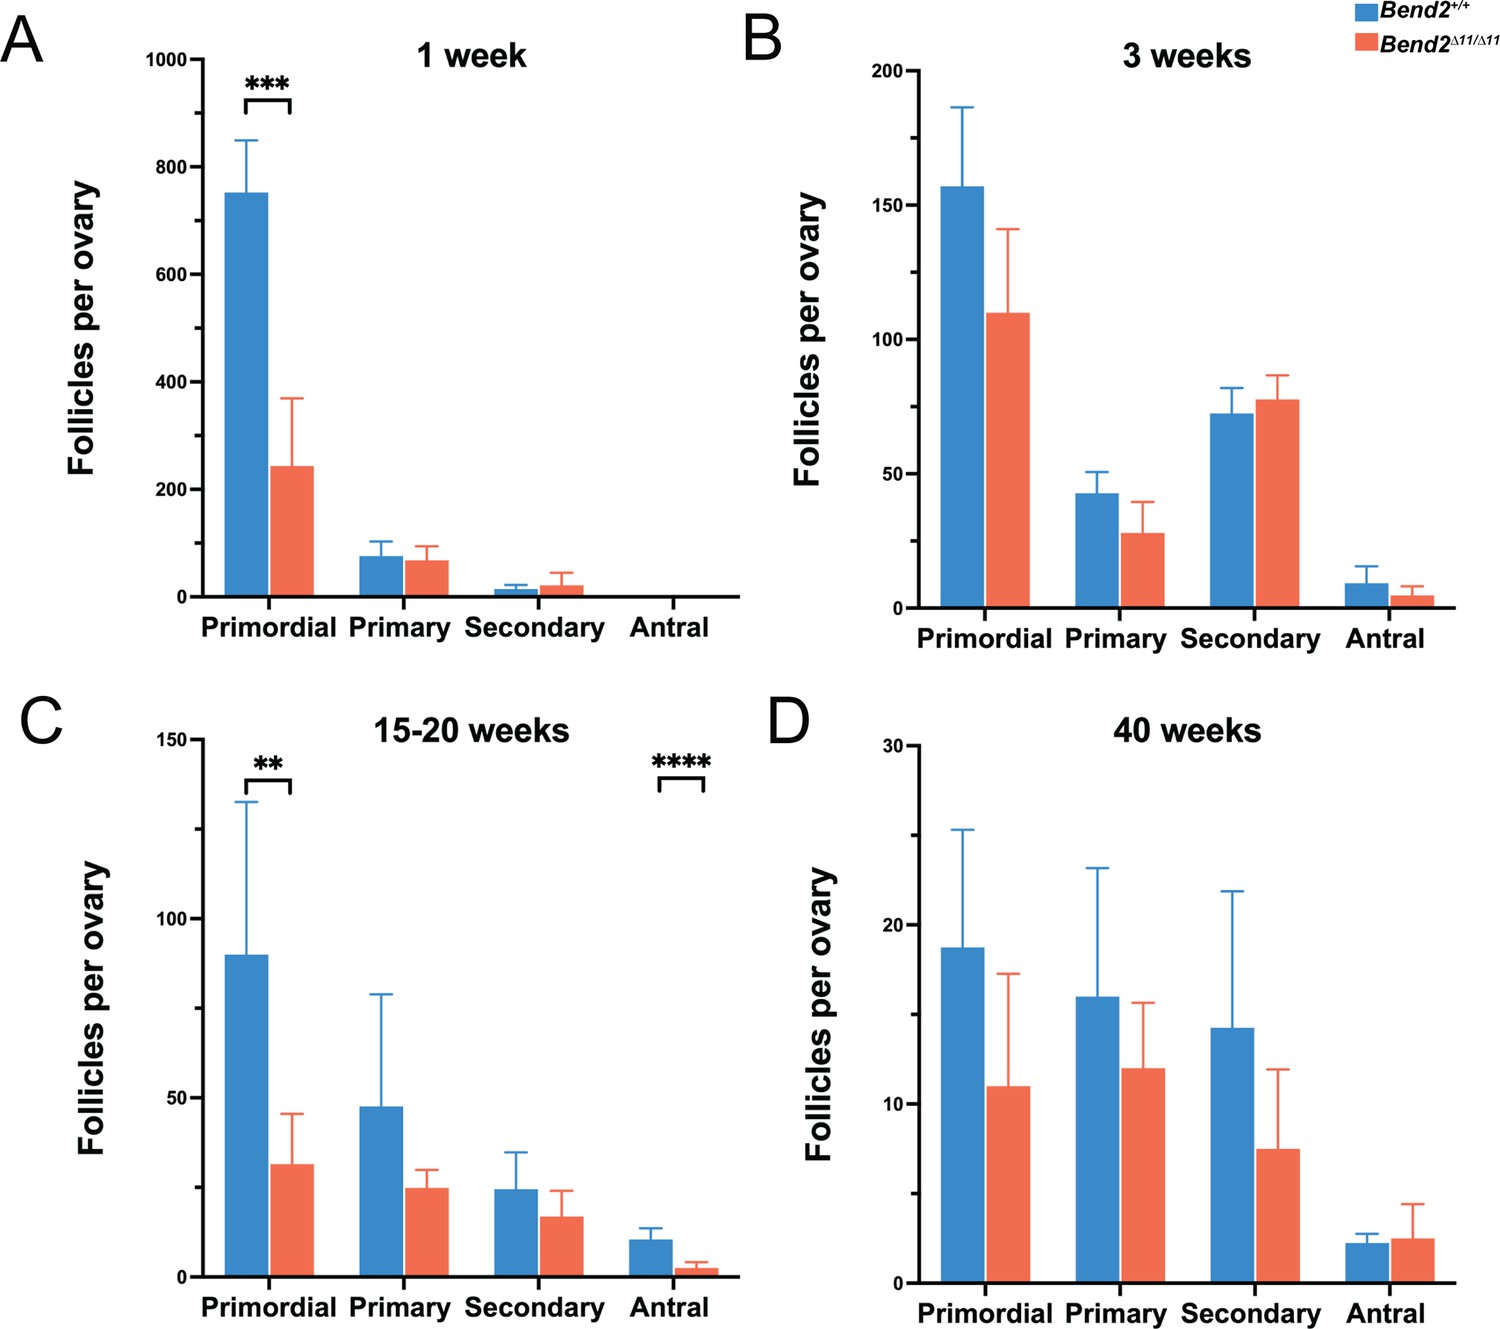
Classification of the type of follicles found in control and Bend2D11/D11 ovaries.
Classification of analyzed follicles from ovaries at the age of 1 week (A), 3 weeks (B), 15–20 weeks (C), and 40 weeks (D). The number of ovaries analyzed per genotype and age is four, except for 15–20 weeks, where eight ovaries were analyzed per genotype. The columns and lines indicate the mean and SD. ***p=0.0007 (A); **p=0.0024, ****p<0.0001 (C); t-test.
Figure 5—figure supplement 2
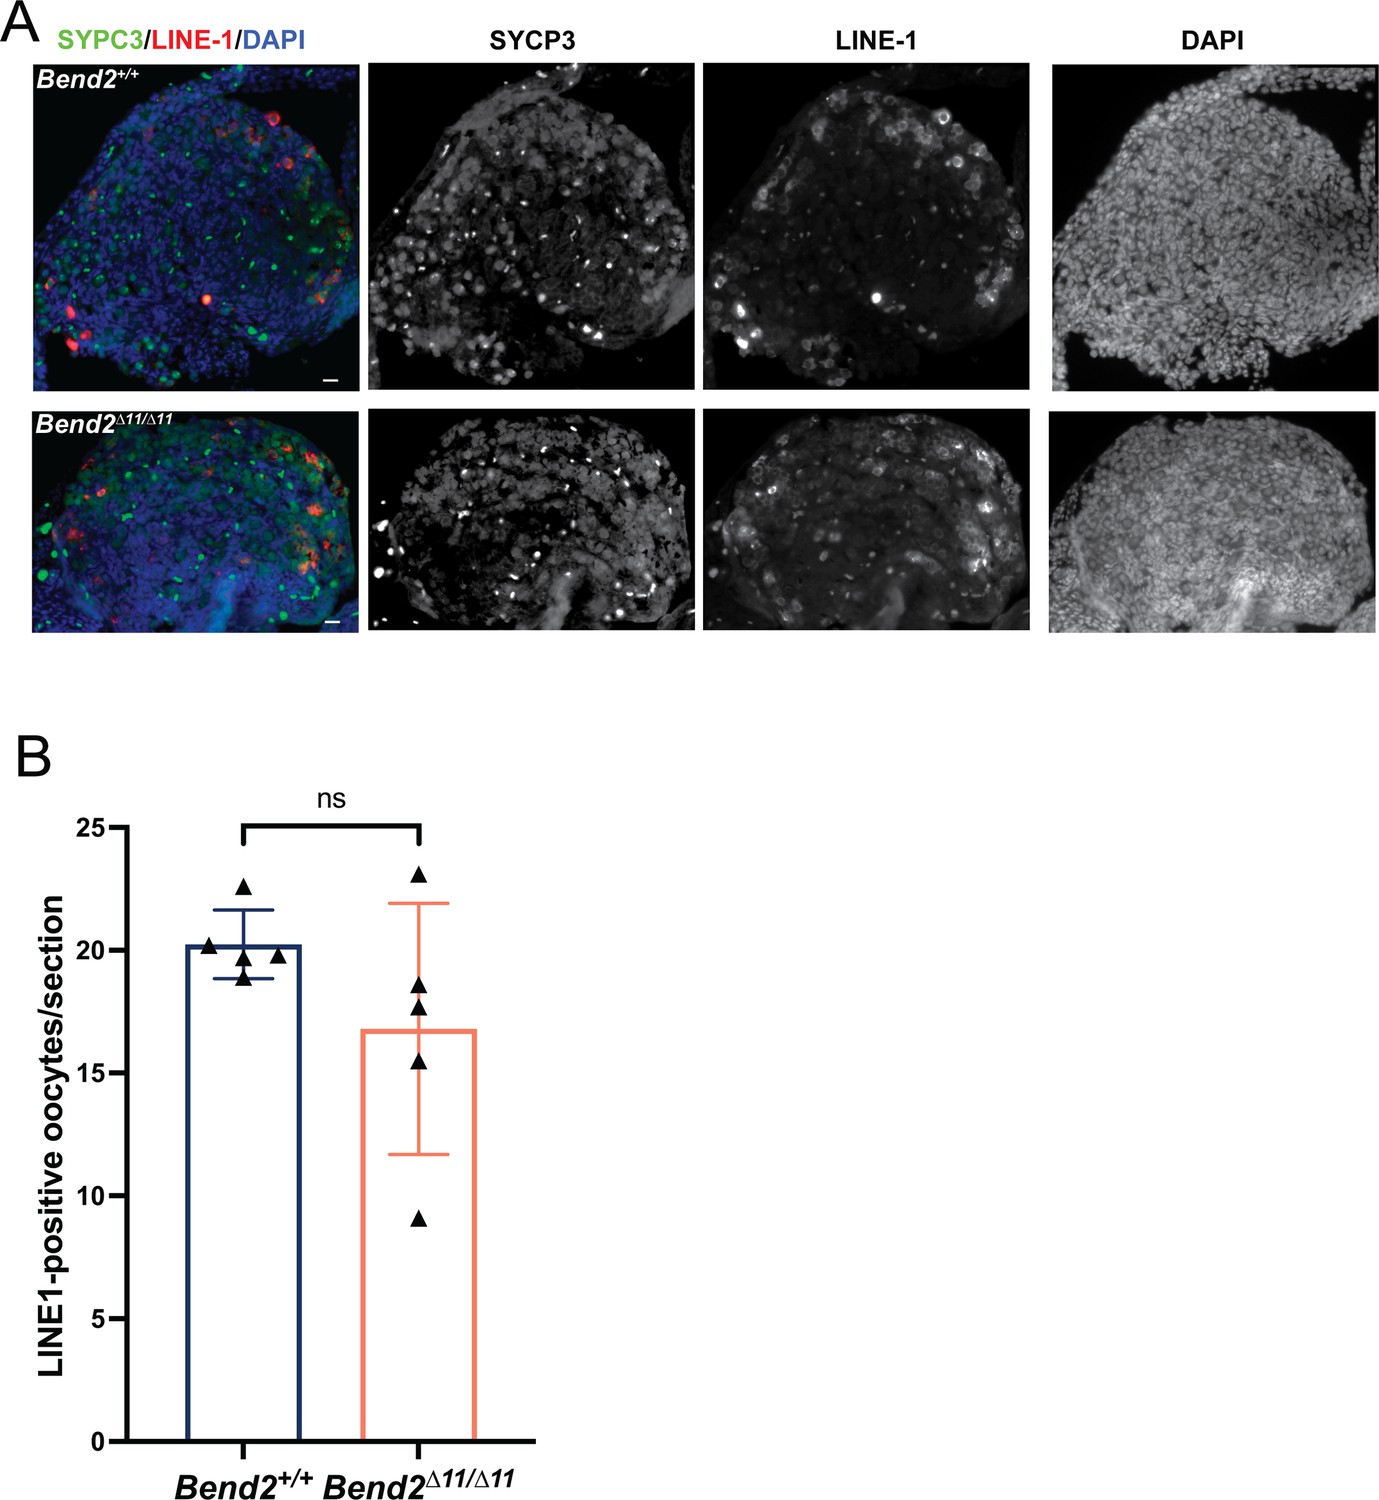
Analysis of LINE-1 retrotransposon expression in Bend2D11/D11 mice.
(A) Representative images of LINE-1 expression pattern in wild-type and Bend2D11/D11 ovaries. Scale bar, 40 μm. (B) Quantification of LINE-1 positive oocytes per section. The columns and lines indicate the mean and SD (N=5), p=0.1851 t-test.
Figure 6
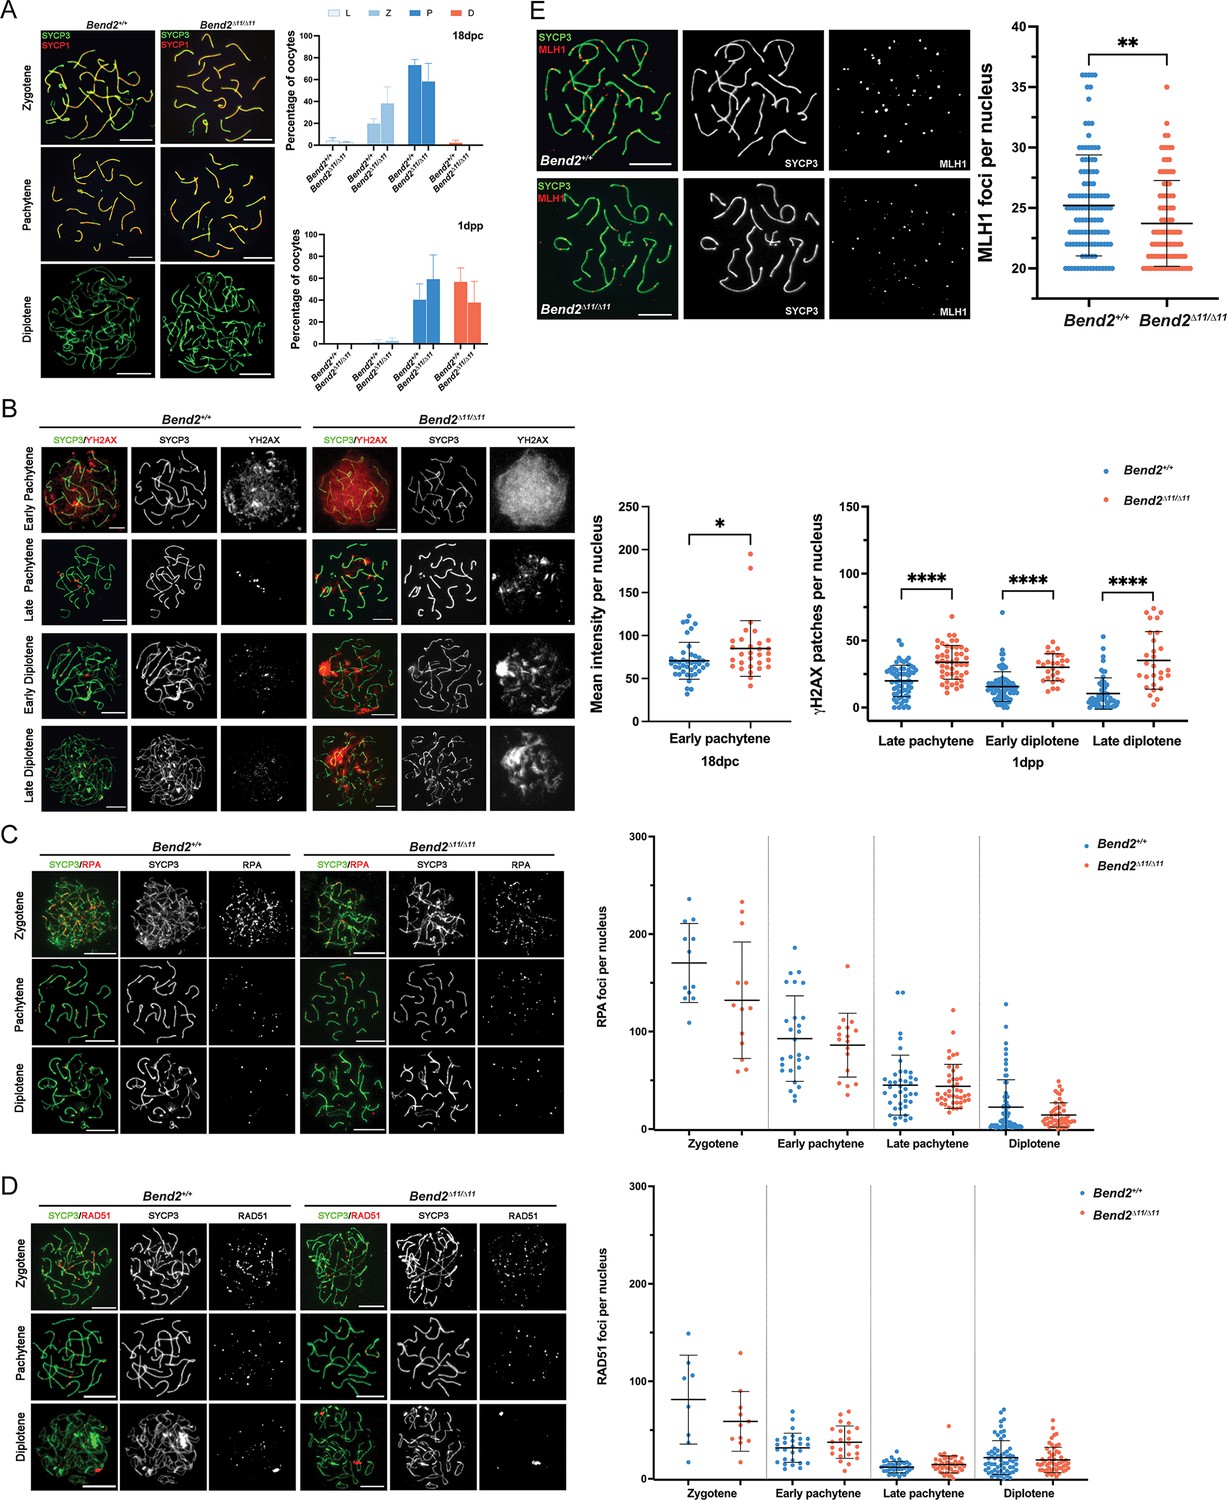
Synapsis and recombination in Bend2D11/D11 females.
(A) Chromosomal synapsis in oocytes. Representative images of SYCP3 and SYCP1 staining in 18 dpc and 1 dpp oocyte nuclei are shown (left). Meiotic prophase staging of 18 dpc and 1 dpp oocytes (right). L: leptotene, Z: zygotene, P: pachytene, D: diplotene. The columns and lines indicate the mean and SD. The number of animals analyzed per genotype, 2 for 18 dpc and 3 for 1 dpp. p>0.5 for all the comparisons One-Way ANOVA. (B) Examination of DSBs in Bend2D11/D11 oocytes. Representative images of ϒH2AX staining in 18 dpc and 1 dpp oocyte nuclei at the pachytene and diplotene stage (left). Quantification of ϒH2AX patches in oocyte nuclei at sub-stages (right). The mean intensity of ϒH2AX staining in 18 dpc oocyte nuclei was measured by Image J. The patches of ϒH2AX in 1 dpp oocyte nuclei were counted manually. The horizontal lines represent the mean ± SD. From left to right, the number of analyzed nuclei per genotype: 40/30, 64/48, 81/27, and 57/28. *p=0.0288, ****p<0.0001 t-test. (C) Analysis of replication protein A (RPA) (C) and RAD5 (D) foci in control and Bend2D11/D11 oocytes. Representative images of RPA staining in 18 dpc and 1 dpp oocyte nuclei from zygotene to diplotene stage (left). Quantification of RPA foci present in oocyte nuclei at sub-stages (right). Zygotene and early pachytene nuclei analyzed were from 18 dpc ovaries, and late pachytene and diplotene nuclei analyzed were from 1 dpp ovaries. Foci were counted manually. The horizontal lines represent the mean ± SD. From left to right, number of analyzed nuclei: 12/13, 27/17, 41/42, and 65/49 for RPA, and 8/11, 27/23, 38/46, and 62/55 for RAD51. p>0.5 for all the comparisons t-test. (E) Examination of CO formation in control and Bend2D11/D11 oocytes. Representative images of MLH1 in 1 dpp oocyte nuclei (left). Quantification of MLH1 foci in 1 dpp oocyte nuclei (right). Only oocytes containing ≥20 MLH1 foci/nucleus were counted. The horizontal lines represent the mean ± SD. N=120 for Bend2+/+, 95 for Bend2D11/D11; **p=0.0057 Mann-Whitney test. Scale bar, 10 µm.
Tables
Table 1
Bend2D11/D11 oocytes fertilize and develop into blastocyst stage similar to control oocytes.
| Group | Genotype | # mouse | Age (months) | # oocyte | # 2 cell embryo | Fertilization (%) | Blastocyst (%) |
|---|---|---|---|---|---|---|---|
| Control | Bend2+/D11 | 3 | 7 | 10.7±7.2 | 7.7±3.8 | 78.0±19.5 | 23.3±25.2 |
| Mutant | Bend2D11/D11 | 3 | 7 | 10.0±2.0 | 8.3±3.2 | 82.7±20.5 | 46.8±12.2 |
Key resources table
| Reagent type (species) or resource | Designation | Source or reference | Identifiers | Additional information |
|---|---|---|---|---|
| Gene (M. musculus) | Bend2 | Ensembl | ENSMUSG00000108981 | Gm15262 |
| Genetic reagent (M. musculus) | Bend2D11/D11 or Bend2D11/y | This paper | Available from the authors upon request Dr. Ignasi Roig Ignasi.Roig@uab.cat | |
| Sequence-based reagent | gRNA 1-antisense | This paper (Sigma) | gRNA | AGTAGCAGGCTGCATAAGT GGG |
| Sequence-based reagent | gRNA 2-sense | This paper (Sigma) | gRNA | AGACCAGCCTTATTGACCA TGG |
| Strain, strain background (Escherichia coli) | 5-alpha competent E. coli cells | New England Biolabs. | C2987H | competent cells |
| Strain, strain background (Escherichia coli) | E. coli BL21(DE3) | NCBI | 469008 | competent cells |
| Cell line (H. sapiens) | HEK 293T | Cellosaurus | CVCL_0063 | Cell line maintained in SCAC, Institut de Biotecnologia i de Biomedicina |
| Antibody | anti-BEND2 Rb | This paper | IF(1:100), WB (3.2 μg/ml) Available from the authors upon request Dr. Ignasi Roig Ignasi.Roig@uab.cat | |
| Antibody | anti-Ku70 Rb | Abcam | ab92450 | IF (1:100) WB (1:2000) |
| Antibody | anti-GAPDH Rb | Abcam | ab37168 | WB (1:2000) |
| Antibody | anti- SYCP3 Ms or Rb | Abcam | ab97672 or ab15093 | IF (1:200) |
| Antibody | anti- SYCP1 Rb | Abcam | ab15090 | IF (1:200) |
| Antibody | anti-phospho-Histone H2A.X Ms | Millipore | 05–636 | IF (1:400) |
| Antibody | anti-MLH1 Ms | BD Biosciences | 51-1327GR | IF (1:50) |
| Antibody | RPA32 (4E4) Rat | Cell Signalling | 2208 S | IF (1:100) |
| Antibody | anti-RAD51 (ab-1) Rb | Millipore | PC130 | IF (1:100) |
| Antibody | anti-GFP Rb | Thermo Fisher Scientific | A-11122 | IF (1:200) |
| Antibody | anti-LINE1 ORF1p Rb | Abcam | ab216324 | IF (1:100) WB (1:2000) |
| Antibody | anti-rabbit HPR | Bio-Rad | 170–6515 | WB (1:5000) |
| Recombinant DNA reagent | pEGFP-C1 | Clontech | Catalog:6084–1 | |
| Recombinant DNA reagent | pEGFP-N1 | Clontech | Catalog:6085–1 | |
| Recombinant DNA reagent | This paper | Available from the authors upon request Dr. Ignasi Roig Ignasi.Roig@uab.cat | ||
| Recombinant DNA reagent | pEGFP-N1-BEND2 | This paper | Available from the authors upon request Dr. Ignasi Roig Ignasi.Roig@uab.cat | |
| Recombinant DNA reagent | pET-28a (+)-TEV | This paper | Dr. Neus Ferrer Miralles Institut de Biotecnologia i de Biomedicina, | |
| Sequence-based reagent | forward | This paper | PCR primers | BEND2 genotyping; TTGCCAGTGGGGTATTACGA |
| Sequence-based reagent | reverse | This paper | PCR primers | BEND2 genotyping; CAGGGCATTTGCACCCCATGCC |
| Sequence-based reagent | forward | This paper | PCR primers | BEND2 female genotyping; TTTGCTCCACTGTTTCACGC |
| Sequence-based reagent | reverse | This paper | PCR primers | BEND2 female genotyping; TCCCTTTAAACTGCCAACAACA |
| Sequence-based reagent | 255P1 forward | This paper | PCR primers | 255P1 Gene specific primers for RT-PCR; TAGGGACCAAGAACCTGCTG |
| Sequence-based reagent | reverse | This paper | PCR primers | 255P1 Gene specific primers for RT-PCR; TCCTGAAGCCACTGAGAAGG |
| Sequence-based reagent | forward | This paper | PCR primers | β-actin for RT-PCR; AGGTCTTTACGGATGTCAACG |
| Sequence-based reagent | reverse | This paper | PCR primers | β-actin primers for RT-PCR; ATCTACGAGGGCTATGCTCTC |
| Sequence-based reagent | forward | This paper | PCR primers | BEND2 cloning primer; agaaATGCCAGGAAAAACTGAAG |
| Sequence-based reagent | reverse | This paper | PCR primers | BEND2 cloning primer; TTAAGCTATTGCATTCCTTGGG for pEGFP-C1 vector;gAGCTATTGCATTCCTTGGGC for pEGFP-N1 vectors |
| Peptide, recombinant protein | His-tagged BEND2 protein | This paper | Available from the authors upon request Dr. Ignasi Roig Ignasi.Roig@uab.cat | |
| Commercial assay or kit | jetPEI DNA transfection reagent | Polyplus Transfection | 101–40 N | |
| Commercial assay or kit | HisTrap HP column | Cytiva | 29051021 or 17524801 | |
| Commercial assay or kit | TUNEL reaction mixture | Roche Diagnostics | 11684795910 | Figure 3 |
| Software, algorithm | Image J | Image J | RRID:SCR_003070 | |
| Software, algorithm | GraphPad Prism 8 | GraphPad | RRID:SCR_002798 | |
| Software, algorithm | Adobe Photoshop | Adobe | RRID:SCR_014199 | |
| Other | DAPI stain | Invitrogen | D1306 | 0.1 µg/ml |
| Other | Vectashield antifade mounting medium | Vector Laboratories | H1000 |
Additional files
-
Supplementary file 1
Testis and body weight (TW/BW) ratio of male mice.
- https://cdn.elifesciences.org/articles/96052/elife-96052-supp1-v1.docx
-
MDAR checklist
- https://cdn.elifesciences.org/articles/96052/elife-96052-mdarchecklist1-v1.docx
Download links
A two-part list of links to download the article, or parts of the article, in various formats.
Downloads (link to download the article as PDF)
Open citations (links to open the citations from this article in various online reference manager services)
Cite this article (links to download the citations from this article in formats compatible with various reference manager tools)
The full-length BEND2 protein is dispensable for spermatogenesis but required for setting the ovarian reserve in mice
eLife 13:RP96052.
https://doi.org/10.7554/eLife.96052.4


