Artificial intelligence driven tumor risk stratification from single-cell transcriptomics using phenotype algebra
- Australian Prostate Cancer Research Centre-Queensland, Faculty of Health, School of Biomedical Sciences, Centre for Genomics and Personalised Health, Queensland University of Technology, Australia
- Department of Computer Science and Engineering, Indraprastha Institute of Information Technology-Delhi (IIIT-Delhi), Okhla, Phase III, India
- Translational Research Institute, Princess Alexandra Hospital, Australia
- Department of Computational Biology, Indraprastha Institute of Information Technology-Delhi (IIIT-Delhi), Okhla, Phase III, India
- School of Mathematical Sciences, The University of Adelaide, Australia
- Center for Computational Biomedicine, Harvard Medical School, United States
- Nantes Université, CHU Nantes, INSERM, Center for Research in Transplantation and Translational Immunology, UMR, France
- Centre for Artificial Intelligence, Indraprastha Institute of Information Technology-Delhi (IIIT-Delhi), Okhla, Phase III, India
- Laboratory of Immunology and Infectious Disease Biology, Department of Biological Sciences, Indian Institute of Science Education and Research (IISER), India
- Vancouver Prostate Centre, Department of Urologic Sciences, University of British Columbia, Canada
Figures
Figure 1
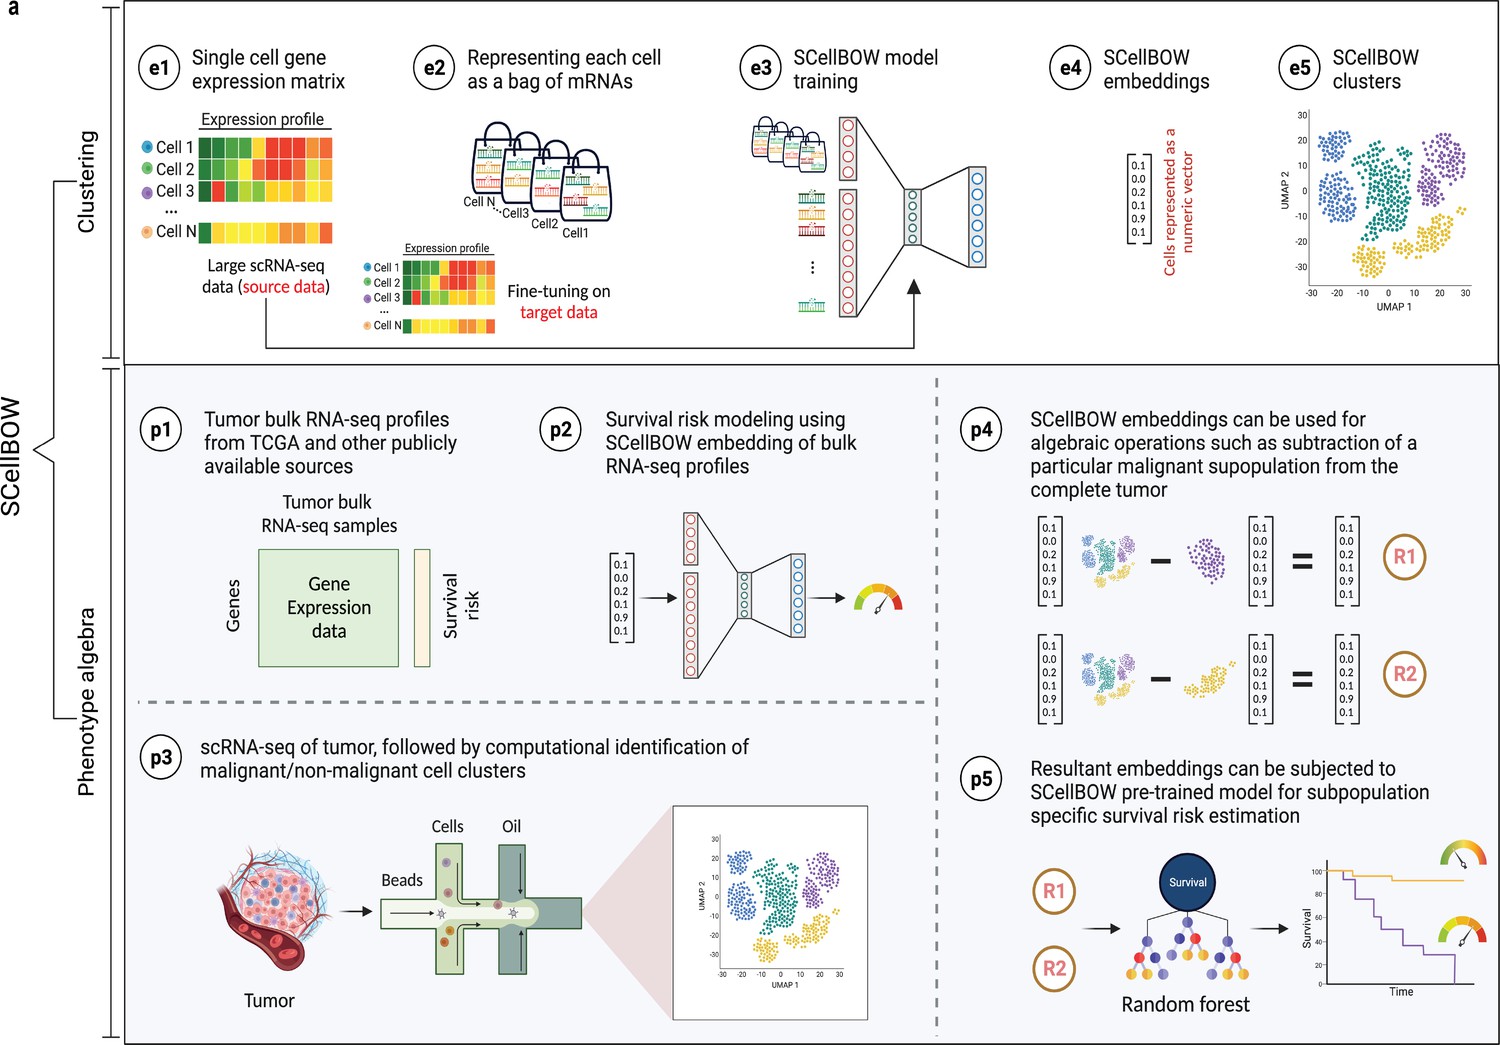
SCellBOW workflow.
(a) Schematic overview of SCellBOW workflow for identifying cellular clusters and assessing the aggressiveness of the predicted clusters. For SCellBOW clustering, firstly, a corpus was created from the gene expression matrix, where cells were analogous to documents and genes to words. Next, the pre-trained model was retrained with the vocabulary of the target dataset. Then, clustering was performed on embeddings generated from the neural network. For SCellBOW phenotype algebra, vectors were created for reference (total tumor) and queries. Then, the query vector was subtracted from the reference vector to calculate the predicted risk score using a bootstrapped random survival forest. Finally, survival probability was evaluated, and phenotypes were stratified by the median predicted risk score. Created using BioRender.com.
Figure 2
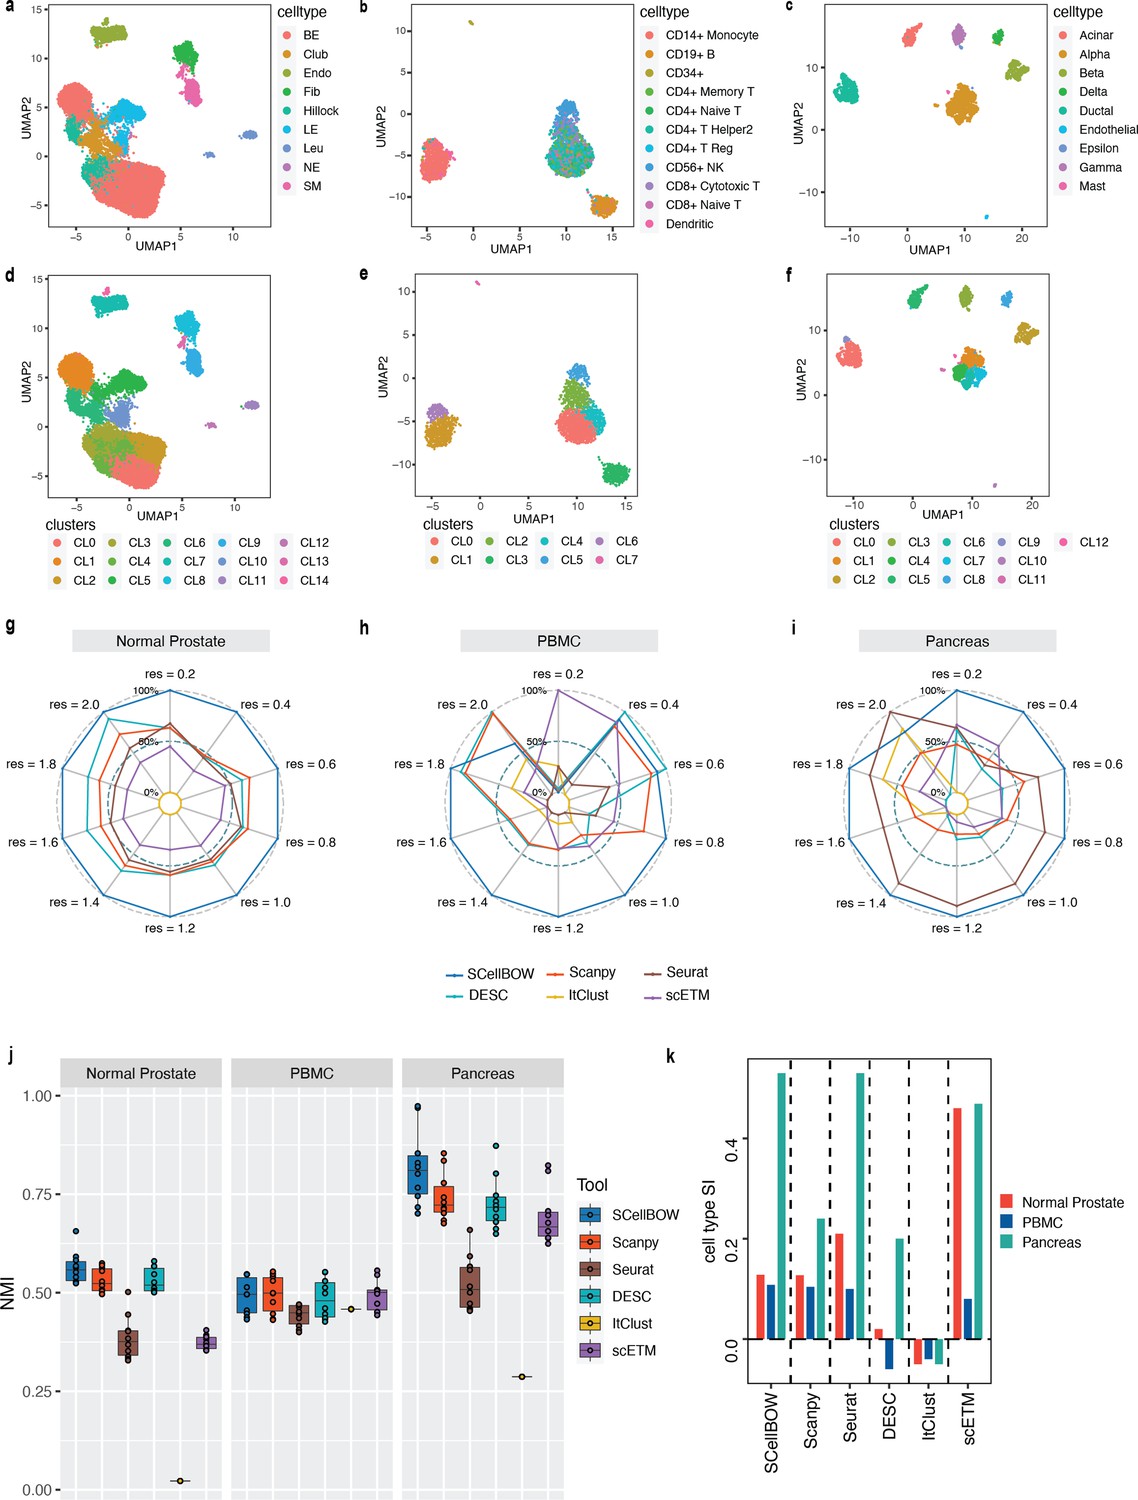
Evaluation of single-cell representations using SCellBOW.
(a–c) UMAP plots for the normal prostate (a), PBMC (b), and pancreas (c) datasets. The coordinates are colored by cell types. (d-f) UMAP plots for normal prostate (d), PBMC (e), and pancreas (f) datasets, where the coordinates are colored by SCellBOW clusters. CL is used as an abbreviation for cluster. (g–i) Radial plot for the percentage of contribution of different methods towards ARI for various resolutions ranging from 0.2 to 2.0. ItClust is a resolution-independent method; thus, the ARI is kept constant across all the resolutions. (j) Box plot for the NMI of different methods across different resolutions ranging from 0.2 to 2.0 in steps of 0.2. (k) Bar plot for the cell type silhouette index (SI) for different methods. The default resolution was set to 1.0.
Figure 3
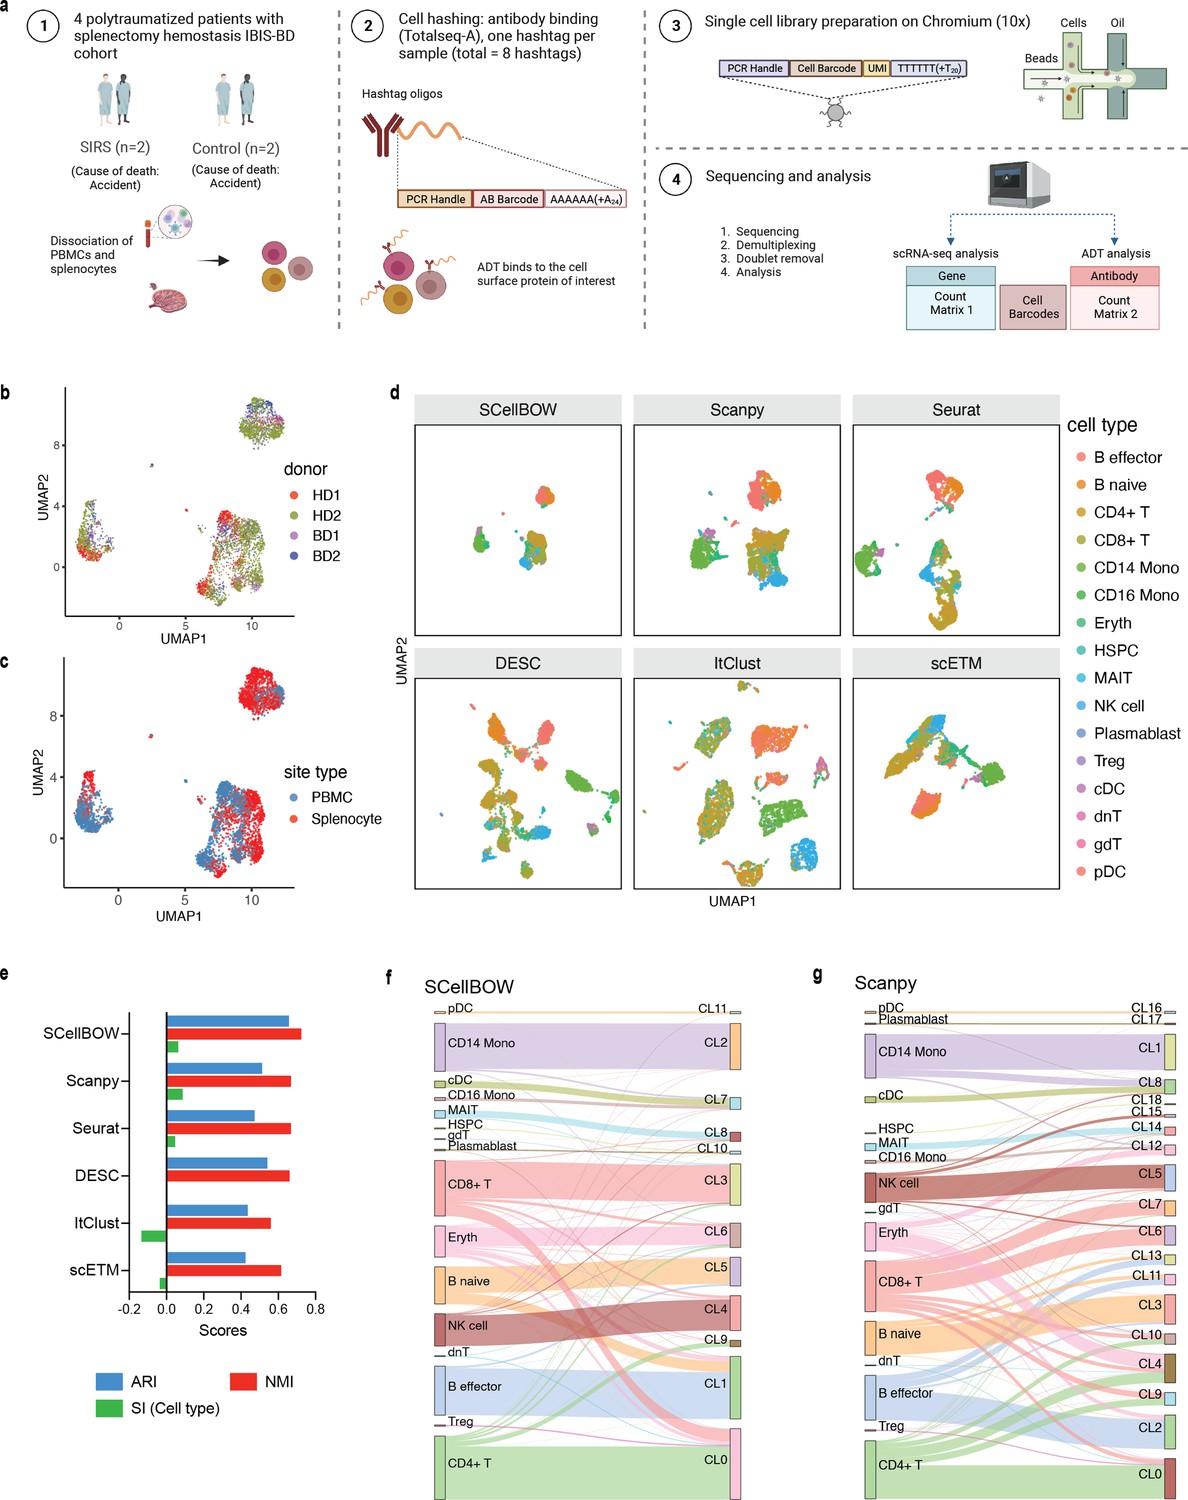
Evaluation of in-house splenocytes and matched PBMC dataset.
(a) An experiment schematic diagram highlighting the sites of the organs for tissue collection and sample processing. In this matched PBMC-splenocyte CITE-seq experiment, PBMCs and splenocytes were collected, followed by high-throughput sequencing and downstream analyses. Created using BioRender.com. (b, c) UMAP plots for SCellBOW embedding colored by donors (b) and cell types (c). (d) The UMAP plots for the embedding of SCellBOW compared to different benchmarking methods. The coordinates of all the plots are colored by cell type annotation results using Azimuth. (e) Bar plot for ARI, NMI, cell type SI at resolution 1.0. (f, g) Alluvial plots for Azimuth cell types mapped to SCellBOW clusters (f) and Scanpy clusters (g). The resolution of SCellBOW was set to 1.0. CL is used as an abbreviation for cluster.
Figure 4
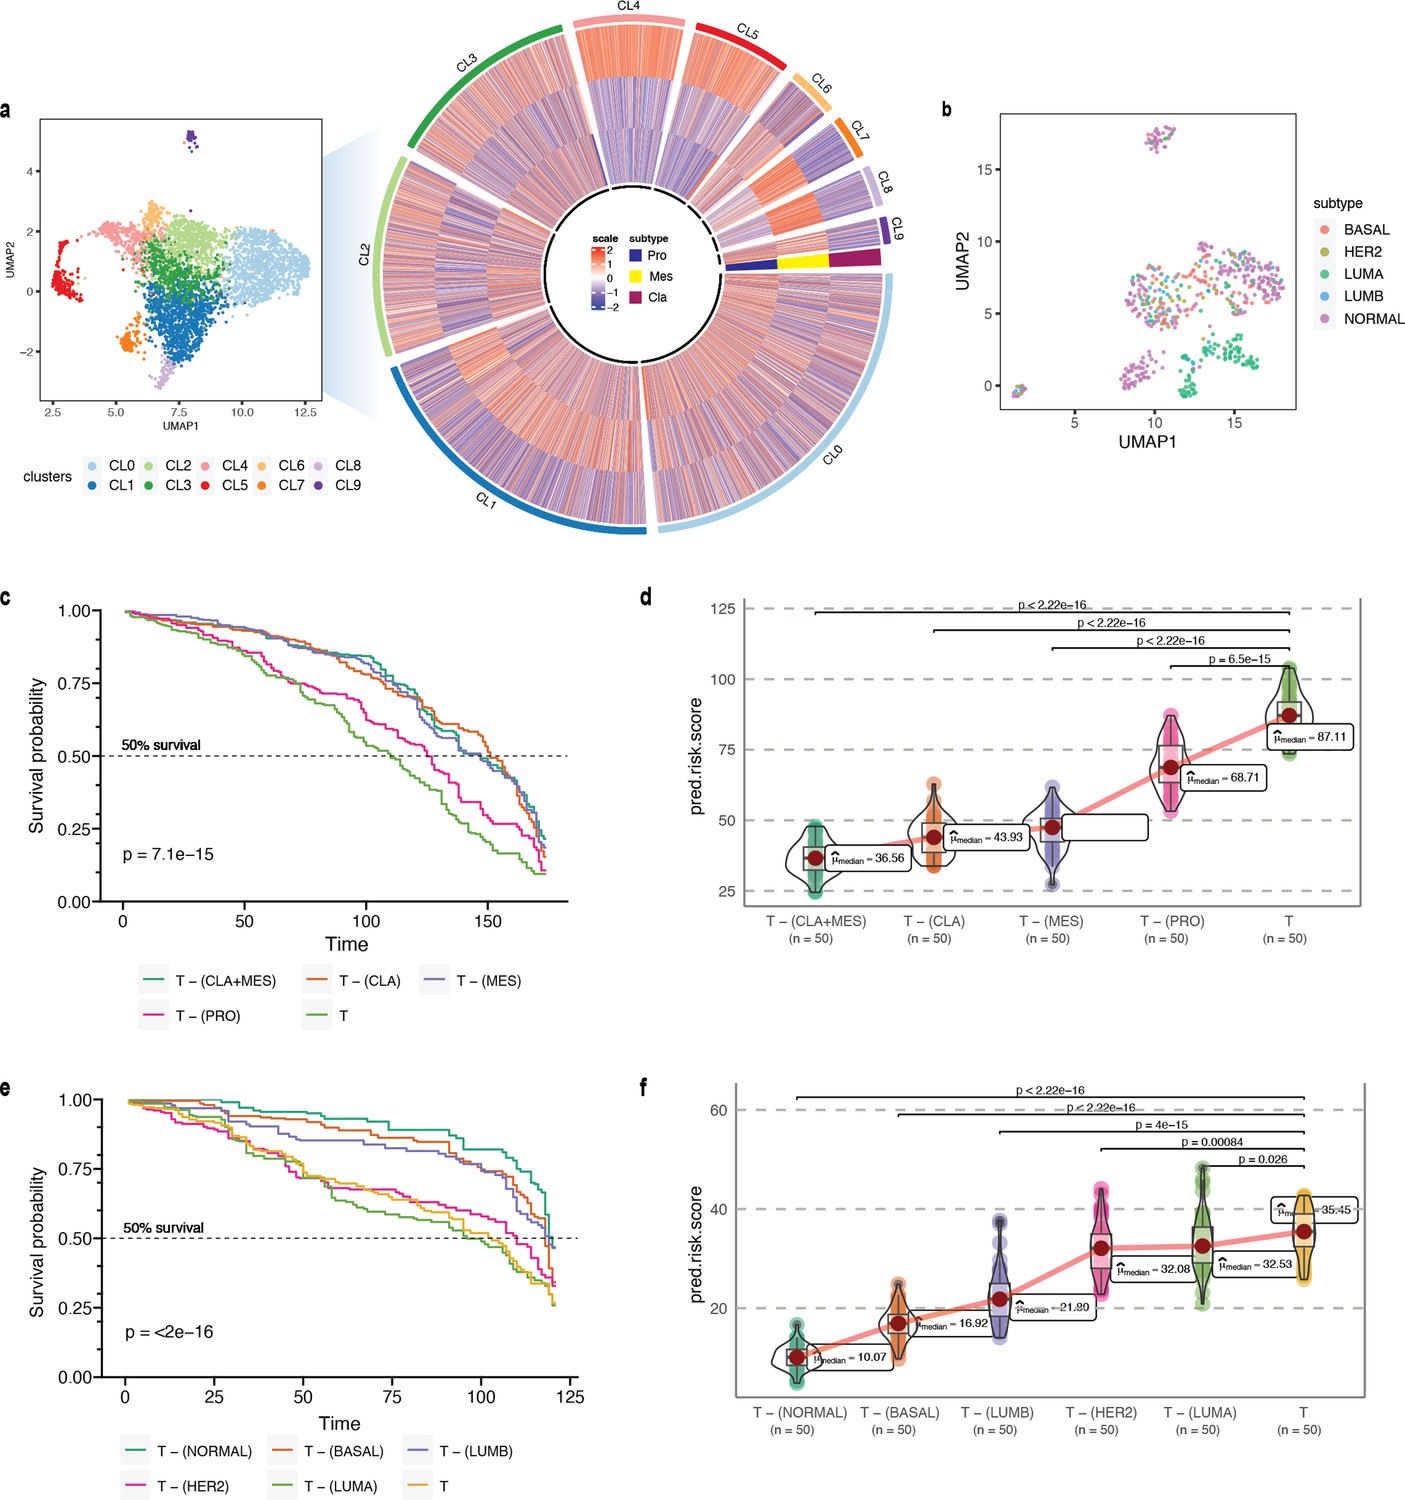
Phenotype algebra on GBM and BRCA known molecular subtypes.
(a) Heatmap for GSVA score for three molecular subtypes of GBM: CLA, MES, and PRO, grouped by SCellBOW clusters at resolution 1.0. (b) UMAP plot for the embedding of BRCA target dataset colored by PAM50 molecular subtype. (c) Survival plot for GBM molecular subtypes based on phenotype algebra. (d) Violin plot for predicted risk scores for GBM molecular subtypes, with n = 50 bootstrapped models per subtype. (e) Survival plot for BRCA molecular subtypes based on phenotype algebra. The total tumor is denoted by T. (f) Violin plot for predicted risk scores for BRCA molecular subtypes with n = 50 bootstrapped models per subtype.
Figure 5
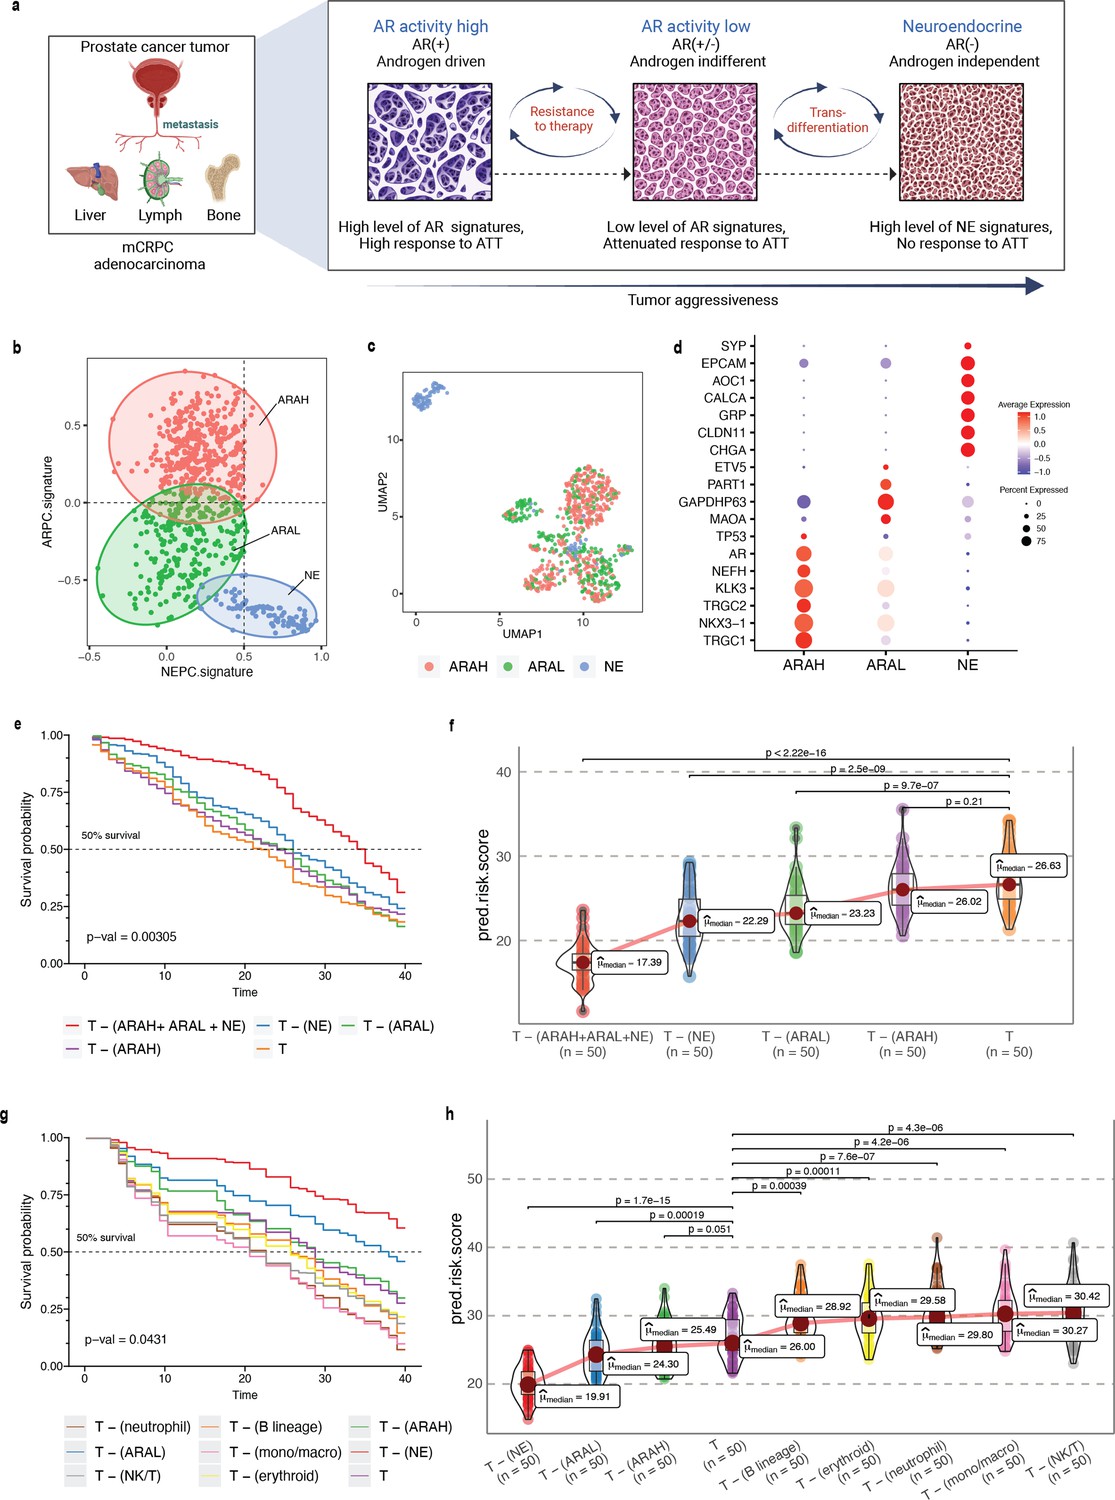
Phenotype algebra on mCRPC known molecular subtypes based on AR- and NE-activity.
(a) Schematic of the transdifferentiation states underlying lineage plasticity that occurs during mCRPC progression from an ARPC to NEPC. Created using BioRender.com. (b) Scatter plot of GSVA scores of ARPC and NEPC gene sets, K-means clustering was used to allocate cells into the three high-level ARAH, ARAL, and NEPC categories. (c) UMAP plot for projection of SCellBOW embedding colored by ARAH, ARAL, and NEPC. (d) Heatmap showing the top differentially expressed genes (y-axis) between each high-level category (x-axis) and all other cells, tested with a Wilcoxon rank-sum test. (e) Survival plot for mCRPC cancer phenotypes based on phenotype algebra. The total tumor is denoted by T. (f) Violin plot for predicted risk scores for mCRPC phenotypes - ARAH, ARAL, and NEPC, with n = 50 bootstrapped models per subtype. (g) Survival plot for mCRPC tumor microenvironment phenotypes based on phenotype algebra. The total tumor is denoted by T. (h) Violin plot of predicted risk scores for mCRPC tumor microenvironment phenotypes, comparing tumor and normal cells, with n = 50 bootstrapped models per group.
Figure 6
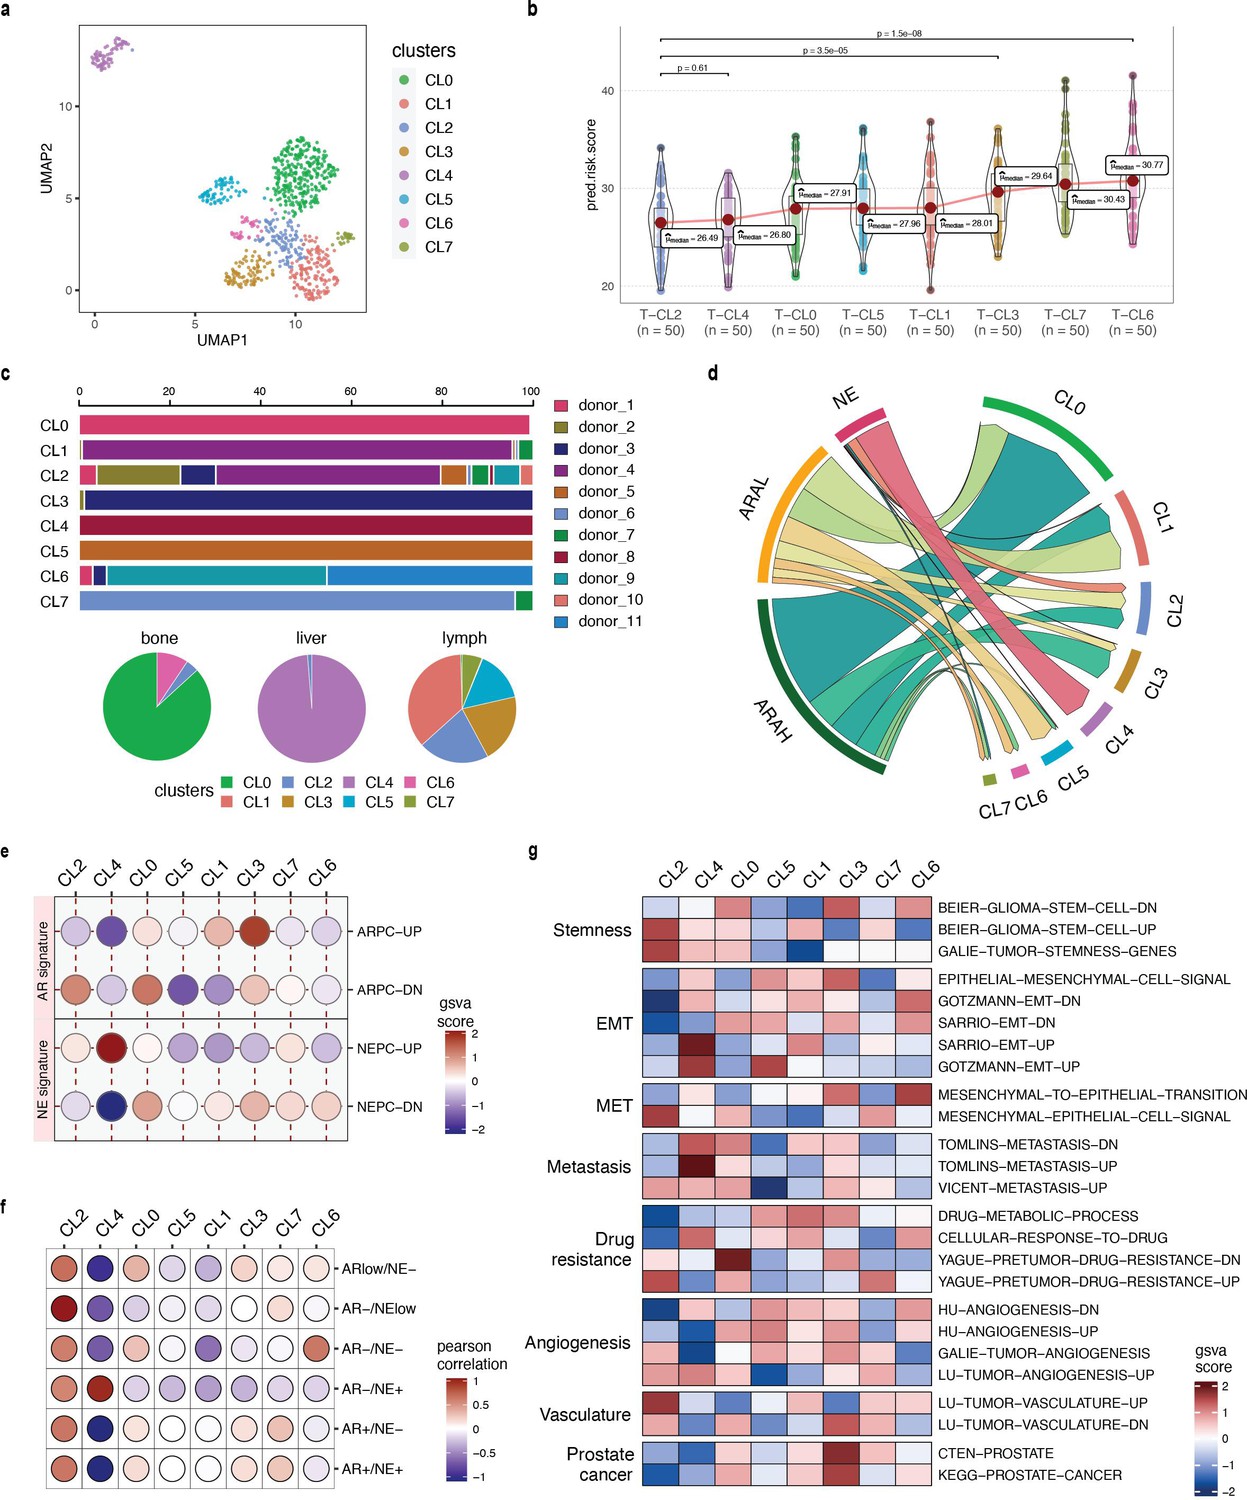
Phenotype algebra on He et al., 2021 mCRPC data based on SCellBOW clusters.
(a) UMAP plot for projection of embeddings with coloring based on the SCellBOW clusters at resolution 0.8. CL is used as an abbreviation for cluster. (b) Violin plot of phenotype algebra-based cluster-wise risk scores for SCellBOW clusters based on phenotype algebra-based predictions. (c) Patient and organ site distribution across the SCellBOW clusters. (d) Illustration of the distribution of cells from the three high-level groups- ARAH, ARAL, and NEPC across the SCellBOW clusters. (e) Bubble plot of row-scaled GSVA scores for custom curated gene sets containing activated and repressed AR- and NE- signatures. (f) Correlation plot of six phenotypic categories based on DSP gene expression correlated with the SCellBOW clusters based on scRNA-seq gene expression. The six phenotypic categories are defined by Brady et al., 2021 based on the activity of AR and NE programs. (g) Top gene sets correlated with SCellBOW clusters. Signatures were collected from the C2 ‘‘curated’’, C5 ‘‘Gene Ontology’’, and H ‘‘hallmark’’ gene sets from mSigDB (Liberzon et al., 2015). Ranking by row scaled GSVA scores of one cluster against all others.
Appendix 2—figure 1
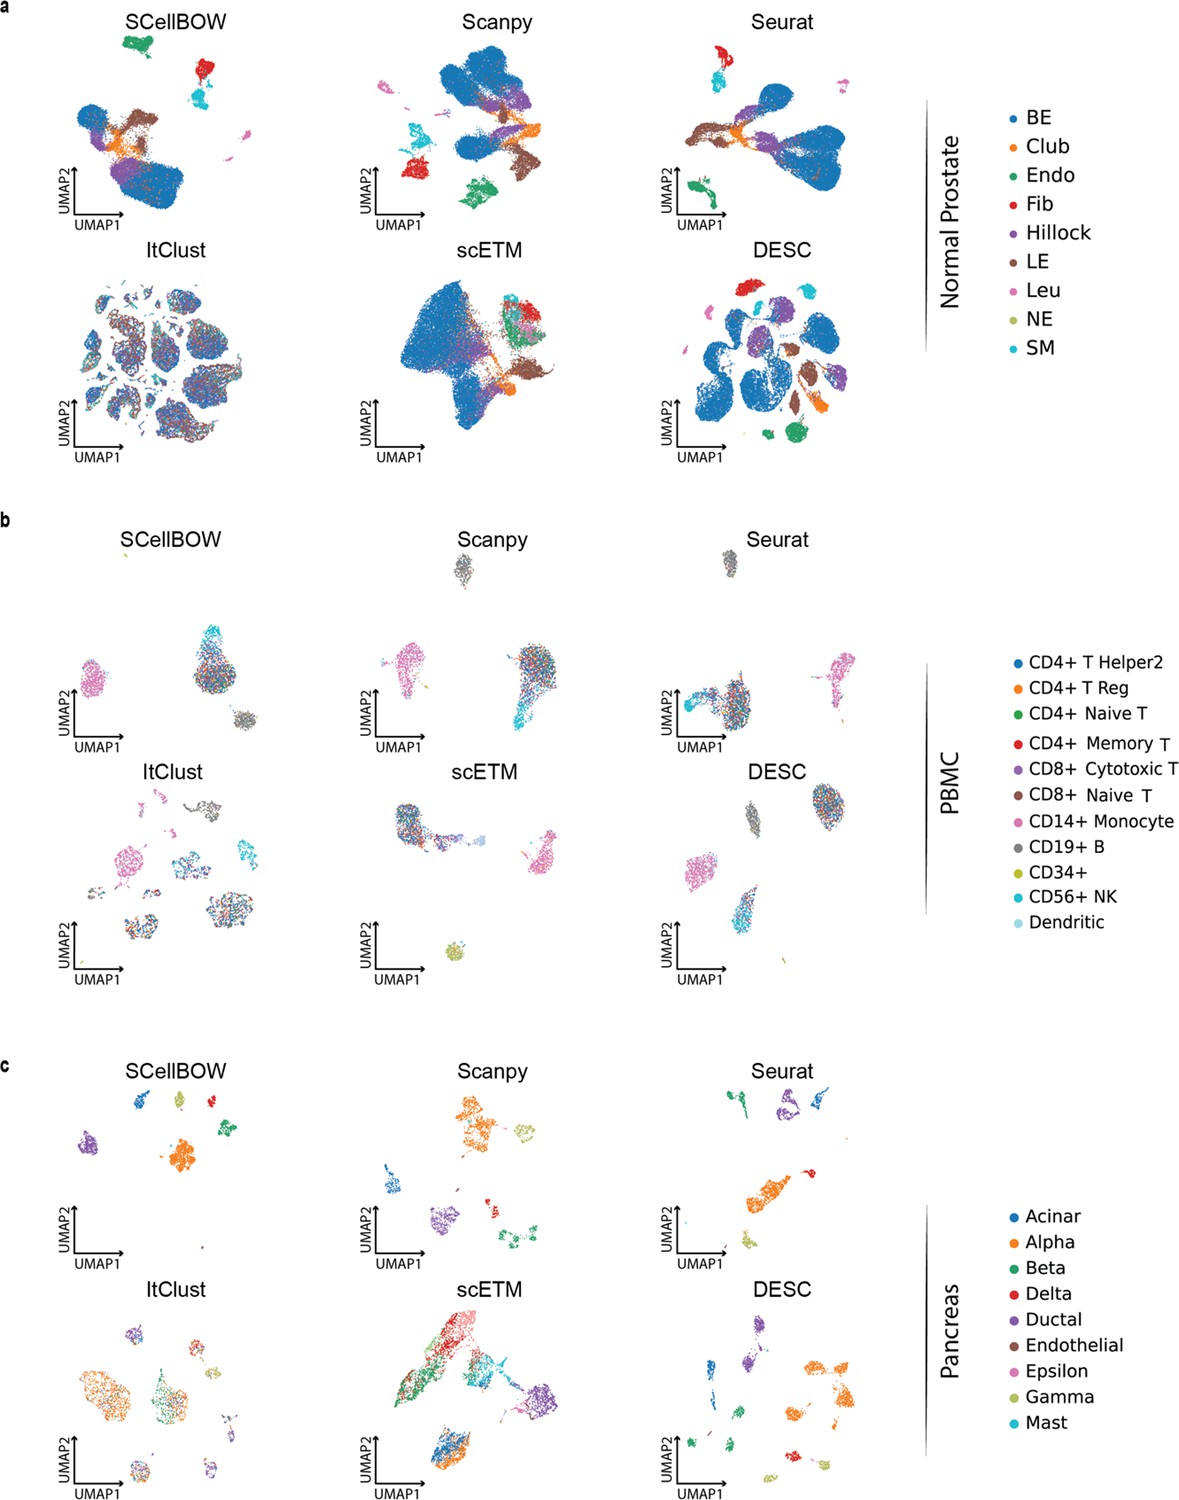
Cell embeddings visualization.
(a-c) The UMAP plots showing embedding of SCellBOW compared to different existing methods benchmarked on normal prostate (a), peripheral blood mononuclear cells (PBMC) (b), and pancreas datasets (c). The coordinates of all the plots are colored by true cell types.
Appendix 2—figure 2
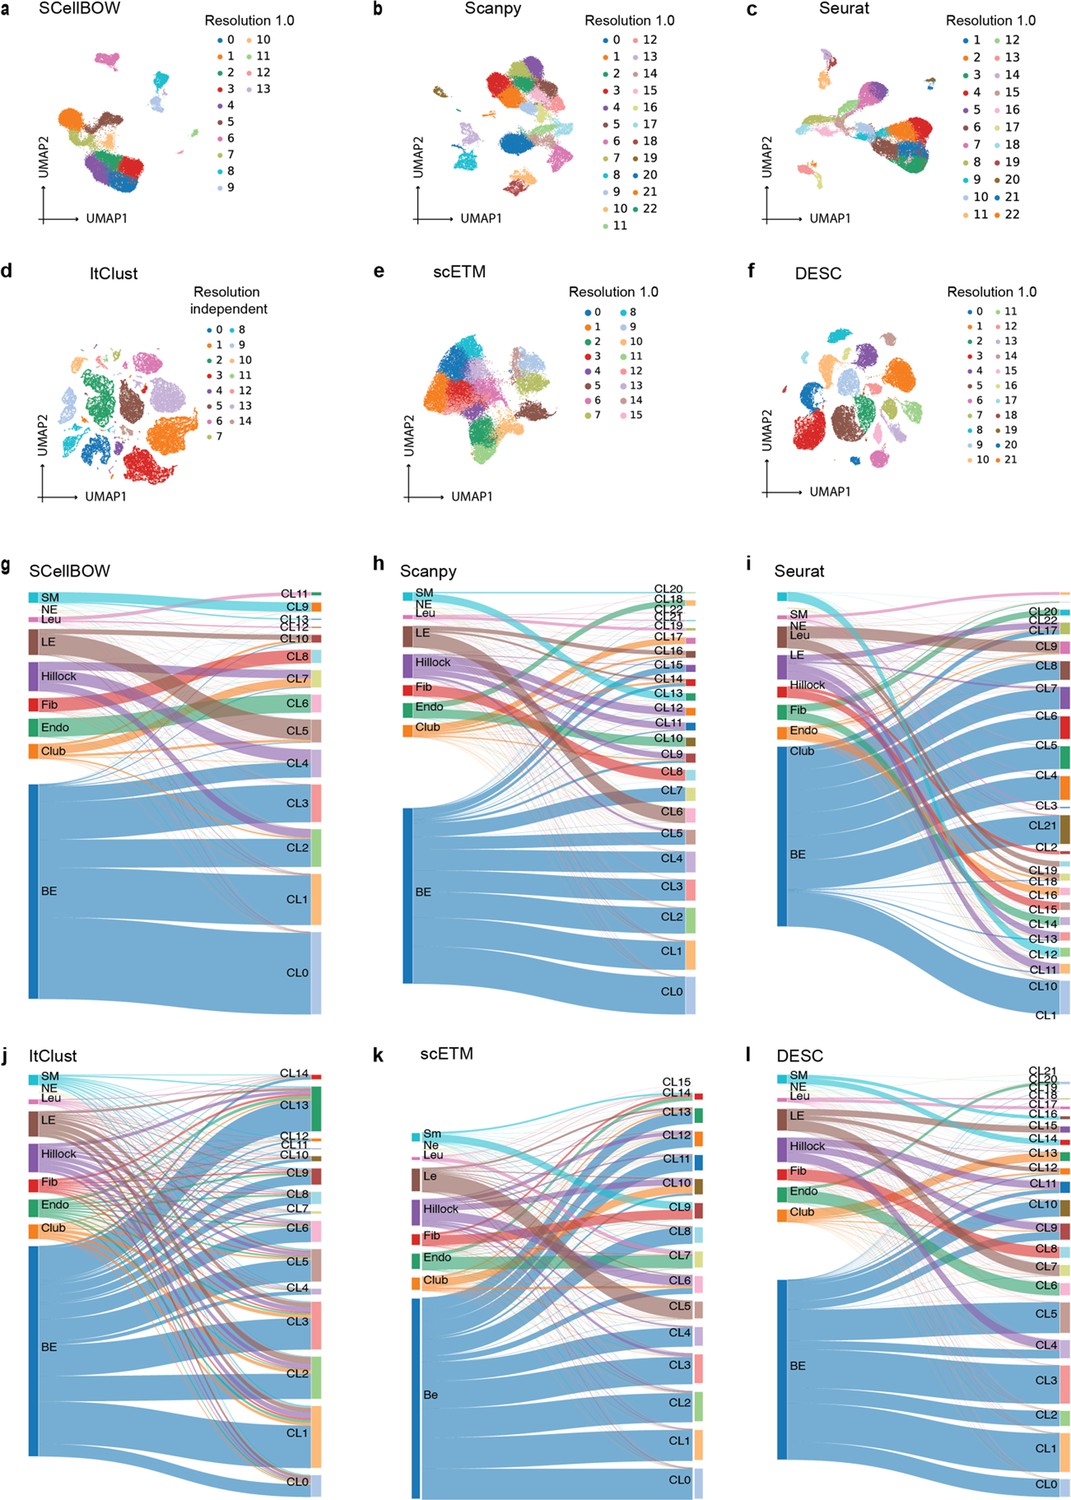
Cell embedding visualization of the normal prostate scRNA-seq dataset.
(a–f) The UMAP plots showing embedding of SCellBOW, Scanpy, Seurat, ItClust, ProjectR, and DESC on normal prostate. The coordinates of all the plots are colored by clusters. (g–l) Alluvial plots showing the mapping of clusters resulting from the benchmarking tools onto the true cell types from Henry et al. normal prostate dataset. CL is used as an abbreviation for cluster.
Appendix 2—figure 3
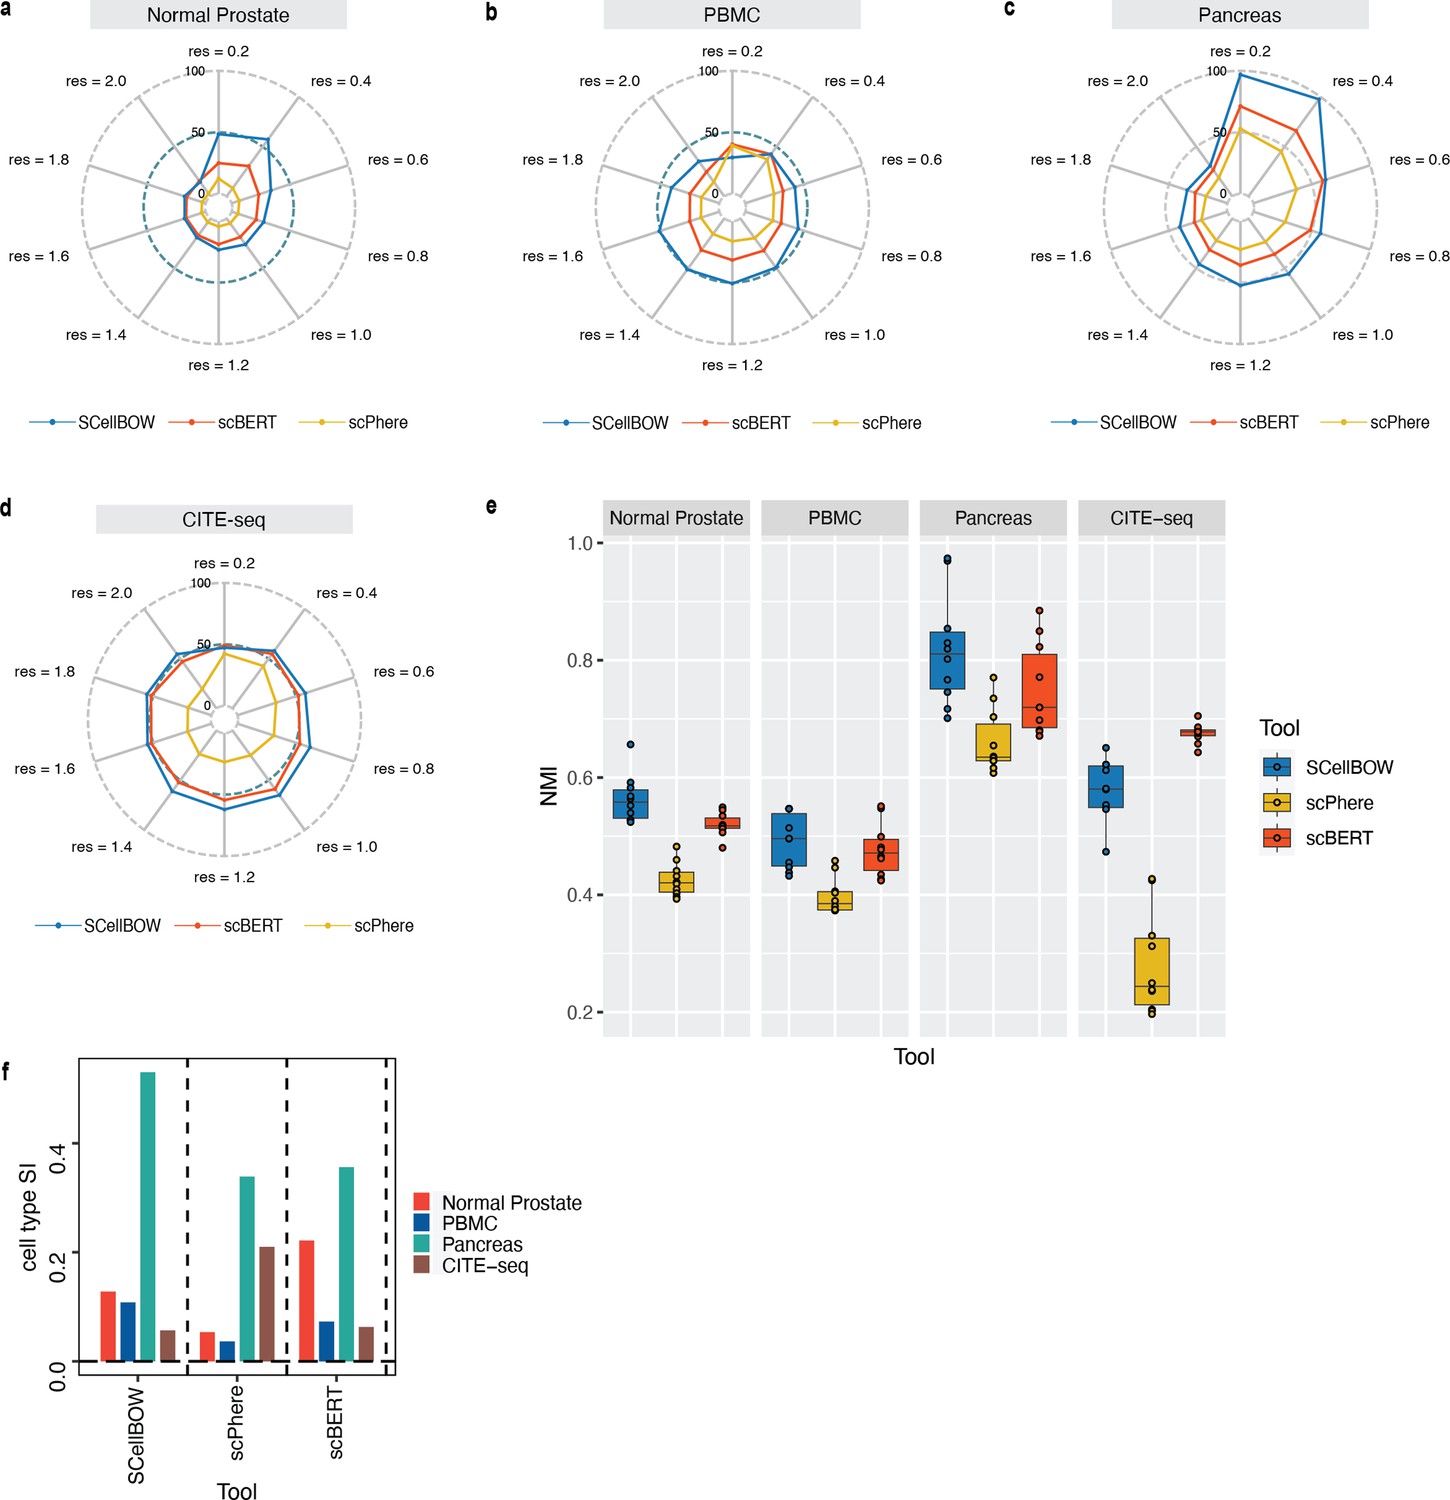
Extended performance evaluation of SCellBOW with scBERT and scPhere.
(a–d) Radial plot for the percentage of contribution of different methods towards ARI for various resolutions ranging from 0.2 to 2.0 for normal prostate (a), PBMC (b), pancreas (c), and CITE-seq (d) datasets. (e) Box plot for the NMI of different methods across different resolutions ranging from 0.2 to 2.0 in steps of 0.2. (f) Bar plot for the cell type silhouette index (SI) for different methods. The default resolution was set to 1.0.
Appendix 2—figure 4
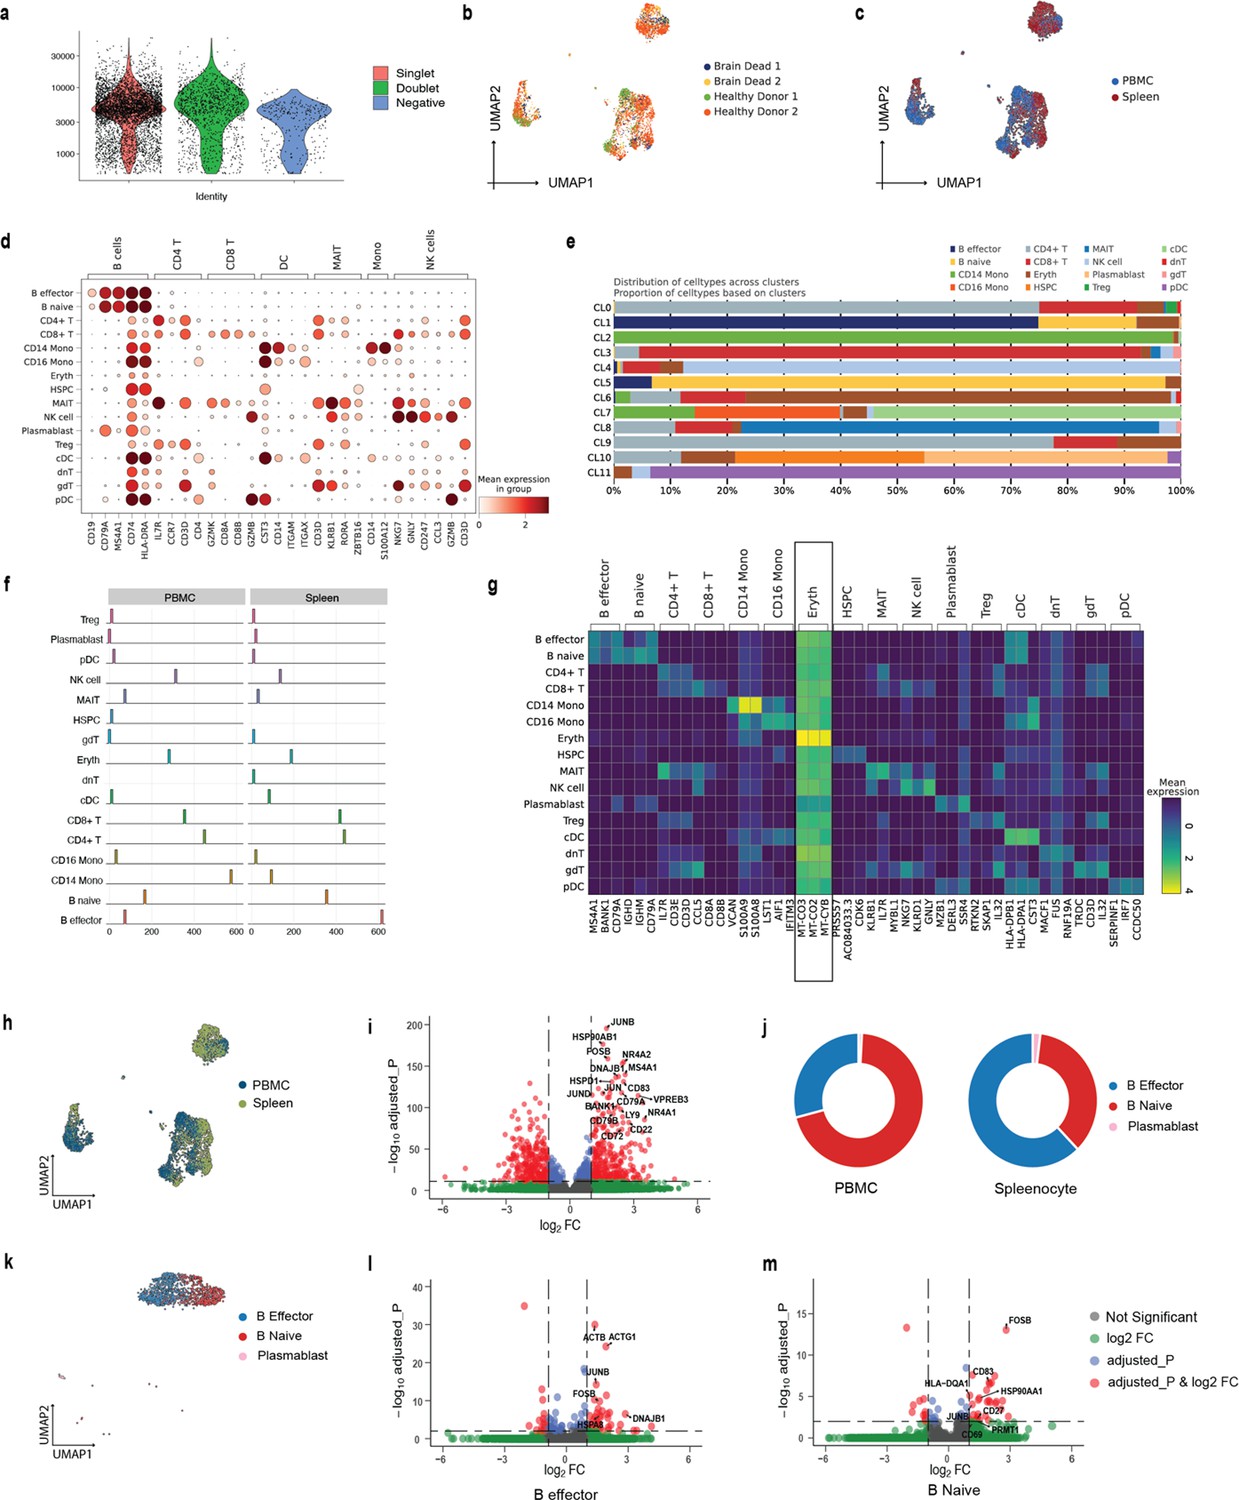
Extended analysis of in-house CITE-seq dataset.
(a) Violin plot showing the distribution of UMIs for singlets, doublets, and negative cells. (b) The UMAP plots showing embedding of SCellBOW colored by donors. (c) The UMAP plots showing embedding of SCellBOW colored by tissue of origin. (d) Dot plot to check the expression of marker genes of PBMC per cell type identified by Azimuth. (e) Bar plot showing the proportion of annotated cell types across different clusters of SCellBOW. (f) Compositional difference in proportion annotated cell types in PBMC vs. splenocytes. (g) Heatmap for annotated cell type-wise differentially expressed genes in each cell type. (h) UMAP plots of the cells colored by their tissue source. (i) Volcano plot showing the differential genes (red dots) in the spleen and PBMC for B cells (p-value < 0.05, False discovery rate (FDR)<0.01). (j) Donut plot showing the compositional difference in the proportion of B cell subtypes (B naive, B effector, and plasmablast) in PBMC and spleen. (k) UMAP plot showing the embedding of SCellBOW colored by B cell subtypes. (l, m) Volcano plot showing the differential genes (red dots) in the spleen and PBMC for B effector (l) and B naive cells (m) (p-value <0.05, FDR < 0.01).
Appendix 2—figure 5
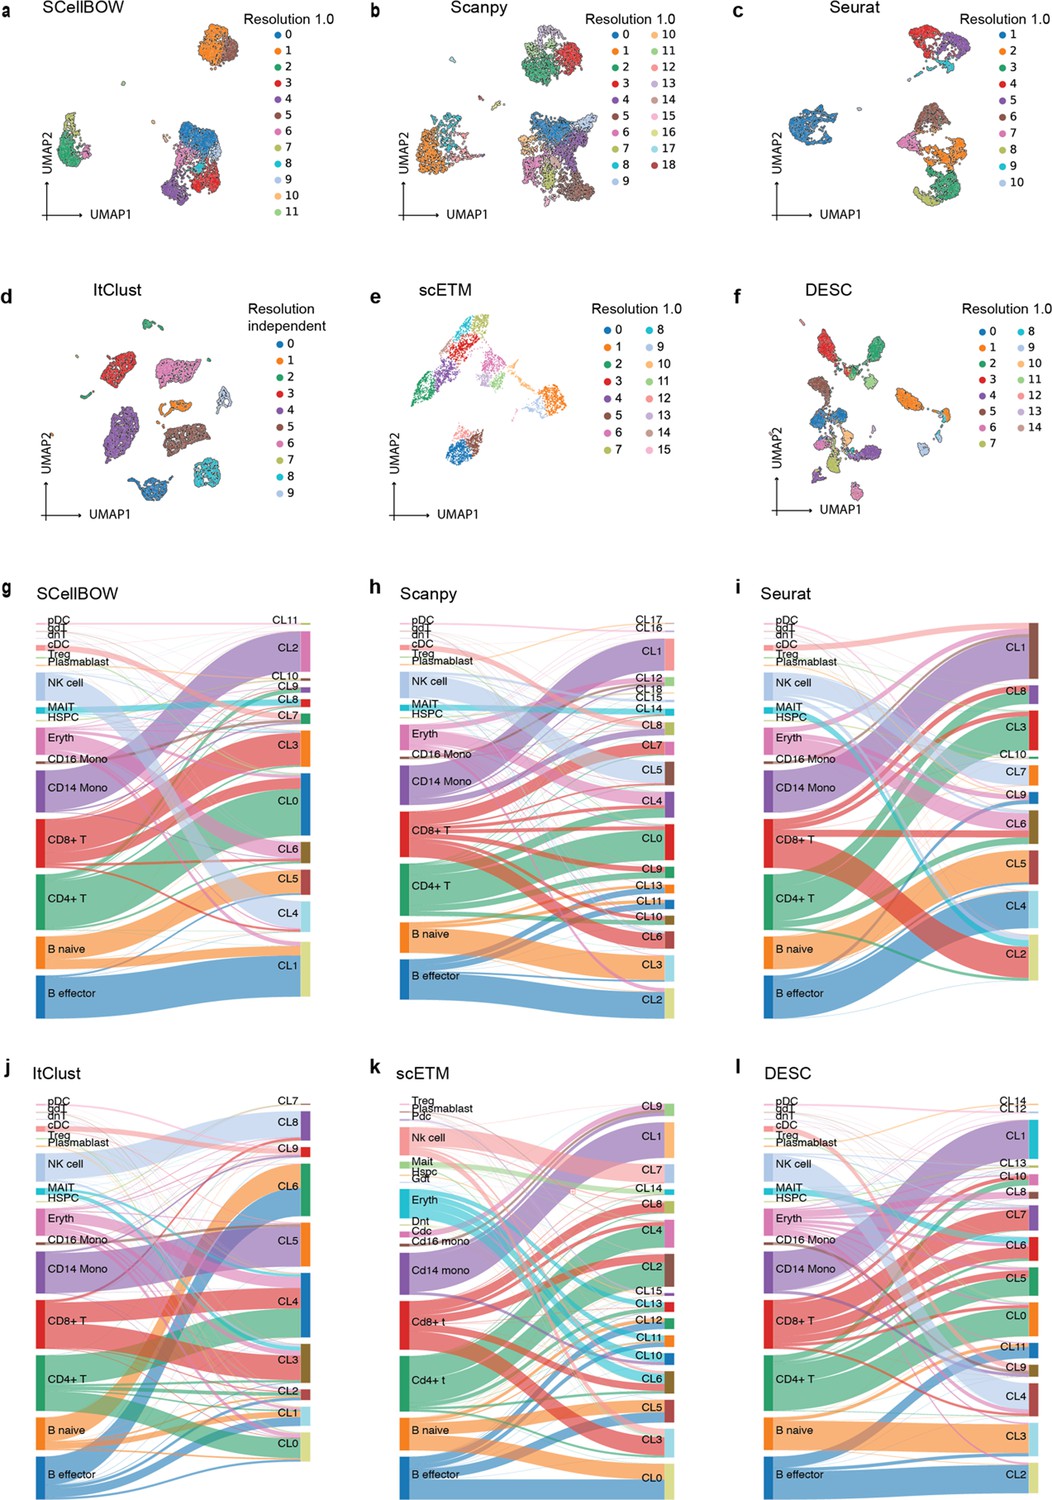
Cell embedding visualization of the in-house CITE-seq scRNA-seq dataset.
(a–f) The UMAP plots showing embedding of SCellBOW, Scanpy, Seurat, ItClust, ProjectR, and DESC on the PBMC-spleen dataset. The coordinates of all the plots are colored by clusters. (g–l) The alluvial plots showing the mapping of clusters resulting from the benchmarking tools onto the cell types identified by Azimuth.
Appendix 2—figure 6
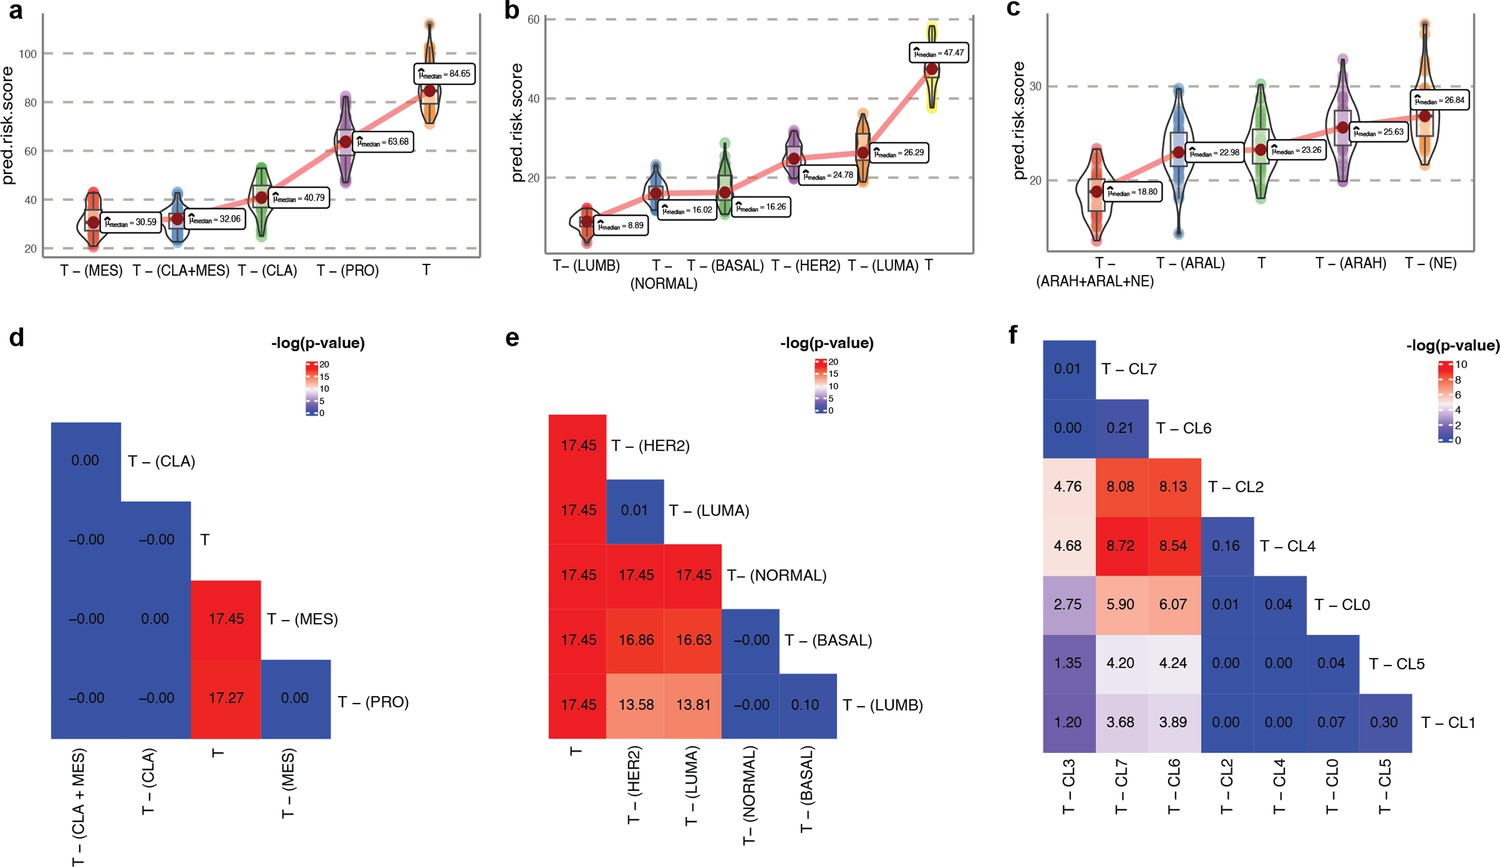
Survival risk inference using phenotype algebra on raw gene expression data.
(a–c) Phenotype algebra-based risk scores using gene expression profile of GBM molecular subtypes (a), PAM50 molecular subtypes of BRCA (b), three high-level categories of mCRPC (c). The total tumor is denoted by T. (d-f) Heatmap for -log10(p-value) of the predicted risk scores for GBM subtype (d), BRCA subtype (e), and mCRPC clusters (f), and using Wilcoxon unpaired one-sided test.
Appendix 2—figure 7
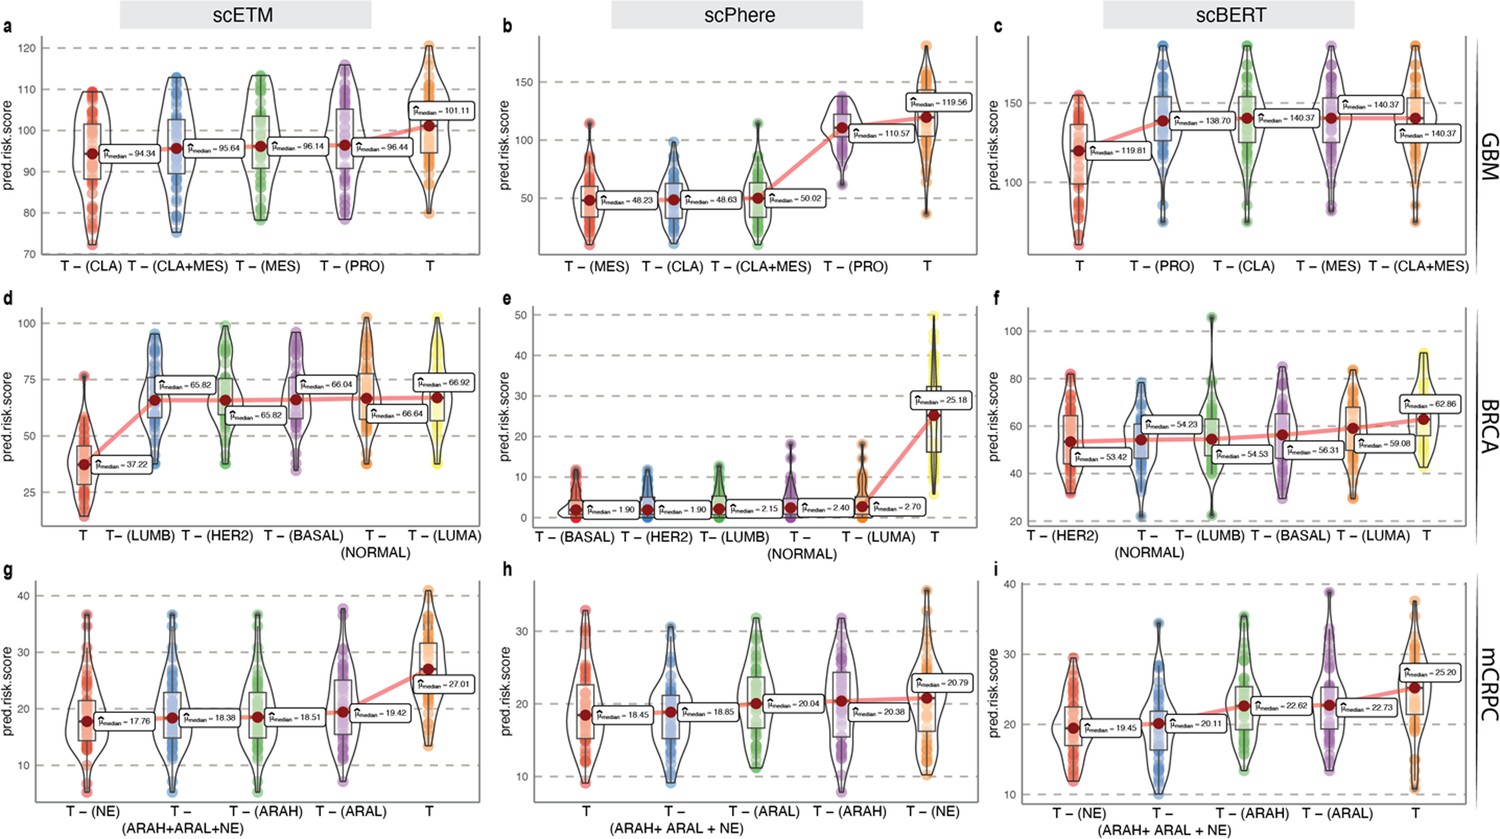
Survival risk inference using fixed-length embeddings from scETM, scPhere, and scBERT.
(a–c) Phenotype algebra-based risk scores of GBM molecular subtypes using fixed-length embeddings from scETM (a), scPhere (b), and scBERT (c). The total tumor is denoted by T. (d-f) Phenotype algebra-based risk scores of PAM50 molecular subtypes of BRCA using fixed-length embeddings from scETM (a), scPhere (b), and scBERT (c). (g–i) Phenotype algebra-based risk scores of three high-level categories of mCRPC using fixed-length embeddings from scETM (a), scPhere (b), and scBERT (c).
Appendix 2—figure 8
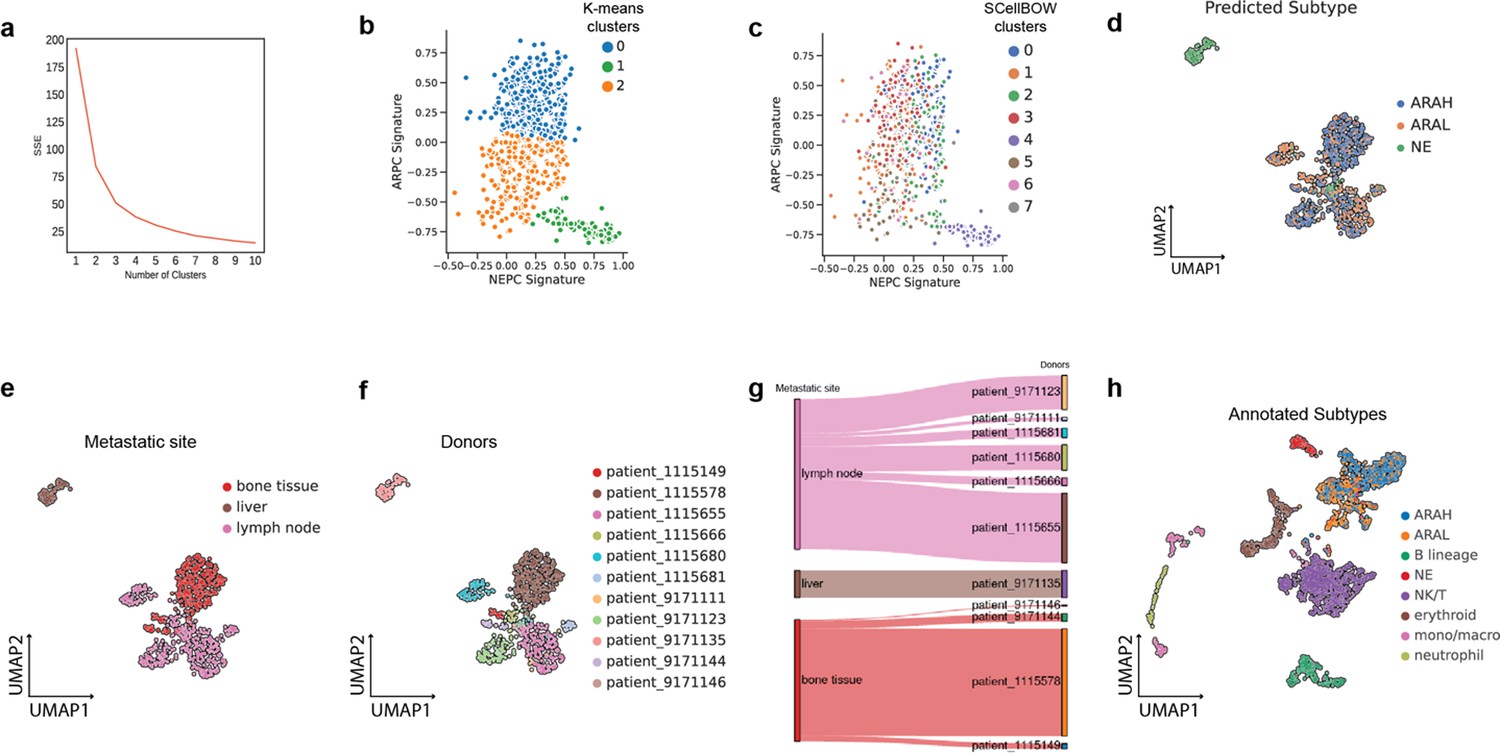
Extended analysis of He et al., 2021 single-cell mCPRC dataset.
(a) Elbow plot for selecting the best K for K-means clustering. (b, c) Scatter plot of GSVA scores of ARPC and NEPC gene sets colored by the K-means clusters (E) and SCellBOW clusters (F). (d) UMAP plot visualizing the high-level ARAH, ARAL, and NEPC categories on SCellBOW embeddings. (e, f) The UMAP plots showing the embedding of SCellBOW colored by metastasis site (a) and donors (b). (g) Alluvial plot to visualize tumor metastasis site of the donors. (h) UMAP plot visualizing SCellBOW embeddings of tumor microenvironment cells (malignant +non-malignant) in the He et al. dataset based on author annotations.
Appendix 2—figure 9
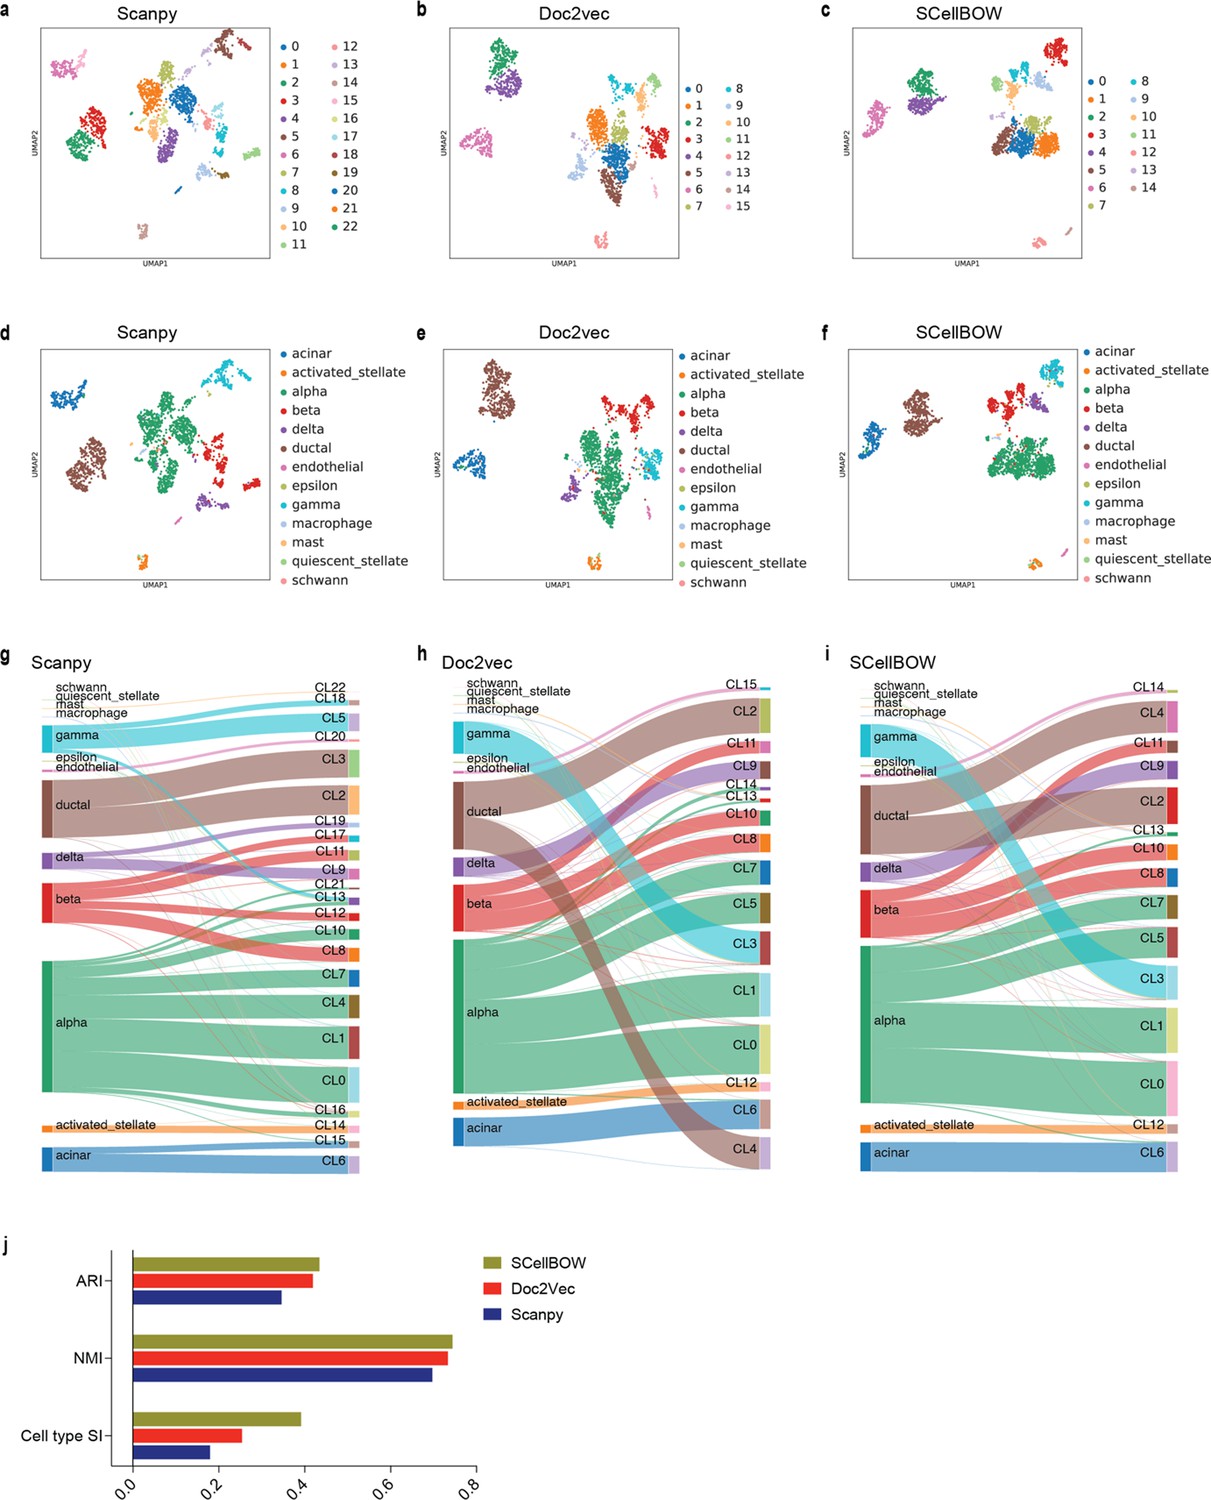
Assessing the quality of clustering using transfer learning on BOW models using the pancreas dataset.
(a–c) UMAP plot of Scanpy embedding (a), Doc2Vec embedding (b), and SCellBOW embedding (c) of pancreas dataset using Leiden clustering at resolution 1.0. (d-f) UMAP plot of Scanpy embedding (d), Doc2Vec embedding (e), and SCellBOW embedding (f) of pancreas dataset colored with their annotated cell types (g–i) Alluvial plot for cell types against Leiden clusters for Scanpy (g) Doc2vec (h) SCellBOW (i). (j) Barplot for ARI, NMI, cluster purity, Silhouette index (cell type and cluster).
Appendix 2—figure 10
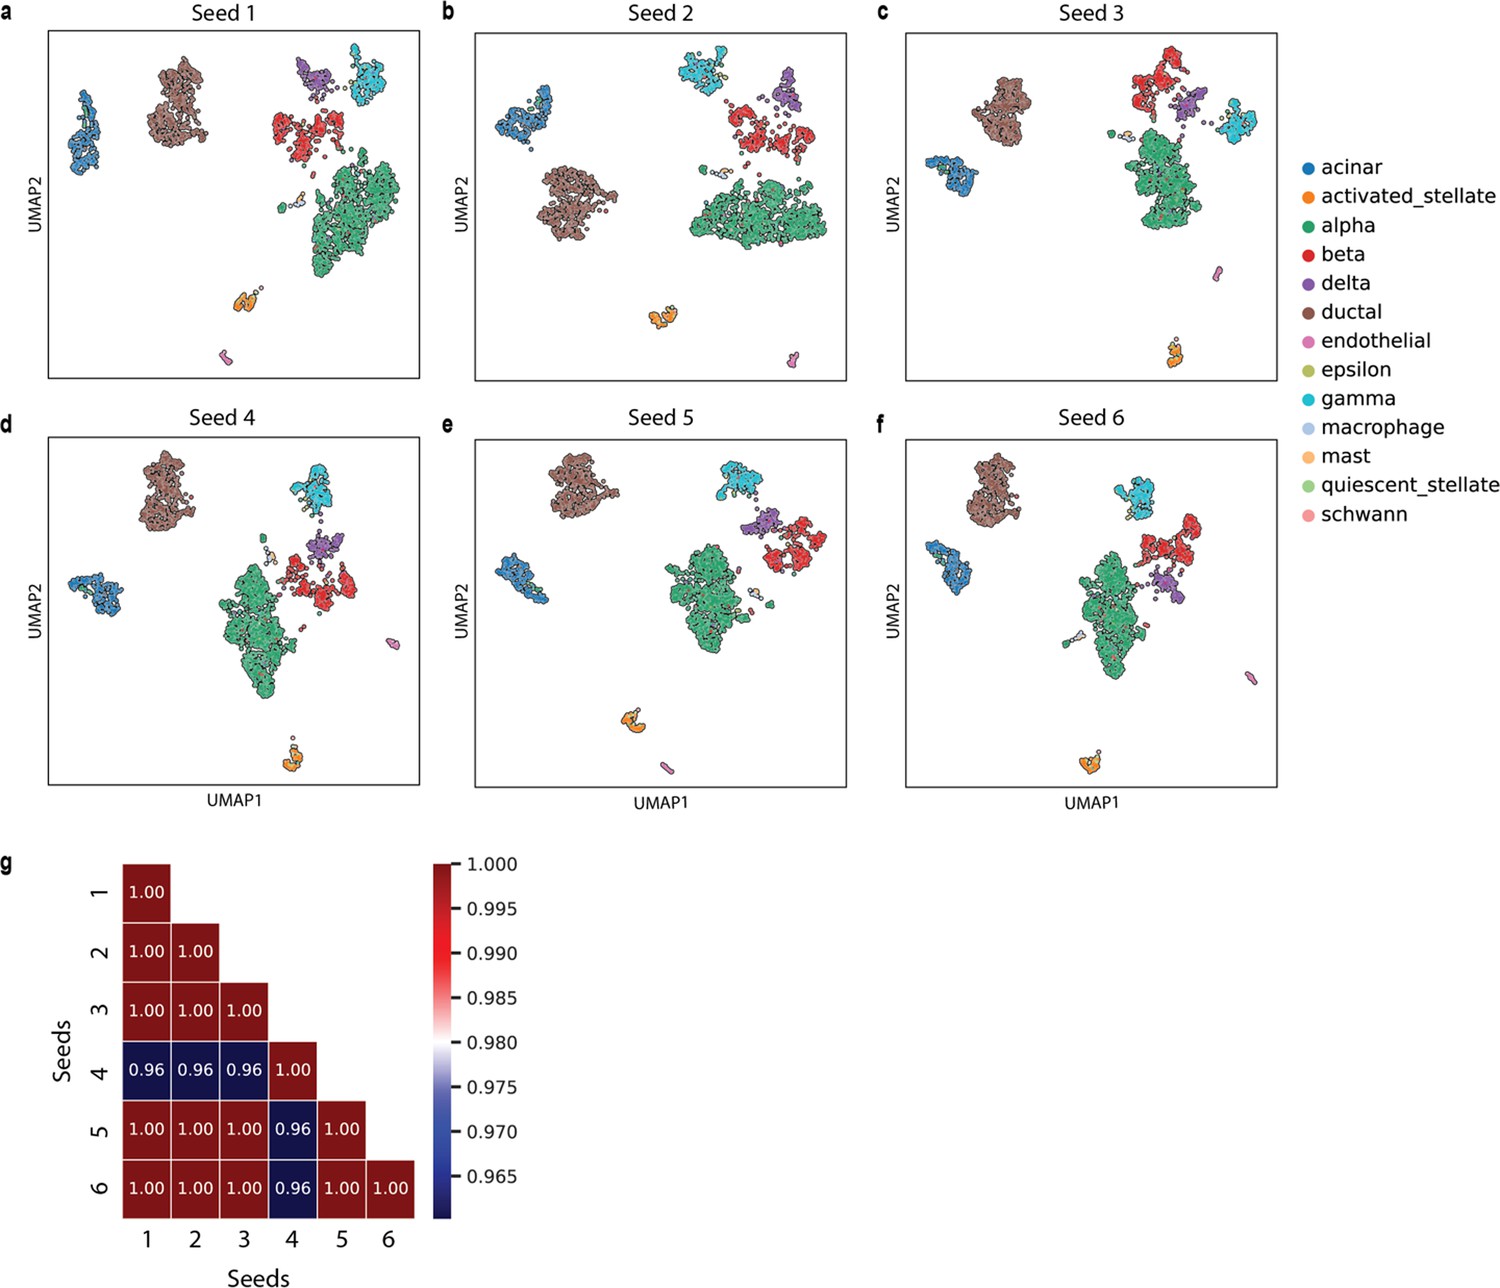
Assessing the effect of random seed on the quality of cell sentence generation using the pancreas dataset.
(a–f) The UMAP plots showing the embedding of SCellBOW generated using cell sentences with different random seeds ranging from 2 to 25. The colors of the cells in the UMAP plots indicate clusters. (g) Heatmap showing the ARI between each pair of clustering outcomes with distinct seeds.
Tables
Appendix 1—table 1
Overview of tools and benchmarking methods used in this paper.
| Tool | Version | URL | Resolution dependent | Visualization | Clustering algorithm | Reference |
|---|---|---|---|---|---|---|
| Scanpy | 1.9.1 | https://github.com/scverse/scanpy | Yes | UMAP | Louvain | Wolf et al., 2018; Wolf et al., 2023 |
| ItClust | 1.2.0 | https://github.com/jianhuupenn/ItClust | No | UMAP | ItClust | Hu et al., 2020; Hu, 2022 |
| Seurat | 4.1.1 | https://github.com/satijalab/seurat | Yes | UMAP | Louvian | Butler et al., 2018; Butler et al., 2022 |
| DESC | 2.1.1 | https://github.com/eleozzr/desc | Yes | UMAP | Louvain | Li et al., 2020; Li and Lyu, 2020 |
| scBERT | 1.0.0 | https://github.com/TencentAILabHealthcare/scBERT | Yes | UMAP | Leiden | Yang et al., 2022; Tencent AI Lab Healthcare, 2022 |
| scPhere | 1.0.0 | https://github.com/klarman-cell-observatory/scPhere | Yes | UMAP | Louvain | Ding and Regev, 2021; Ding, 2021 |
| scETM | 0.4.9 | https://github.com/hui2000ji/scETM | Yes | UMAP | Leiden | Zhao et al., 2021; Cai, 2021 |
Appendix 1—table 2
Summary of datasets analyzed in this paper.
| Model | Dataset | Tissue | Technology | Data Type | Cell/sampleDetected | Used inSCellBOW | Data used as | Cell filter | Gene filter | HVG |
|---|---|---|---|---|---|---|---|---|---|---|
| Normal Prostate | Karthaus et al., 2020 | Human primary prostate cancer | 10 X | TPM | 120,300 | Clustering | Source | 200 | 20 | 5000 |
| Henry et al., 2018 | Human normal prostate | 10 X | Raw count | 28,702 | Clustering | Target | 200 | 3 | 3000 | |
| PBMC | Zheng et al., 2017 | Human PBMC | 10 X | Raw count | 68, 579 | Clustering | Source | 200 | 20 | 5000 |
| Zheng et al., 2017 | Human PBMC | 10 X | Raw count | 2,700 | Clustering | Target | 200 | 20 | 2000 | |
| Pancreas | Baron et al., 2016 | Human pancreas | inDrop | Raw count | 8,562 | Clustering | Source | 200 | 20 | 2000 |
| Muraro et al., 2016 | Human pancreas | CEL-Seq2 | Raw count | 2,042 | Clustering | Source | ||||
| Wang et al., 2016 | Human pancreas | SMARTer | Raw count | 430 | Clustering | Source | ||||
| Segerstolpe et al., 2016 | Human pancreas | Smart-Seq2 | Raw count | 2,068 | Clustering | Target | 200 | 3 | 2000 | |
| GBM | Neftel et al., 2019 | Human glioblastoma | 10 X | Raw count | 12,074 | Algebra | Source | 200 | 20 | 1000 |
| Couturier et al., 2020 | Human glioblastoma | 10 X | Raw count | 4,508 | Algebra | Target | 200 | 3 | 1000 | |
| TCGA-GBM Weinstein et al., 2013* | Human glioblastoma | Bulk RNA-seq | Raw count | 613 | Algebra | Survival | ||||
| BRCA | Wu et al., 2020 | Human breast cancer | 10 X | Raw count | 24,271 | Algebra | Source | 200 | 20 | 1000 |
| Zhou et al., 2021 | Human Breast cancer | Smart-seq2 | Raw count | 545 | Algebra | Target | 200 | 3 | 1000 | |
| TCGA-BRCA Weinstein et al., 2013* | Human Breast cancer | Bulk RNA-seq | Raw count | 1,079 | Algebra | Survival | ||||
| mCRPC | He et al., 2021 | Human metastatic prostate cancer | Smart-Seq2 | TPM | 836 | Algebra | Target | 200 | 3 | 1000 |
| Abida et al., 2019 | Human metastatic prostate cancer | Bulk RNA-seq | TPM | 81 | Algebra | Survival |
-
Data downloaded from https://www.cancer.gov/tcga.
Appendix 1—table 3
Summary of evaluation metric for all target datasets at resolution = 1.0 analyzed in this paper.
| Normal Prostate | 3 K PBMC | Pancreas | In-house CITE-seq | |||||||||
|---|---|---|---|---|---|---|---|---|---|---|---|---|
| ARI | NMI | SI(Cell type) | ARI | NMI | SI(Cell type) | ARI | NMI | SI(Cell type) | ARI | NMI | SI(Cell type) | |
| SCellBOW | 0.26 | 0.56 | 0.13 | 0.49 | 0.52 | 0.11 | 0.56 | 0.82 | 0.53 | 0.65 | 0.72 | 0.06 |
| Scanpy | 0.16 | 0.53 | 0.13 | 0.36 | 0.5 | 0.1 | 0.38 | 0.73 | 0.24 | 0.51 | 0.66 | 0.08 |
| Seurat | 0.15 | 0.52 | 0.21 | 0.31 | 0.48 | 0.1 | 0.52 | 0.79 | 0.53 | 0.47 | 0.66 | 0.04 |
| ItClust | 0.01 | 0.02 | –0.05 | 0.33 | 0.46 | –0.05 | 0.31 | 0.29 | –0.05 | 0.43 | 0.55 | –0.13 |
| scETM | 0.11 | 0.37 | 0.04 | 0.38 | 0.5 | 0.08 | 0.35 | 0.67 | 0.46 | 0.41 | 0.61 | –0.03 |
| scBERT | 0.18 | 0.51 | 0.22 | 0.32 | 0.47 | 0.07 | 0.35 | 0.72 | 0.35 | 0.58 | 0.70 | 0.06 |
| scPhere | 0.04 | 0.42 | 0.05 | 0.19 | 0.38 | 0.04 | 0.23 | 0.63 | 0.33 | 0.24 | 0.55 | 0.21 |
| DESC | 0.17 | 0.52 | 0.02 | 0.46 | 0.49 | –0.06 | 0.39 | 0.72 | 0.2 | 0.54 | 0.65 | 0.01 |
Appendix 1—table 4
Marker gene set major immune cell types.
| Major cell types | Marker genes |
|---|---|
| B cells | CD19, CD79A, MS4A1, CD74, HLA-DRA |
| CD4 T | IL7R, CCR7, CD3D, CD4 |
| CD8 T | GZMK, CD8A, CD8B, GZMB |
| DC | CST3, CD14, ITGAM, ITGAX |
| MAIT | CD3D, KLRB1, RORA, ZBTB16 |
| Mono | CD14, S100A12 |
| NK cells | NKG7, GNLY, CD247, CCL3, GZMB, CD3D |
Appendix 1—table 5
Computation time across different transfer learning methods under the same hardware conditions (128 GB RAM, 16 core processor).
| Wall time (Pancreas dataset) | |||
|---|---|---|---|
| Methods | Source Model (~12 K cells) | Target Model (~2 K cells) | Total time |
| ItClust | 2 min 4 s | ~2 min | |
| SCellBOW (thread = 16) | 2 min 5 s | 1 min 20 s | ~3 min |
| SCellBOW (thread = 1) | 6 min 21 s | 2 min 8 s | ~8 min |
| scETM (600 epoch, thread = 16) | 22 min 38 s | 5 min 46 s | ~27 min |
| scETM (600 epoch, thread = 1) | 23 min 49 s | 5 min 58 s | ~28 min |
| scBERT | 3 hrs 33 min | 2 min | ~3 hrs |
-
The term ‘thread’ represents the number of threads used: thread = 1 indicates single-threaded execution, while thread >1 indicates multi-threaded execution.
Appendix 1—table 6
Gene set for molecular subtypes of Glioblastoma.
| Subtype | Marker genes |
|---|---|
| Proneural | DLL3, BCAN, OLIG2, NCAM1, NKX2-2, ASCL1, PDGFRA |
| Classical | EGFR, CDKN2A, RB1, CDK4, CCDN2 |
| Mesenchymal | CHI3L1, CD44, VIM, RELB, TRADD, PDPN, YKL40, MET, NF1, TNFRSF1A |
Appendix 1—table 7
Labrecque et al., 2019 gene sets for molecular subtypes of mCRPC.
| Subtype | Marker genes |
|---|---|
| NEPC | CHGA, SYP, ACTL6B, SNAP25, INSM1, ASCL1, CHRNB2, SRRM4 |
| ARPC | AR, NKX3-1, KLK3, CHRNA2, SLC45A3, NAP1L2, S100A14, TRGC1, TARP |
Additional files
-
Supplementary file 1
Result of differential expression analysis for the He et al., 2021 metastatic prostate cancer dataset.
This file also includes information on custom gene sets used for ARPC and NEPC analysis.
- https://cdn.elifesciences.org/articles/98469/elife-98469-supp1-v2.xlsx
-
Supplementary file 2
Result of differential expression analysis for the in-house matched PBMC and splenocyte dataset.
- https://cdn.elifesciences.org/articles/98469/elife-98469-supp2-v2.xlsx
-
MDAR checklist
- https://cdn.elifesciences.org/articles/98469/elife-98469-mdarchecklist1-v2.docx
Download links
A two-part list of links to download the article, or parts of the article, in various formats.
Downloads (link to download the article as PDF)
Open citations (links to open the citations from this article in various online reference manager services)
Cite this article (links to download the citations from this article in formats compatible with various reference manager tools)
Artificial intelligence driven tumor risk stratification from single-cell transcriptomics using phenotype algebra
eLife 13:RP98469.
https://doi.org/10.7554/eLife.98469.3


