Heparan sulphate binding controls in vivo half-life of the HpARI protein family
- Division of Cell Signalling and Immunology, School of Life Sciences, University of Dundee, United Kingdom
- Department of Biochemistry, University of Oxford, United Kingdom
- Kavli Institute of Nanoscience Discovery, Dorothy-Crowfoot Hodgkin Building, University of Oxford, United Kingdom
- Department of Biology, Hull York Medical School, York Biomedical Research Institute, University of York, United Kingdom
Figures
Figure 1 with 1 supplement

HpARI family members have differing effects against IL-33 release.
(A) Experimental setup for B and C. (B) Quantification of mouse IL-33 levels by enzyme-linked immunosorbent assay (ELISA) in the cell-free bronchoalveolar lavage (BAL) fluids of mice treated as shown in A. (C) Quantification of IL-33 by western blot of the samples shown in B. (D) Electromobility shift assay (EMSA) of HpARI1, HpARI2, and HpARI3. (E) Quantification of % free DNA (i.e. low molecular weight band) in the presence of each protein in EMSA shown in D. (F) HpARI3:2 and HpARI2:3 fusion protein design. (G) EMSA of HpARI2, HpARI3:HpARI2 fusion, or HpARI2:HpARI3 fusion. Data in B–C pooled from two repeat experiments each with three mice per group for a total n=6. Error bar shows SEM. ns = not significant, *=p<0.05, ****=p<0.0001.
-
Figure 1—source data 1
Original western blot and gel images from Figure 1D and G and Figure 1—figure supplement 1.
- https://cdn.elifesciences.org/articles/99000/elife-99000-fig1-data1-v1.zip
-
Figure 1—source data 2
Annotated western blot and gel images from Figure 1D and G and Figure 1—figure supplement 1.
- https://cdn.elifesciences.org/articles/99000/elife-99000-fig1-data2-v1.zip
Figure 1—figure supplement 1

IL-33 western blot in bronchoalveolar lavage (BAL) supernatant.
Figure 2

HpARI2:HpARI3 chimeras indicate CCP2/3 domains are central to IL-33 amplification versus suppression.
(A) IL-5 production from bone marrow cells in response to IL-2, IL-7, and freeze-thawed CMT-64 supernatants, in the presence of a range of concentrations of HpARI2, HpARI3, HpARI2:3, or HpARI3:2. Data pooled from three biological replicates. (B) Alternaria allergen with HpARI2, HpARI3, or fusions were administered to mice, cell-free bronchoalveolar lavage (BAL) fluid prepared 15 min later, and IL-33 measured by western blot. (C) Experimental setup for D–H. (D) BAL eosinophil numbers (Siglecf+CD11–CD45+) from mice treated as shown in C. (E) Eosinophil (SiglecfhiCD11–CD45+) numbers in lung tissue from mice treated as shown in C. (F) CD25 expression level on lung ILC2 (ICOS+Lin–CD45+) from mice treated as shown in C. (G) FSC mean in lung ILC2 (ICOS+Lin–CD45+) from mice treated as shown in C. (H) BAL IL-5 levels (enzyme-linked immunosorbent assay [ELISA]) from mice treated as shown in C. All in vivo data pooled from two repeat experiments each with four mice per group for a total n=8. Error bar shows SEM. NS = not significant, *=p<0.05 **=p<0.01, ***=p<0.001, ****=p<0.0001.
-
Figure 2—source data 1
Original western blot images from Figure 2B.
- https://cdn.elifesciences.org/articles/99000/elife-99000-fig2-data1-v1.zip
-
Figure 2—source data 2
Annotated western blot image from Figure 2B.
- https://cdn.elifesciences.org/articles/99000/elife-99000-fig2-data2-v1.zip
Figure 3 with 3 supplements
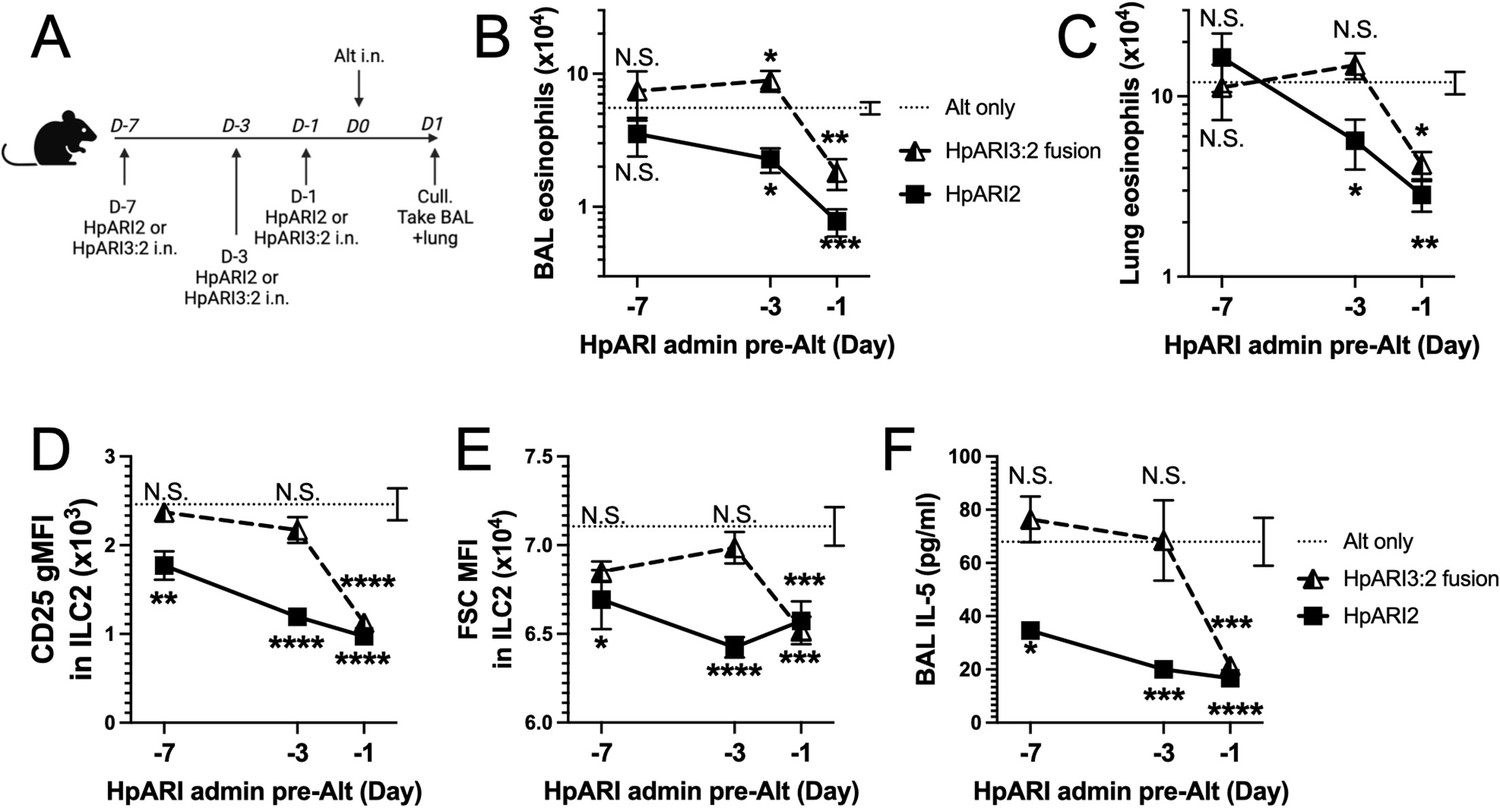
HpARI fusion proteins show CCP1 domain determines half-life in vivo.
(A) Experimental setup for B–E. HpARI2 or HpARI3:2 fusion were administered intranasally 7 days, 3 days, or 1 day prior to Alternaria allergen. Mice were culled 24 hr after Alternaria administration, and bronchoalveolar lavage (BAL) and lung tissue taken for analysis. (B) BAL eosinophil numbers (Siglecf+CD11–CD45+) from mice treated as shown in A. (C) Eosinophil (SiglecfhiCD11–CD45+) numbers in lung tissue from mice treated as shown in A. (D) CD25 geometric mean fluorescence intensity on lung ILC2 (ICOS+CD90+Lin–CD45+) from mice treated as shown in A. (E) FSC mean in lung ILC2 from mice treated as shown in A. (F) BAL IL-5 levels (enzyme linked immunosorbent assay [ELISA]) from mice treated as shown in A. Data from day –7 timepoint from a single experimental repeat, all other groups pooled from two experiments. Total biological repeats at day 7=4, all other timepoints n=8. Error bar shows SEM. NS = not significant, *=p<0.05 **=p<0.01, ***=p<0.001, ****=p<0.0001. Analysed by two-way analysis of variance (ANOVA) with Dunnett’s post-test.
Figure 3—figure supplement 1
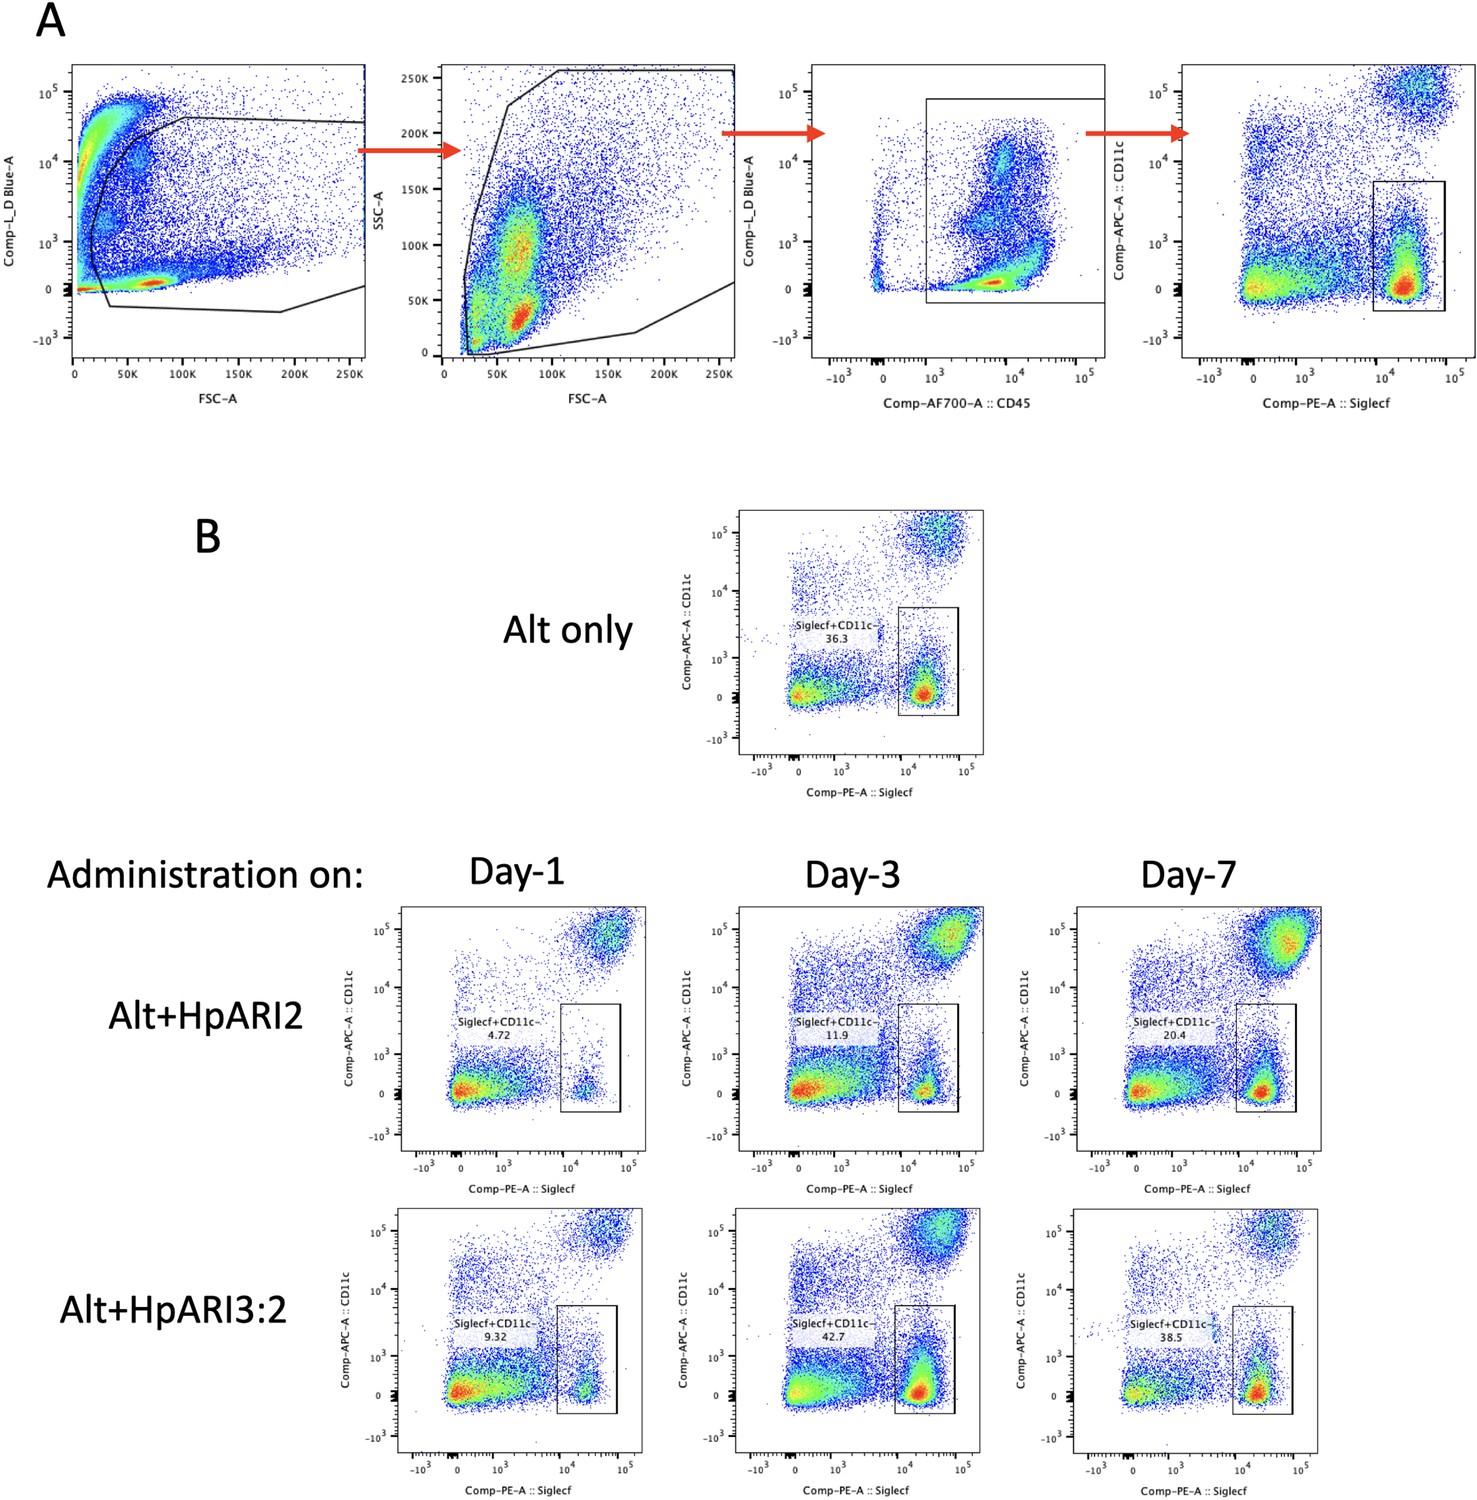
Gating strategy and representative flow plots for bronchoalveolar lavage (BAL) eosinophils.
(A) Gating strategy for BAL cells. Cells were gated on FSC versus zombie UV viability stain to exclude debris and dead cells, then gated for all cells by FSC versus SSC, then on CD45-positive cells, and finally for SiglecF+CD11c– eosinophils. (B) Representative flow cytometry plots for BAL SiglecF+CD11c– eosinophils, gated on live CD45+ cells, as shown in (A). Data used to calculate total BAL eosinophil cell numbers shown in Figure 3B.
Figure 3—figure supplement 2
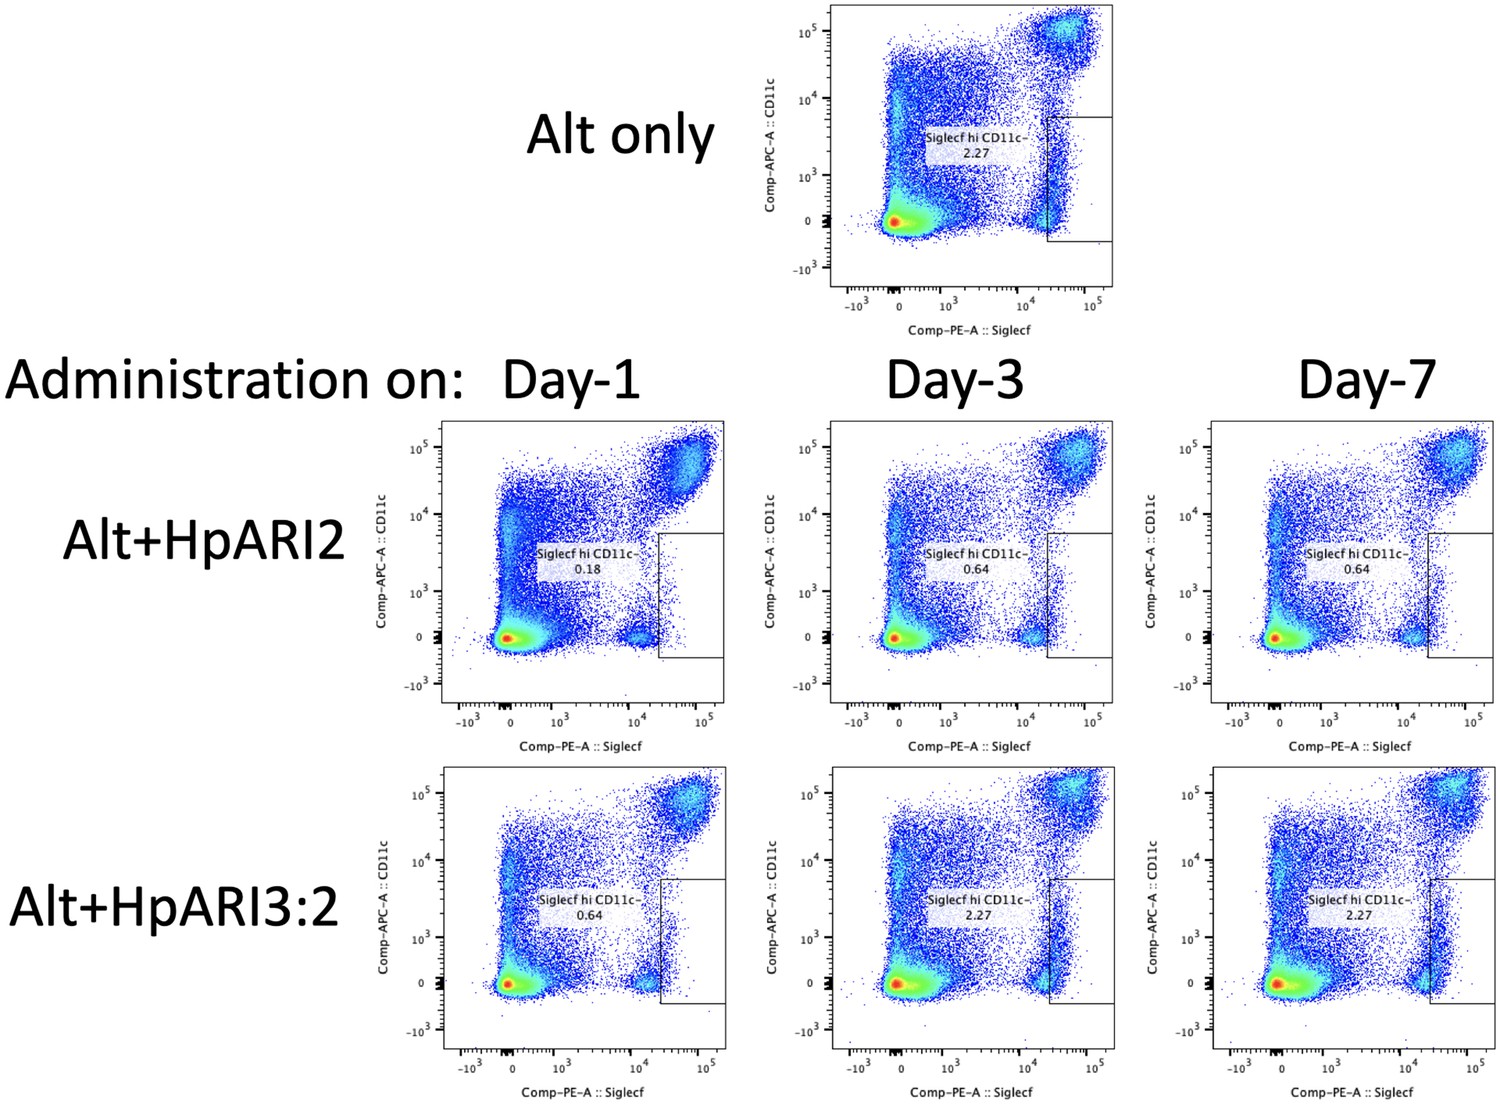
Representative flow plots for lung tissue cells.
Representative flow cytometry plots for lung SiglecFhiCD11c– eosinophils, gated on live CD45-positive cells. Data shown here was used to calculate total lung eosinophil cell numbers shown in Figure 3C.
Figure 3—figure supplement 3

Gating strategy and representative flow plots for lung tissue type 2 innate lymphoid cells (ILC2).
(A) Gating strategy for lung ILC2s. Cells were gated on FSC versus zombie UV viability stain to exclude debris and dead cells, then on CD45-positive cells, lymphocytes by FSC versus SSC, and finally for CD90.2+ICOS+Lineage– ILC2s. (B) Representative histograms for CD25 expression in gated ILC2s. Samples representative of data shown in Figure 3C. Geometric mean fluorescence intensity (GeoMFI) shown in brackets. CD25 fluorescence minus one (FMO) control also shown. (C) Representative histograms for FSC signal in gated ILC2s. Samples representative of data shown in Figure 3D. Median fluorescence intensity (MFI) shown in brackets.
Figure 4

HpARI proteins have variable levels of heparin sulphate (HS) binding.
(A) 50 μg of HpARI1, HpARI2, or HpARI3 were added to 50 μg HS and ran on a Superdex 200 Increase 10/300 GL gel filtration column. A280 trace shown. (B) Coomassie gel of HpARI1, HpARI2, or HpARI3 pull-down using HS-coated beads. Input, unbound (i.e. supernatant from beads) and pull-down elution shown. Representative of three repeat experiments. (C) Flow cytometry staining of HpARI1, HpARI2, or HpARI3 tetramers with streptavidin-PE, on naive mouse lung cells gated on live CD45+ or live CD45- cells. Representatives of two repeat experiments. (D) Isothermal calorimetry of HpARI1 ± HS. (E) Isothermal calorimetry of HpARI2 ± HS. (F) Isothermal calorimetry of HpARI3 ± HS.
-
Figure 4—source data 1
Original Coomassie gel images from Figure 4B.
- https://cdn.elifesciences.org/articles/99000/elife-99000-fig4-data1-v1.zip
-
Figure 4—source data 2
Annotated Coomassie gel image from Figure 4B.
- https://cdn.elifesciences.org/articles/99000/elife-99000-fig4-data2-v1.zip
Figure 5

Molecular modelling of HpARI2 interaction of heparin oligosaccharide.
(A) The top panel shows electrostatic surface rendering of AlphaFold models of the CCP1 domains of HpARI1-3. Blue and red surfaces indicate positive and negative surfaces, respectively. The lower panel shows an amino acid sequence alignment of HpARI family proteins with residues contributing to electropositive patch highlighted in cyan. (B, C) Electrostatic surface representation of an AlphaFold model of heparin tetrasaccharide docked on full-length HpARI1 (B) and HpARI2 (C). Three different docking solutions are shown. The right-hand panels show the spread of these models with heparins shown as coloured sticks on a surface representation of the CCP1 domain.
Figure 6

HpARI2 pentaR mutant effectively blocks IL-33 responses in vitro, but has a short half-life in vivo.
(A) IL-5 production from bone marrow cells in response to IL-2, IL-7, and freeze-thawed CMT-64 supernatants, in the presence of a range of concentrations of HpARI2_WT or HpARI2_pentaR. Data pooled from three biological replicates. (B) Coomassie gel of HpARI1, HpARI2, HpARI3, or HpARI2-pentaR (A2pentaR) pull-down using heparin-coated beads. Input, unbound (i.e. supernatant from beads), and pull-down elution shown. Representative of three repeats. (C) Electromobility shift assay (EMSA) of HpARI2 or HpARI2_pentaR. Representative of two repeats. (D) Experimental setup for C–F. HpARI2_WT or HpARI2_pentaR (10 μg of each) were administered intranasally 3 days or 1 day prior to Alternaria (Alt) allergen. Mice were culled 24 hr after Alternaria administration, and bronchoalveolar lavage (BAL) and lung tissue taken for analysis. (E) BAL eosinophil numbers (Siglecf+CD11–CD45+) from mice treated as shown in D. (F) Eosinophil (SiglecfhiCD11–CD45+) numbers in lung tissue from mice treated as shown in D. (G) CD25 geometric mean fluorescence intensity on lung ILC2 (ICOS+Lin–CD45+) from mice treated as shown in D. (H) BAL IL-5 levels (enzyme linked immunosorbent assay [ELISA]) from mice treated as shown in D. Data in E–H from a single experiment, for a total of four biological replicates per timepoint. Error bar shows SEM. NS = not significant, *=p<0.05 **=p<0.01, ***=p<0.001, ****=p<0.0001. Analysed by one-way analysis of variance (ANOVA) with Dunnett’s post-test, comparing each condition to Alternaria-only control.
-
Figure 6—source data 1
Original Coomassie and electromobility shift assay (EMSA) gel images from Figure 6B and C.
- https://cdn.elifesciences.org/articles/99000/elife-99000-fig6-data1-v1.zip
-
Figure 6—source data 2
Annotated Coomassie and electromobility shift assay (EMSA) gel images from Figure 6B and C.
- https://cdn.elifesciences.org/articles/99000/elife-99000-fig6-data2-v1.zip
Additional files
Download links
A two-part list of links to download the article, or parts of the article, in various formats.
Downloads (link to download the article as PDF)
Open citations (links to open the citations from this article in various online reference manager services)
Cite this article (links to download the citations from this article in formats compatible with various reference manager tools)
Heparan sulphate binding controls in vivo half-life of the HpARI protein family
eLife 13:RP99000.
https://doi.org/10.7554/eLife.99000.3


