Endosomal-lysosomal organellar assembly (ELYSA) structures coordinate lysosomal degradation systems through mammalian oocyte-to-embryo transition
- Laboratory of Molecular Traffic, Institute for Molecular and Cellular Regulation, Gunma University, Japan
- Department of Cellular and Molecular Neuropathology, Juntendo University Graduate School of Medicine, Japan
Figures
Figure 1 with 1 supplement

Endosomes and lysosomes form giant structures in the periphery of the oocyte plasma membrane.
(A) Metaphase II (MII) oocytes were fixed and co-stained with anti-RAB5 and anti-LAMP1 antibodies. The schematic diagram indicates the location of oocyte chromosomes and metaphase plate in the MII oocytes. Arrowheads indicate the positions of oocyte chromosomes. Magnified regions (right) are indicated by yellow boxes. (B) Embryos at different stages were fixed and co-stained with anti-RAB5 and anti-LAMP1 antibodies. Hour(s) post-fertilization is indicated as hpf. DNA was stained with Hoechst 33342. Maximum intensity projection of confocal images at an axial scan range of 80 µm is shown as Z-projection images.
Figure 1—figure supplement 1
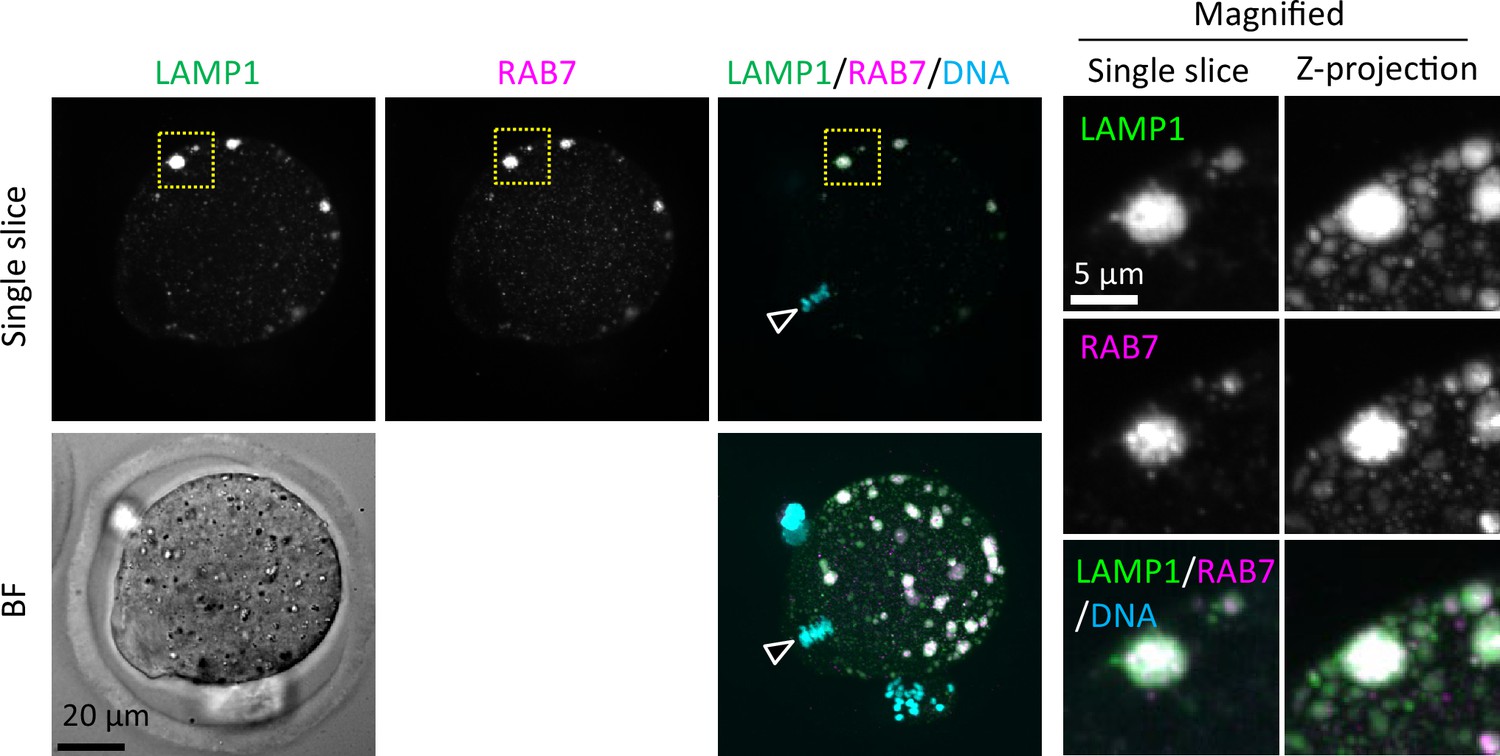
Endosomes and lysosomes form giant structures in the periphery of the oocyte plasma membrane.
Metaphase II (MII) oocytes were fixed and co-stained with anti-RAB7 and anti-LAMP1 antibodies. The schematic diagram indicates the location of oocyte chromosomes and the metaphase plate in the MII oocytes. Maximum intensity projection of confocal images at an axial scan range of 80 µm is shown as Z-projection images. Arrowheads indicate the positions of oocyte chromosomes.
Figure 2 with 2 supplements
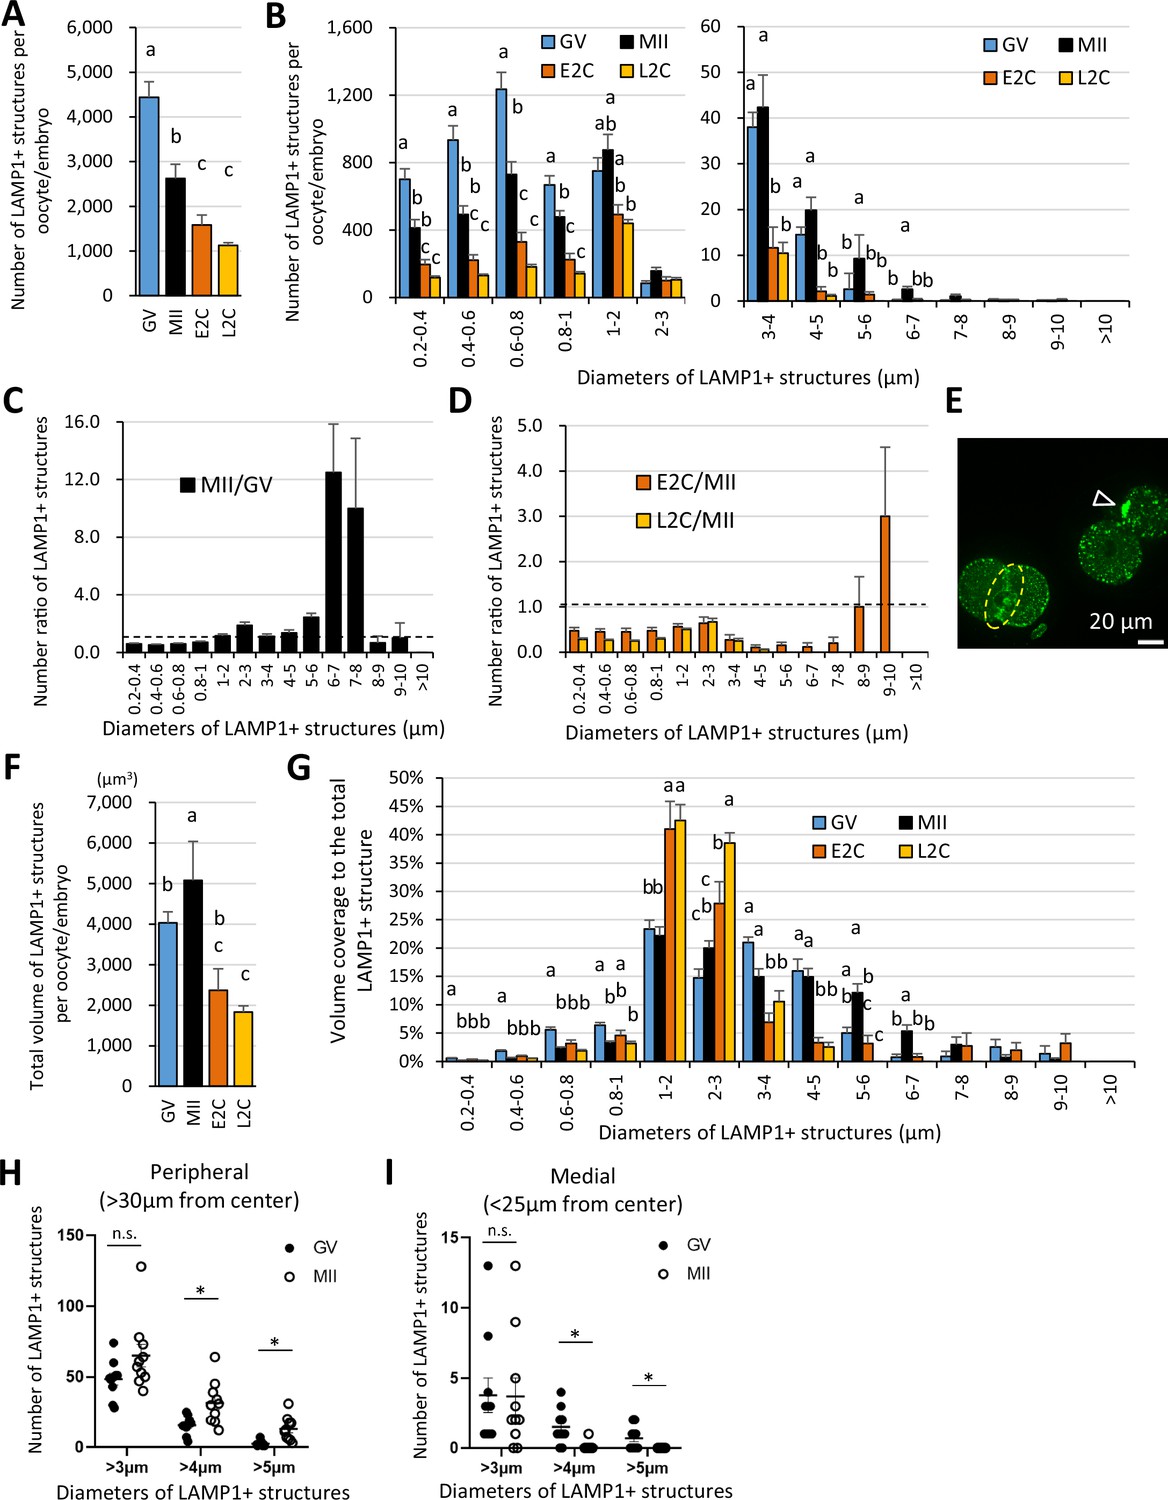
The giant structures are enlarged in the periphery of the metaphase II (MII) oocyte plasma membrane (PM) during oocyte maturation.
Germinal vesicle (GV) oocyte, MII oocyte, early 2-cell (E2C: 24 hr post-fertilization [hpf]), and late 2-cell (L2C: 40 hpf) embryos were fixed and stained with anti-LAMP1 antibody. Reconstituted three-dimensional objects for the LAMP1-positive organelles in 9–10 oocytes for each stage from more than three independent experiments were further analyzed for number, size, and distribution. (A) Averaged total number of LAMP1-positive objects per oocyte/embryo. (B) Numbers of the LAMP1-positive objects sorted by size (indicated by the diameters of spheres calculated from volumes). (C) Ratios of (B) for MII/GV to present changes during oocyte maturation. (D) Ratios of (B) for E2C/MII or L2C/MII to present post-fertilization changes. (E) A single confocal section image for E2C embryos, which have transient and concatenated objects upon cellular division (arrowhead) and a prominent signal on the PM of cleavage furrow (dotted circle). (F) Averaged total volume (µm3) of the objects per oocyte/embryo. (F, G) Total volumes of the objects sorted by size, or the percentage of each fraction relative to the total LAMP1-positive object volume. (H, I) Numbers of large objects in GV or MII oocytes at a distance of >30 μm (cellular peripheral) or <25 μm (medial) from the cellular center. Groups with different letters are significantly different (p<0.05, one-way ANOVA and Tukey’s multiple comparison test). Error bars indicate SEM. Dot plots show mean ± SEM and asterisks indicate significant difference between two groups.
-
Figure 2—source data 1
Excel file providing the numerical source data to Figure 2.
- https://cdn.elifesciences.org/articles/99358/elife-99358-fig2-data1-v1.xlsx
Figure 2—figure supplement 1
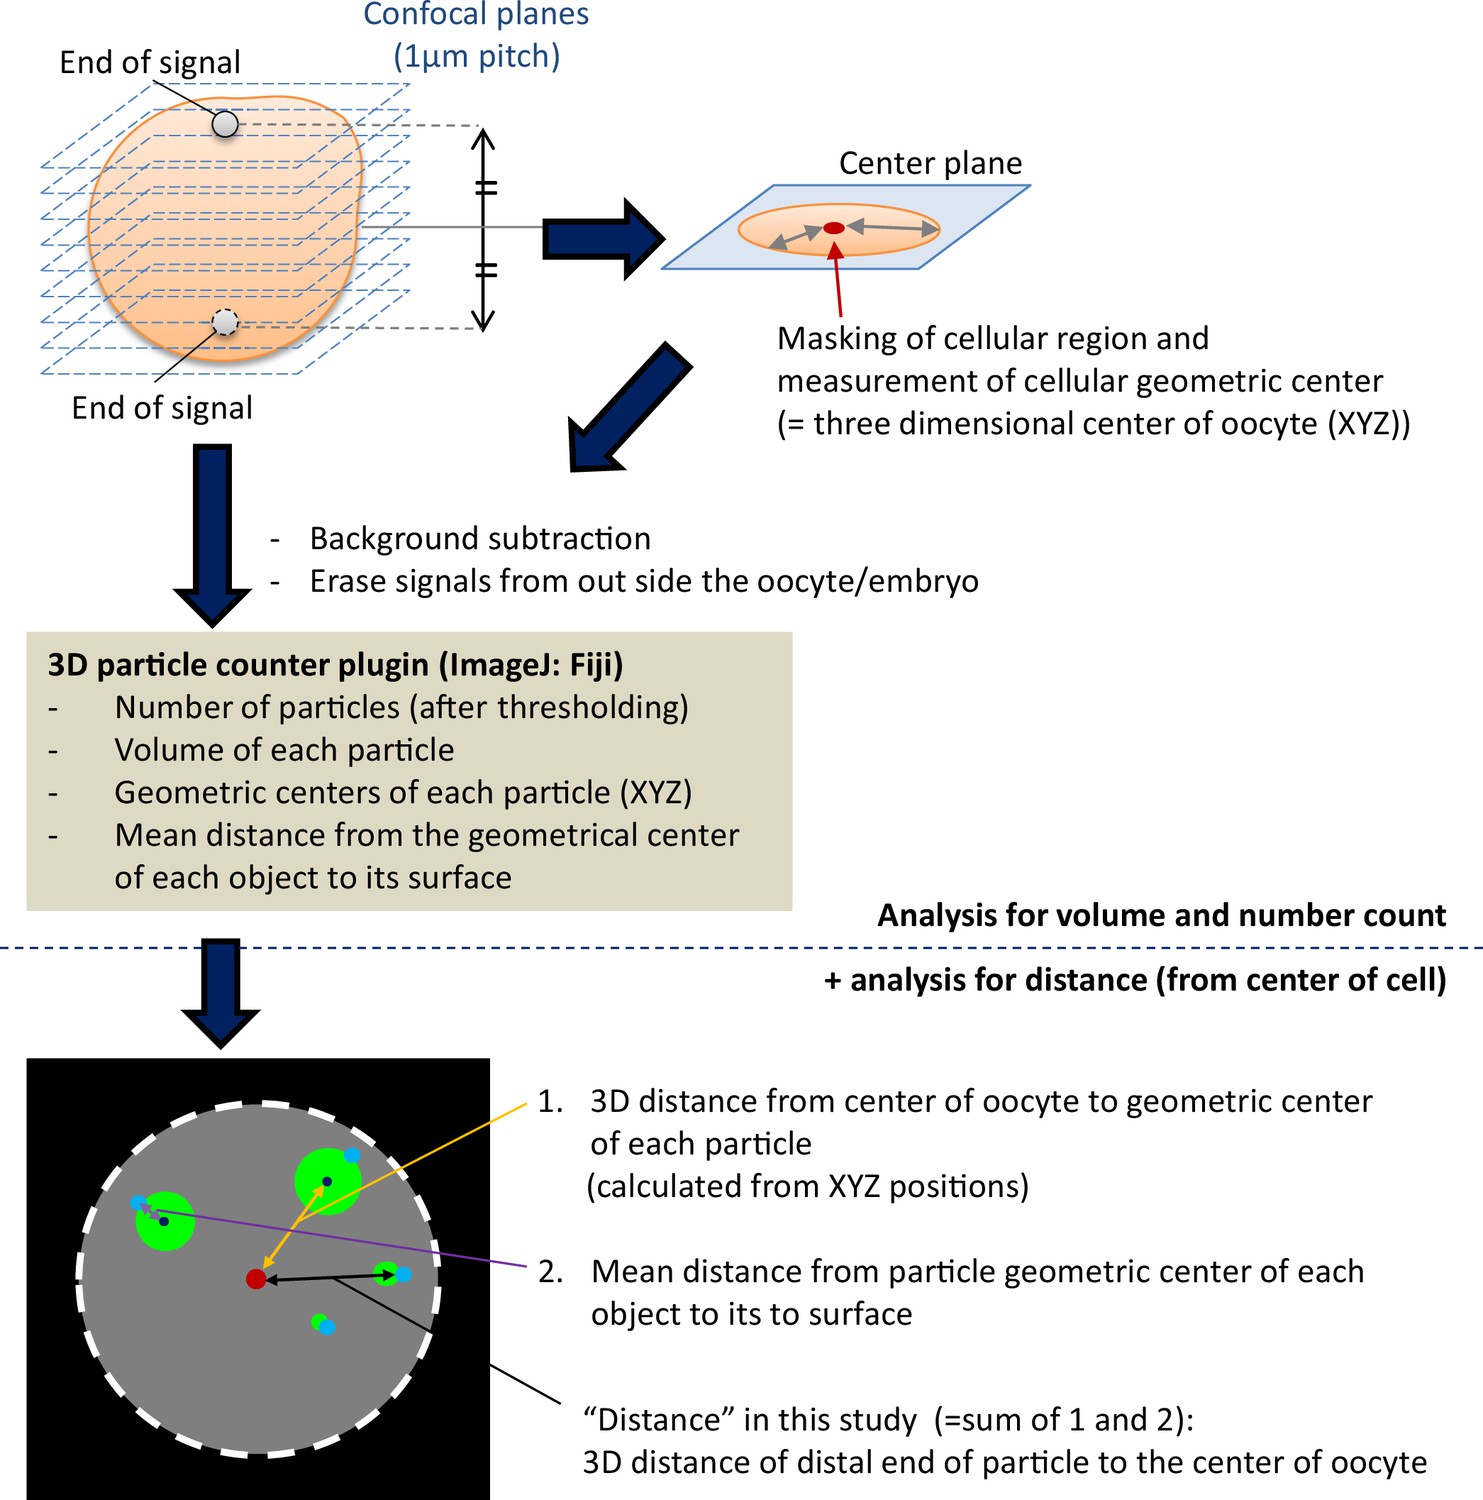
Schemes of the three-dimensional (3D) particle analysis in this study.
Oocytes/embryos were fixed and stained, and three-dimensional images were acquired as serial z-stack images using confocal microscopy. Fields to analyze were cropped for each oocyte/embryo, and the upper and lower end of LAMP1 fluorescent signals in cytosol were examined and used to determine the center plane of the cell. The cellular region in the center plane was used for masking and determination of the geometric center (as a 3D center of the oocyte). Deletion of the signals from the polar body or zona pellucida was carried out manually. Signals on PM were eliminated by both size exclusion of 3D particle counter plugin in Fiji software and by manual erasing. The distal distance of each particle from the 3D center of the oocyte was used for the distribution study to avoid underestimation of the distance of large endosomal-lysosomal organellar assembly (ELYSA) particle, which was calculated by adding the 3D distance from the center of cell to the geometric center of the particle and the mean diameter of the particle.
Figure 2—figure supplement 2
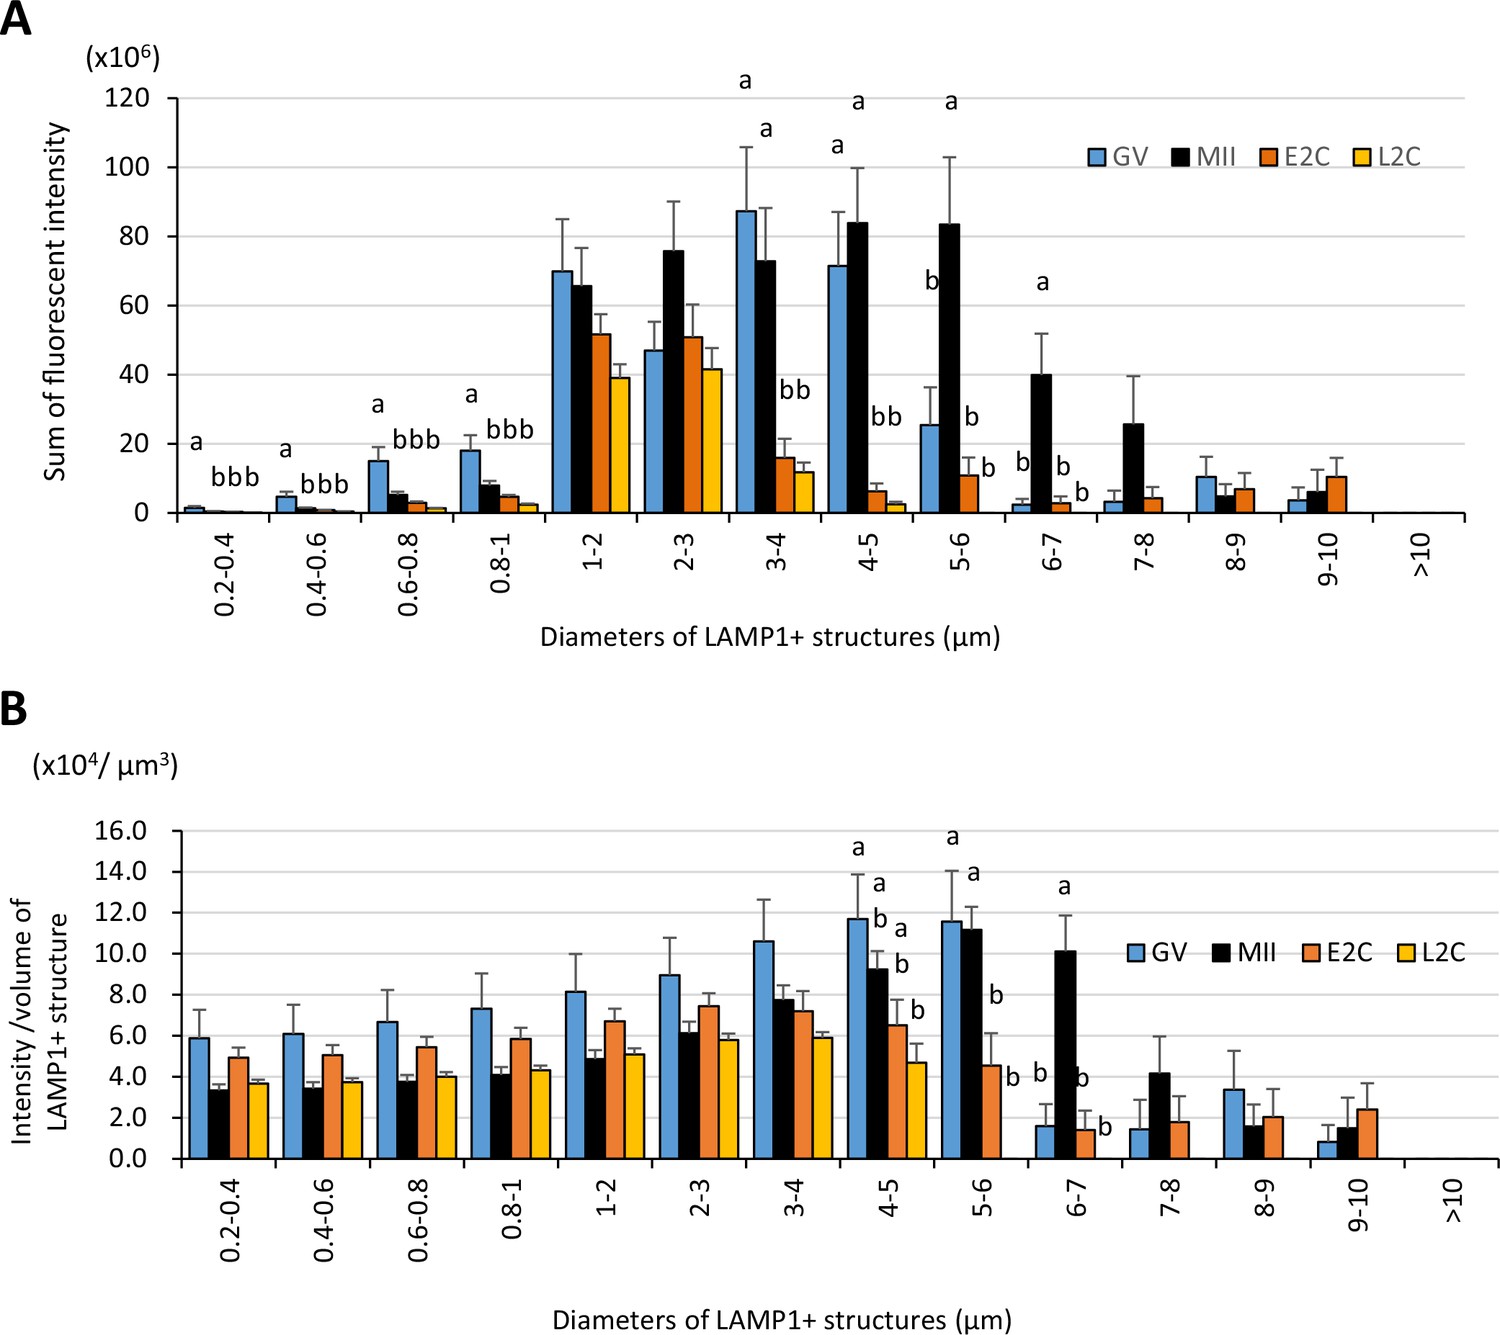
Large LAMP1-positive structures exhibit high fluorescent intensity, especially in metaphase II (MII) oocytes.
Germinal vesicle (GV) oocytes, MII oocytes, early 2-cell (E2C: 24 hr post-fertilization [hpf]), and late 2-cell (L2C: 40 hpf) embryos were fixed and stained with anti-LAMP1 antibody. Reconstituted three-dimensional objects for the LAMP1-positive objects in 9 or 10 oocytes for each stage from more than three independent experiments were further analyzed for size and fluorescent intensity. The sorting by size (indicated by the diameters of spheres calculated from volumes) was carried out by thresholding the fluorescent intensity prior to measuring intensity. (A) Total fluorescent intensity of LAMP1-positive objects with different sizes. (B) Intensity/volume ratios of LAMP1-positive objects with different sizes. Groups with different letters are significantly different (p<0.05, one-way ANOVA and Tukey’s multiple comparison test). Error bars indicate SEM.
-
Figure 2—figure supplement 2—source data 1
Excel file providing the numerical source data to Figure 2—figure supplement 2.
- https://cdn.elifesciences.org/articles/99358/elife-99358-fig2-figsupp2-data1-v1.xlsx
Figure 3 with 2 supplements
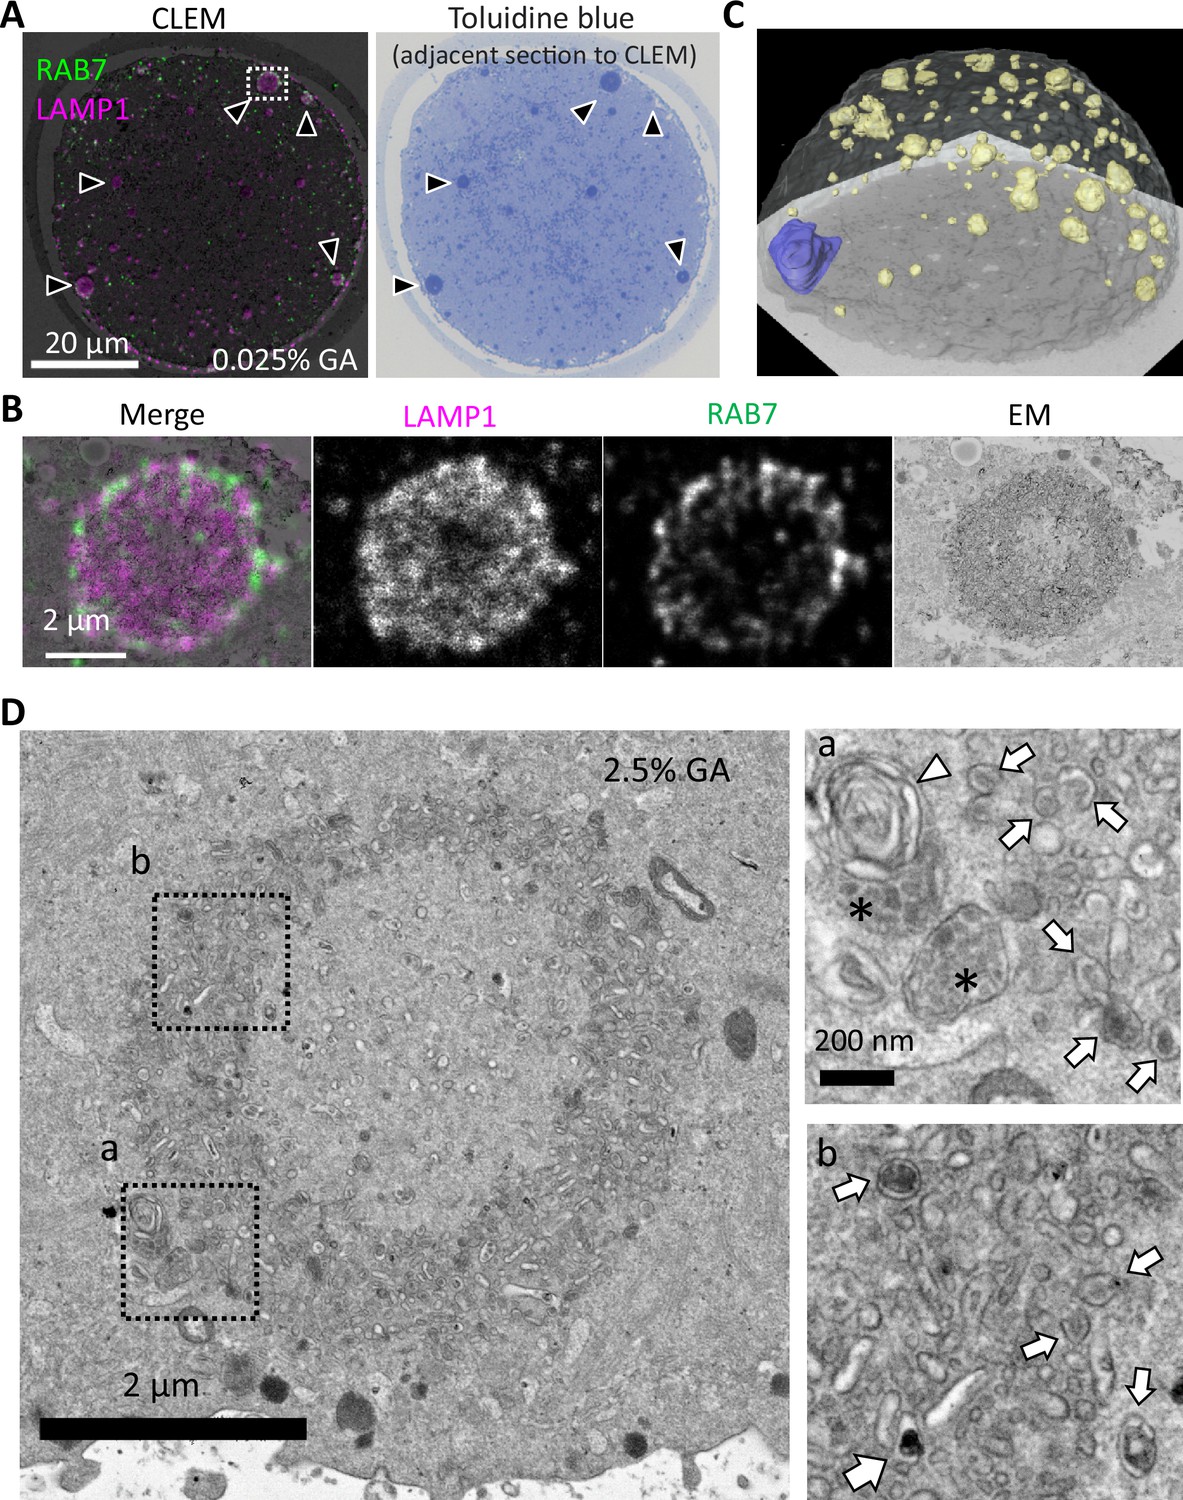
Endosomal-lysosomal organelles form assembly structures, ELYSA.
(A) The internal structure of the giant structure in metaphase II (MII) oocytes was analyzed by correlative light and electron microscopy (CLEM) analysis using anti-RAB7 and anti-LAMP1 antibodies. A merged image of immunostaining and electron microscopy (EM) is indicated (left), and a toluidine blue staining image of the adjacent thin section (right) is indicated. Black arrowheads indicate the giant structures positive for RAB7/LAMP1/toluidine blue staining. Note that RAB7/LAMP1 staining is indicated in a pseudo-color. (B) The fluorescent distribution of RAB7/LAMP1 immunostaining was analyzed with deconvolution confocal microscopy. Note that RAB7/LAMP1 staining is indicated in pseudo-color. (C) A series of images of toluidine blue-stained serial semi-thin sections of the Epon-embedded MII oocyte were reconstructed in three dimensions (3D). Based on the images obtained, chromosomes were segmented blue, toluidine blue-positive structures were segmented yellow, and the oocyte plasma membrane (PM) was segmented white. (D) The internal structures of the toluidine blue-positive structure, ELYSA, were observed using conventional EM of oocytes fixed with 2.5% glutaraldehyde (GA). Magnified regions in a or b (right) are indicated by boxes (left). Arrows, arrowheads, or asterisks indicate vesicles harboring high electron density contents and multilamellar or multivesicular structures, respectively. ELYSA, endosomal-lysosomal organellar assembly.
Figure 3—figure supplement 1

Giant structures in metaphase II (MII) oocytes were immunostained with anti-RAB7 and -LAMP1 antibodies after glutaraldehyde (GA) fixation.
MII oocytes were fixed with 0.025% GA and co-stained with anti-RAB5/RAB7 and anti-LAMP1 antibodies. Single-section images from confocal observation are shown.
Figure 3—figure supplement 2

Toluidine blue-positive structures in metaphase II (MII) oocytes show similar localization patterns to the endosomal-lysosomal organellar assembly (ELYSA).
Aligned serial toluidine blue-stained light microscopic images were stacked and three-dimensionally reconstructed by inversing the intensity and adjusting it to be transparent.
Figure 4 with 1 supplement
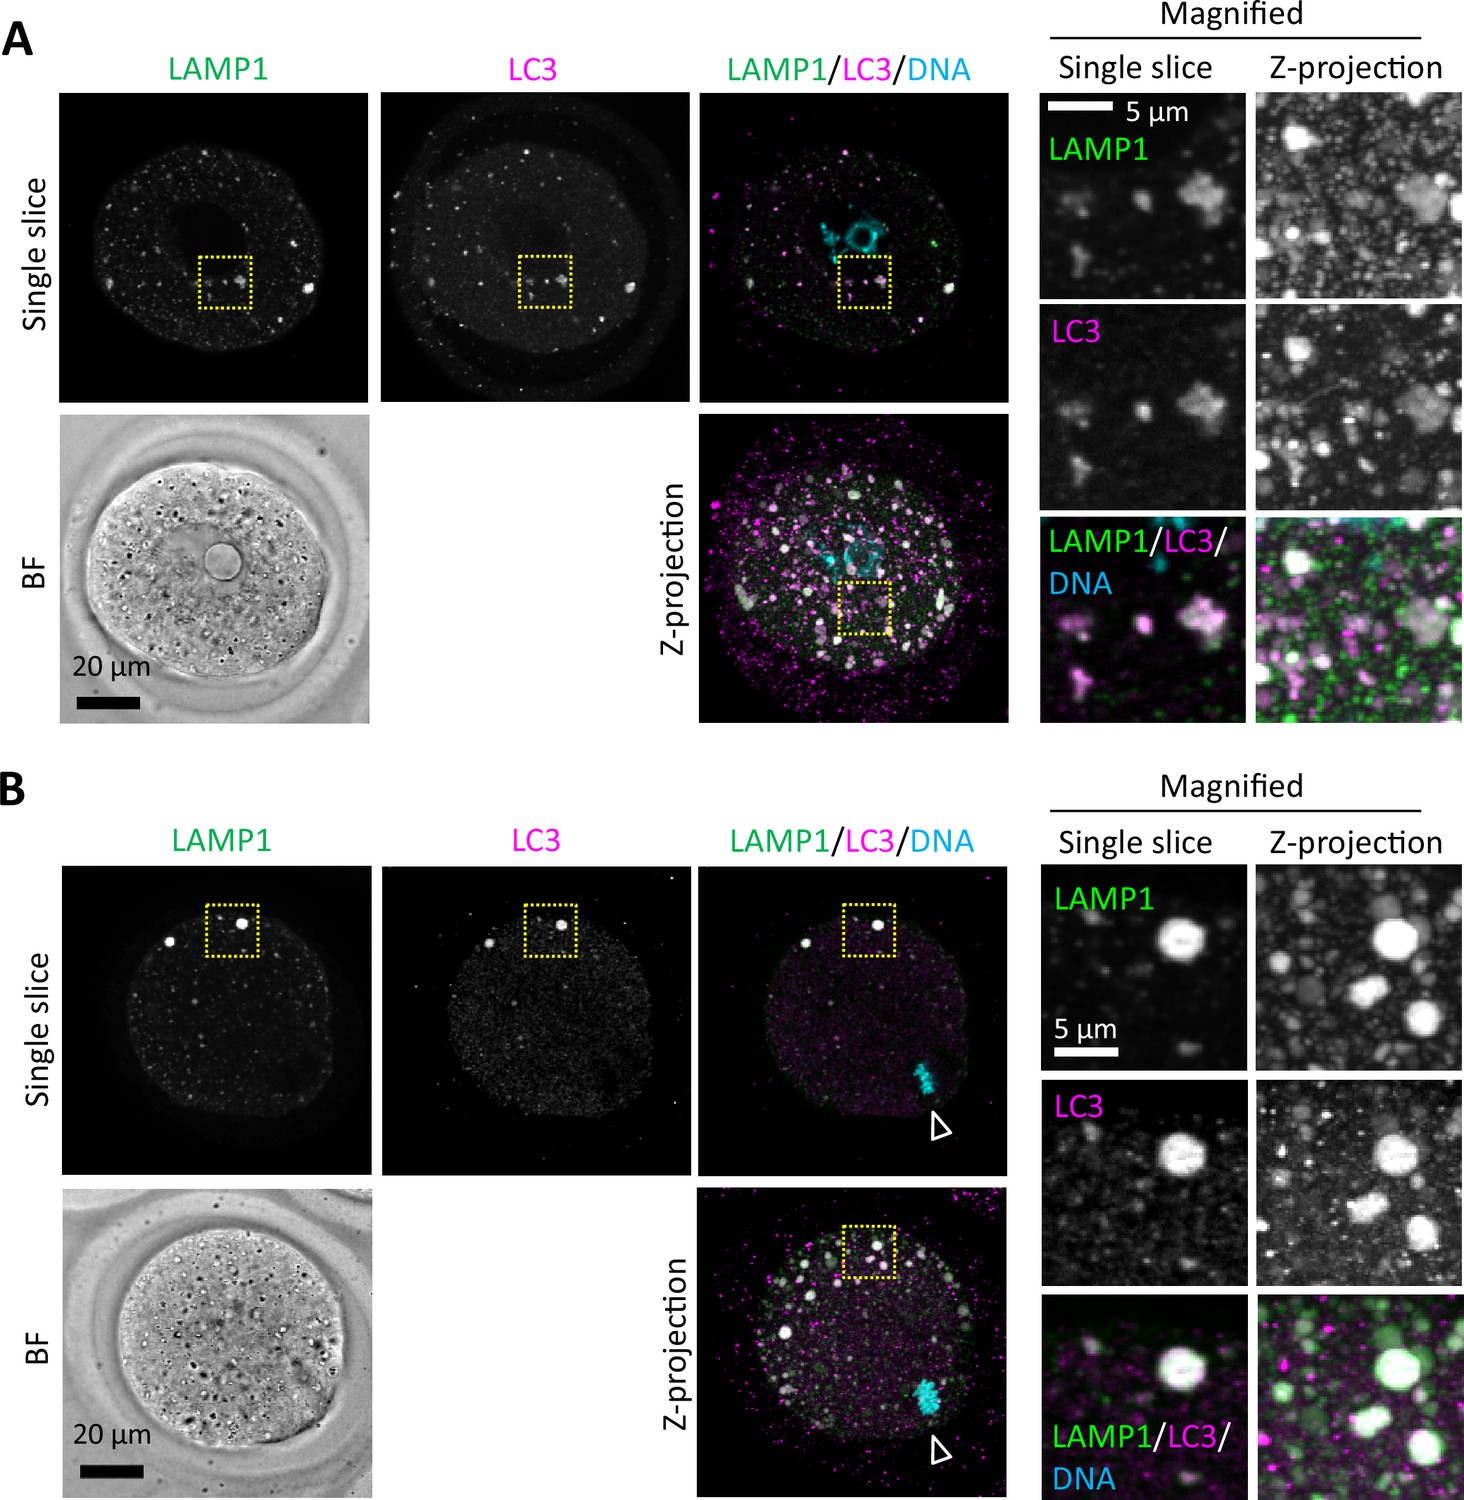
An autophagy regulator LC3 is detected in endosomal-lysosomal organellar assembly (ELYSA).
Germinal vesicle (GV) (A) and metaphase II (MII) (B) oocytes were fixed and co-stained with anti-LC3 and anti-LAMP1 antibodies. Magnified regions (right) are indicated by yellow boxes. DNA was stained with Hoechst 33342. Arrowheads indicate the positions of oocyte chromosomes. Maximum intensity projection of confocal images at an axial scan range of 80 µm is shown as Z-projection images.
Figure 4—figure supplement 1
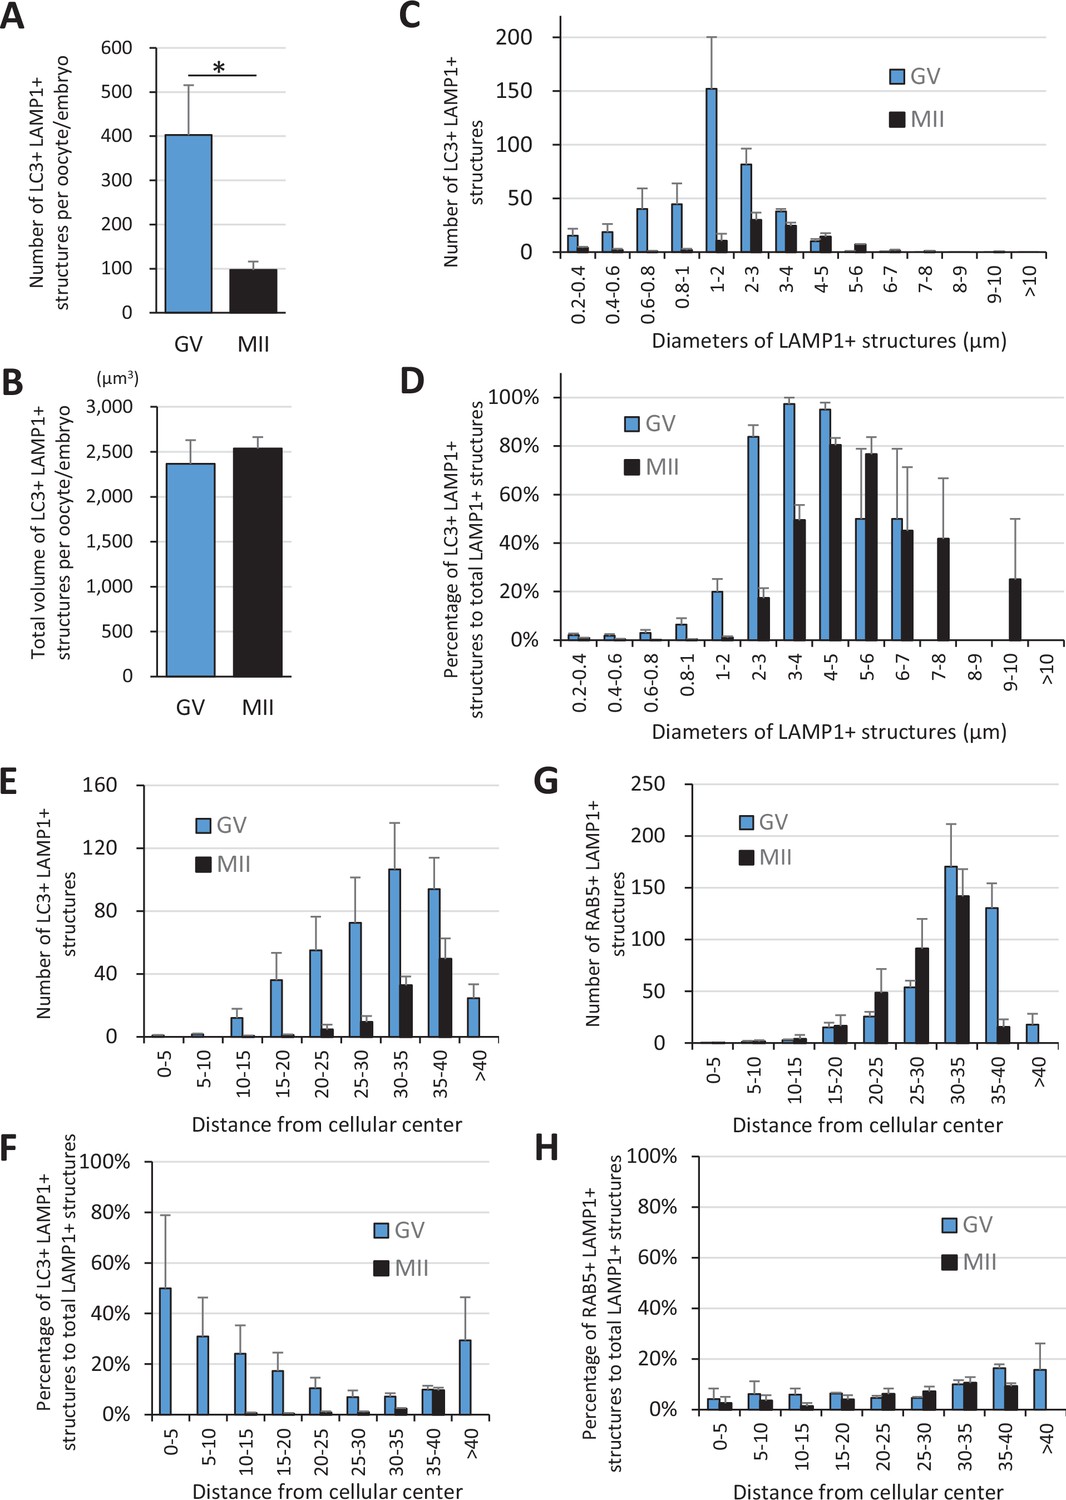
LC3 signals colocalize with LAMP1 signals in a size-dependent manner.
Germinal vesicle (GV) and metaphase II (MII) oocytes stained with anti-LAMP1 antibody and anti-LC3 or anti-RAB5 antibody were reconstituted three-dimensionally for their objects positive for the target proteins, and four oocytes for each stage were further analyzed for number, size, and distribution. (A, B) Averaged total numbers or total volumes of the double-positive objects for LC3 and LAMP1 per oocyte/embryo, respectively. (C, D) Average numbers or percentage of total LAMP1-positive objects of the double-positive objects for LC3 and LAMP1 after sorting of the objects by size (indicated by the diameters of spheres calculated from volumes), respectively. (E, F) The double-positive objects for LC3 and LAMP1 were sorted by distance from the three-dimensional geometrical center of the oocyte. Average numbers or percentages of total LAMP1-positive objects are indicated, respectively. (G, H) The double-positive objects for RAB5 and LAMP1 were sorted by distance from the three-dimensional geometrical center of the oocyte. Average numbers or percentages of total LAMP1-positive objects are indicated, respectively. Significance was examined using a two-tailed Student’s t-test, assuming equal variances between groups; the significance is indicated with asterisks (p<0.05). Error bars indicate SEM.
-
Figure 4—figure supplement 1—source data 1
Excel file providing the numerical source data to Figure 4—figure supplement 1.
- https://cdn.elifesciences.org/articles/99358/elife-99358-fig4-figsupp1-data1-v1.xlsx
Figure 5 with 3 supplements
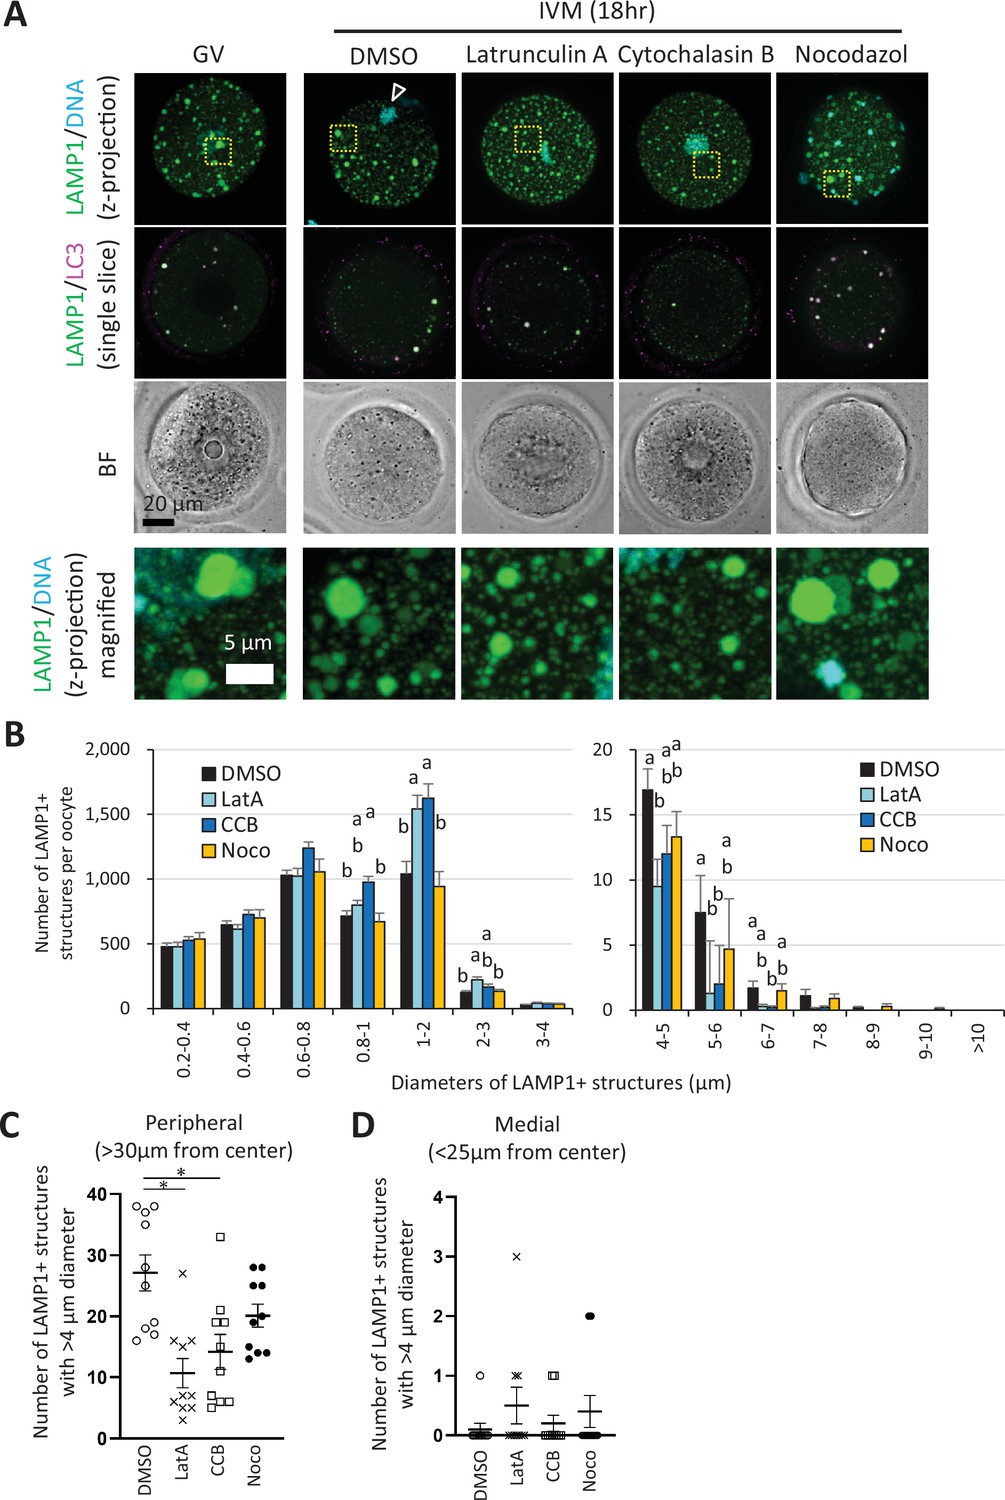
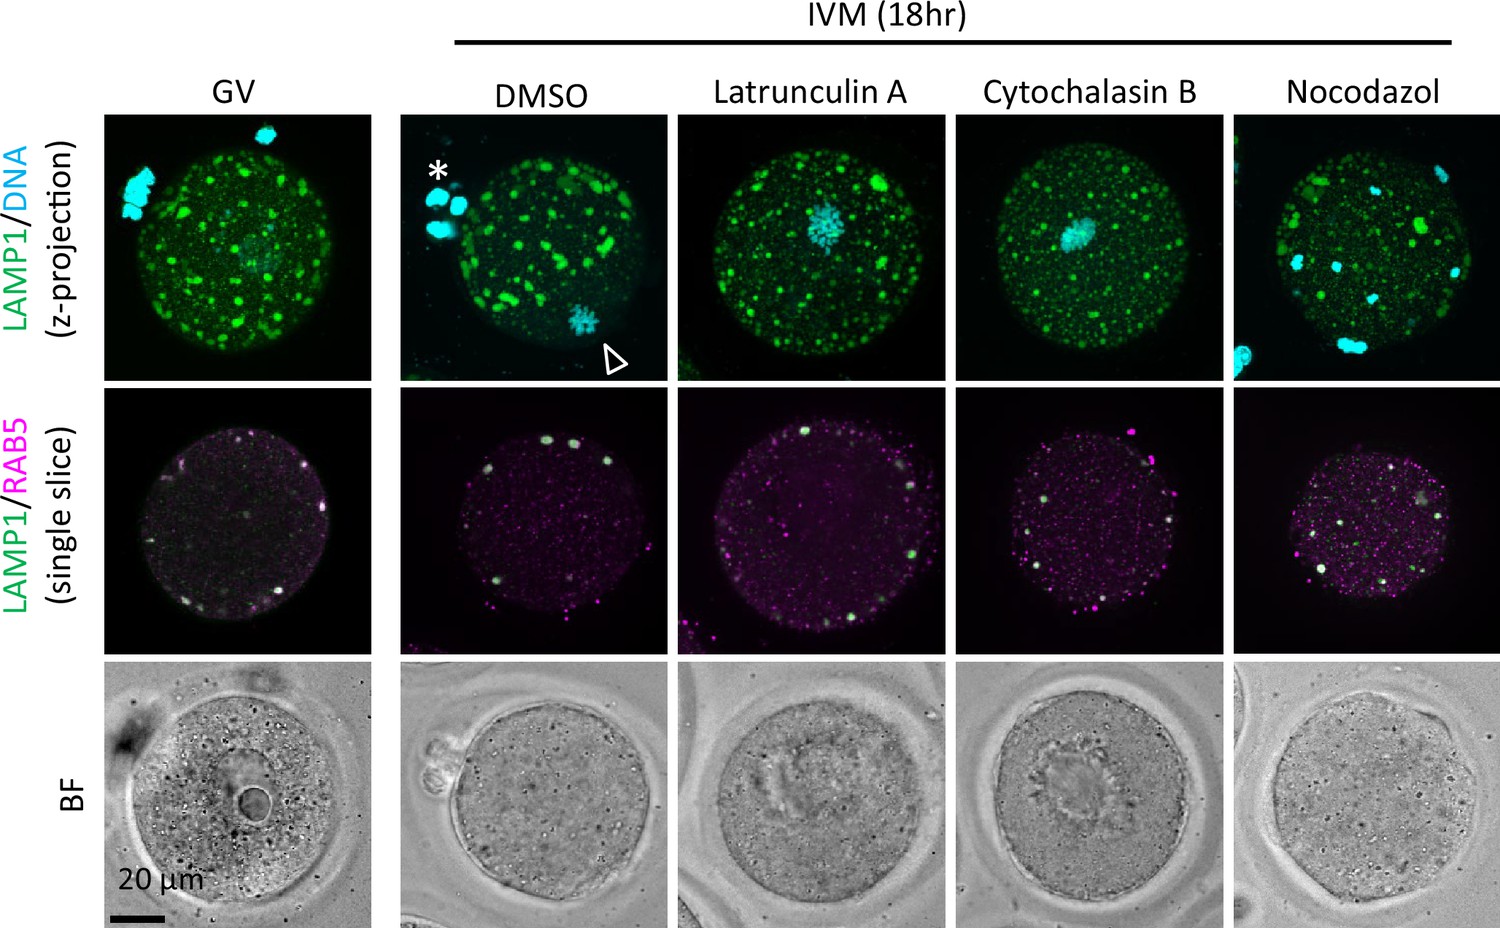
Enlargement of endosomal-lysosomal organellar assembly (ELYSA) and its redistribution to the cell periphery occur in an actin cytoskeleton-dependent manner.
Germinal vesicle (GV) oocytes were incubated for in vitro maturation (IVM) for 18 hr with or without actin polymerization inhibitors (10 μM latrunculin A or cytochalasin B) or a tubulin inhibitor (20 μM nocodazole), then fixed and co-stained with anti-LC3 and anti-LAMP1 antibodies. The reconstituted objects for LAMP1-positive organelles in 10 oocytes for each treatment from more than three independent experiments were analyzed for the number, size, and distribution. (A) Maximum intensity projection of confocal images at an axial scan range of 80 µm is shown as Z-projection images. DNA was stained with Hoechst 33342. Arrowheads indicate the metaphase plate. (B) Average total LAMP1-positive object number per oocyte after sorting the objects by size (indicated by the diameters of spheres calculated from volumes). (C, D) Numbers of objects with diameters>4 μm in oocytes at a distance of >30 μm or <25 μm from the cellular center. Groups with different letters are significantly different (p<0.05, one-way ANOVA and Tukey’s multiple comparison test). Error bars indicate SEM. Dot plots are indicated with mean ± SEM and asterisks indicate significant difference between two groups.
-
Figure 5—source data 1
Excel file providing the numerical source data to Figure 5 and Figure 5—figure supplement 2.
- https://cdn.elifesciences.org/articles/99358/elife-99358-fig5-data1-v1.xlsx
Figure 5—figure supplement 1
An early endosome marker RAB5 is localized within the endosomal-lysosomal organellar assembly (ELYSA) in the presence of inhibitors for cytoskeletons.
Germinal vesicle (GV) oocytes were incubated for in vitro maturation (IVM) for 18 hr with or without inhibitors of polymerized actin (10 μM latrunculin A or cytochalasin B) or tubulin (20 μM nocodazole), and fixed and co-stained with anti-RAB5 and anti-LAMP1 antibodies. Maximum intensity projection of confocal images at an axial scan range of 80 µm is shown as Z-projection images. Magnified regions are indicated by yellow boxes. DNA was stained with Hoechst 33342. Arrowhead and asterisk indicate the metaphase plate and first polar body, respectively.
Figure 5—figure supplement 2
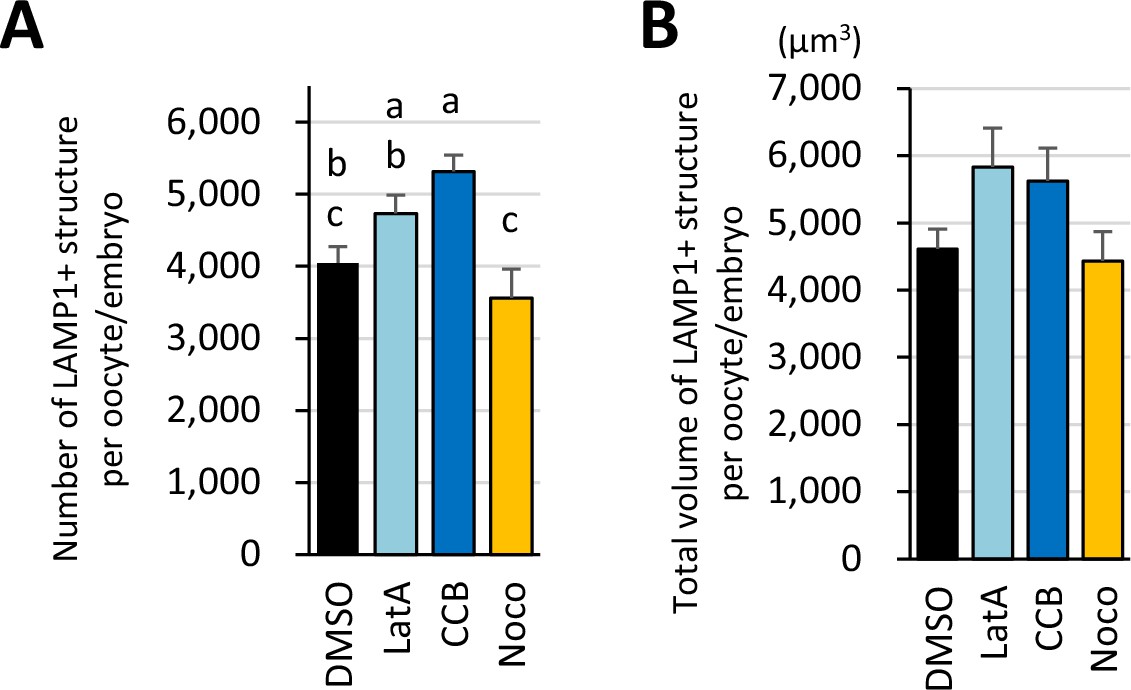
Treatment with inhibitors for cytoskeletons affected the number of LAMP1-positive objects but not their volume.
Germinal vesicle (GV) oocytes were incubated for in vitro maturation (IVM) for 18 hr with or without actin polymerization inhibitors (10 μM latrunculin A or cytochalasin B) or a tubulin inhibitor (20 μM nocodazole), then fixed and co-stained with anti-LC3 and anti-LAMP1 antibodies. The reconstituted objects for LAMP1-positive objects in 10 oocytes for each treatment from more than three independent experiments were analyzed for the number, size, and distribution. (A) Average total object number per oocyte. (B) Total volumes of the objects. Groups with different letters are significantly different (p<0.05, one-way ANOVA and Tukey’s multiple comparison test). Error bars indicate SEM.
Figure 5—video 1
Germinal vesicle (GV) oocytes were injected with the mixture mRNA solution for Lamp1-EGFP and V1A-mCherry, and incubated for in vitro maturation (IVM).
Time-lapse movie of EGFP fluorescence of a representative oocyte is indicated as maximum intensity projection of confocal images with a height of 80 μm. Magnified perinuclear regions in Figure 5 are indicated by a box. The timestamp indicates the time after IVM started.
Figure 6 with 1 supplement
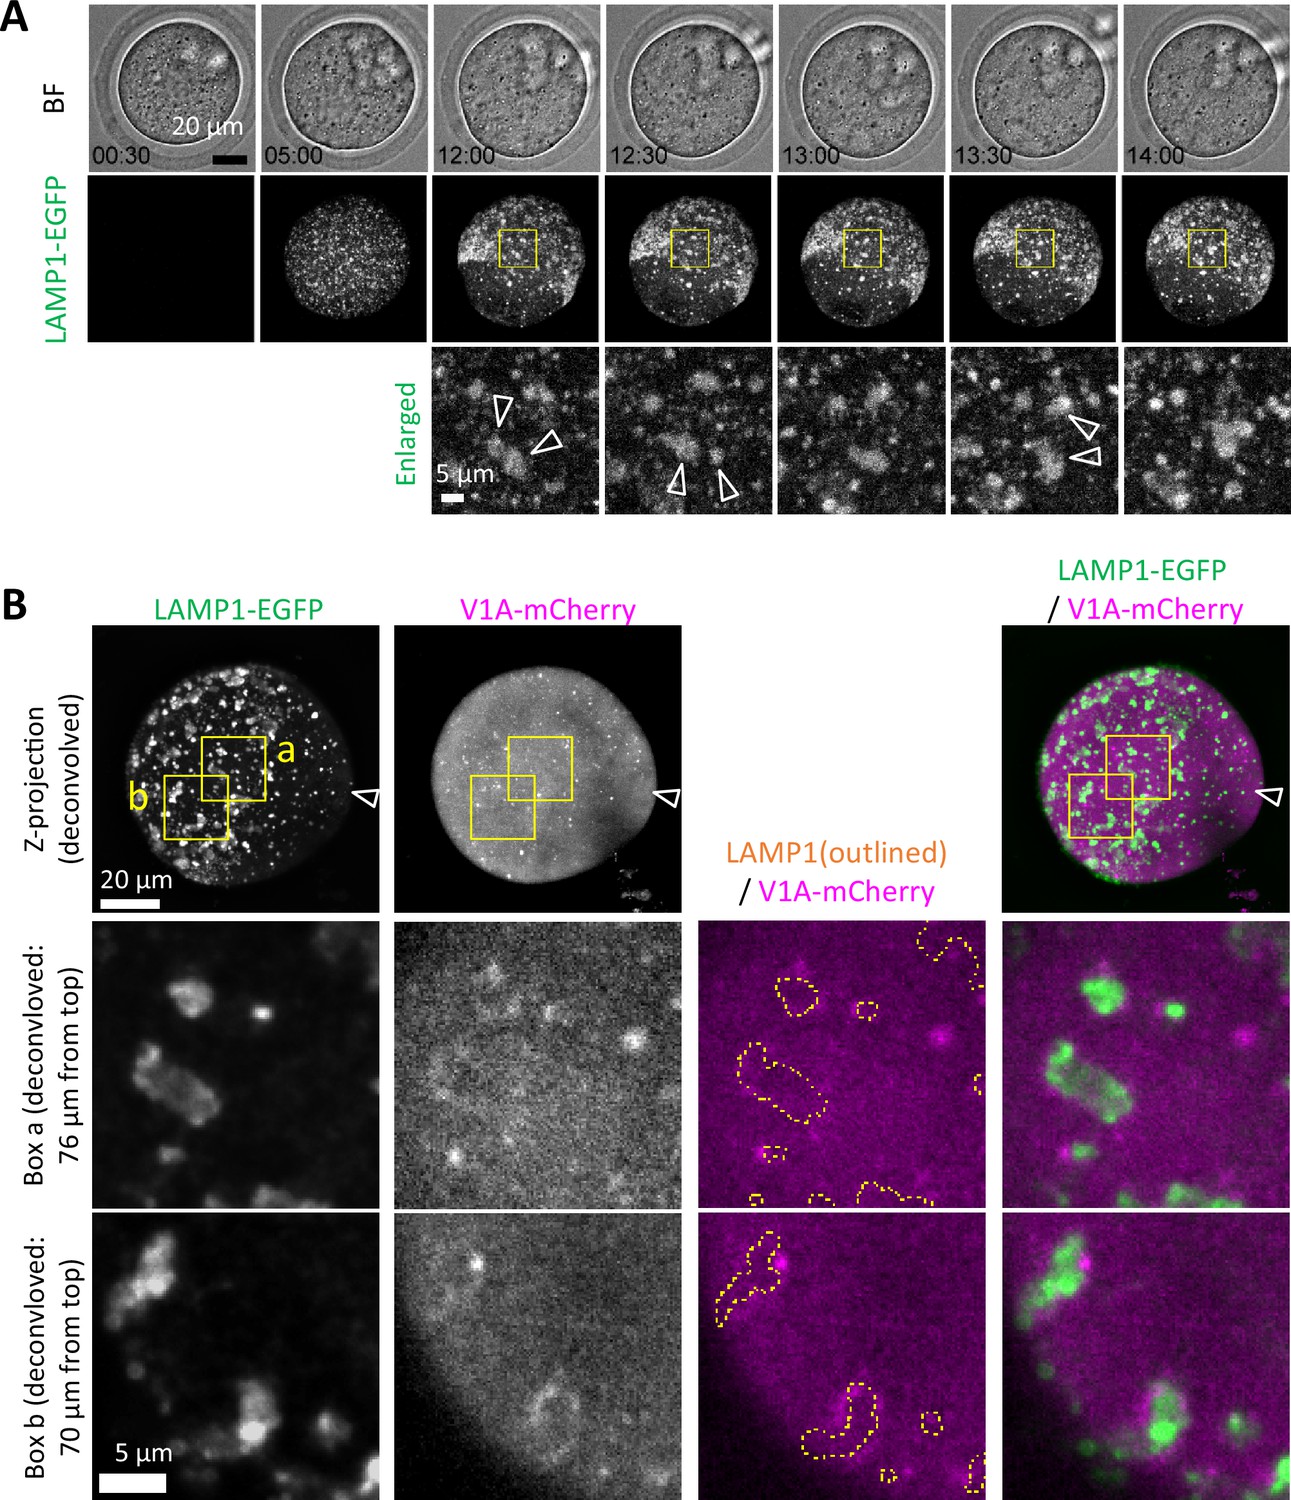
Assembly of endosomal-lysosomal organellar assembly (ELYSA) during migration and limited interaction with the acidification machinery.
(A) Snapshots of a time-lapse observation for EGFP fluorescence of germinal vesicle (GV) oocytes injected with Lamp1-EGFP and V1A-mCherry mRNA are indicated. Maximum intensity projection of confocal images with a height of 40 μm (bottom half of the oocyte) are shown. Magnified perinuclear regions (right) are indicated by yellow boxes. Arrowheads indicate assemblies that adhere to each other in the subsequent frame. (B) Maximum intensity projection of deconvolved confocal images at an axial scan range of 80 µm is shown as Z-projection images. Magnified regions are indicated by yellow boxes (a, b) and the LAMP1-EGFP organelle regions are indicated by yellow dotted line.
Figure 6—figure supplement 1
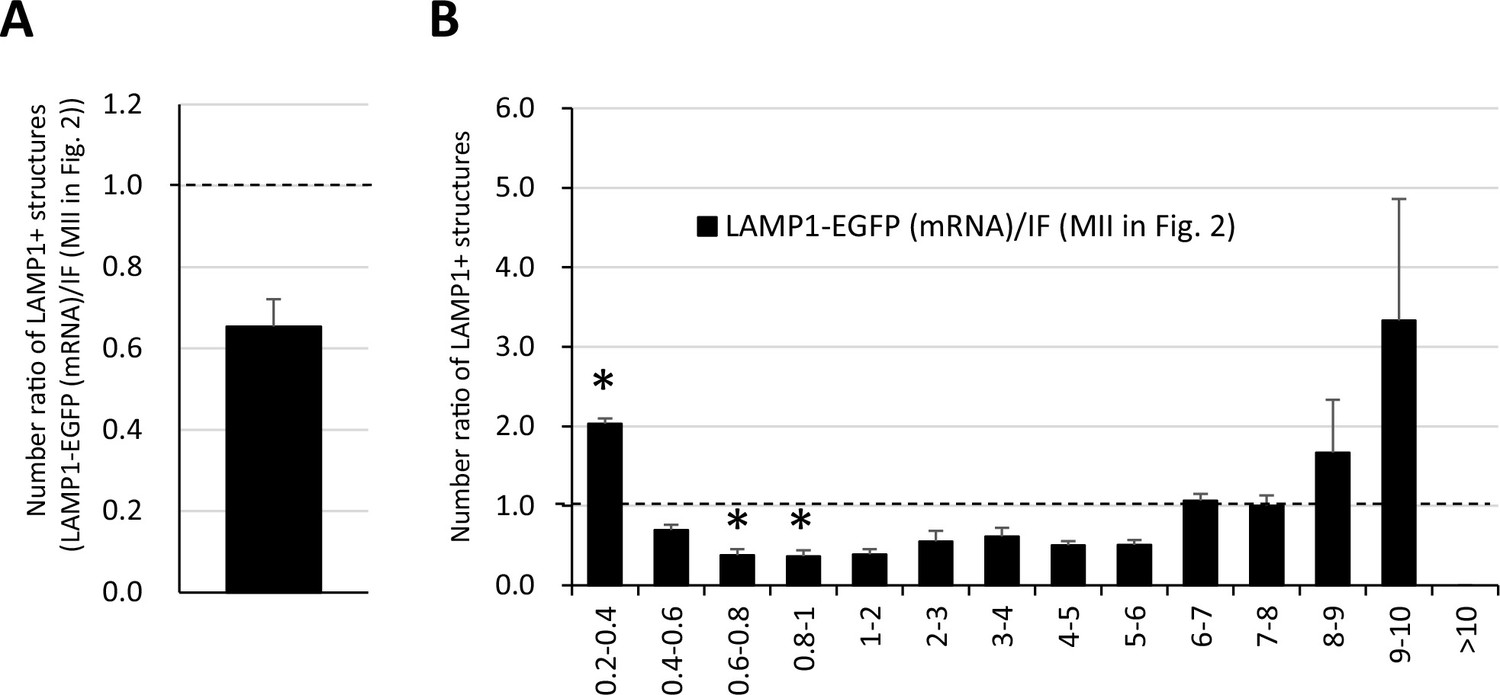
Number and distribution of large LAMP1-EGFP structures do not significantly differ from intrinsic LAMP1 examined with immunofluorescence.
After the in vitro maturation (IVM) for 18 hr, LAMP1-EGFP fluorescence injected as mRNA in the germinal vesicle (GV) stage was compared with intrinsic LAMP1 detected with an anti-LAMP1 antibody. The reconstituted objects for LAMP1-positive structures from three oocytes were compared with those from immunofluorescent analysis in Figure 2 for the number and size. (A) Ratio of average numbers of total LAMP1-positive to that of metaphase II (MII) in Figure 2. (B) Ratios of numbers of total LAMP1-positive structures sorted by size (indicated by the diameters of spheres calculated from volumes). Significance was examined using a two-tailed Student’s t-test, assuming equal variances between groups; the significance is indicated with asterisks (p<0.05). Error bars indicate SEM.
-
Figure 6—figure supplement 1—source data 1
Excel file providing the numerical source data to Figure 6—figure supplement 1.
- https://cdn.elifesciences.org/articles/99358/elife-99358-fig6-figsupp1-data1-v1.xlsx
Figure 7 with 1 supplement
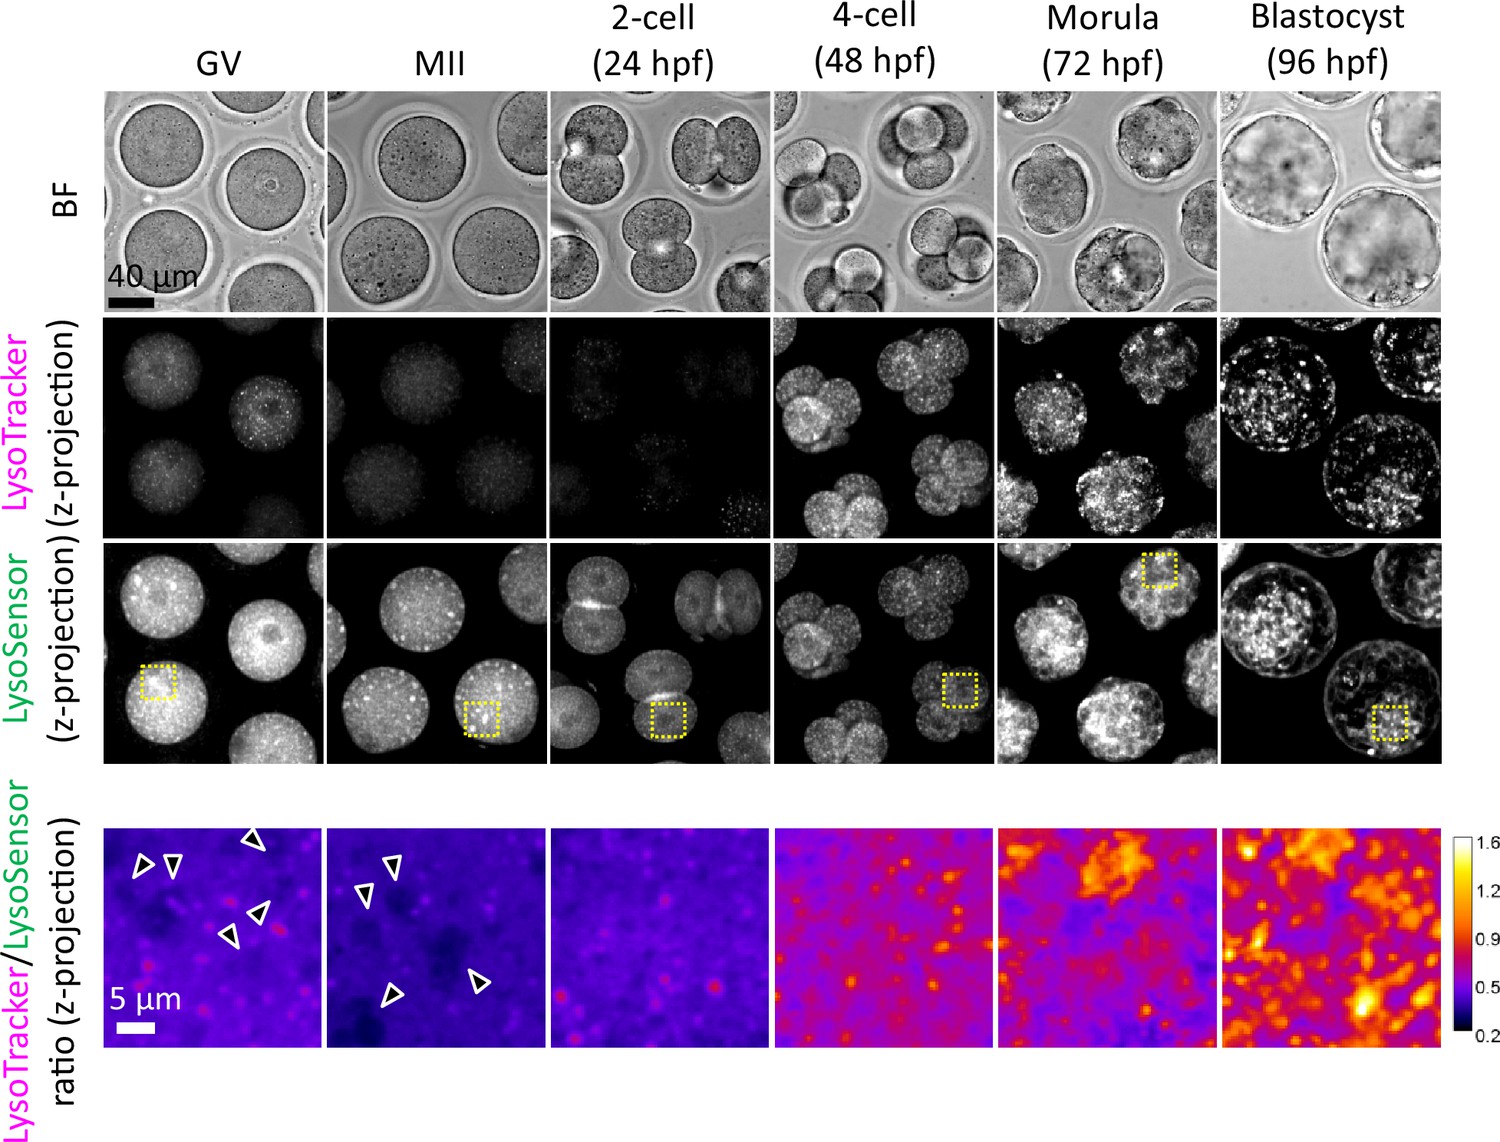
Endosomes and lysosomes in the endosomal-lysosomal organellar assembly (ELYSA) are weakly acidified, but further acidification occurs after the 4-cell stage.
Oocytes and embryos at different stages were stained in the same drop for LysoSensor Green and LysoTracker Red staining analysis, and confocal images were acquired. Averaged intensity projection of confocal images at an axial scan range of 80 µm is shown as Z-projection images. Magnified ratiometric image for LysoTracker/LysoSensor fluorescence of cytosolic regions indicated by yellow boxes are presented as ‘fire’ lookup table images at the bottom. Arrowheads indicate ELYSAs recognized with LysoSensor.
Figure 7—figure supplement 1

LysoTracker-positive punctate structures colocalized with V1A-mCherry.
Embryos were injected with V1A-mCherry mRNA (at 3 hr post-fertilization [hpf]) and cultured with or without bafilomycin A1 and stained with LysoTracker Green at the indicated time points. Maximum intensity projection of confocal images at an axial scan range of 80 µm is shown as Z-projection images.
Figure 8
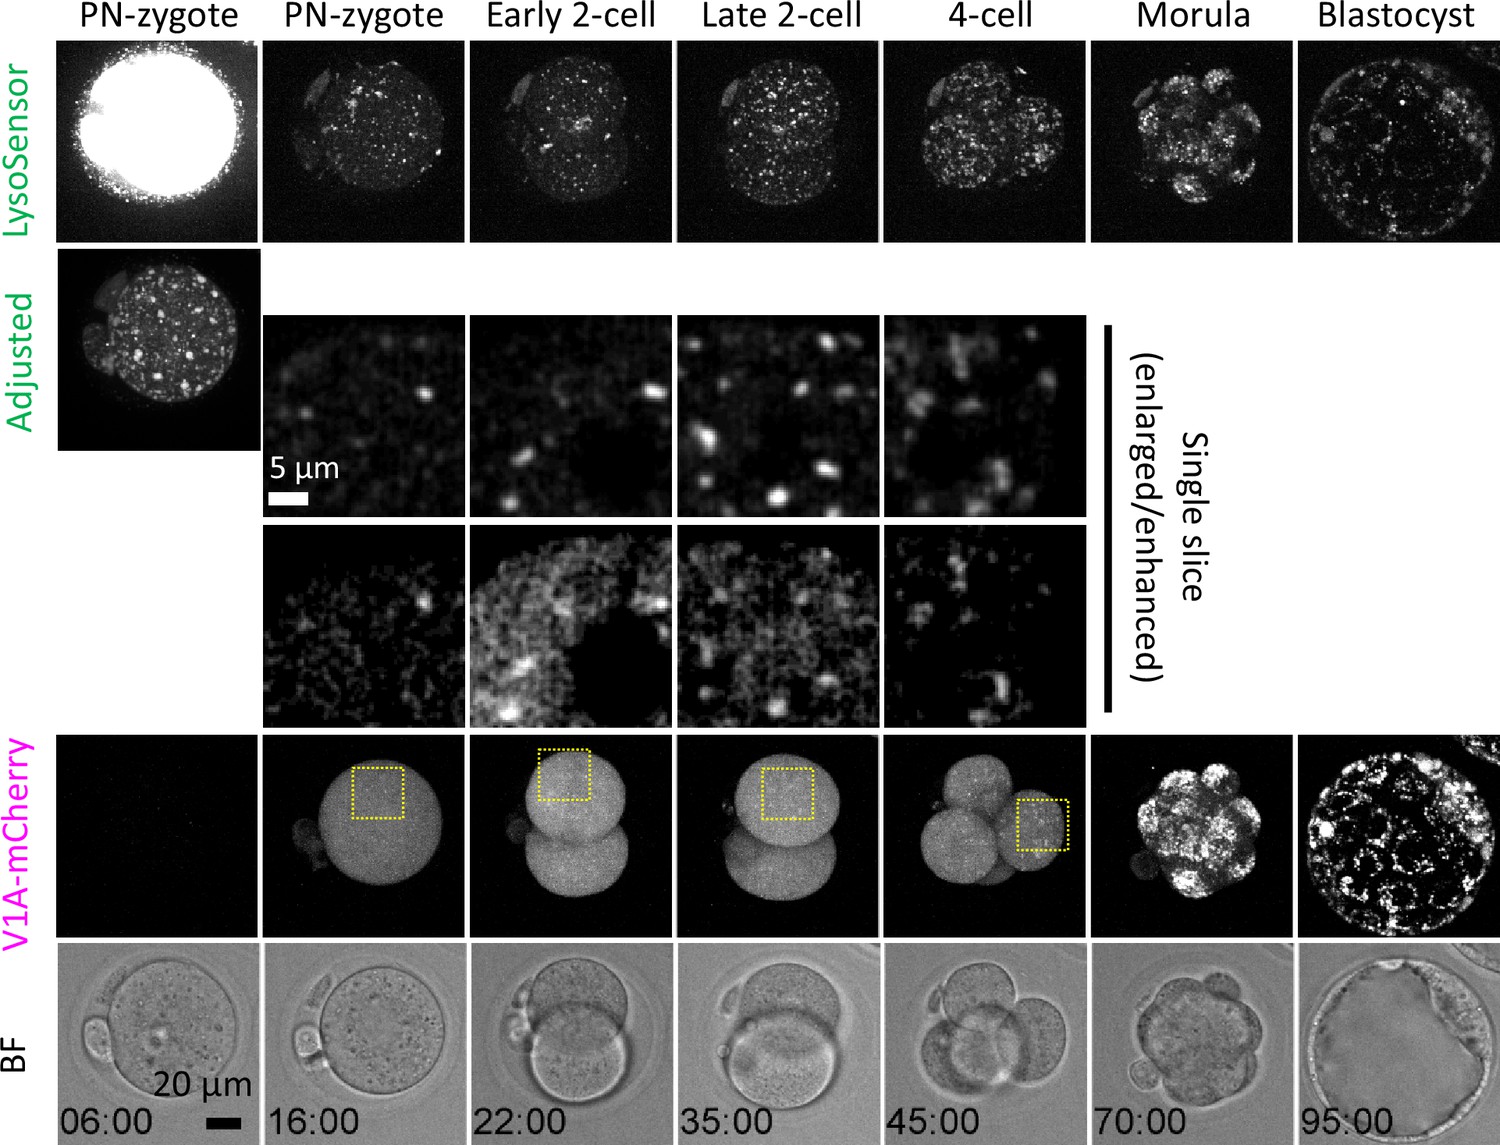
ATP6V1A localization on acidic compartments increases as endosomal-lysosomal organellar assemblies (ELYSAs) are disassembled.
Embryos injected with V1A-mCherry mRNA (at 3 hr post-fertilization [hpf]) were incubated to the blastocyst stage in the presence of LysoSensor Green. Snapshots of a time-lapse observation of a representative embryo are shown as maximum intensity projection of confocal images with a height of 80 μm unless otherwise specified. Magnified perinuclear regions are indicated by yellow boxes.
Figure 9 with 1 supplement
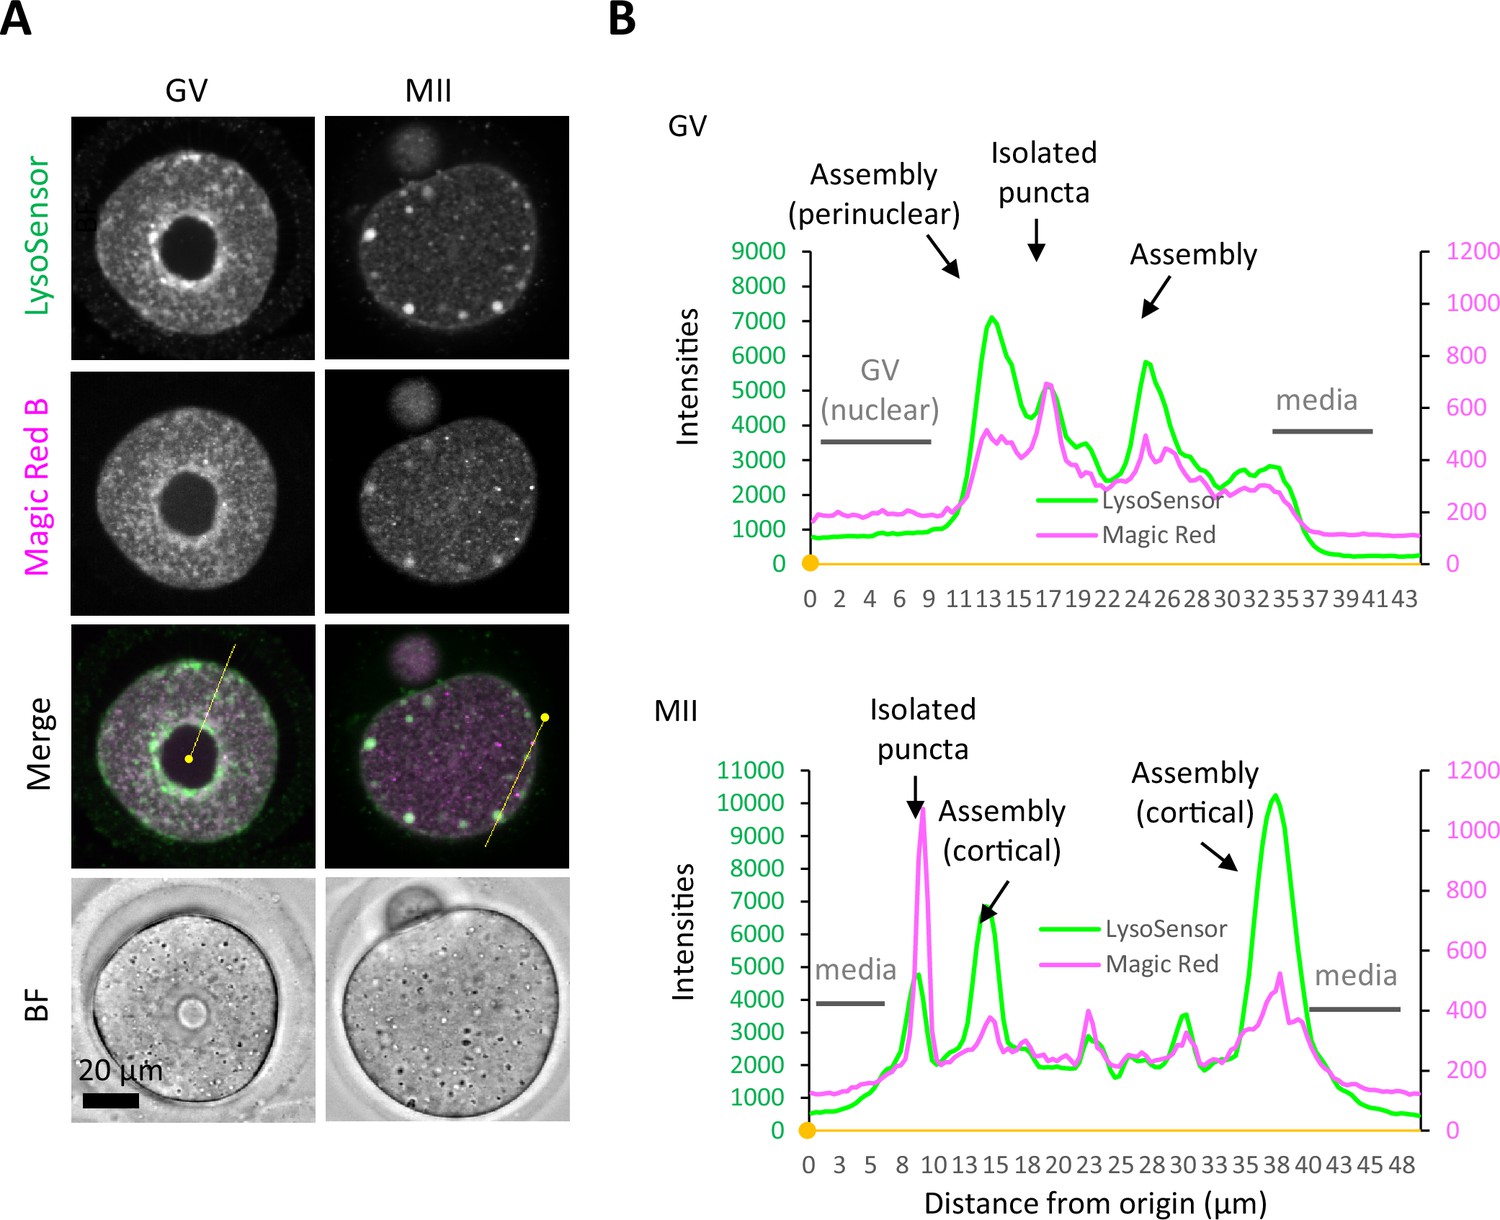
Proteolytic activity of cathepsin B is maintained at a relatively low level in the endosomal-lysosomal organellar assembly (ELYSA).
(A) Germinal vesicle (GV) and metaphase II (MII) oocytes were stained in the same drop for LysoSensor Green and Magic Red Cathepsin B staining analysis, and confocal images were acquired. (B) Fluorescent intensities of LysoSensor and Magic Red on the yellow lines indicated in (A) are indicated by a line plot. Small, filled dots indicate the origin (0 μm) in distance.
-
Figure 9—source data 1
Excel file providing the numerical source data to Figure 9 and Figure 9—figure supplement 1.
- https://cdn.elifesciences.org/articles/99358/elife-99358-fig9-data1-v1.xlsx
Figure 9—figure supplement 1
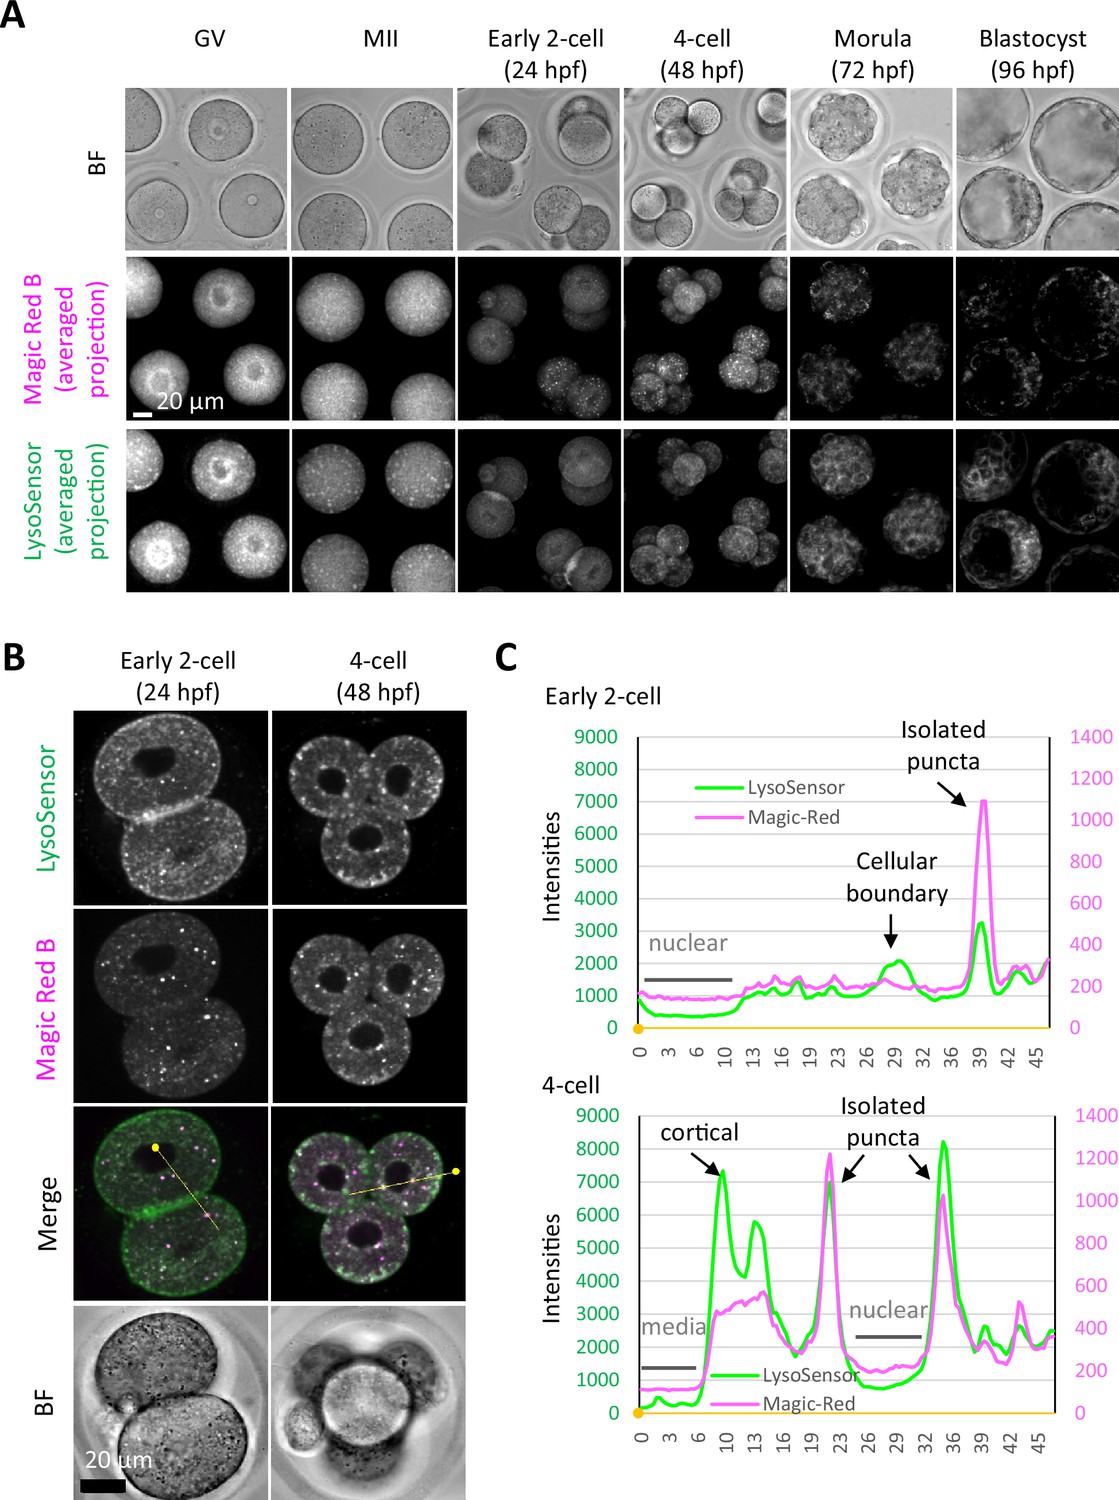
Magic Red Cathepsin B staining in germinal vesicle (GV) and metaphase II (MII) oocytes showed higher cytoplasmic signals but similar intensity in isolated punctate structures to developing embryos.
Oocytes and embryos at the indicated stages were collected and stained with Magic Red Cathepsin B solution in the same drop of medium. (A) Averaged intensity projection of confocal images at an axial scan range of 80 µm is shown as Z-projection images. (B) Early 2-cell and 4-cell embryos were stained in the same drop for LysoSensor Green and Magic Red Cathepsin B staining analysis, and confocal images were acquired. (C) Fluorescent intensities of LysoSensor and Magic Red on the yellow lines indicated in (B) are indicated by a line plot. Small, filled dots indicate the origin (0 μm) in distance.
Videos
Video 1
Metaphase II (MII) oocytes were fixed and co-stained with anti-RAB5 and anti-LAMP1 antibodies.
A series of the confocal images with a height of 80 μm is shown from top to bottom.
Video 2
A series of continuous toluidine blue-stained light microscopic images of the same oocyte (top half) reconstructed to three dimensions (3D).
Chromosomes in the images obtained were segmented blue, toluidine blue-positive structures were segmented yellow, and oocyte plasma membrane (PM) was segmented white.
Video 3
Germinal vesicle (GV) oocytes were injected with V1A-mCherry mRNA and incubated for 18 hr for in vitro maturation (IVM) in the presence of LysoSensor green.
Fluorescent images of a representative oocyte which matured to metaphase II (MII) stage are presented. A series of the confocal images of 81 slices with a height of 80 μm is shown from top to bottom.
Video 4
Embryos were injected with V1A-mCherry mRNA at 3 hr post-fertilization (hpf) and incubated for further embryogenesis in the presence of LysoSensor Green during embryonic development.
A time-lapse movie of a representative embryo is shown (maximum intensity projection of confocal images at a height of 80 μm).
Additional files
Download links
A two-part list of links to download the article, or parts of the article, in various formats.
Downloads (link to download the article as PDF)
Open citations (links to open the citations from this article in various online reference manager services)
Cite this article (links to download the citations from this article in formats compatible with various reference manager tools)
Endosomal-lysosomal organellar assembly (ELYSA) structures coordinate lysosomal degradation systems through mammalian oocyte-to-embryo transition
eLife 13:RP99358.
https://doi.org/10.7554/eLife.99358.3


