Loss of Frataxin induces iron toxicity, sphingolipid synthesis, and Pdk1/Mef2 activation, leading to neurodegeneration
- Baylor College of Medicine, United States
- Howard Hughes Medical Institute, Baylor College of Medicine, United States
- Texas Children’s Hospital, United States
Abstract
Mutations in Frataxin (FXN) cause Friedreich’s ataxia (FRDA), a recessive neurodegenerative disorder. Previous studies have proposed that loss of FXN causes mitochondrial dysfunction, which triggers elevated reactive oxygen species (ROS) and leads to the demise of neurons. Here we describe a ROS independent mechanism that contributes to neurodegeneration in fly FXN mutants. We show that loss of frataxin homolog (fh) in Drosophila leads to iron toxicity, which in turn induces sphingolipid synthesis and ectopically activates 3-phosphoinositide dependent protein kinase-1 (Pdk1) and myocyte enhancer factor-2 (Mef2). Dampening iron toxicity, inhibiting sphingolipid synthesis by Myriocin, or reducing Pdk1 or Mef2 levels, all effectively suppress neurodegeneration in fh mutants. Moreover, increasing dihydrosphingosine activates Mef2 activity through PDK1 in mammalian neuronal cell line suggesting that the mechanisms are evolutionarily conserved. Our results indicate that an iron/sphingolipid/Pdk1/Mef2 pathway may play a role in FRDA.
https://doi.org/10.7554/eLife.16043.001eLife digest
Friedreich’s ataxia is a disorder in which nerve cells in the spinal cord, cerebellum and dorsal root ganglia progressively die as a person ages. People with this disorder often have difficulties with walking and can eventually develop other problems such as heart disease and diabetes. Mutations in a gene called Frataxin, known as FXN for short, are the primary cause of the disorder.
The FXN gene encodes a protein normally found in mitochondria – the structures that are best known for providing energy inside cells. Previous studies suggest that mutations in the FXN gene prevent mitochondria from working normally, which triggers the production of toxic chemicals called reactive oxygen species. However, therapies based on antioxidants (which combat reactive oxygen species) only have limited benefits in patients with Friedreich’s ataxia; this suggests that other mechanisms contribute to the progression of the disease. Mutations in the FXN gene also cause iron to accumulate inside cells, which can be toxic too. However, it remains hotly debated whether or not iron toxicity contributes to Friedreich’s ataxia.
Chen et al. set out to identify other mechanisms that can explain the loss of nerve cells seen in Friedreich’s ataxia using fruit flies as an experimental system. Flies without the equivalent of FXN gene accumulated iron in their nervous systems and other tissues, but did not produce more reactive oxygen species. The experiments also revealed that this build-up of iron increased the production of fatty molecules (called sphingolipids), which in turn triggered the activation of two proteins (called Pdk1 and Mef2). Chen et al. then showed that blocking any of these effects could effectively delay the death of nerve cells in the mutant flies. Further experiments showed that boosting the levels of the Mef2 protein in the nerve cells of otherwise normal flies was enough to cause these cells to die.
The next step is to see whether the pathway also operates in mice and humans. Future studies could also see if dampening down this pathway could provide new treatments for Friedreich’s ataxia.
https://doi.org/10.7554/eLife.16043.002Introduction
FRDA, an inherited recessive ataxia, is caused by mutations in FXN (Campuzano et al., 1996). During childhood or early adulthood, FRDA patients show a progressive neurodegeneration of dorsal root ganglia, sensory peripheral nerves, corticospinal tracts, and dentate nuclei of the cerebellum (Koeppen, 2011). FXN is evolutionarily conserved and the homologs have been identified in most phyla (Bencze et al., 2006; Campuzano et al., 1996). It encodes a mitochondrial protein that is required for iron-sulfur cluster assembly (Layer et al., 2006; Lill, 2009; Muhlenhoff et al., 2002; Rotig et al., 1997; Yoon and Cowan, 2003). Once synthesized, iron-sulfur clusters are incorporated into a variety of metalloproteins, including proteins of the mitochondrial electron transport chain (ETC) complexes and aconitase, where they function as electron carriers, enzyme catalysts, or regulators of gene expression (Lill, 2009). It has been proposed that loss of FXN leads to impaired ETC complex, which in turn triggers ROS production that directly contributes to cellular toxicity (Al-Mahdawi et al., 2006; Anderson et al., 2008; Calabrese et al., 2005; Schulz et al., 2000). However, the ROS hypothesis has been questioned in several studies. For example, loss of FXN only leads to a modest hypersensitivity to oxidative stress (Macevilly and Muller, 1997; Seznec et al., 2005; Shidara and Hollenbeck, 2010). In addition, several clinical trails based on antioxidant therapy in FRDA patients have shown no or limited benefits (Lynch et al., 2010; Parkinson et al., 2013; Santhera Pharmaceuticals, 2010).
Loss of yeast frataxin homolog results in iron accumulation (Babcock et al., 1997), and this phenotype has also been reported in cardiac muscles of a Fxn deficiency mouse and FRDA patients (Koeppen, 2011; Lamarche et al., 1980; Michael et al., 2006; Puccio et al., 2001). However, whether iron accumulates in the nervous system upon loss of FXN remains controversial. Furthermore, whether iron deposits contribute to the pathogenesis is not clear. It has been reported that elevated iron levels were observed in the dentate nuclei or in glia cells of FRDA patients (Boddaert et al., 2007; Koeppen et al., 2012). Contrary to these results, others suggested that there is no increase of iron in the nervous system of Fxn deficiency mice and FRDA patients (Koeppen et al., 2007; Puccio et al., 2001; Solbach et al., 2014). Taken together, current data provide insufficient evidence to establish that iron dysregulation contributes to neurodegeneration. In addition, the mechanism underlying iron toxicity is still unclear. In summary, the pathological interplay of mitochondrial dysfunction, ROS, and iron accumulation remains to be established.
We identified the first mutant allele of fh in an unbiased forward genetic screen aimed at isolating mutations that cause neurodegenerative phenotypes. We show that loss of fh causes an age dependent neurodegeneration in photoreceptors and affects mitochondrial function. Unlike other mitochondrial mutants with impaired ETC activity, we do not observe an increase in ROS. However, loss of fh causes an iron accumulation in the nervous system, induces an up-regulation of sphingolipid synthesis, and activation of Pdk1 and Mef2. Reducing iron toxicity or inhibiting the sphingolipid/Pdk1/Mef2 pathway significantly suppresses neurodegeneration in fh mutants. To our knowledge, this is the first evidence that sphingolipids, Pdk1, and the transcription factor Mef2 are shown to play a primary role in FXN-induced neurodegeneration.
Results
fh mutants display an age dependent neurodegeneration of photoreceptors
We identified the first EMS (ethyl methanesulfonate) induced missense mutation in fh, the Drosophila homolog of FXN, through a forward genetic screen on the X chromosome (Figure 1—figure supplement 1A) (Haelterman et al., 2014; Yamamoto et al., 2014). The molecular lesion, S136R, is in a highly conserved region, which is required for the FXN binding to the iron-sulfur cluster assembly complex (Tsai et al., 2011). In addition, six point mutations adjacent to S136 (S157 in human) have been reported in FRDA patients (Figure 1—figure supplement 1B) (Santos et al., 2010). Hemizygous fh mutants are L3 to pupal lethal, and the lethality is not enhanced in transheterozygous mutants that carry a deficiency (fh/Df (1)BSC537), suggesting that S136R is a severe loss-of-function (Figure 1—figure supplement 1C). The lethality of fh can be rescued by a genomic fh construct (gfh), or by ubiquitous expression (da-GAL4 driver) of fh cDNA using the UAS/GAL4 system (Brand and Perrimon, 1993) (Figure 1—figure supplement 1C). The lethality cannot be rescued with tissue specific drivers, including neuronal (nSyb-GAL4), muscular (Mef2-GAL4), or glial (repo-GAL4) drivers, suggesting a requirement for fh in multiple tissues (Figure 1—figure supplement 1C). In addition, fh mutants exhibit a smaller body size and prolonged larval stages (10 to 12 days instead of 5 days for wild type animals), similar to other mitochondrial mutants (Sandoval et al., 2014; Zhang et al., 2013). Interestingly, removal of maternal wild type fh mRNA or protein in the egg exacerbates the lethal phase from pupal to embryonic lethality (Figure 1—figure supplement 1C). In essence, the residual maternally deposited wild type Fh not only extends the lifespan but also creates a partial loss of Fh condition in the fh mutants.
To bypass pupal lethality of fh mutants, mosaic mutant clones of adult photoreceptor neurons were generated with the eyeless-FLP/FRT system. As a functional readout, we recorded and compared electroretinograms (ERGs) in young and aged flies. In response to a light stimulus, the ERG amplitudes of newly eclosed fh mutants (Day 1) are ~60% of control animals (y,w,FRT19Aiso, the isogenized flies used in the screen) (Figure 1A). The ERG amplitudes rapidly decline over a six day period (Figure 1A). Morphologically, the fh mutant clones contain a normal number of photoreceptors with a typical trapezoidal organization at Day 1 (Figure 1B). However, by using transmission electron microscopy (TEM), we found that Day 1 fh mutant photoreceptors exhibit an expansion of the endoplasmic reticulum (ER) and a dramatic accumulation of lipid droplets in glial cells that are not observed in controls (Figure 1—figure supplement 2A and B). At Day 3, photoreceptors in mutant clones exhibit aberrant elongated rhabdomeres (Figure 1B). By Day 6, many of the photoreceptors are missing in the mutant clones, whereas control retinas exhibit intact morphology (Figure 1B and Figure 1—figure supplement 2C). These data show that the mutant photoreceptors undergo a rapid and severe functional as well as morphological degeneration.
Figure 1 with 2 supplements see all
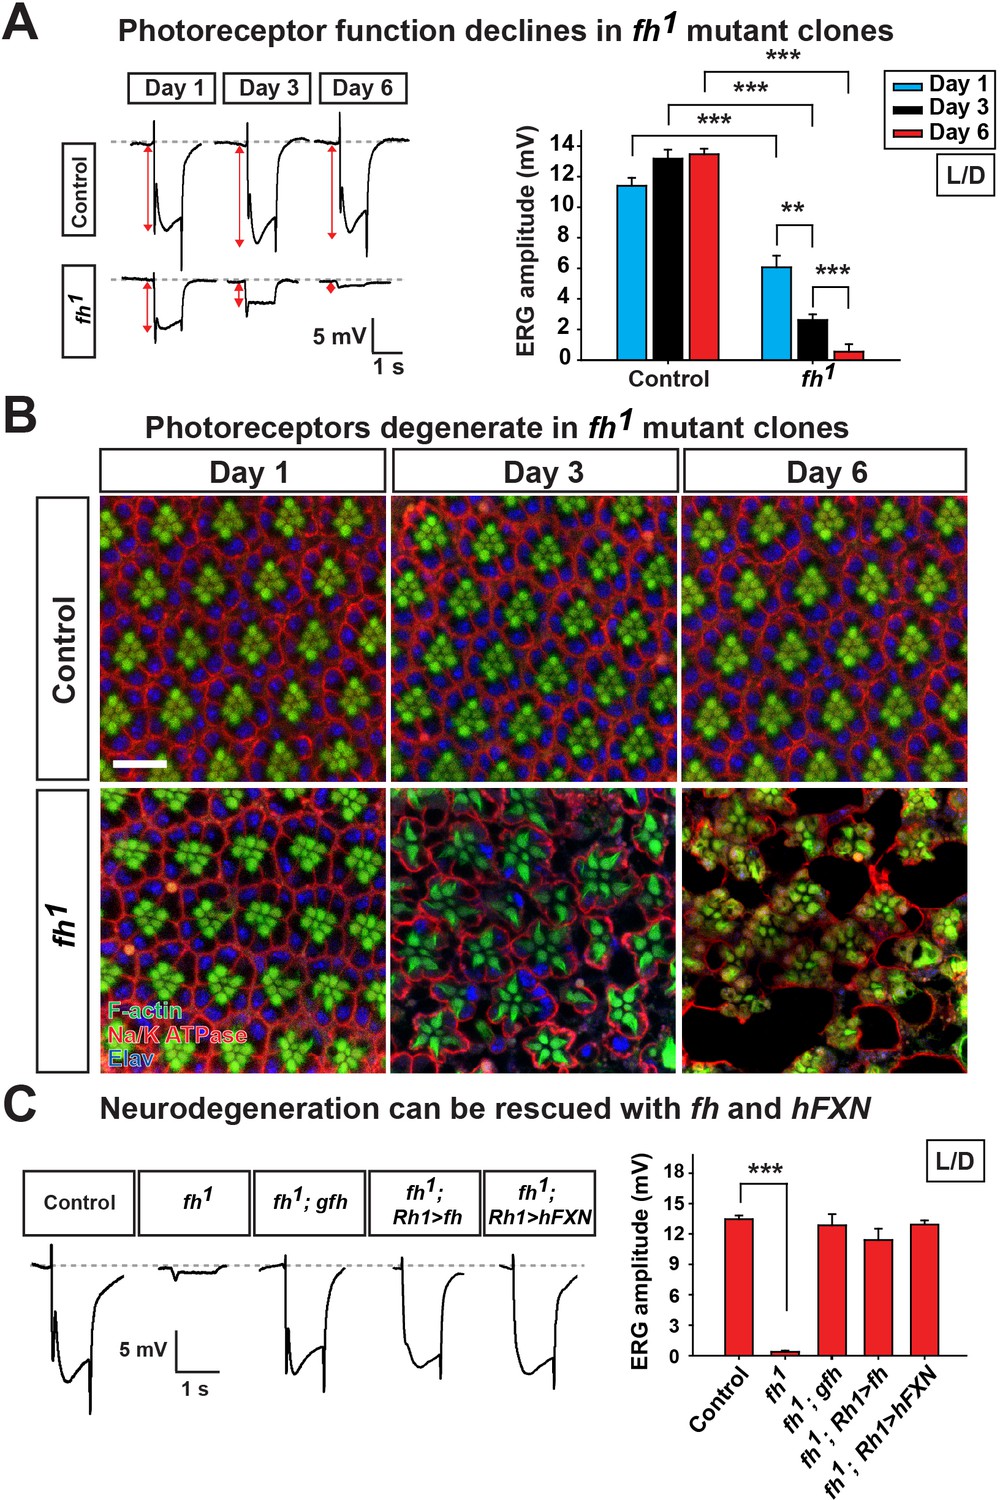
Loss of fh results in age dependent neurodegeneration in photoreceptors.
(A) ERG of control (y w FRT19A) and fh (y w fh FRT19A) mosaic eyes. The ERG amplitudes from Day 1 to Day 6 are indicated by red double arrows. Quantification of the ERG amplitudes of control (y w FRT19A) and fh (y w fh FRT19A) is on the right. (B) Retina morphology of control (y w FRT19A) and fh mosaic eyes. Rhabdomeres are labeled by phalloidin (green), whereas anti-Na/K ATPase antibody (red) marks the photoreceptor membranes. Neuronal nuclei are labeled by anti-Elav antibody (blue). Scale bar: 10 µm. (C) ERG of control (y w FRT19A), fh mutants, fh mutants carrying a genomic fh construct (fh; gfh), and fh mutants that express the fh cDNA (fh; Rh1>fh) or human FXN cDNA (fh; Rh1>hFXN) in photoreceptors using a Rh1-GAL4 driver. The ERG amplitudes were recorded at Day 6. Data are presented as mean ± SEM. **p<0.01, ***p<0.001, Student’s t-test. L/D, flies are raised in 12 hr light and dark cycle.
The neurodegeneration can be fully rescued by a genomic fh construct or by expressing fh cDNA in photoreceptors (Figure 1C and Figure 1—figure supplement 2D), suggesting that photoreceptor degeneration is cell-autonomous. Moreover, expression of the human FXN cDNA rescues neurodegeneration in fh mutants (Figure 1C and Figure 1—figure supplement 2D), showing that fly and human FXN have conserved molecular function, and that our studies are relevant to the biological role of human FXN.
Mitochondria are dysfunctional but ROS levels are not altered in fh mutants
FXN has been reported to be localized to mitochondria (Koutnikova et al., 1997). Indeed, Fh colocalizes with mitoGFP in larval motor neuron, and removing the predicted mitochondrial targeting sequence (MTS) of fh cDNA (Fh-∆MTS-V5) leads to a diffused signal in the cytosol (Figure 2—figure supplement 1A). Removal of the MTS leads to a dysfunctional protein as expression of Fh-∆MTS-V5 in the fh mutant clone is not able to rescue the ERG defect (Figure 2—figure supplement 1B).
Loss of fh causes a highly aberrant mitochondrial morphology in one day old adult photoreceptors. The mitochondria in fh mutants are larger and exhibit aberrant cristae and altered inner membrane morphology (Figure 2A and Figure 2—figure supplement 1C). Loss of FXN has been reported to cause various ETC and respiratory defects in different animal models, including yeast, fly, mouse, as well as FRDA patients (Al-Mahdawi et al., 2006; Anderson et al., 2005; Carletti et al., 2014; Koutnikova et al., 1997; Puccio et al., 2001; Rotig et al., 1997; Wilson and Roof, 1997). We find that ETC Complex I (CI) activity is severely reduced in fh mutants when compared to control and genomic rescued animals (Figure 2B). Consistent with this data, the ADP/ATP ratio is increased in fh mutants (Figure 2C), showing that energy production is impaired.
Figure 2 with 2 supplements see all
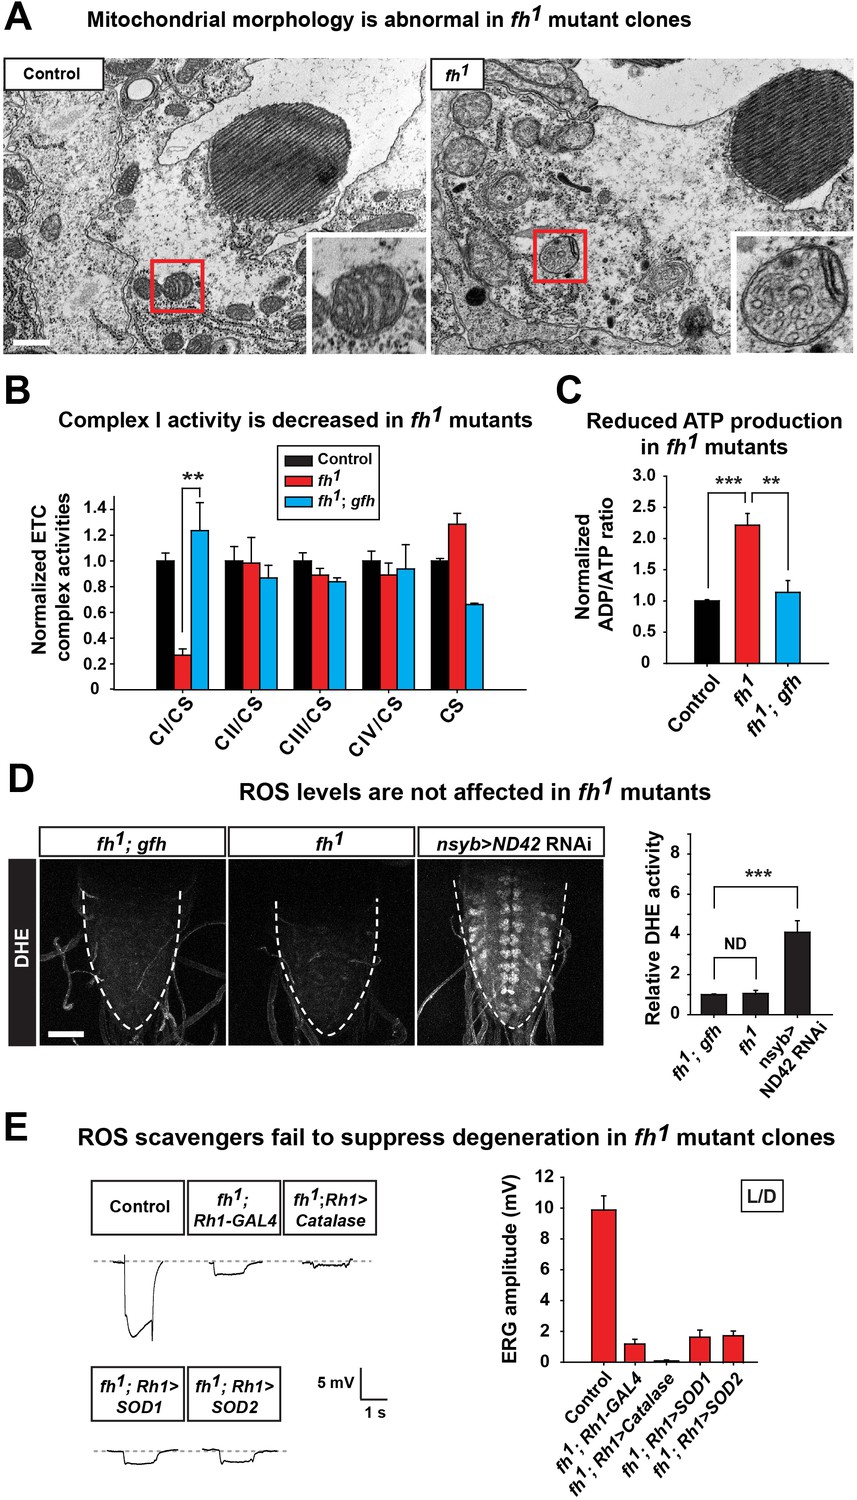
Loss of fh causes impaired mitochondria, and reducing ROS levels fails to suppress degeneration in fh mutants.
(A) TEM images of mitochondria in photoreceptors of control (y w FRT19A) and fh mutant clones. The insets show a single mitochondrion (red box). Scale bar: 500 nm. (B) ETC complex activities in control (y w FRT19A), fh mutant, and genomic rescued animal (fh; gfh). Complex activities are normalized to citrate synthase (CS), which act as a control of mitochondrial mass. n = 3. (C) ADP/ATP ratio in control (y w FRT19A), fh mutant, and rescued animal (fh; gfh). n = 3. (D) ROS levels are measured by DHE in the larval ventral nerve cord. Neuronal down-regulation of ND42 (nSyb>ND42 RNAi), a subunit of CI, acts as a positive control. Quantification of DHE fluorescence is on the right. n = 8. Scale bar: 50 µm. (E) Day 3 ERG of control (y w FRT19A; Rh1-GAL4) and fh mutants in which ROS scavengers are overexpressed in photoreceptors. Data are presented as mean ± SEM. **p<0.01, ***p<0.001, Student’s t-test. ND, no significant difference. L/D, flies are raised in 12 hr light and dark cycle.
It has been reported that expression of yeast Ndi1p, which is a single subunit of NADH dehydrogenase, can mitigate the deleterious effects of an ETC CI deficit in the fly (Vilain et al., 2012). However, overexpression of Ndi1p in fh mutant clones does not suppress neurodegeneration (Figure 2—figure supplement 1D). Impaired ETC CI activity has been linked to increased ROS production that in turn causes cellular stress or toxicity (Sugioka et al., 1988; Turrens and Boveris, 1980). We therefore evaluated ROS production in vivo with dihydroethidium (DHE), a dye that emits fluorescence upon oxidation by ROS. Neuronal down-regulation of ND42 (nSyb>ND42 RNAi), a subunit of CI, was used as a positive control (Owusu-Ansah et al., 2008). As shown in Figure 2D, loss of ND42 exhibits strong DHE fluorescence in the larval ventral nerve cord, indicating elevated levels of ROS. However, DHE levels are not obviously increased in fh mutants, suggesting no or a very mild increase in ROS (Figure 2D).
Elevated ROS levels are proposed to be a major contributor to the pathogenesis in FRDA. To further investigate the role of ROS in photoreceptor degeneration of fh mutants, we overexpressed several ROS scavengers, including Catalase, Super Oxide Dismutase 1 (SOD1), and SOD2, which have all been shown to effectively reduce ROS in flies (Orr and Sohal, 1992; Parkes et al., 1998; Sun et al., 2002). Consistent with the DHE data, overexpression of these ROS scavengers does not suppress neurodegeneration in fh mutants (Figure 2E). Furthermore, feeding fh mutants with AD4, a potent antioxidant that dampens oxidative stress (Amer et al., 2008; Liu et al., 2015), does not suppress neurodegeneration (Figure 2—figure supplement 1E). Taken together, our findings argue that ROS does not contribute to the demise of neurons in fh mutants.
It has been proposed that lipid droplets play a role in the pathogenesis of FRDA as knockdown of fh in flies causes lipid droplet accumulation in glia (Navarro et al., 2010). From TEM and nile red staining, we observed a strong lipid droplet accumulation in glial cells of fh mutant clones (Figure 1—figure supplement 2A and Figure 2—figure supplement 2A). We recently reported that similar phenotype is observed in several mitochondrial mutants and promotes neurodegeneration via a ROS/JNK/SREBP pathway (Liu et al., 2015) (Figure 2—figure supplement 2B). However, we do not observe elevated ROS levels (Figure 2D), and the level of a JNK pathway reporter, puc-lacZ, is not altered in fh mutants (Figure 2—figure supplement 2C). Finally, overexpression of brummer lipase (Bmm) or lipase 4 (lip4), homologs of human Adipose Triglyceride Lipase (ATGL) or acid lipase (Gronke et al., 2005) respectively, effectively reduces the number of lipid droplet but does not delay neurodegeneration of fh mutants (Figure 2—figure supplement 2A), indicating that these lipid droplets do not contribute to neurodegeneration.
Dysfunctional mitochondria cause Rhodopsin1 accumulation in fh mutants
We recently discovered that some mutants that are required for mitochondrial function display an activity dependent degeneration of photoreceptors (Jaiswal et al., 2015). These mitochondrial mutants share several common phenotypes, including reduced ATP production, ERG rundown upon repetitive stimulation, and Rhodopsin1 (Rh1) accumulation in the photoreceptor cytoplasm upon light exposure (Jaiswal et al., 2015). In these mutants, dysfunctional mitochondria cause reduced ATP production and decreased calcium influx, which not only leads to reduced photoreceptor depolarization, but also triggers an internalization of Rh1 leading to an overload of the endolysosomal system upon light stimulation (Jaiswal et al., 2015). The accumulation of Rh1 results in activity dependent degeneration, as the photoreceptors only degenerate when flies are raised in light (light-induced neuronal activity) but not in dark (no neuronal activity) (Alloway et al., 2000; Chinchore et al., 2009; Jaiswal et al., 2015).
Since loss of fh leads to decreased CI activity and reduced energy production (Figure 2B and C), we hypothesized that a similar activity dependent degeneration mechanism contributes to neurodegeneration in fh mutants. To test this hypothesis, we first examined whether ERG traces rundown upon repetitive light stimulation in fh mutant photoreceptors. As shown in Figure 3A, the ERG amplitudes of the first and last traces show a similar size in control animals. In contrast, the ERG amplitude rapidly declines during repetitive light stimulation in fh mutants (Figure 3A), similar to other mitochondrial mutants (Jaiswal et al., 2015). Therefore, we assessed whether Rh1 internalization is affected in fh mutants. Wild type flies exposed to 12 hr of constant light typically exhibit low levels of Rh1 in photoreceptors (Figure 3B). However, in fh mutants, Rh1 accumulates in the cytoplasm of photoreceptors (Figure 3B). Since fh mutant photoreceptors share several features with other mitochondrial mutants, we hypothesized that reducing photoreceptor activity by raising fh mutants in the dark would suppress degeneration. However, fh mutant flies that are raised in the dark still display severe photoreceptor degeneration (Figure 3B). Hence, we propose that in addition to the Rh1 accumulation, another pathogenic mechanism must contribute to neurodegeneration and mask the rescue effect when flies are raised in dark.
Figure 3 with 1 supplement see all
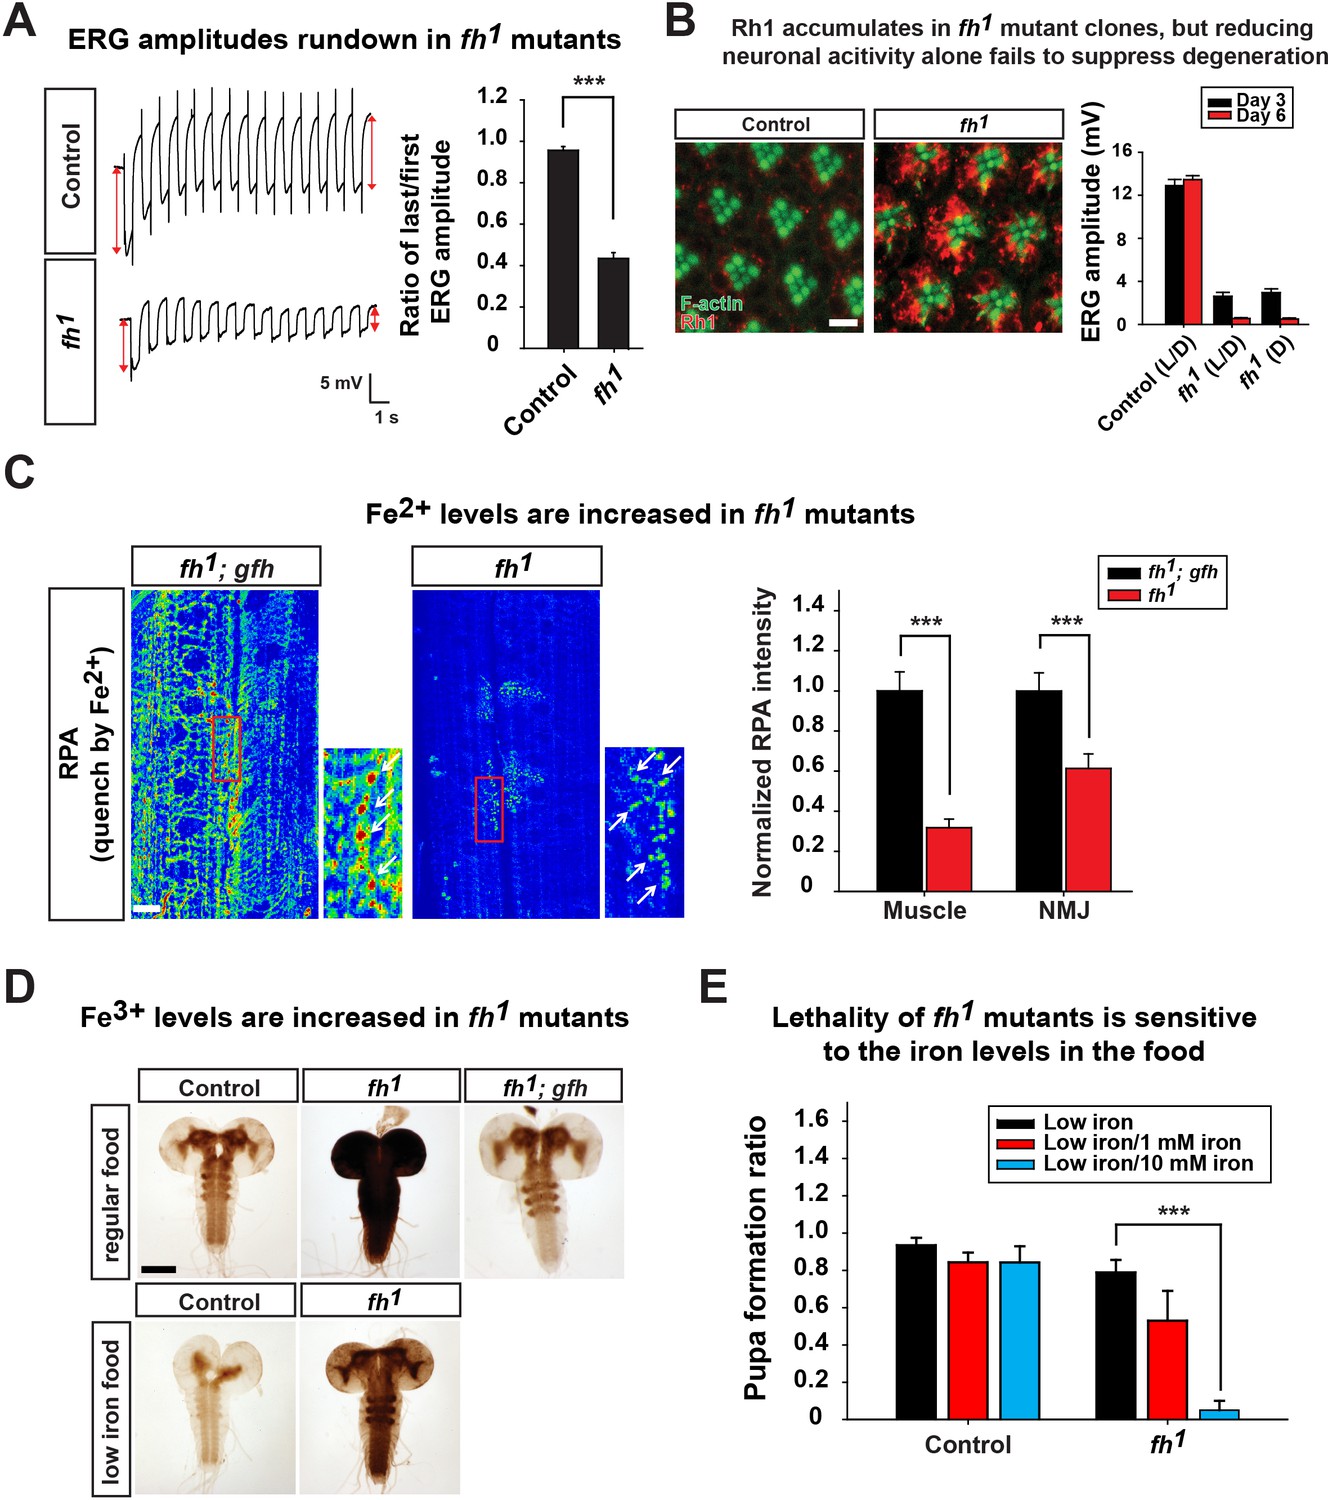
Loss of fh causes Rh1 accumulation and iron deposit.
(A) ERG traces upon repetitive light stimulation in both control (y w FRT19A) and fh mutants. The double red arrows indicate ERG amplitudes of the first and last trace during the stimulation. Quantification of the ratio of last/first ERG amplitude is on the right. (B) Rh1 distribution in control (y w FRT19A) and fh mutant clones after a 12 hr light exposure. Rh1 is labeled in red, and rhabdomeres are labeled in green. Scale bar: 5 µm. Quantification of ERG amplitudes of control (y w FRT19A) and fh mutant clones in different light conditions is on the right. L/D, flies are raised in 12 hr light and dark cycle. D, flies are raised in dark. (C) Fe2+ levels are assessed by RPA in larval muscle and NMJ in fh mutants and rescued animals (fh; gfh). RPA fluorescence is represented as a heat map. The NMJ boutons are indicated by white arrows. Quantification of normalized RPA intensity is on the right. n = 8. Scale bar: 20 µm. (D) Larval brain Perls’/DAB staining of control (y w FRT19A), fh mutants, and rescued animals (fh; gfh) with regular food or low iron food conditions. Scale bar: 100 µm. (E) Percent of animals that develop into pupae in control (y w FRT19A) and fh mutants when animals are raised by low iron food with different iron concentration. n = 3. Data are presented as mean ± SEM. ***p<0.001, Student’s t-test.
Iron accumulates in the nervous system of fh mutants
Whether iron accumulates in the nervous system and contributes to the pathogenesis in mice and FRDA patients has remained a topic of debate (Boddaert et al., 2007; Puccio et al., 2001; Solbach et al., 2014). We therefore investigated whether iron is involved in neurodegeneration of fh mutants. To assess if iron homeostasis is affected in fh mutants, we first examined ferrous iron (Fe2+) levels by Rhodamine B-((1,10-phenanthrolin-5-yl)-aminocarbonyl) benzyl ester (RPA). RPA is a cell-permeable fluorescent dye that selectively accumulates in mitochondria, and its fluorescence is stoichiometrically quenched by Fe2+ (Petrat et al., 2002). As RPA poorly crosses the blood brain barrier (data not shown), we performed RPA staining of larval muscles and neuromuscular junctions (NMJ). In fh mutants rescued with the genomic fh, which serves as a negative control, the RPA signal exhibits strong fluorescence (Figure 3C). In contrast, the RPA intensity in fh mutants is dramatically reduced, in both muscle and NMJ boutons, suggesting a strong Fe2+ accumulation in mitochondria (Figure 3C). RPAC (Rhodamine B-((phenanthren-9-yl)-aminocarbonyl) benzyl ester), a dye that is structurally very similar to RPA, is also taken up by mitochondria but is insensitive to Fe2+ mediated fluorescence quenching. Indeed, RPAC fluorescence is not quenched in rescued animals (fh; gfh) and fh mutants (Figure 3—figure supplement 1), suggesting that the decreased fluorescence of RPA in fh mutants is not due to impaired dye uptake.
To investigate whether ferric iron (Fe3+) levels are increased in fh mutants, we performed Perls’ staining and used 3,3'-Diaminobenzidine (DAB) to enhance the signal (Meguro et al., 2007). In control and rescued animals, the DAB signal is most obvious in the neuropil of the ventral nerve cord (Figure 3D), suggesting that Fe3+ is unevenly distributed in the nervous system. In fh mutants, however, the DAB signal is dramatically increased (Figure 3D), indicating that loss of fh leads to a severe accumulation of Fe3+. Increased Fe3+ levels are not only found in the larval brain, but can also be observed in fat body and gut (data not shown). Together, these results indicate that loss of fh leads to both Fe2+ and Fe3+ accumulation in multiple tissues, including the nervous system.
Iron toxicity cause neurodegeneration in fh mutants
To determine if the iron accumulation contributes to neurodegeneration in fh mutant clones, we reduced iron levels in the fly food. Our regular food contains iron-rich molasses. To reduce iron levels, we replaced molasses with sucrose as the main carbohydrate source and refer to this food as 'low iron food'. As shown in Figure 3D, feeding larvae with low iron food reduces iron levels in the brains of both wild type control and fh mutants. In addition, the lethal phase of fh mutants is susceptible to iron levels in the food. In low iron food, 80% of fh mutants develop into pupae, but addition of 10 mM Fe3+ to the low iron food reduces pupation to about 10%, whereas the pupation rate of controls is not affected (Figure 3E). These data indicate that fh mutants are highly sensitive to iron levels. To determine if iron toxicity is underlying the observed neurodegeneration, we fed low iron food to fh mutants and examined photoreceptor degeneration. Treating fh mutants with low iron food improves the ERG defects when compared to regular food condition (Figure 4A), suggesting that iron mediated toxicity contributes to neurodegeneration in fh mutants.
Figure 4 with 1 supplement see all
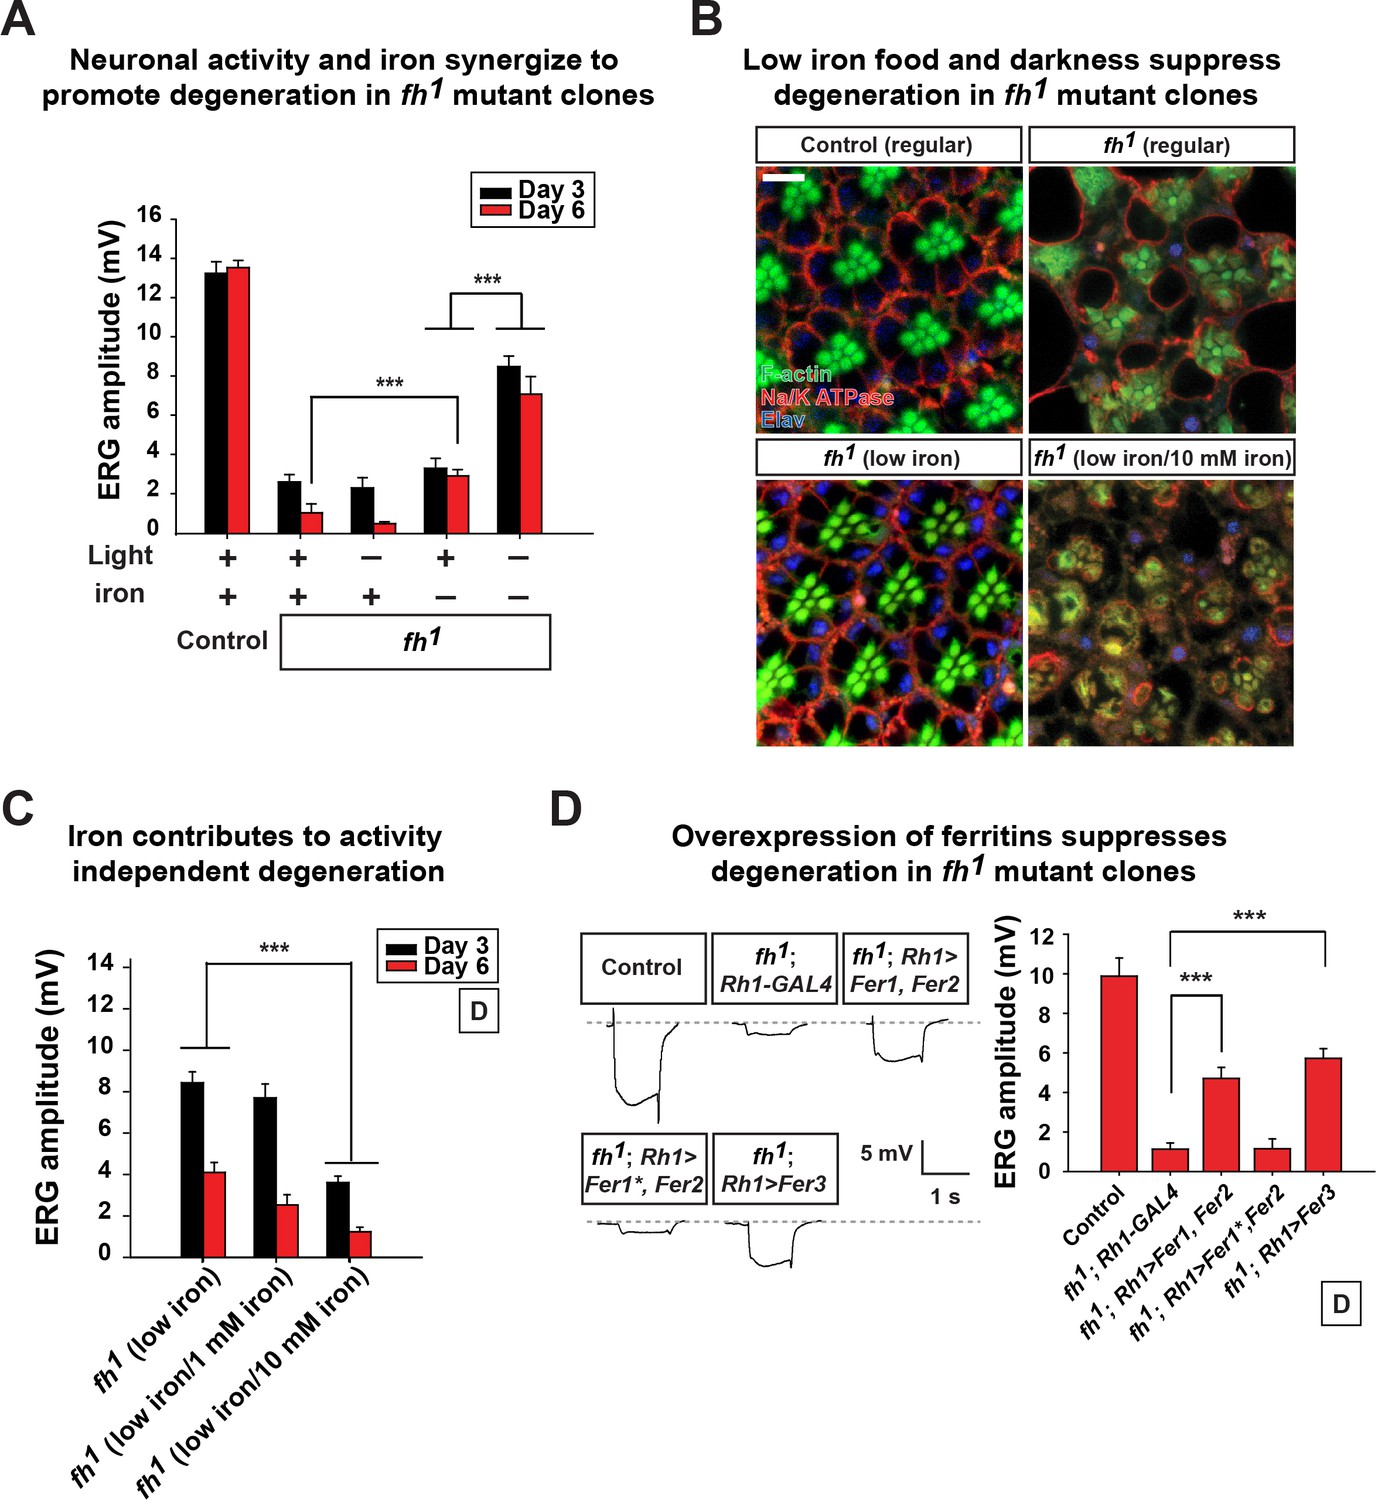
Neuronal activity and iron interact synergistically to contribute to photoreceptor degeneration in fh mutants.
(A) Quantification of ERG amplitudes of control (y w FRT19A) and fh mutants under different light and iron conditions. (B) Retina morphology of control (y w FRT19A) and fh mutants under different food conditions at Day 6. All animals are raised in dark. Regular, flies are raised in regular food. Low iron, flies are raised in low iron food. Scale bar: 5 µm. (C) Quantification of ERG amplitudes of fh mutants in low iron food with different iron concentrations. (D) ERG of control (y w FRT19A; Rh1-GAL4) and fh mutants in which ferritins are overexpressed. Fer1*, enzymatic dead form of Fer1HCH. Data are presented as mean ± SEM. ***p<0.001, Student’s t-test.
Neuronal activity and iron synergize to promote neurodegeneration
We next assessed if excess neuronal activity and iron accumulations act synergistically to promote neurodegeneration in fh mutants. Interestingly, reducing photoreceptor activity (raising flies in dark) and iron (low iron food) leads to a synergistic effect in restoring both photoreceptor function and morphology (Figure 4A and B). To exclude the possibility that changes in other compounds than iron in low iron food suppresses neurodegeneration in fh mutants, we reintroduced iron into the low iron food (low iron/10 mM iron) and found that this treatment again induces rapid degeneration in fh mutant clones even when animals are raised in dark (Figure 4B and C). The ERG amplitudes of the wild type controls are not affected by different iron concentrations in the food (Figure 4—figure supplement 1). These data suggest that iron toxicity contributes to the activity independent degeneration, as photoreceptors degenerate in the absence of neuronal activity. We also tested if feeding 100 mM iron to wild type controls is sufficient to trigger neurodegeneration. This concentration of iron is toxic as most animals die as embryos or young larval instars, and the Fe3+ levels were not increased in the brains (data not shown).
We next explored if genetic manipulations can suppress iron toxicity and neurodegeneration in fh mutants. We expressed Ferritins, the iron storage proteins that chelate and sequester irons. In Drosophila, Ferritin 1 heavy chain homologue (Fer1HCH) and Ferritin 2 light chain homologue (Fer2LCH) form a heteropolymeric complex, whereas Ferritin 3 heavy chain homologue (Fer3HCH) forms a homopolymeric complex to store irons (Missirlis et al., 2006, 2007). In fh mutant clones, co-expression of Fer1HCH and Fer2LCH (fh; Rh1>Fer1, Fer2) or expression of Fer3HCH alone (fh; Rh1>Fer3) significantly suppresses degeneration when flies are raised in dark (Figure 4D). Co-expression of a ferroxidase inactive form of Fer1HCH along with wild type Fer2LCH in fh mutants (fh; Rh1>Fer1*, Fer2) did not rescue degeneration (Figure 4D). These results further confirm that iron toxicity contributes to neurodegeneration in fh mutant clones. In summary, we conclude that excess neuronal activity (activity dependent) and accumulated iron (activity independent) synergize to promote photoreceptor degeneration in fh mutants.
Increased sphingolipid synthesis mediates iron toxicity and causes neurodegeneration
Given that iron accumulates in fh mutants, we investigated the mechanism downstream of iron toxicity. Previous studies proposed that highly active iron interacts with hydrogen peroxide to generate free radicals, the Fenton reaction. However, we did not observe an increase in ROS (Figure 2D), and expression of different ROS scavengers did not suppress degeneration in fh mutants (Figure 2E). It has been previously documented that wild type yeast grow in medium with high iron levels increases sphingolipid synthesis (Lee et al., 2012). However, this phenotype was not documented in the yeast frataxin homolog mutants or FXN mutants in other organisms. As we observed a strong iron accumulation in fh mutants, we hypothesized that iron toxicity induces sphingolipid synthesis and causes neurodegeneration.
To test our hypothesis, we first assessed the de novo synthesis of sphingolipids by mass spectrometry. Consistent to our hypothesis, several upstream metabolic intermediates of sphingolipids are increased in fh mutants (Figure 5A). Strikingly, dihydrosphingosine (dhSph) is increased more than 10 fold in fh mutants. Other sphingolipids, such as dihydroceramide (dhCer) and sphingosine (Sph), are also increased to different levels (Figure 5A). This data suggest that the de novo synthesis of sphingolipids is increased in fh mutants.
Figure 5 with 1 supplement see all

Increased sphingolipids contribute to degeneration of fh mutants.
(A) Mass spectrometry analysis of sphingolipids in control (y w FRT19A), fh mutants, and rescued animals (fh; gfh). dhsph, dihydrosphingosine; dhCer, dihydroceramide; Cer, ceramide; Sph, sphingosine. n = 2. (B) ERG of control (y w FRT19A; Rh1-GAL4), and fh mutants in which an RNAi against lace is expressed. (C) ERG amplitude and retinal morphology of fh mutants treated with 100 μM myriocin. Scale bar: 5 µm. (D) Quantification of Day 3 ERG amplitudes of fh mutants with low iron food and myriocin treatments. Data are presented as mean ± SEM. The error bars represent the range of data in (A). **p<0.01, ***p<0.001, Student’s t-test. D, flies are raised in dark.
To determine if increased sphingolipid synthesis contributes to neurodegeneration in fh mutants, we performed RNAi experiments against the first and rate-limiting enzyme in the de novo synthesis pathway, lace, the fly homolog of Serine palmitoyltransferase. This significantly improved the ERG defects of fh mutants (Figure 5B). In addition, feeding fh mutants Myriocin, a serine palmitoyltransferase inhibitor, suppressed both the functional and morphological photoreceptor defects of fh mutant clones (Figure 5C). Feeding myriocin to control animals does not adversely affect photoreceptor function (Figure 5—figure supplement 1). To assess if iron accumulation and increased sphingolipid synthesis act in the same or a different pathway, we treated fh mutants with low iron food as well as myriocin. As shown in Figure 5D, we did not observe an additive or synergistic effect. These results suggest that iron toxicity induces sphingolipid synthesis which in turn causes neurodegeneration in fh mutants.
Sphingolipids trigger the Pdk1/Mef2 pathway and cause neurodegeneration in fh mutants
Increased sphingolipids in yeast have been shown to activate a kinase pathway (Pkh1/Ypk1/Smp1) that converges on a transcription factor Smp1p (Lee et al., 2012). However, this pathway has not yet been studied in higher eukaryotic cells, or FXN mutant animal models. The corresponding proteins in mammals are PDK1, SGK (serum- and glucocorticoid regulated kinase), and Mef2 transcription factor (Casamayor et al., 1999; Dodou and Treisman, 1997). The Drosophila homolog of SGK has not been identified, but both Pdk1 and Mef2 are present in the fly. Mef2 is a well known transcription factor required for muscle differentiation, however, it is also expressed in certain neurons and photoreceptors (Blanchard et al., 2010). As we observed an increase in sphingolipids, we assessed if increased levels of sphingolipids activate the Pdk1/Mef2 pathway and underlie the neurodegenerative phenotype in fh mutants. We first tested if Pdk1/Mef2 is activated in fh mutants. As a proxy for Mef2 activation, we examined the mRNA levels of known downstream targets of Mef2. Seven Mef2 targets, which have been validated through in situ hybridization and qRT-PCR, are all ectopically expressed in response to ectopic expression of Mef2 in vivo (Elgar et al., 2008). We therefore examined these seven Mef2 targets in the nervous system of fh mutants. As shown in Figure 6A, all of these Mef2 targets are up-regulated. Several negative control genes, the downstream targets of other transcription factors, including Enhancer of split (E(Spl)), senseless (sens), and patched (ptc), as well as several housekeeping genes that are not Mef2 targets (Sandmann et al., 2006), are not changed in fh mutants (Figure 6—figure supplement 1A). These data indicate that Mef2 is abnomally activated in fh mutants.
Figure 6 with 1 supplement see all
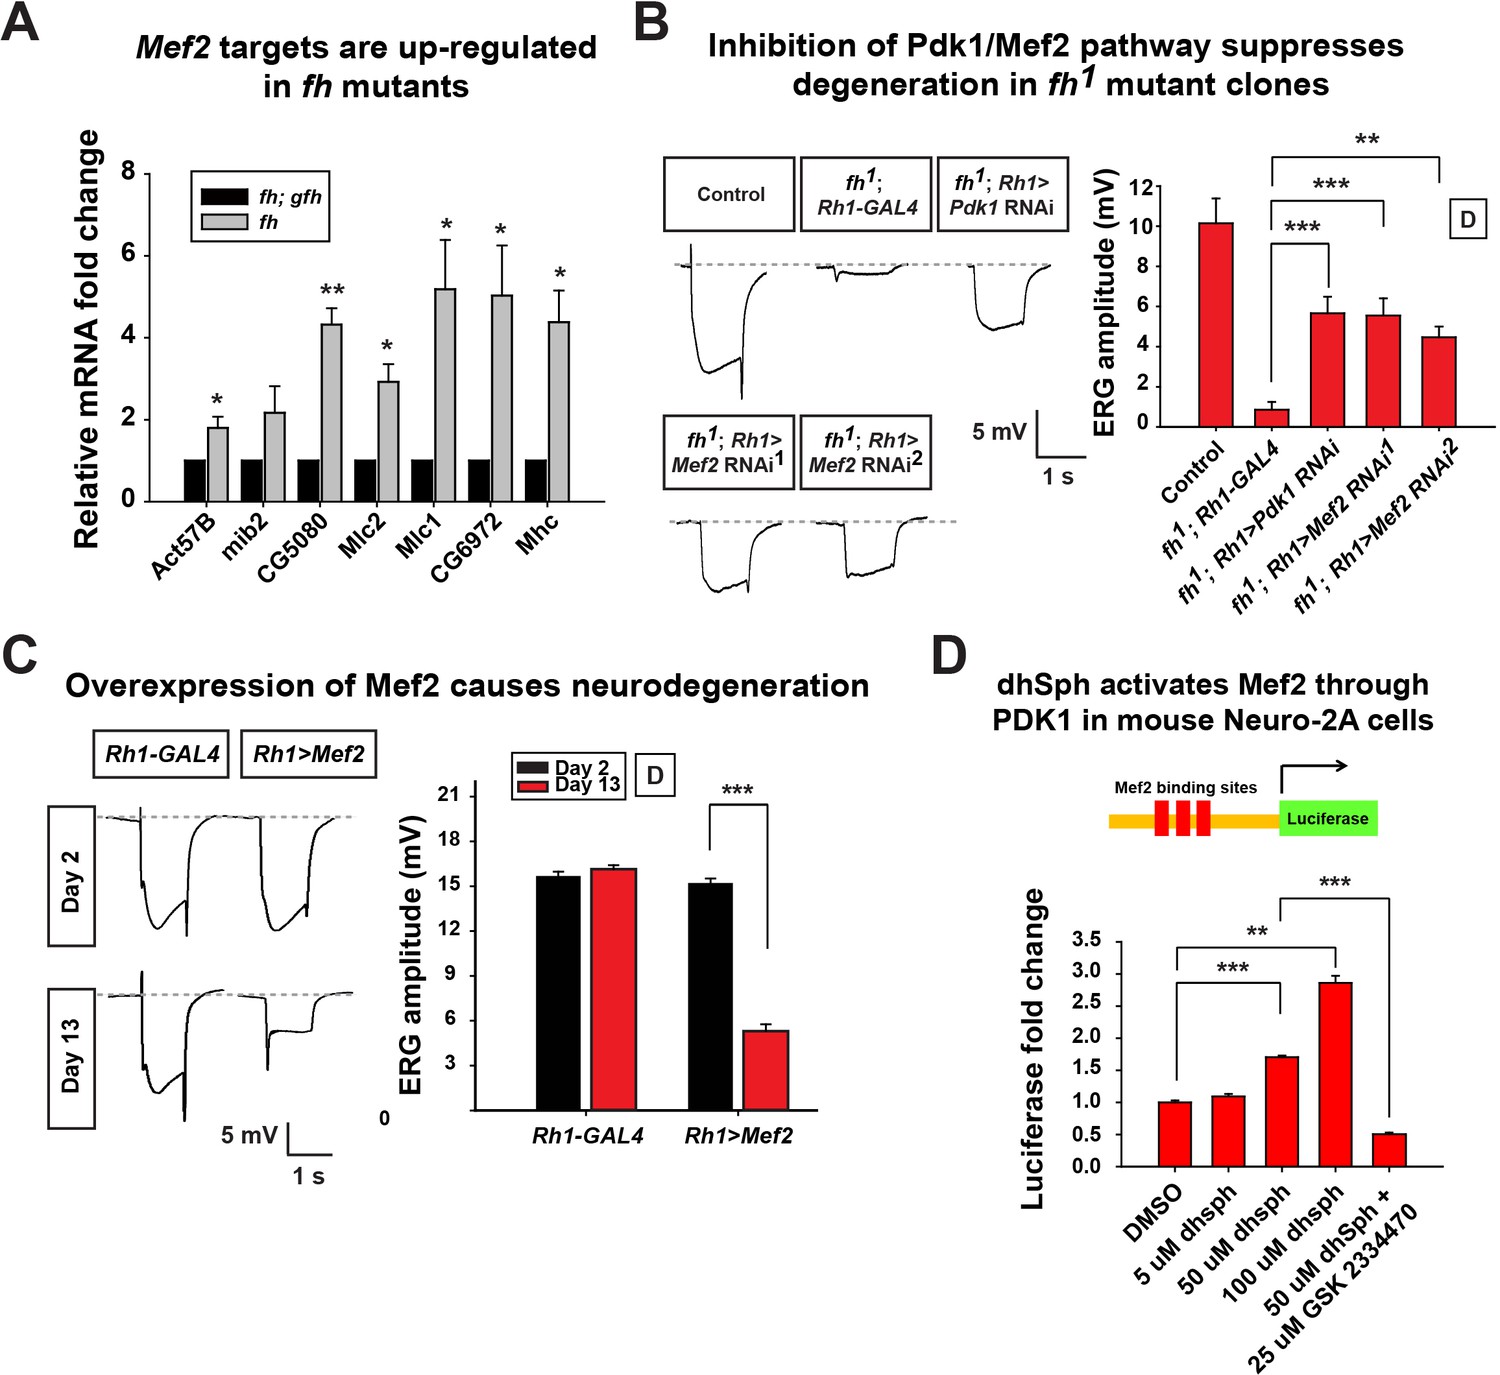
Activated Pdk1/Mef2 pathway causes degeneration in fh mutants.
(A) mRNA levels of Mef2 downstream targets in fh mutants and rescued animals (fh; gfh). n = 3. (B) Day 3 ERG of control (y w FRT19A; Rh1-GAL4) and fh mutants in which an RNAi against Pdk1 or Mef2 is expressed. (C) ERG of flies with Mef2 overexpression in the eye. (D) Mef2 luciferase reporter assay in Neuro-2A cells with different concentration of dhSph treatment. GSK 2334470, a PDK1 inhibitor. n = 4. Data are presented as mean ± SEM. *p<0.05. **p<0.01. ***p<0.001, Student’s t-test. D, flies are raised in dark.
Next, we tested if the activated Pdk1/Mef2 pathway contributes to neurodegeneration of fh mutants. We reasoned that if Pdk1 and Mef2 are activated and toxic, their down-regulation may suppress degeneration. Consistent with our hypothesis, RNAi mediated knockdown of Pdk1 suppresses the ERG and morphological defects in fh mutants (Figure 6B and Figure 6—figure supplement 1B). Furthermore, knock down of Mef2 by two independent RNAi lines suppresses neurodegeneration of fh mutants (Figure 6B and Figure 6—figure supplement 1B), suggesting that activated Pdk1 and Mef2 are toxic and contribute to the degeneration. To determine if up-regulation of Mef2 in wild type photoreceptors is sufficient to induce neurodegeneration, we ectopically expressed Mef2 in the adult eye using Rh1-Gal4. Overexpression of Mef2 is sufficient to cause photoreceptor degeneration (Figure 6C). Furthermore, flies with neuronal expression of Mef2 (nSyb>Mef2) die within a week, instead of 70–80 days of the wild type flies (data not shown). These data suggest that abnormal activation of Mef2 in neuron is sufficient to trigger its demise.
To assess if a similar pathway is affected in vertebrate cells, we tested if sphingolipids can induce Mef2 activation in Neuro-2A cells. dhSph, the sphingolipid that is increased more than 10 fold in fly fh mutants (Figure 5A), induces luciferase signals of a Mef2 reporter in a concentration dependent manner (Figure 6D). In addition, the increased luciferase signal is suppressed by adding the PDK1 inhibitor GSK2334470 (Figure 6D). This data indicate that dhsph activates Mef2 through PDK1, consistent with what we observed in the fly. Collectively, these data suggest that sphingolipids act as signaling molecules to activate the Pdk1/Mef2 pathway and that this pathway contributes to photoreceptor degeneration in fh mutants.
Discussion
Here, we report the isolation of the first severe loss of function allele of fh in Drosophila. This allowed us to identify a novel molecular pathway that contributes to neurodegeneration. Loss of fh in Drosophila causes an age dependent degeneration of photoreceptors in mutant clones. Mutant photoreceptors display abnormal mitochondrial cristae morphology, reduced ETC CI activity, and impaired ATP production. However, we do not observe an increase in ROS. Our data indicate that Rh1 trafficking defects caused by mitochondria dysfunction lead to an activity dependent degeneration in fh mutants. However, the accumulation of Fe2+ and/or Fe3+ stimulates sphingolipid synthesis which in turn activates the Pdk1/Mef2 pathway to cause an activity independent degeneration. Hence, mitochondrial dysfunction, and iron toxicity through activation of the sphingolipid/Pdk1/Mef2 pathway, synergistically contribute to the demise of neurons in fh mutants. The data indicate that ectopic activation of the transcription factor Mef2 induced by loss of FXN may play a role in FRDA.
Elevated ROS levels, either through impaired ETC CI or CIII, or iron associated Fenton reaction, have been proposed to be the major driving force of disease pathogenesis in FRDA (Bayot et al., 2011; Santos et al., 2010). However, we do not observe increased ROS levels in fh mutants (Figure 2D). In addition, overexpression of ROS scavengers or feeding antioxidant AD4 does not suppress degeneration (Figure 2E and Figure 2—figure supplement 1E). The lack of increased ROS is surprising as mitochondrial mutants in Drosophila that exhibit a severely reduced CI activity typically show elevated ROS levels (Owusu-Ansah et al., 2008; Zhang et al., 2013). Numerous studies using different animal models or cell lines have established that a partial or complete loss of FXN leads to different degrees of defects in the ETC. Importantly, several reports have also documented that loss of FXN leads to an hypersensitivity to ROS, rather than elevated ROS levels (Babcock et al., 1997; Llorens et al., 2007; Macevilly and Muller, 1997; Seznec et al., 2005; Shidara and Hollenbeck, 2010). Consistent with our data, overexpression of ROS scavengers in an RNAi mediated fh knock down did not improve viability or cardiac function, and no ROS could be detected (Anderson et al., 2005; Shidara and Hollenbeck, 2010; Tricoire et al., 2014). Similarly, loss of Fxn in mice does not lead to an increase in ROS (Puccio et al., 2001; Seznec et al., 2005), although elevated ROS levels in another mouse model have been documented (Al-Mahdawi et al., 2006). Combined, these data suggest that ROS is not a prominent player in model organisms and a clinical trial designed to suppress ROS have not provided compelling data (Santhera Pharmaceuticals, 2010).
Iron accumulation in mitochondria was first described in yeast frataxin homolog mutants in yeast (Babcock et al., 1997). Although iron deposits have been reported in cardiac muscles of Fxn deficiency mice and FRDA patients, iron accumulation in the nervous system has been reported by some (Boddaert et al., 2007; Koeppen et al., 2009) but not by others (Puccio et al., 2001; Simon et al., 2004; Solbach et al., 2014). More importantly, the role of iron in the pathophysiology of FRDA has not yet been determined, and mitochondrial defects are thought to presage iron accumulation in mammals (Puccio et al., 2001). It has been argued that Fe3+ accumulations are a non-reactive, intra-mitochondrial precipitates (Seguin et al., 2010; Whitnall et al., 2012). Finally, others proposed that iron accumulation is toxic as it induces the Fenton’s reaction and promotes ROS production. We find that in Drosophila fh mutants, both Fe2+ and Fe3+ accumulate in the nervous system (Figure 3C and D). As we observed no increased ROS, we argue that Fe2+ and Fe3+ accumulation is toxic because: 1) the lethality is enhanced when iron is increased; 2) reduction of iron in food suppresses the progression of photoreceptor degeneration; and 3) overexpression of Ferritin delays the demise of neurons. Taken together, we argue that iron accumulation in neurons is toxic and plays a primary role in the pathogenesis in fh mutants.
Our data indicate that iron accumulation enhances the synthesis of sphingolipid, and that the excess amount of sphingolipids is toxic and promotes neurodegeneration in fh mutants. How iron accumulation leads to an increase in sphingolipid synthesis is unknown. Although we show that Fe2+ accumulates in mitochondria of the larval muscle and at the NMJ in fh mutants, it is still not clear whether iron accumulates in other cellular organelles. The de novo synthesis of sphingolipids occurs in the ER, and mitochondria have close contacts with ER at the MAMs (mitochondria-associated endoplasmic reticulum membrane). Mitochondrial or ER localized iron may promote the enzymatic function of Lace or other proteins in the ER to enhance sphingolipid synthesis. However, treatment with Myriocin which targets Lace to decrease sphingolipid synthesis or down-regulation of lace via RNAi mediated knockdown suppresses degeneration in fh mutants (Figure 5B and C), suggesting that increased sphingolipid metabolites contribute to toxicity. These data are also in agreement with the observation that overexpression of Sk2 (sphingosine kinase 2) or feeding dhSph-1P to wild type flies promotes the degeneration of photoreceptors (Yonamine et al., 2011).
An increase in sphingolipids may affect various processes, including membrane integrity, lipid metabolism, and signal transduction (Brown and London, 2000; Hannun and Obeid, 2008; Worgall, 2008). We found that down-regulation of Pdk1 or Mef2 in mutant photoreceptor delays neurodegeneration in fh mutants, while overexpression of Mef2 in photoreceptor promotes the demise of neurons (Figure 6B and C). It has been reported that Sph or dhSph, two sphingolipids that are elevated in fh mutants, directly induce autophosphorylation of PDK1 or SGK in an in vitro kinase assay (Caohuy et al., 2014; King et al., 2000). Although there is no evidence that PDK1 or SGK can directly activate Mef2, our data clearly show that Mef2 activity is up-regulated by elevating dhSph in the medium of cultured Neuro-2A cells, and this increased activity is suppressed by a PDK1 inhibitor (Figure 6D), indicating that Mef2 can be activated by PDK1 or a downstream substrate of PDK1 (Mora et al., 2004).
The MEF2 family includes four vertebrate genes (MEF2A–D) that play a key role in muscle differentiation (Molkentin et al., 1995). However, the MEFs are also expressed in neurons where they are involved in neuronal development (Akhtar et al., 2012; Leifer et al., 1994; Lyons et al., 1995; Mao et al., 1999). The MEFs are known to regulate the expression of numerous target genes, including genes required for muscle differentiation, immediate-early genes, neuronal-activity-regulated genes, as well as genes involved in energy storage and immune response (Clark et al., 2013; Dietrich, 2013). In flies, ectopic expression of Mef2 in ectoderm is sufficient to induce nearly half of its predicted downstream targets that are typically expressed in muscles (Sandmann et al., 2006). Hence, its unusual activity may trigger neurodegeneration via the activation of some of its downstream targets. Importantly, it has been shown that the up-regulation of Mef2 is implicated in the cardiac hypertrophy and dilation (Molkentin and Markham, 1993; Xu et al., 2006), which is the major cause of death in FRDA patients. In sum, our data indicate that reducing the levels of sphingolipid synthesis with Myriocin, or antisense strategy against enzymes involved in sphingolipid synthesis, or reducing the levels of Pdk1or Mef2, are options that should be explored in FRDA models.
Materials and methods
Fly strains and genetics
Request a detailed protocolFlies were obtained from the Bloomington Drosophila Stock Center at Indiana University (BDSC) unless otherwise noted. The stocks were routinely maintained at room temperature. For genetic interaction experiments, flies were raised at 28°C to enhance the GAL4 activity. For all the larval experiments, flies were allowed to lay eggs for 48 hr on grape juice plates with yeast paste. Hemizygous mutant larvae and wild type controls were isolated by GFP selection at the first instar phase and transferred to standard fly food for the duration of their development. To create mosaic mutant clones in the adult eye, y w FRT19A and y w fh FRT19A/FM7c, Kr>GFP females were crossed with y w GMR-hid FRT19A; ey-GAL4 UAS-FLP or y w GMR-hid l(1)cl FRT19A/FM7c, Kr>GFP; eyFLP Rh1-GAL4/CyO flies.
The following strains were used to generate fly stocks in this study:
y w FRT19A (Haelterman et al., 2014; Yamamoto et al., 2014)
y w fh1 FRT19A/FM7c, Kr>GFP (Haelterman et al., 2014; Yamamoto et al., 2014)
y w fh1 FRT19A/FM7c, Kr>GFP; genomic-fh (Haelterman et al., 2014; Yamamoto et al., 2014)
Df(1)BSC537, w1118/FM7h/Dp(2;Y)G, P{hs-hid}Y
y w GMR-hid FRT19A; ey-GAL4 UAS-FLP
y w GMR-hid l(1)cl FRT19A/FM7c, Kr>GFP; eyFLP Rh1-GAL4/CyO (Jaiswal et al., 2015)
w1; P{UAS-fh.A}1 (Anderson et al., 2005)
w1; P{UAS-Cat.A}2 (Anderson et al., 2005)
w1; P{UAS-Sod.A}B37 (Anderson et al., 2005)
w1; P{UAS-Sod2.M}UM83 (Anderson et al., 2005)
P{rh1-GAL4}3, ry506
P{Gal4-da.G32} UH1
y1 w*; P{nSyb-GAL4.S}3
w; repo-GAL4/TM3,Sb
w*; P{w+mC bmmScer\UAS = UAS-bmm} (Gronke et al., 2005) (gift from Ronald Kühnlein)
w*; UAS-Lip4/CyO (Liu et al., 2015)
P{UAS-Mef2-HA} (Sandmann et al., 2006) (gift from Eileen Furlong)
P{UAS-Fer1HCH} P{UAS-Fer2LCH} (Missirlis et al., 2006, 2007) (gift from Hermann Steller)
P{UAS-Fer1HCH.mut} P{UAS-Fer2LCH} (Missirlis et al., 2006, 2007) (gift from Hermann Steller)
P{UAS-Fer3HCH} (Missirlis et al., 2006) (gift from Patrik Verstreken)
w1118; P{GawB}D42, P{UAS-mito-HA-GFP.AP}3 e1/TM6B, Tb1 (Horiuchi et al., 2005) (gift from Bill Saxton)
w*; cno3 P{A92}pucE69/TM6B, abdA-LacZ (Ring and Martinez Arias, 1993) (Drosophila Genetic Resource Center)
ND42 RNAi: y1 sc* v1; P{TRiP.HMS00798}attP2 (Owusu-Ansah et al., 2008)
lace RNAi: P{KK102282}VIE-260B (Ghosh et al., 2013) (VDRC)
Pdk1 RNAi: P{KK108363}VIE-260B (Tokusumi et al., 2012) (VDRC)
Mef2 RNAi: w1118; P{GD5039}v15549/TM3 and w1118; P{GD5039}v15550 (Clark et al., 2013) (VDRC)
ERG recording
Request a detailed protocolERG recordings were performed as described (Verstreken et al., 2003). Briefly, flies were glued on a glass slide. A recording electrode filled with 3M NaCl was placed on the eye, and another reference electrode was inserted into the fly head. Before the recording, photoreceptors were allowed to recover by keeping flies in the dark for 3 min. During the recording, a 1 s pulse of light stimulation was given, and the ERG traces of five to ten flies were recorded and analyzed by AXON -pCLAMP 8 software.
Iron staining
Request a detailed protocolTo detect Fe2+ levels, L3 larvae were dissected in ice-cold 0.25 mM Ca2+ HL3 (Stewart et al., 1994) (70 mM NaCl, 5 mM KCl, 20 mM MgCl2, 10 mM NaHCO3, 5 mM trehalose, 5 mM HEPES, 115 mM sucrose, pH 7.2) and rinsed in HL3 with 1 mM Ca2+. The animals were then incubated with 10 µM RPA or RPAC (Squarix Biotechnology, Germany) in 1 mM Ca2+ HL3 for 20 min at room temperature in the dark. The animals were washed subsequently three times with ice-cold 1 mM Ca2+ HL3 and then incubated in 1 mM Ca2+ HL3 with 7 mM L-glutamic acid for 15 min at room temperature in the dark. The RPA or RPAC fluorescence was obtained with a Zeiss LSM 510 confocal microscope (Carl Zeiss) and quantified by Image J.
To evaluate Fe3+ levels, L3 larval brains were dissected and fixed in 3.7% formaldehyde for 20 min. Samples were quickly washed three times with 0.4% Triton-PBS and incubated with Perls solution (1% K4Fe(CN)6 and 1% HCl in PBT) for 5 min. After 3 quick washes in PBT, samples were incubated with DAB solution (10 mg DAB with 0.07% H2O2 in 0.4% Triton-PBS) to enhance the signal. The brains were then quickly washed three times with 0.4% Triton-PBS and mounted. The brain images were obtained with a Leica MZ16 stereomicroscope equipped with Optronics MicroFire Camera.
ROS levels analysis
Request a detailed protocolL3 larvae were dissected in ice-cold 0.25 mM Ca2+ HL3 and rinsed with 1 mM Ca2+ HL3. The animals were then incubated with 10 µM dihydroethidium (DHE, Sigma-Aldrich) in 1 mM Ca2+ HL3 for 20 min at room temperature in the dark. The samples were quickly washed three times with 1 mM Ca2+ HL3 with 7 mM L-glutamic acid, and the DHE fluorescence in larval brains were live imaged by Zeiss 510 confocal microscope (Carl Zeiss) and quantified by Image J.
Low iron food preparation and drug administration
Request a detailed protocolLow iron food was made using 10% dry yeast, 10% sucrose, and 0.6% agar in w/v in water. The solution was microwaved and dried at room temperature, divided into vials, and stored at 4°C for further use. To increase iron levels in the food, ammonium iron (Ш) citrate (Sigma-Aldrich) was added to a final concentration of 1 mM or 10 mM in the low iron food. To test if inhibition of sphingolipid synthesis suppresses neurodegeneration in fh mutants, myriocin from Mycelia sterilia (Sigma-Aldrich) was dissolved in regular fly food (molasses based) or low iron food, and vials were then stored immediately at −20°C for future use. The flies were transfer to fresh food vials every two days.
Molecular cloning
Request a detailed protocolFor the fh genomic rescue construct, a DNA fragment containing Drosophila X: 9,147,070..9,150,371 was retrieved from a 20 kb P[acman] construct that covers the entire fh genomic locus (clone CH322-14E18 from BACPAC Resources Center) (Venken et al., 2009). The fh genomic sequence was then subcloned into p{w+}attB using KpnI and NotI sites. The construct was then injected into y w ΦC31;VK33 embryos, and transgenic flies were selected.
To generate pUAST-attB-UAS-hFXN construct, the primers 5’- TCCGAATTCGCCACCATGTGGACTCTCGGGCGCCGCGC-3’ and 5’-GCGGTACCTCAAGCATCTTTTCCGGAATAGGC-3’ were used to clone the full length FXN cDNA from pcDNA-hFXN-HA, a gift from Gino Cortopassi (Shan et al., 2007). The PCR product was then subcloned into the pUAST-attB vector. The construct was then injected into y w ΦC31;VK33 or y w ΦC31;VK37 embryos, and the transgenic flies were selected.
Immunofluorescence staining
Request a detailed protocolFor whole mount eye staining, we dissected fly heads in cold PBS and fixed with 4% paraformaldehyde at 4°C overnight. The retinas were then dissected and fixed for an additional 30 min. For larval ventral nerve cord staining, L3 instar larvae were dissected and fixed with 3.7% formaldehyde for 20 min. The antibodies were used at the following concentrations: mouse anti-Na/K ATPase (α5, Developmental Studies Hybridoma Bank (DSHB)), 1:200; rat anti-Elav (7E8A10, DSHB), 1:500; mouse anti-Rh1 (4C5, DSHB), 1:100; mouse anti-V5 (R96025, Invitrogen), 1:1000; rabbit anti-HRP (323-005-021, Jackson ImmunoResearch), 1:1000; chicken anti-GFP (ab13970, abcam), 1:1000; rabbit anti-β-Galactosidase (Cappel), 1:1000; mouse anti-DLG (4F3, DSHB), 1:200; Alexa 488-conjugated phalloidin (Invitrogen), 1:100; Alexa 405-, Alexa 488-, Cy3-, or Cy5-conjugated secondary antibodies (Jackson ImmunoResearch), 1:250. Samples were then mounted in Vectashield (Vector Laboratories) before being analyzed under a confocal microscope. All the confocal scans were acquired with a confocal microscope (model LSM 510 or LSM 710; Carl Zeiss) and processed using LSM Image Browser (Carl Zeiss) and Photoshop (Adobe).
The Nile red staining was performed as described (Liu et al., 2015). Briefly, the retina was dissected and fixed in 3.7%formaldehyde. The samples were then incubated for 10 min at 1:1,000 dilution of PBS with 1 mg/ml Nile Red (Sigma). The retina was then washed with PBS and mounted in Vectashield (Vector Laboratories). Images were obtained with a Zeiss LSM 510 confocal microscope.
Mitochondrial functional assay
Request a detailed protocolMitochondria were extracted as previously described (Zhang et al., 2013). Mitochondrial ETC enzymatic activity assay and aconitase activity assay were performed as previously described (Zhang et al., 2013). To determine ADP/ATP ratio, L3 larvae were collected and the ratio was determined with an ADP/ATP Ratio Assay Kit (ab65313, abcam). Briefly, 5–10 L3 instar larvae were collected and frozen with liquid nitrogen. The samples were then homogenized and the ADP/ATP ratio was measured following manufacturer’s protocol. The luminescence was measured by Synergy 2 Microplate Reader (BioTek).
Transmission electron microscopy (TEM)
Request a detailed protocolDrosophila retina ultrastructure was imaged following standard electron microscopy procedures using a Ted Pella Bio Wave processing microwave with vacuum attachments. Briefly, fly heads were dissected and fixed at 4°C in fixative (2% paraformaldehyde, 2.5% glutaraldehyde, 0.1 M sodium cacodylate, and 0.005% CaCl2, pH 7.2) overnight. The samples were then postfixed in 1% OsO4, dehydrated in ethanol and propylene oxide, and then embedded in Embed-812 resin (Electron Microscopy Sciences) under vacuum. Photoreceptors were then sectioned and stained in 1% uranyl acetate and saturated lead nitrate. TEM images of photoreceptor sections were taken using a JEOL JEM 1010 transmission electron microscope at 80 kV with an AMT XR-16 mid-mount 16 mega-pixel digital camera.
Mass spectrometry
Request a detailed protocolESI/MS/MS analysis of endogenous sphingosine bases and ceramide species (C14- and C16-Sphingoid Base) were performed on a Thermo_Fisher TSQ Quantum triple quadrupole mass spectrometer, operating in a Multiple Reaction Monitoring (MRM) positive ionization mode, using modified version (Bielawski et al., 2009). Briefly, whole larvae were fortified with the internal standards (ISs: C17 base D-erythro-sphingosine (17CSph), C17 sphingosine-1-phosphate (17CSph-1P), N-palmitoyl-D-erythro-C13 sphingosine (13C16-Cer) and heptadecanoyl-D-erythro-sphingosine (C17-Cer)), and extracted with ethyl acetate/iso-propanol/water (60/30/10 v/v) solvent system. After evaporation and reconstitution in 100 μl of methanol samples were injected on the HP1100/TSQ Quantum LC/MS system and gradient eluted from the BDS Hypersil C8, 150 × 3.2 mm, 3 μm particle size column, with 1.0 mM methanolic ammonium formate / 2 mM aqueous ammonium formate mobile phase system. Peaks corresponding to the target analytes and internal standards were collected and processed using the Xcalibur software system.
Quantitative analysis was based on the calibration curves generated by spiking an artificial matrix with the known amounts of the target analyte synthetic standards and an equal amount of the internal standards (ISs). The target analyte/IS peak areas ratios were plotted against anlyte concentration. The target analyte/IS peak area ratios from the samples were similarly normalized to their respective ISs and compared to the calibration curves, using a linear regression model. Applying consistent mass spectral conditions of Collision Assistant Dessociation (CAD); 35 eV and Electron Spray Ionization (ESI) all sphingoid bases and related ceramides undergo uniform transition from initial molecular ion (M+1) to the respective sphingoid backbone secondary ions. Consequently, calibration curves, generated from authentic standards of the typical, 18C-sphingosine and ceramides, can be used for quantitation of other, e.g. 20C- counterparts. The levels of sphingolipid species are normalized to the phosphate amount of the samples. Although absolute concentrations determined for compounds without authentic standards (20C-LCB derivatives) may not be precise, due to possible differences in instrument response for 18C- and 20C-LCB related compounds, for comparative study, where changes in sphingolipids level rather than absolute concentration, are most important this indirect methodology provide reliable results.
Reverse transcription–quantitative polymerase chain reaction (PCR)
Request a detailed protocolTotal RNA from the fly larval brains were extracted by Trizol RNA Isolation Reagents (Thermo Fisher Scientific) follow the manufacturer’s instructions. The cDNA was synthesized by High-Capacity cDNA Reverse Transcription Kit (Applied Biosystems). Real-time PCR was carried out using iQ SYBR Green Supermix (Bio-Rad) and performed in a thermal cycler (iCycler; Bio-Rad Laboratories). The data were collected and analyzed using the optical module (iQ5; Bio-Rad Laboratories). The following primer pairs are used (5’to 3’): RP49 forward (control primer), TCCTACCAGCTTCAAGATGAC; RP49 reverse (control primer), CACGTTGTGCACCAGGAACT; Act57B forward, TTGAGACCTTCAACTCGCCC; Act58B reverse, CCATCACCGGAGTCCAGAAC; mib2 forward, CGCCAGAAAACACTGTCGTG; mib2 reverse, GACGAACTCCAACTTGAGCATTA; CG5080 forward, CGCCCTCTCCAATTAGTTCTCC; CG5080 reverse, CAGCGACTGGATAGTTCCGC; Mlc2 forward, TCGGGTCCGATCAACTTCAC; Mlc2 reverse, ATTTCGCGGAATTTGTCACCG; Mlc1 forward, CCGAGGATGATGAAGGATTT; Mlc1 reverse, CTGGTCTGTCACACATTCTGG; CG6972 forward, AGGGATCACACACTGATGAACT; CG6972 reverse, CAACAGCCATTCGGAGGGAC; Mhc forward, ATCAATCCTTACAAGCGTTACCC; Mhc reverse, CCGTCAGAGATGGCGAAAATATG; E(Spl) forward, ATGGAATACACCACCAAGACCC; E(Spl) reverse, GGCGACAAGTGTTTTCAGGTT; sens forward, TACTGTGGCCCCAATTTTTGT; sens reverse, AAGGCAAAGTCACGATCCCG; ptc forward, GGATCTTTACATACGCACCAGC; ptc reverse, GGACTGGAATACTGATCGCAG;
Mef2 Luciferase reporter assay
Request a detailed protocolNeuro-2A cells were seed on 12 well plates, and each well was transfected with 3XMef2-luc reporter (Addgene) and Renilla control pRL-TK vector (gift from Huda Zoghbi). After two days, DMSO, DL-Dihydrosphingosine (Sigma), or GSK2334470 (gift from Huda Zoghbi) was added into the medium. Cells were cultured one more day with drug treatment. The luciferase assay was then performed by Dual-Luciferase Reporter Assay System (Promega) and followed manufacturer instruction.
References
-
N-acetylcysteine amide (AD4) attenuates oxidative stress in beta-thalassemia blood cellsBiochimica Et Biophysica Acta 1780:249–255.https://doi.org/10.1016/j.bbagen.2007.11.009
-
RNAi-mediated suppression of the mitochondrial iron chaperone, frataxin, in DrosophilaHuman Molecular Genetics 14:3397–3405.https://doi.org/10.1093/hmg/ddi367
-
Hydrogen peroxide scavenging rescues frataxin deficiency in a Drosophila model of Friedreich's ataxiaProceedings of the National Academy of Sciences of the United States of America 105:611–616.https://doi.org/10.1073/pnas.0709691105
-
The structure and function of frataxinCritical Reviews in Biochemistry and Molecular Biology 41:269–291.https://doi.org/10.1080/10409230600846058
-
The transcription factor Mef2 is required for normal circadian behavior in DrosophilaJournal of Neuroscience 30:5855–5865.https://doi.org/10.1523/JNEUROSCI.2688-09.2010
-
Targeted gene expression as a means of altering cell fates and generating dominant phenotypesDevelopment 118:401–415.
-
Structure and function of sphingolipid- and cholesterol-rich membrane raftsJournal of Biological Chemistry 275:17221–17224.https://doi.org/10.1074/jbc.R000005200
-
Oxidative stress, mitochondrial dysfunction and cellular stress response in Friedreich's ataxiaJournal of the Neurological Sciences 233:145–162.https://doi.org/10.1016/j.jns.2005.03.012
-
Activation of 3-phosphoinositide-dependent kinase 1 (PDK1) and serum- and glucocorticoid-induced protein kinase 1 (SGK1) by short-chain sphingolipid C4-ceramide rescues the trafficking defect of ΔF508-cystic fibrosis transmembrane conductance regulator (ΔF508-CFTR)The Journal of Biological Chemistry 289:35953–35968.https://doi.org/10.1074/jbc.M114.598649
-
Frataxin silencing inactivates mitochondrial Complex I in NSC34 motoneuronal cells and alters glutathione homeostasisInternational Journal of Molecular Sciences 15:5789–5806.https://doi.org/10.3390/ijms15045789
-
The MEF2 family and the brain: from molecules to memoryCell and Tissue Research 352:179–190.https://doi.org/10.1007/s00441-013-1565-2
-
The Saccharomyces cerevisiae MADS-box transcription factor Rlm1 is a target for the Mpk1 mitogen-activated protein kinase pathwayMolecular and Cellular Biology 17:1848–1859.https://doi.org/10.1128/MCB.17.4.1848
-
mef2 activity levels differentially affect gene expression during Drosophila muscle developmentProceedings of the National Academy of Sciences of the United States of America 105:918–923.https://doi.org/10.1073/pnas.0711255105
-
Principles of bioactive lipid signalling: lessons from sphingolipidsNature Reviews Molecular Cell Biology 9:139–150.https://doi.org/10.1038/nrm2329
-
Sphingosine is a novel activator of 3-phosphoinositide-dependent kinase 1The Journal of Biological Chemistry 275:18108–18113.https://doi.org/10.1074/jbc.M909663199
-
The dentate nucleus in Friedreich's ataxia: the role of iron-responsive proteinsActa Neuropathologica 114:163–173.https://doi.org/10.1007/s00401-007-0220-y
-
The dorsal root ganglion in Friedreich's ataxiaActa Neuropathologica 118:763–776.https://doi.org/10.1007/s00401-009-0589-x
-
Friedreich's ataxia: pathology, pathogenesis, and molecular geneticsJournal of the Neurological Sciences 303:1–12.https://doi.org/10.1016/j.jns.2011.01.010
-
The cardiomyopathy of Friedreich's ataxia morphological observations in 3 casesThe Canadian Journal of Neurological Sciences 7:389–396.
-
Iron-sulfur cluster biosynthesis: characterization of Escherichia coli CYaY as an iron donor for the assembly of [2Fe-2S] clusters in the scaffold IscUJournal of Biological Chemistry 281:16256–16263.https://doi.org/10.1074/jbc.M513569200
-
Sphingolipid signaling mediates iron toxicityCell Metabolism 16:90–96.https://doi.org/10.1016/j.cmet.2012.06.004
-
Causative role of oxidative stress in a Drosophila model of Friedreich ataxiaThe FASEB Journal 21:333–344.https://doi.org/10.1096/fj.05-5709com
-
A phase 3, double-blind, placebo-controlled trial of idebenone in friedreich ataxiaArchives of Neurology 67:941–947.https://doi.org/10.1001/archneurol.2010.168
-
Expression of mef2 genes in the mouse central nervous system suggests a role in neuronal maturationJournal of Neuroscience 15:5727–5738.
-
Oxidative stress does not appear to be involved in the aetiology of Friedreich's ataxiaRestorative Neurology and Neuroscience 11:131–137.https://doi.org/10.3233/RNN-1997-11303
-
Nonheme-iron histochemistry for light and electron microscopy: a historical, theoretical and technical reviewArchives of Histology and Cytology 70:1–19.https://doi.org/10.1679/aohc.70.1
-
Characterization of mitochondrial ferritin in DrosophilaProceedings of the National Academy of Sciences of the United States of America 103:5893–5898.https://doi.org/10.1073/pnas.0601471103
-
Myocyte-specific enhancer-binding factor (MEF-2) regulates alpha-cardiac myosin heavy chain gene expression in vitro and in vivoThe Journal of Biological Chemistry 268:19512–19520.
-
PDK1, the master regulator of AGC kinase signal transductionSeminars in Cell & Developmental Biology 15:161–170.https://doi.org/10.1016/j.semcdb.2003.12.022
-
The yeast frataxin homolog Yfh1p plays a specific role in the maturation of cellular Fe/S proteinsHuman Molecular Genetics 11:2025–2036.https://doi.org/10.1093/hmg/11.17.2025
-
Altered lipid metabolism in a Drosophila model of Friedreich's ataxiaHuman Molecular Genetics 19:2828–2840.https://doi.org/10.1093/hmg/ddq183
-
The effects of catalase gene overexpression on life span and resistance to oxidative stress in transgenic Drosophila melanogasterArchives of Biochemistry and Biophysics 297:35–41.https://doi.org/10.1016/0003-9861(92)90637-C
-
Co-enzyme Q10 and idebenone use in Friedreich's ataxiaJournal of Neurochemistry 126 Suppl 1:125–141.https://doi.org/10.1111/jnc.12322
-
puckered, a gene involved in position-specific cell differentiation in the dorsal epidermis of the Drosophila larvaDevelopment Supplement pp. 251–259.
-
Friedreich ataxia: molecular mechanisms, redox considerations, and therapeutic opportunitiesAntioxidants & Redox Signaling 13:651–690.https://doi.org/10.1089/ars.2009.3015
-
Oxidative stress in patients with Friedreich ataxiaNeurology 55:1719–1721.https://doi.org/10.1212/WNL.55.11.1719
-
Evidence that yeast frataxin is not an iron storage protein in vivoBiochimica Et Biophysica Acta 1802:531–538.https://doi.org/10.1016/j.bbadis.2010.03.008
-
Friedreich ataxia: the oxidative stress paradoxHuman Molecular Genetics 14:463–474.https://doi.org/10.1093/hmg/ddi042
-
Mitochondrial frataxin interacts with ISD11 of the NFS1/ISCU complex and multiple mitochondrial chaperonesHuman Molecular Genetics 16:929–941.https://doi.org/10.1093/hmg/ddm038
-
Improved stability of Drosophila larval neuromuscular preparations in haemolymph-like physiological solutionsJournal of Comparative Physiology A 175:179–191.https://doi.org/10.1007/BF00215114
-
Induced overexpression of mitochondrial Mn-superoxide dismutase extends the life span of adult Drosophila melanogasterGenetics 161:661–672.
-
Methylene blue rescues heart defects in a Drosophila model of Friedreich's ataxiaHuman Molecular Genetics 23:968–979.https://doi.org/10.1093/hmg/ddt493
-
Generation of superoxide anion by the NADH dehydrogenase of bovine heart mitochondriaBiochemical Journal 191:421–427.https://doi.org/10.1042/bj1910421
-
Identification of nonferritin mitochondrial iron deposits in a mouse model of Friedreich ataxiaProceedings of the National Academy of Sciences of the United States of America 109:20590–20595.https://doi.org/10.1073/pnas.1215349109
-
Regulation of lipid metabolism by sphingolipidsSub-Cellular Biochemistry 49:371–385.https://doi.org/10.1007/978-1-4020-8830-8_14
-
Myocyte enhancer factors 2A and 2C induce dilated cardiomyopathy in transgenic miceJournal of Biological Chemistry 281:9152–9162.https://doi.org/10.1074/jbc.M510217200
-
Sphingosine kinases and their metabolites modulate endolysosomal trafficking in photoreceptorsThe Journal of Cell Biology 192:557–567.https://doi.org/10.1083/jcb.201004098
-
Iron-sulfur cluster biosynthesis. Characterization of frataxin as an iron donor for assembly of [2Fe-2S] clusters in ISU-type proteinsJournal of the American Chemical Society 125:6078–6084.https://doi.org/10.1021/ja027967i
-
The C8ORF38 homologue Sicily is a cytosolic chaperone for a mitochondrial complex I subunitThe Journal of Cell Biology 200:807–820.https://doi.org/10.1083/jcb.201208033
Article and author information
Author details
Funding
Friedreich's Ataxia Research Alliance
- Kuchuan Chen
- Guang Lin
- Hugo J Bellen
Howard Hughes Medical Institute
- Lita Duraine
- Manish Jaiswal
- Hugo J Bellen
Texas Children's Hospital (Jan and Dan Duncan Neurological Research Institute)
- Shinya Yamamoto
National Institutes of Health (1RC4GM096355)
- Hugo J Bellen
Robert A and Renee E. Belfer Family Foundation
- Hugo J Bellen
Huffington Foundation
- Hugo J Bellen
Target ALS
- Hugo J Bellen
Eunice Kennedy Shriver National Institute of Child Health and Human Development (1U54 HD083092)
- Hugo J Bellen
The funders had no role in study design, data collection and interpretation, or the decision to submit the work for publication.
Acknowledgements
We thank Karen Schulze for comments; Fanis Missirlis and Hermann Steller (ferritin transgenic flies); Patrik Verstreken (UAS-Fer3HCH); Eileen Furlong (UAS-mef2); Gino Cortopassi (pcDNA-hFXN-HA); Huda Zoghbi (pRL-TK vector and GSK2334470); Addgene, the Bloomington Drosophila Stock Center, the Vienna Drosophila Resource Center, and the Kyoto Drosophila Genetic Resource Center for providing stocks and reagents. We thank the Lipidomics Core at the Medical University of South Carolina for sphingolipid analysis. We thank the BCM Intellectual and Developmental Disabilities Research Center (IDDRC) confocal microscopy core, which were supported by the Eunice Kennedy Shriver National Institute of Child Health & Human Development (1U54 HD083092). SY is supported by the Jan and Dan Duncan Neurological Research Institute at Texas Children’s Hospital. We acknowledge support from the Friedreich's Ataxia Research Alliance, NIH (1RC4GM096355), the Robert A and Renee E. Belfer Family Foundation, the Huffington Foundation, and Target ALS to HJB. HJB is an Investigator of the Howard Hughes Medical Institute.
Copyright
© 2016, Chen et al.
This article is distributed under the terms of the Creative Commons Attribution License, which permits unrestricted use and redistribution provided that the original author and source are credited.
Metrics
-
- 3,636
- views
-
- 838
- downloads
-
- 74
- citations
Views, downloads and citations are aggregated across all versions of this paper published by eLife.
Citations by DOI
-
- 74
- citations for umbrella DOI https://doi.org/10.7554/eLife.16043
Download links
A two-part list of links to download the article, or parts of the article, in various formats.
Downloads (link to download the article as PDF)
Open citations (links to open the citations from this article in various online reference manager services)
Cite this article (links to download the citations from this article in formats compatible with various reference manager tools)
Loss of Frataxin induces iron toxicity, sphingolipid synthesis, and Pdk1/Mef2 activation, leading to neurodegeneration
eLife 5:e16043.
https://doi.org/10.7554/eLife.16043


