Peer review process
Revised: This Reviewed Preprint has been revised by the authors in response to the previous round of peer review; the eLife assessment and the public reviews have been updated where necessary by the editors and peer reviewers.
Read more about eLife’s peer review process.Editors
- Reviewing EditorSiming ZhaoDartmouth College, Lebanon, United States of America
- Senior EditorRichard WhiteUniversity of Oxford, Oxford, United Kingdom
Reviewer #1 (Public Review):
Summary:
Building upon their famous tool for the deconvolution of human transcriptomics data (EPIC), Gabriel et al. implemented a new methodology for the quantification of the cellular composition of samples profiled with Assay for Transposase-Accessible Chromatin sequencing (ATAC-seq). To build a signature for ATAC-seq deconvolution, they first created a compendium of ATAC-seq data and derived chromatin accessibility marker peaks and reference profiles for 12 cell types, encompassing immune cells, endothelial cells, and fibroblasts. Then, they coupled this novel signature with the EPIC deconvolution framework based on constrained least-square regression to derive a dedicated tool called EPIC-ATAC. The method was then assessed using real and pseudo-bulk ATAC-seq data from human peripheral blood mononuclear cells (PBMC) and, finally, applied to ATAC-seq data from breast cancer tumors to show it accurately quantifies their immune contexture.
Strengths:
Overall, the work is of very high quality. The proposed tool is timely; its implementation, characterization, and validation are based on rigorous methodologies and results in robust estimates. The newly-generated, validation data and the code are publicly available and well-documented. Therefore, I believe this work and the associated resources will greatly benefit the scientific community.
Weaknesses:
In the benchmarking analysis, EPIC-ATAC was compared also to deconvolution methods that were originally developed for transcriptomics and not for ATAC-seq data. However, the authors described in detail the specific settings used to analyze this different data modality as robustly as possible, and they discussed possible limitations and ideas for future improvement.
Reviewer #2 (Public Review):
Summary:
The manuscript expands the current bulk sequencing data deconvolution toolkit to include ATAC-seq. The EPIC-ATAC tool successfully predicts accurate proportions of immune cells in bulk tumour samples and EPIC-ATAC seems to perform well in benchmarking analyses. The authors achieve their aim of developing a new bulk ATAC-seq deconvolution tool.
Strengths:
The manuscript describes simple and understandable experiments to demonstrate the accuracy of EPIC-ATAC. They have also been incredibly thorough with their reference dataset collections and have been robust in their benchmarking endeavours and measured EPIC-ATAC against multiple datasets and tools. This tool will be valuable to the community it serves.
Author response:
The following is the authors’ response to the original reviews.
Public Reviews:
Reviewer #1 (Public Review):
Summary:
Building upon their famous tool for the deconvolution of human transcriptomics data (EPIC), Gabriel et al. implemented a new methodology for the quantification of the cellular composition of samples profiled with Assay for Transposase-Accessible Chromatin sequencing (ATAC-Seq). To build a signature for ATAC-seq deconvolution, they first created a compendium of ATAC-seq data and derived chromatin accessibility marker peaks and reference profiles for 21 cell types, encompassing immune cells, endothelial cells, and fibroblasts. They then coupled this novel signature with the EPIC deconvolution framework based on constrained least-square regression to derive a dedicated tool called EPIC-ATAC. The method was then assessed using real and pseudo-bulk RNA-seq data from human peripheral blood mononuclear cells (PBMC) and, finally, applied to ATAC-seq data from breast cancer tumors to show it accurately quantifies their immune contexture.
Strengths:
Overall, the work is of very high quality. The proposed tool is timely; its implementation, characterization, and validation are based on rigorous methodologies and resulted in robust results. The newly-generated, validation data and the code are publicly available and well-documented. Therefore, I believe this work and the associated resources will greatly benefit the scientific community.
Weaknesses:
CA few aspects can be improved to clarify the value and applicability of the EPIC-ATAC and the transparency of the benchmarking analysis.
(1) Most of the validation results in the main text assess the methods on all cell types together, by showing the correlation, RMSE, and scatterplots of the estimated vs. true cell fractions. This approach is valuable for showing the overall method performance and for detecting systematic biases and noisy estimates. However, it provides very limited insights regarding the capability of the methods to estimate the individual cell types, which is the ultimate aim of deconvolution analysis. This limitation is exacerbated for rare cell types, which could even have a negative correlation with the ground truth fractions, but not weigh much on the overall RMSE and correlation. I would suggest integrating into the main text and figures an in-depth assessment of the individual cell types. In particular, it should be shown and discussed which cell types can be accurately quantified and which ones are less reliable.
We thank the reviewer for raising this important point. Discussing the accuracy of EPIC-ATAC in predicting individual cell-type proportions would indeed be valuable in the main text. We have updated the text as follows.
In the first version of our manuscript, we had a section called “T cell subtypes quantification reveals the ATAC-Seq deconvolution limits for closely related cell types” which highlighted that EPIC-ATAC shows low performances when predicting the proportions of cell types that are closely related, e.g., CD4+ T cell or CD8+ T cell subtypes. The section is now named “Accuracy of ATAC-Seq deconvolution is determined by the abundance and specificity of each cell type” and has been expanded to discuss the accuracy of EPIC-ATAC predictions within each major cell type.
To do so, we represented in Figure 5A the performances of EPIC-ATAC in each cell type present in the benchmarking datasets from Figures 3 and 4. Additionally, we have kept in the supplementary figures the details of the correlation values and RMSE values within each cell type and for each tool (Supplementary Figures 9 and 10). The following text has been added in the main text to describe these analyses:
“Accuracy of ATAC-Seq deconvolution is determined by the abundance and specificity of each cell type
To investigate the impact of cell type abundance on the accuracy of ATAC-Seq deconvolution, we evaluated EPIC-ATAC predictions in each major cell type separately in the different benchmarking datasets (Figure 5A). NK cells, endothelial cells, neutrophils or dendritic cells showed lower correlation values. These values can be explained by the fact that these cell types are low-abundant in our benchmarking datasets (Figure 5A). For the endothelial cells and dendritic cells, the RMSE values associated to these cell types remain low. This suggests that while the predictions of EPIC-ATAC might not be precise enough to compare these cell-type proportions between different samples, the cell-type quantification within each sample is reliable. For the NK cells and the neutrophils, we observed more variability with higher RMSE values in some datasets which suggests that the markers and profiles for these cell types might be improved. Supplementary Figures 9 and 10 detail the performances of each tool when considering each cell type separately in the PBMC and the cancer datasets. As for EPIC-ATAC, the predictions from the other deconvolution tools are more reliable for the frequent cell types.”
(2) In the benchmarking analysis, EPIC-ATAC is compared to several deconvolution methods, most of which were originally developed for transcriptomics data. This comparison is not completely fair unless their peculiarities and the limitations of tweaking them to work with ATAC-seq data are discussed. For instance, some methods (including the original EPIC) correct for cell-type-specific mRNA bias, which is not present in ATAC-seq data and might, thus, result in systematic errors.
We thank the reviewer for this comment and have updated the results and methods sections as follows:
We provide in the Materials and methods section, the paragraph “Benchmarking of the EPIC-ATAC framework against other existing deconvolution tools” which describes how each tool included in the benchmark was used in the ATAC-Seq context. We have added a reference to this section in the main text when introducing the first benchmarking analysis.
For each tool, the main changes consisted in: (i) replacing the initial RNA-Seq profiles and markers by the EPIC-ATAC reference profiles and markers and (ii) providing as input a bulk ATAC-Seq dataset with matched ATAC-Seq features (the same approach as the one used in EPIC-ATAC was considered, see answer to the next comment). Having reference profiles/markers and an ATAC-Seq bulk query with matched features was the only requirement of the different deconvolution models to be able to run on ATAC-Seq data with the default methods parameters, except for quanTIseq. Indeed, this method, like EPIC, corrects its estimations for cell-type-specific mRNA content bias. We have disabled this option for the bulk ATAC-Seq deconvolution.
We can however not exclude that a hyper parametrization of each tool could have helped to improve their current performances. Also, for RNA-Seq data deconvolution, some of the methods followed specific features filtering, e.g., the quanTIseq framework removes a manually curated list of noisy genes as well as aberrant immune genes identified in the TCGA data and ABIS uses immune-specific housekeeping genes. We can hypothesize that additional filtering could be explored for the ATAC-Seq deconvolution to improve the performance of the tools.
We have clarified these points in the results section when introducing the benchmarking, in the methods and in the discussion section.
(3) On a similar note, it could be made more explicit which adaptations were introduced in EPIC, besides the ad-hoc ATAC-seq signature, to make it applicable to this type of data.
In the first version of the manuscript, we described the changes brought to EPIC to perform bulk ATAC-Seq deconvolution in the Material and methods section in the paragraph “Running EPIC-ATAC on bulk ATAC-Seq data”. We have moved and completed this paragraph in the results section before the description of the evaluation of EPIC-ATAC in different datasets. The paragraph is the following:
“EPIC-ATAC integrates the marker peaks and profiles into EPIC to perform bulk ATAC-Seq data deconvolution
The cell-type specific marker peaks and profiles derived from the reference samples were integrated into the EPIC deconvolution tool (Racle et al., 2017; Racle and Gfeller, 2020). We will refer to this ATAC-Seq deconvolution framework as EPIC-ATAC. To ensure the compatibility of any input bulk ATAC-Seq dataset with the EPIC-ATAC marker peaks and reference profiles, we provide an option to lift over hg19 datasets to hg38 (using the liftOver R package) as the reference profiles are based on the hg38 reference genome. Subsequently, the features of the input bulk matrix are matched to our reference profiles’ features. To match both sets of features, we determine for each peak of the input bulk matrix the distance to the nearest peak in the reference profiles peaks. Overlapping regions are retained and the feature IDs are matched to their associated nearest peaks. If multiple features are matched to the same reference peak, the counts are summed. Before the estimation of the cell-type proportions, we transform the data following an approach similar to the transcripts per million (TPM) transformation which has been shown to be appropriate to estimate cell fractions from bulk mixtures in RNA-Seq data (Racle et al., 2017; Sturm et al., 2019). We normalize the ATAC-Seq counts by dividing counts by the peak lengths as well as samples depth and rescaling counts so that the counts of each sample sum to 106. In RNA-Seq based deconvolution, EPIC uses an estimation of the amount of mRNA in each reference cell type to derive cell proportions while correcting for cell-type-specific mRNA bias. For the ATAC-Seq based deconvolution these values were set to 1 to give similar weights to all cell-types quantifications. Indeed ATAC-Seq measures signal at the DNA level, hence the quantity of DNA within each reference cell type is similar.”
(4) Given that the final applicability of EPIC-ATAC is on real bulk RNA-seq data, whose characteristics might not be completely recapitulated by pseudo-bulk samples, it would be interesting to see EPIC and EPIC-ATAC compared on a dataset with matched, real bulk RNA-seq and ATAC-seq, respectively. It would nicely complement the analysis of Figure 7 and could be used to dissect the commonalities and peculiarities of these two approaches.
We thank the reviewer for raising this important point. EPIC-ATAC will be applied to real bulk ATAC-Seq data and pseudobulk data cannot indeed fully recapitulate the bulk signals. Recently, a dataset composed of more than 100 samples with matched bulk RNA-Seq, bulk ATAC-Seq as well as matched flow cytometry data has been published by Morandini and colleagues in GeroScience in November 2023. We thus retrieved these data to compare the predictions obtained by EPIC-ATAC on the bulk ATAC-Seq data and the predictions of the original version of EPIC on the bulk RNA-Seq data to the cell-type quantification obtained by flow cytometry. We also assessed whether both modalities could be complementary using a simple approach averaging the predictions obtained from both modalities. The results of these analyzes have been summarized in the Figure 7C and are described in the main text in the last paragraph of the paper:
“We compared the predictions obtained using each modality to the flow cytometry cell-type quantifications. EPIC-ATAC predictions were better correlated with the flow cytometry measures for some cell types (e.g., CD8+, CD4+ T cells, NK cells) while this trend was observed with the EPIC-RNA predictions in other cell types (B cells, neutrophils, monocytes) (Figure 7C). We then tested whether the predictions obtained from both modalities could be combined to improve the accuracy of each cell-type quantification. Averaging the predictions obtained from both modalities shows a moderate improvement (Figure 7C), suggesting that the two modalities can complement each other.”
Reviewer #2 (Public Review):
Summary:
The manuscript expands the current bulk sequencing data deconvolution toolkit to include ATAC-seq. The EPIC-ATAC tool successfully predicts accurate proportions of immune cells in bulk tumour samples and EPIC-ATAC seems to perform well in benchmarking analyses. The authors achieve their aim of developing a new bulk ATAC-seq deconvolution tool.
Strengths:
The manuscript describes simple and understandable experiments to demonstrate the accuracy of EPIC-ATAC. They have also been incredibly thorough with their reference dataset collections. The authors have been robust in their benchmarking endeavours and measured EPIC-ATAC against multiple datasets and tools.
Weaknesses:
Currently, the tool has a narrow applicability in that it estimates the percentage of immune cells in a bulk ATAC-seq experiment.
Comments:
(1) Has any benchmarking been done on the runtime of the tool? Although EPIC-ATAC seems to "win" in benchmarking metrics, sometimes the differences are quite small. If EPIC-ATAC takes forever to run, compared to another tool that is a lot quicker, might some people prefer to sacrifice 0.01 in correlation for a quicker running tool?
We thank the reviewer for raising this point that was not addressed in the manuscript. We have added a supplementary figure (Supplementary Figure 8) which represents the CPU time used by each tool. The figure shows that all the tools could be run in less than 20 seconds in average. This figure has been mentioned at the end of the benchmarking paragraphs.
(2) In Figure 3B the data points look a bit squashed in the bottom-left corner. Could the plot be replotted with the data point spread out? There also seems to be some inter-patient variability. Could the authors comment on that?
We have updated Figure 3B to increase the visibility of the dots in the bottom-left corner. To do so, we have limited the x and y axes to the maximum of the predicted proportions for the y axis and true proportions for the x axis.
We also acknowledge that the accuracy of the predictions varies across samples. In particular, one sample (Sample4, star shape on Figure 3B) exhibits larger discrepancies between EPIC-ATAC predictions and the ground truth. To understand the lower performance, we have visualized our marker peaks in the five PBMC samples (Figure below). Based on this visualization, we can see that Sample4 might be an outlier sample considering that its cellular composition is similar to that of Sample2 and Sample5, however this sample shows particularly high ATAC-Seq accessibility at the monocytes and dendritic markers. This can explain why EPIC-ATAC overestimates the proportions of the two populations in this case. We have added the previously mentioned figures as a Supplementary Figure (Supplementary Figure 2) and have described it in the results section in the paragraph “EPIC-ATAC accurately estimates immune cell fractions in PBMC ATAC-Seq samples”.
(3) Could the authors comment on the possibility of expanding EPIC-ATAC into more than a percentage prediction tool? Perhaps EPIC-ATAC could remove the immune cell signal from the bulk ATAC-seq data to "purify" the uncharacterised cells in silico, or generate pseudo-ATAC-seq tracks of the identified cell types.
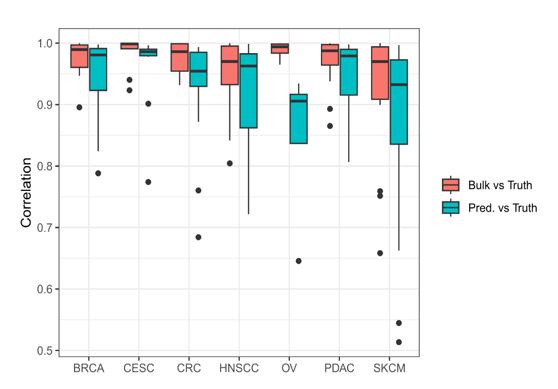
We thank the reviewer for this interesting question. As suggested by the reviewer, one approach to purify bulk genomics data using the cell-type proportions estimated by a cell-type deconvolution tool is to subtract the weighted sum of the signal observed in the reference data, weights corresponding to the predicted proportions. We used this approach on the EPIC-ATAC predictions obtained from pseudobulks built from scATAC-Seq data from diverse cancer types coming from the Human Tumor Atlas Network (HTAN) (See also the answer of the first recommendation of Reviewer 1). This dataset allows us to compare for a relatively large number of samples (a maximum of 25 samples in a cancer type cohort) the purified signal to the true signal derived from the single-cell data. The results are presented in the figure below which shows that the correlations between the predicted and true signals are relatively good in most of the cancer types (blue boxplots). However, these correlation levels are lower than the ones obtained when comparing the signal obtained from the entire pseudobulk (red boxplots) with the true signal. This suggests that this purification approach leads to a signal that is less precise and accurate than the signal resulting from all cells mixtures.
Author response image 1.
Boxplots of the correlation values obtained from the comparison of the bulk signal and the ground truth signal from the uncharacterized cells in each sample (red) and from the comparison of the predicted signal and the ground truth signal from the uncharacterized cells in each sample (blue).
Also, note that in our simple approach, negative values can be obtained. The predicted signal will thus be difficult to interpret and to use in downstream analyses. Methods claiming to perform purification of bulk samples use more complex and dedicated algorithms. For example, Symphony (Burdziak et al., 2019) (cited in our introduction) uses single-cell RNA-Seq data in addition to the bulk chromatin accessibility data to infer cluster-specific accessibility profiles. Considering that EPIC was not designed for purification purposes, we decided not to include this analysis in the updated version of the manuscript.
Recommendations For The Authors:
Reviewer #1 (Recommendations For The Authors):
(1) The original EPIC had two different signatures for application to blood or tumor RNA-seq. It is not clear instead if EPIC-ATAC applies with the same signature and framework to any tissue and disease context. This aspect should be clarified in the text.
We thank the reviewer for raising this point which was not clear in the previous version of the manuscript. As in the original version of EPIC, in EPIC-ATAC two reference profiles and sets of markers are available, the PBMC reference and the TME reference. We used the PBMC reference profiles and markers to deconvolve the PBMC samples and the TME reference profiles and markers to deconvolve the cancer samples. We have clarified this point in the result section of the main text in the paragraph “ATAC-Seq data from sorted cell populations reveal cell-type specific marker peaks and reference profiles” as follows (added text underlined):
“The resulting marker peaks specific only to the immune cell types were considered for the deconvolution of PBMC samples (PBMC markers). For the deconvolution of tumor bulk samples, the lists of marker peaks specific to fibroblasts and endothelial cells were added to the PBMC markers. This extended set of markers was further refined based on the correlation patterns of the markers in tumor bulk samples from the diverse solid cancer types from The Cancer Genome Atlas (TCGA) (Corces et al., 2018), i.e., markers exhibiting the highest correlation patterns in the tumor bulk samples were selected using the findCorrelation function from the caret R package (Kuhn, 2008) (Figure 1, box 4, see the Material and methods, section 2). The latter filtering ensures the relevance of the markers in the TME context since cell-type specific TME markers are expected to be correlated in tumor bulk ATAC-Seq measurements (Qiu et al., 2021). 716 markers of immune, fibroblasts and endothelial cell types remained after the last filtering (defined as TME markers). Considering the difference in cell types and the different filtering steps applied on the PBMC and TME markers, we recommend to use the TME markers and profiles to deconvolve bulk samples from tumor samples and the PBMC markers and profiles to deconvolve PBMC samples.”
We also note that when running EPIC-ATAC using the PBMC markers and the TME markers independently to perform the deconvolution of the cancer datasets, we see that overall the use of the TME markers leads to a better performance (Figure below).
Figure legend: Correlation and RMSE values obtained when running EPIC-ATAC on each cancer dataset (points) using the PBMC (red) and the TME (blue) markers.
To demonstrate that the TME markers can be applied to different cancer types, we have completed the evaluation of EPIC-ATAC on tumor samples by considering an additional dataset: the Human Tumor Atlas Network (HTAN) single-cell multiomic (scRNA-Seq and scATAC-Seq) dataset. We have processed this dataset and built scATAC-Seq pseudobulks for 7 cancer types on which EPIC-ATAC was applied to. This analysis has been summarized in Figure 4 and Supplementary Figure 4 and shows that EPIC-ATAC is applicable in a diverse set of tissues.
(2) EPIC and EPIC-ATAC have a valuable feature, which is absent from most deconvolution methods: the estimation of unknown content. It would be informative for the users to understand from the benchmarking analysis whether this feature gives an advantage to EPIC-ATAC with respect to the other approaches.
Indeed, among the tools that we included in our benchmarking analysis, only EPIC-ATAC and quanTIseq enable users to predict the proportions of cells that are not present in the reference profiles, i.e., the uncharacterized cells. For the other tools we thus fixed the estimated proportions of uncharacterized cells to 0. This approach provides a clear and significant advantage to EPIC-ATAC and to quanTIseq. For this reason, we also provide a version of the benchmarking in which we exclude the uncharacterized cells and rescale the true and estimated cell-type proportions to sum to 1. In this second benchmarking approach, EPIC-ATAC still outperforms some of the other deconvolution tools.
We have clarified this point in the results section, in the paragraph “EPIC-ATAC accurately predicts fractions of cancer and non-malignant cells in tumor samples”.
(3) The selection of the most discriminative markers is very well described in the text and beautifully illustrated in Figure 2. However, it is unclear why UMAP plots are used to represent cell-type similarities and dissimilarities. Would a linear dimensionality reduction approach like PCA be already sufficient to show these groups, especially considering the not-so-extreme dimensionality of the underlying data? In addition, a statistic that could be also considered to compare clusters to the cell type labels in the two scenarios is the Adjusted Rand Index (ARI).
We thank the reviewer for this relevant comment. We initially used UMAP to facilitate the visualization of the different cell-type groups. However, it is true that the three first axes of the principal component analyses performed based on each set of marker peaks already capture most of the structure in the data and that the use of UMAP can lead to an artificial enhancement of separation between the different groups of cells. We have updated Figure 2B by replacing the UMAP scatter plots by 3D representations of the first three principal components of the PCA and have added in Supplementary Figure 1B the pairwise scatter plots of these first 3 principal components. On the main figures, we have also added the ARI metric comparing the cell-type annotation and the clustering obtained using the first 10 axes of the PCA and model based clustering.
(4) In the introduction, it is stated that "the reasonable cost and technical advantages of these protocols foreshadow an increased usage of ATAC-Seq in cancer studies". I would suggest adding a reference to justify this trend. Also, it should be discussed how ATAC-seq deconvolution compares to other types of deconvolution approaches applied to cheaper epigenetic data like methylation one (e.g. epidish, methylcc, tca, minfi).
We have complemented this sentence with two references to justify the assertion: (i) a review published by Luo, Gribskov and Wang in 2022 showing the increasing number of ATAC-Seq studies in the field of cancer research, and (ii) a protocol paper from Grandi et al. published in 2022 on the state-of-the-art Omni-ATAC protocol for ATAC-sequencing which discusses the broad applicability and the technical advantages of ATAC-sequencing. Also in the preceding sentence, a recent ATAC-Seq protocol that can be applied to FFPE samples has been mentioned, FFPE samples being the most common samples in clinical cancer research.
We agree with the reviewer on the fact that other epigenetic assays such as methylation assays are cost effective. However, ATAC-sequencing provides additional information on the epigenetic landscape of a sample’s genome and some questions regarding regulatory regions and transcription factor activity cannot be answered with methylation data. Methods that can be applied on ATAC-Seq data specifically are thus needed. Most of the cell-type deconvolution algorithms existing so far are applicable on RNA-Seq or methylation data. These algorithms often use similar methodological concepts, e.g., linear combination of the reference profiles for reference-based methods, which could be used in different modalities. However, methylation-based deconvolution tools often take as input a data format that is specific to methylation data, e.g., two color micro array data (RGChannelSet R object) for the minfi deconvolution function (estimatesCellCounts) or leverage methylation-specific information to perform the deconvolution. For example, methylCC uses a model based on latent variables representing a binarized measures of the methylation status of cell-type specific regions (1 or 0 for clearly methylated or unmethylated regions). Such methods are more difficult to adapt than tools based on RNA-Seq data where the signal is quantified using read counts similarly to ATAC-Seq data.
Nevertheless, some methods such as EPIdish or MethylCIBERSORT have proposed new methylation reference profiles and have used existing models that are not specific to methylation data to deconvolve the bulk data. In our work, we followed a similar approach where we propose new reference profiles specific to chromatin accessibility data, integrate them to an existing method EPIC as well as test them in other existing tools. Note that methylation reference profiles cannot be directly used for ATAC-Seq data deconvolution considering that methylation measures methylation status at CpG sites (dinucleotides) and ATAC-Seq measures the accessibility of regions of hundreds base pairs.
An analysis comparing the performance of methylation-based deconvolution and ATAC-Seq based deconvolution would be informative. However, such analysis is beyond the scope of our paper considering that none of the datasets used for our benchmarking provide these two modalities for the same samples.
In the manuscript, we have completed the references associated to the methylation-based deconvolution tools with the ones mentioned in the previous paragraphs and by the reviewer and have completed the discussion as follows:
“The comparison of EPIC-ATAC applied on ATAC-Seq data with EPIC applied on RNA-Seq data has shown that both modalities led to similar performances and that they could complement each other. Another modality that has been frequently used in the context of bulk sample deconvolution is methylation. Methylation profiling techniques such as methylation arrays are cost effective (Kaur et al., 2023) and DNA methylation signal is highly cell-type specific (Kaur et al., 2023; Loyfer et al., 2023). Considering that methylation and chromatin accessibility measure different features of the epigenome, additional analyses comparing and/or complementing ATAC-seq based deconvolution with methylation-based deconvolution could be of interest as future datasets profiling both modalities in the same samples become available.”
(5) In the Results section, some methodological steps could be phrased in a bit more extensive way to let the reader understand the rationale and the actual approach. I recognize there is also a reference to the Methods section, where all methodologies are reported in detail, but some of the sentences are hard to understand due to their synthetic format, e.g.: "markers with potential residual accessibility in human tissues were then filtered out".
We thank the reviewer for this comment and we have followed his recommendation to expand sentences with a synthetic format. Text changes and additions are underlined below:
“To limit batch effects, the collected samples were homogeneously processed from read alignment to peak calling. For each cell type, we derived a set of stable peaks observed across samples and studies, i.e. for each study, peaks detected in at least half of the samples were considered, and for each cell type, only peaks detected jointly in all studies were kept (see Materials and Methods, section 1).”
“To filter out markers that could be accessible in other human cell-types than those included in our reference profiles, we used the human atlas study (K. Zhang et al., 2021), which identified modules of open chromatin regions accessible in a comprehensive set of human tissues, and we excluded from our marker list the markers overlapping these modules (Figure 1, box 3, see Materials and Methods section 2).”
“For the deconvolution of tumor bulk samples, the lists of marker peaks specific to fibroblasts and endothelial cells were added to the PBMC markers. This extended set of markers was further refined based on the correlation patterns of the markers in tumor bulk samples from the diverse solid cancer types from The Cancer Genome Atlas (TCGA) (Corces et al., 2018), i.e., markers exhibiting the highest correlation patterns in the tumor bulk samples were selected using the findCorrelation function from the caret R package (Kuhn, 2008) (Figure 1, box 4, see the Material and methods, section 2).”
Also, following the comments and recommendations of the Reviewer 1, we have: (i) moved the method section describing the adaptation of EPIC to ATACseq data to provide more details in the results section (see answer to the third comment of Reviewer 1), (ii) clarified how the existing tools used in the benchmarking analyses were adapted for ATAC-Seq deconvolution (see answer to the second comment of Reviewer 1), and (iii) detailed how the comparison between our estimations of the infiltration levels in the samples from Kumegawa et al. and the estimations from the original study was performed (see answer to the seventh recommendation of Reviewer 1).
(6) In the main text, it is stated that "the list of markers was further refined based on the correlation patterns of the markers in tumor bulk samples from diverse cancer types from The Cancer Genome Atlas". It should be clarified if these are only solid cancers, or if blood cancers were also used.
We have considered only the solid cancers and have clarified this point in the results section: “This extended set of markers was further refined based on the correlation patterns of the markers in tumor bulk samples from the diverse solid cancer types from The Cancer Genome Atlas”.
(7) When reporting that "these predictions are consistent with the infiltration level estimations reported in the original publication", it should be mentioned how the infiltration levels were quantified in this publication and how this agreement was quantified. This would be important also to claim in the abstract that "EPIC-ATAC accurately infers the immune contexture of the main breast cancer subtypes".
We thank the reviewer for this comment, we acknowledge that the agreement between the EPIC-ATAC predictions and the infiltration levels quantified in the original publication should be further described in the paper. We have expanded the text in the results section in the paragraph “EPIC-ATAC accurately infers the immune contexture in a bulk ATAC-Seq breast cancer cohort” to clarify this point. Additionally, we have added a panel in Figure 6 (panel A) which shows a good agreement between EPIC-ATAC predictions and the metric used in the original paper to evaluate the infiltration levels of different cell types.
The added text is underlined below:
“We applied EPIC-ATAC to a breast cancer cohort of 42 breast ATAC-Seq samples including samples from two breast cancer subtypes, i.e., 35 oestrogen receptor (ER)-positive human epidermal growth factor receptor 2 (HER2)-negative (ER+/HER2-) samples and 7 triple negative (TNBC) tumors (Kumegawa et al., 2023). No cell sorting was performed in parallel to the chromatin accessibility sequencing. For this reason, the authors used a set of cell-type-specific cis-regulatory elements (CREs) identified in scATAC-Seq data from similar breast cancer samples (Kumegawa et al., 2022) and estimated the amount of infiltration of each cell type by averaging the ATAC-Seq signal of each set of cell-type-specific CREs in their samples. We used EPIC-ATAC to estimate the proportions of different cell types of the TME. These predictions were then compared to the metric used by Kumegawa and colleagues in their study to infer levels of infiltration. A high correlation between the two metrics was observed for each cell type (Pearson’s correlation coefficient from 0.5 for myeloid cells to 0.94 for T cells, Figure 6A).”
(8) It should be made explicit if EPIC-ATAC quantifies mDC, pDC, or their sum.
In our collection of reference ATAC-Seq samples from which the markers and profiles have been derived, mDCs and pDCs were both included in the dendritic cells. EPIC-ATAC thus quantifies the total amount of dendritic cells, i.e., mDCs and pDCs included. We have added a sentence in the main text to clarify this point:
To identify robust chromatin accessibility marker peaks of cancer relevant cell types, we collected 564 samples of sorted cell populations from twelve studies including eight immune cell types (B cells […] dendritic cells (DCs) (mDCs and pDCs are grouped in this cell-type category) […] and endothelial (Liu et al., 2020; Xin et al., 2020) cells (Figure 1 box 1, Figure 2A, Supplementary Table 1).
Reviewer #2 (Recommendations For The Authors):
The authors should double-check the naming of tools is done correctly e.g. ChIPSeeker has been spelled incorrectly in some instances throughout the manuscript.
We thank the reviewer for pointing out this mistake and have corrected the mistake in the main text.


