The evolution of drug resistance in clinical isolates of Candida albicans
- Broad Institute of MIT and Harvard, United States
- University of Minnesota, United States
- Worcester Polytechnic Institute, United States
- University of Missouri at Kansas City, United States
- Tel Aviv University, Israel
- Howard Hughes Medical Institute, Massachusetts Institute of Technology, United States
Figures
Figure 1 with 1 supplement
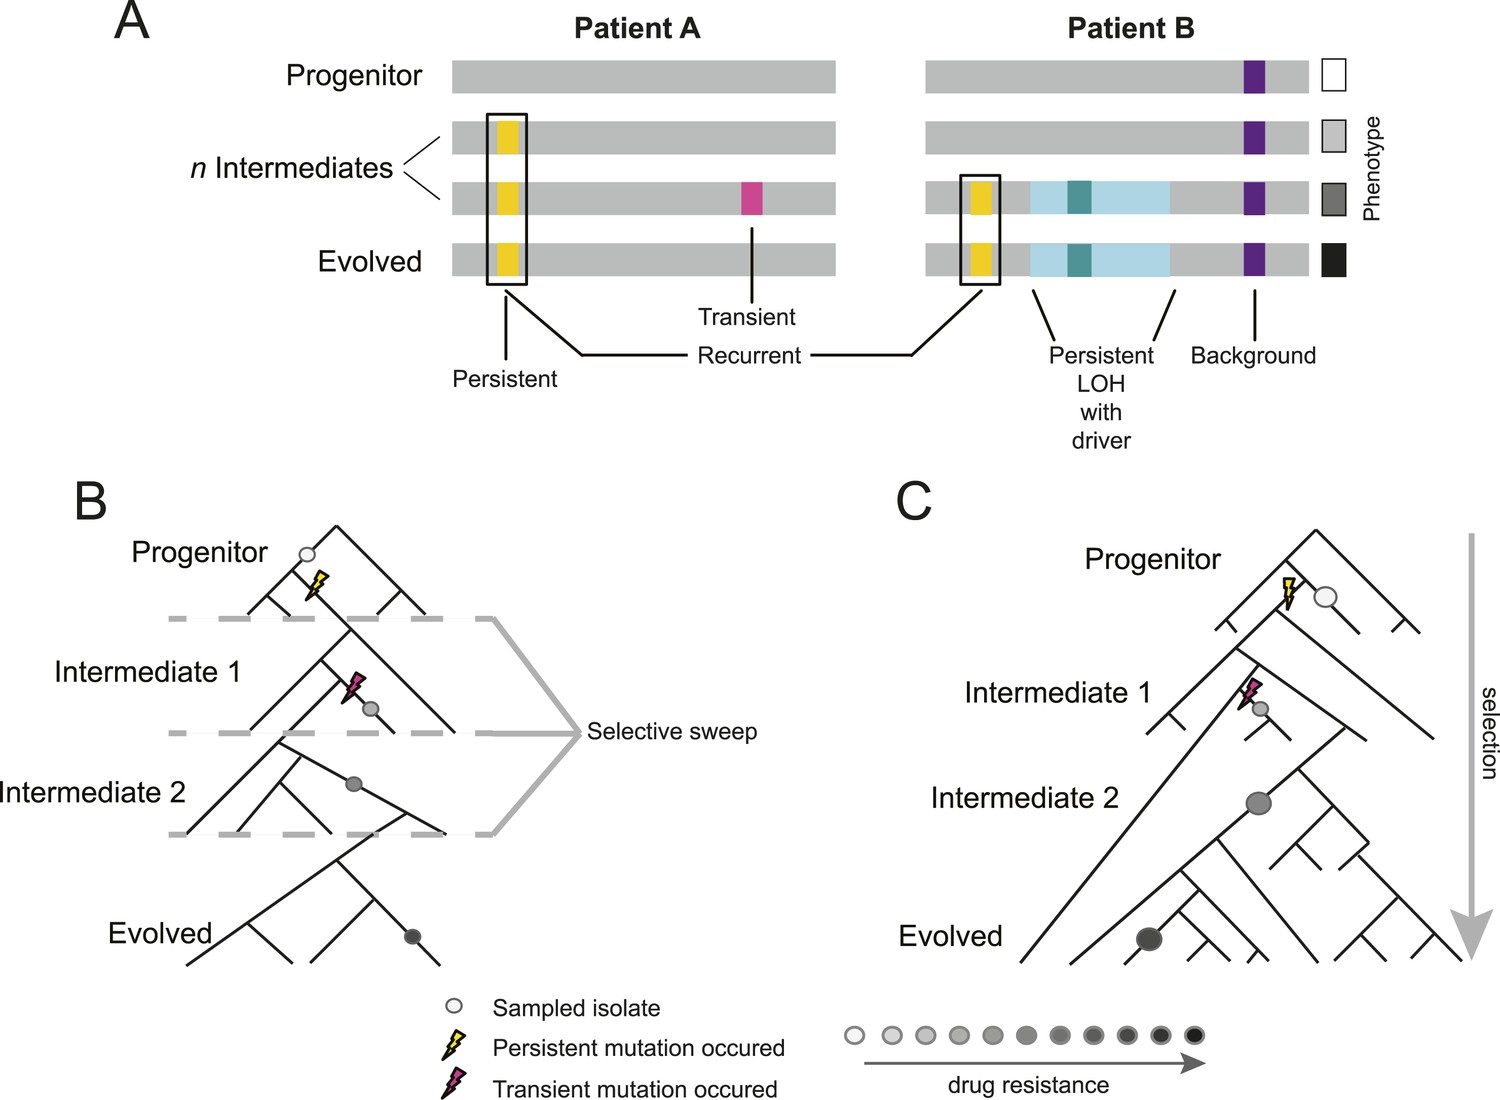
Overview of study design.
(A) Background, persistent, transient, recurrent, and driver mutations in patient time courses. Shown is a schematic illustration of the genomes of isolates (gray bars) from two patient time courses (Patient A and B, left and right panels, respectively), ordered from the first isolate (progenitor, top) to the last (evolved, bottom). Background mutations (purple) exist in the all isolates; persistent mutations (yellow) are not in the progenitor, but found in all subsequent isolates after their first occurrence; transient mutations (pink) are not in the progenitor and only in some later isolates; recurrently polymorphic genes contain persistent mutations that occur in the same gene in more than one patient (black box). LOH events were also evaluated for persistence (light teal bar). Driver mutations, where a new persistent homozygous allele appears (e.g., G/T > A/A), are annotated in association with persistent LOH events (dark teal) and independent of these events (not shown). Each of these can be associated with a change in phenotype, such as drug resistance (boxes, right). (B) Sampling in the context of de novo mutation and selection bottlenecks. Each strain is a single clone (circle) isolated from an evolving population (represented by a phylogenetic tree). The population evolves and undergoes selective sweeps (dashed lines), with phenotypic changes occurring during the course of infection and treatment (i.e., drug resistance, black: high, white: low; gray scale at bottom). Persistent mutations (yellow lightning bolt) have likely swept through the population, whereas transient mutations (pink lightning bolt) have not. (C) Sampling in the context of selection on existing variation. Selection acts to vary the frequency of different pre-existing genotypes in the population. Persistent mutations (yellow lightning bolt) have risen in the population to a frequency that they are repeatedly sampled (large circles) whereas transient mutations (pink lightning bolt) have not (small circle).
Figure 1—figure supplement 1
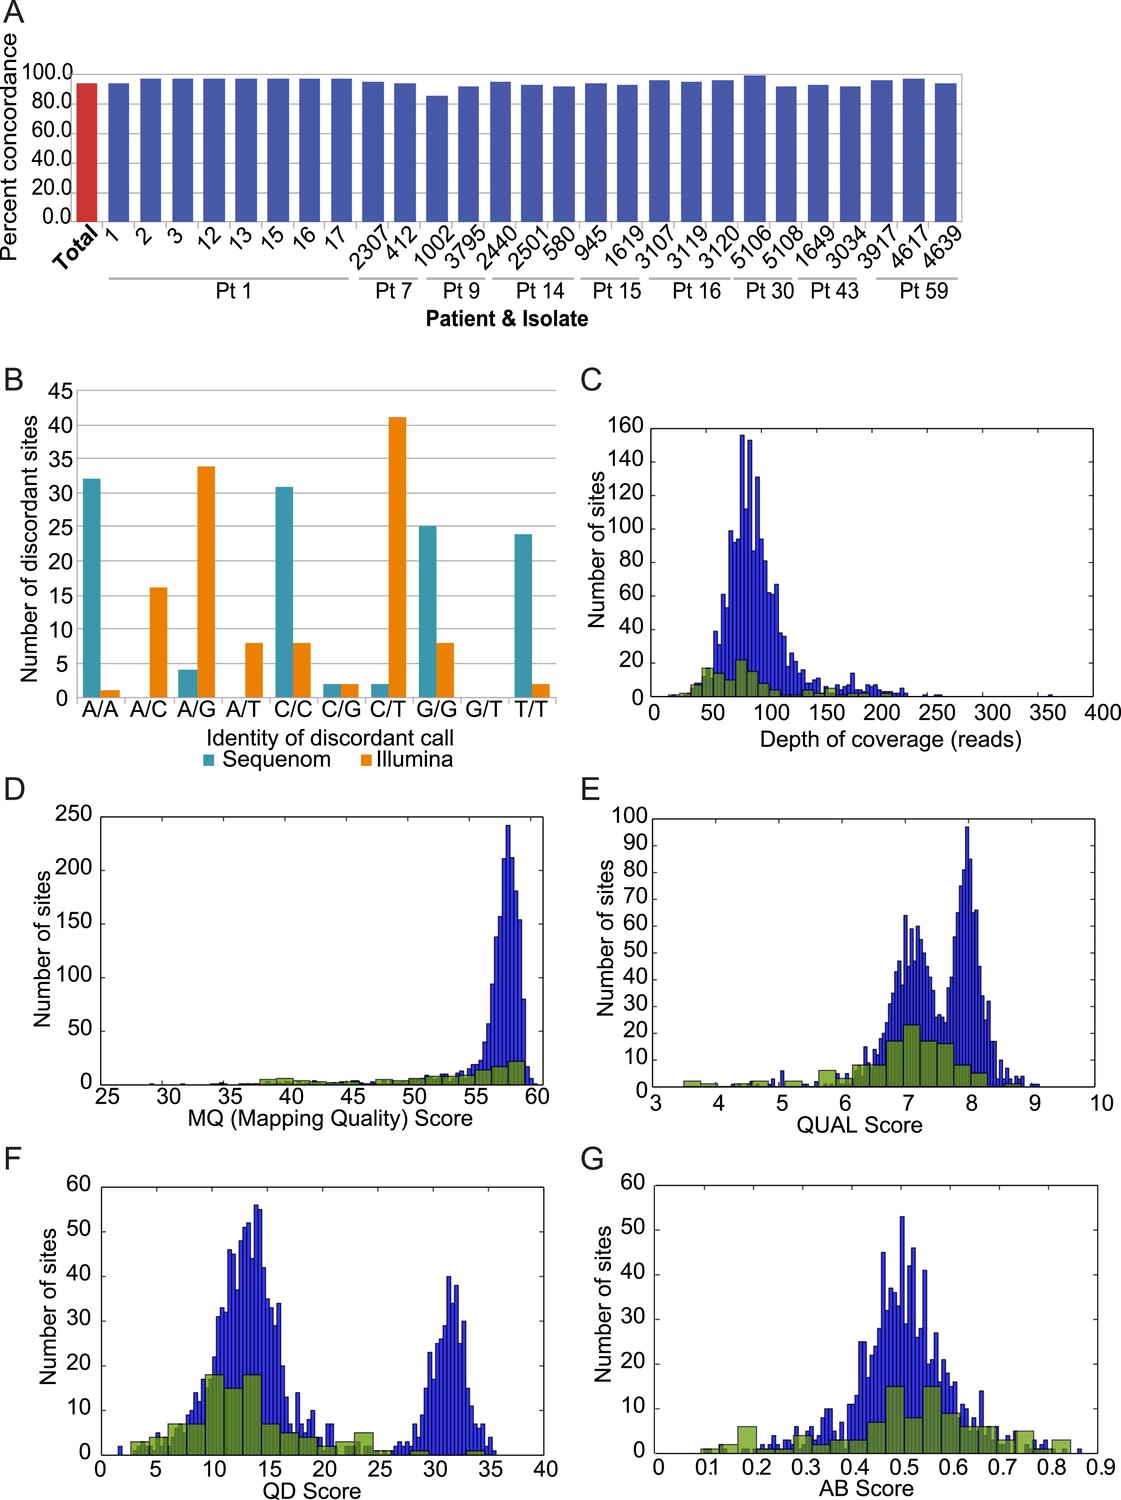
Analysis of discordant sites.
(A) Degree of concordance (Y axis) with Sequenom iPlex genotyping for 1973 SNP X strain combinations overall (leftmost red bar; 93.9%) and in each tested strain (X axis). (B) Shown are the classes of discordant sites by genotype as defined by Illumina (orange) or Sequenome (teal) (X axis) and the prevalence (Y axis) of that genotype call in Sequenom (blue) and Illumina (orange) based discordant calls. The most common discrepancies arose when Sequenom typing classified a site as homozygous, but Illumina sequencing identified it as heterozygous. (C–G) Comparison on distributions of quality features between concordant (blue bars) and discordant (green bars) sites: (C) depth of coverage, (D) RMS Mapping Quality (MQ) score, (E) PHRED scaled quality score for each base call, shown as log-normalized ‘QUAL’ scores, (F) quality by depth (QD) score for each variant site, and (G) the allele balance ratio (AB Score) for each variant site.
Figure 2 with 1 supplement
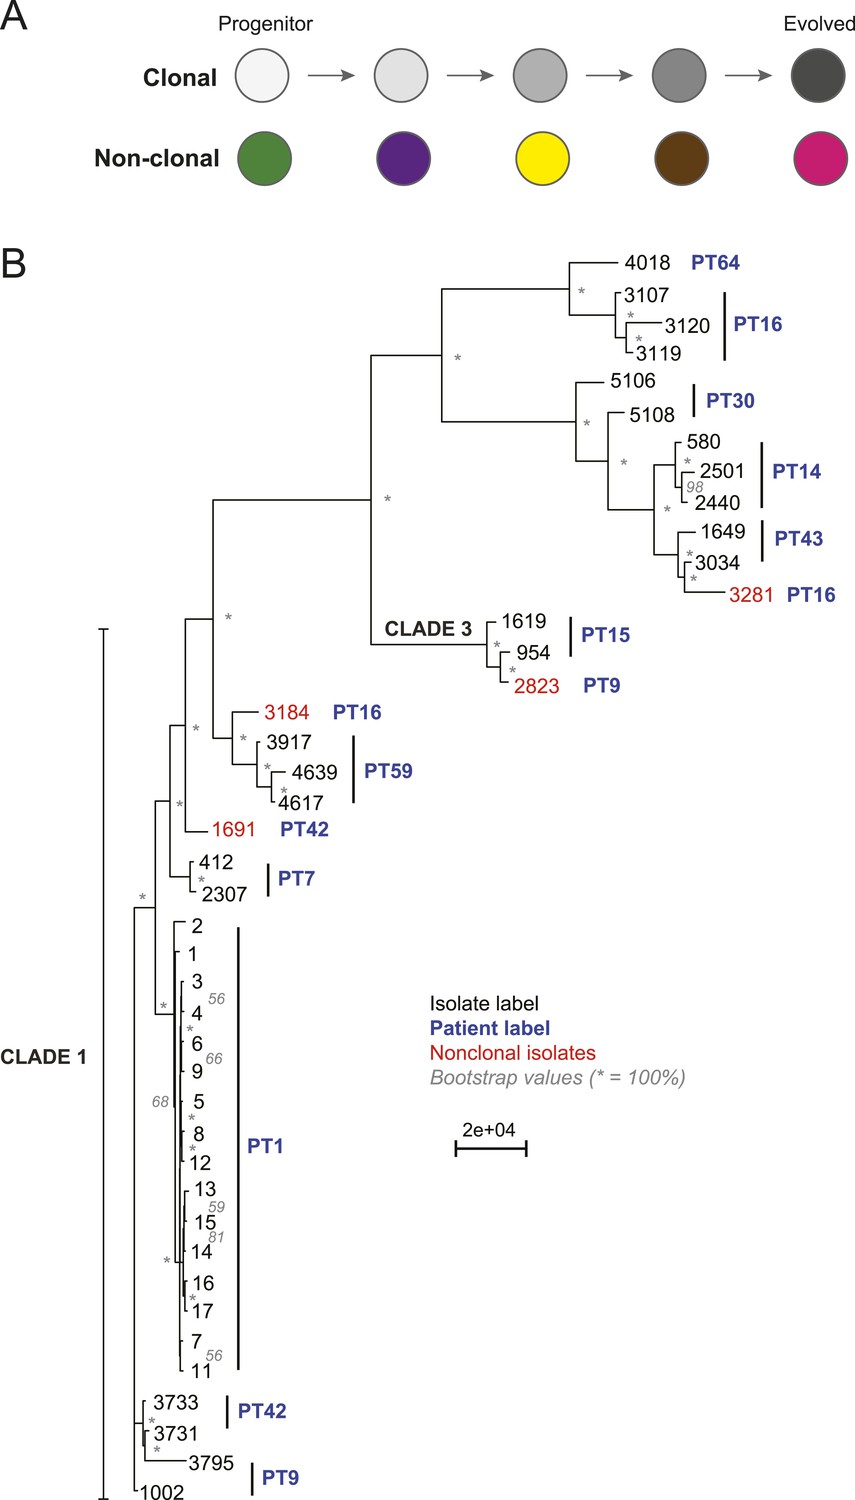
Most isolates from the same patient are clonal.
(A) Two possible models of infection may underlie serial isolates. In the ‘clonal model’ (top) each subsequent sample (circle) is related to the other isolates. In the non-clonal model (bottom) isolates in a series are un-related. (B) The phylogenetic relationship of the isolates (black) from 11 patients (blue) was inferred based on 201,793 informative SNP positions using maximum parsimony in PAUP*. Isolates from the same patient separated by a branch distance greater than 20,000 were considered non-clonal (3281, 2823, 3184, 1691, red). Most nodes were supported by 100% of 1000 bootstrap replicates (indicated by *), expect as indicated (in gray). Clade identifiers were included as appropriate.
-
Figure 2—source data 1
(A) SNP category summary and all patient-series SNPs SNP category summary.
Listed for each series (PT series SNP summary) are the number of filtered (‘Materials and methods’) coding and noncoding SNPs. Coding SNPs are further classified as synonymous or nonsynonymous. Noncoding SNPs are classified as intronic, promoter region (<800 bps from the start of an ORF), or general noncoding. Patient1–Patient 59: Listed is each base that is mutated in at least one isolate in the respective series. For this base, listed are the chromosomal position, the base in the SC5314 reference genome, the base in each isolate in the series (hyphen (‘-’): homozygous, same as reference; upper case: homozygous mutation; lower case: heterozygous mutation), whether the mutation is a background mutation, transient (trans) or persistent (pers), if it is upstream, downstream or within an ORF, and in the latter case, the effect on the amino acid sequence of the encoded protein. (B) Frequency of nonsynonymous SNP occurrence between serial isolates using different filters. All SNP arising aft prev: For each clinical series (PT1-PT59) listed are the number of ORFs in each chromosome (columns) containing for each isolate (rows) all the ‘newly arising’ SNPs, defined as those not present in the immediately preceding isolate (rows). All NS in ORF aft prev: the same as above, but only for NS SNPs. All SNPs are only outside of LOH regions. All instances of Pers NS SNPs: the same as above, but only for those NS SNPs that persist once they arose. All Rec SNP aft Prev: the same as above but restricted to those ORFs that contain persistent mutations in three or more clinical series.
- https://doi.org/10.7554/eLife.00662.008
Figure 2—figure supplement 1
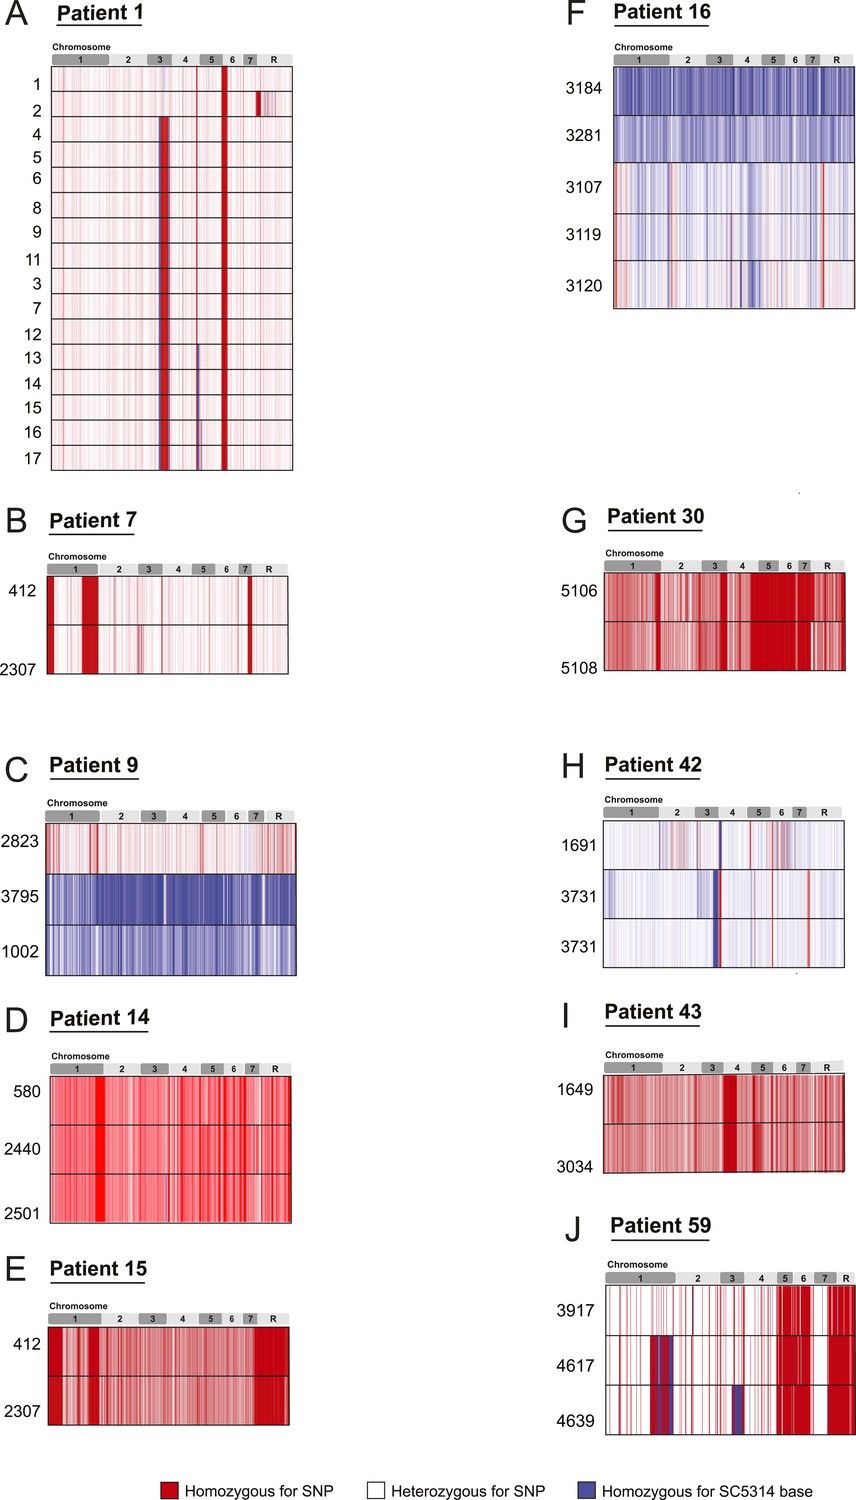
SNP heterozygosity profiles for each strain.
The heterozygosity profiles shows, in chromosomal order (top), each variant locus that exists in at least one strain in the series (white is a heterozygous SNP, blue is homozygous for the SC5314 allele, red is a homozygous SNP relative to SC5314). (A) Patient 1; (B) Patient 7; (C) Patient 9; (D) Patient 14; (E) Patient 15; (F) Patient 16; (G) Patient 30; (H) Patient 42; (I) Patient 43; (J) Patient 59. Only Patient 9 (C), Patient 16 (F), Patient 42 (H), and Patient 64 (not shown**) contain un-related isolates. ** Patient 64 contained an isolate (4380) whose genome aligned poorly to the C. albicans reference, but aligned well to C. dubliniensis.
Figure 3
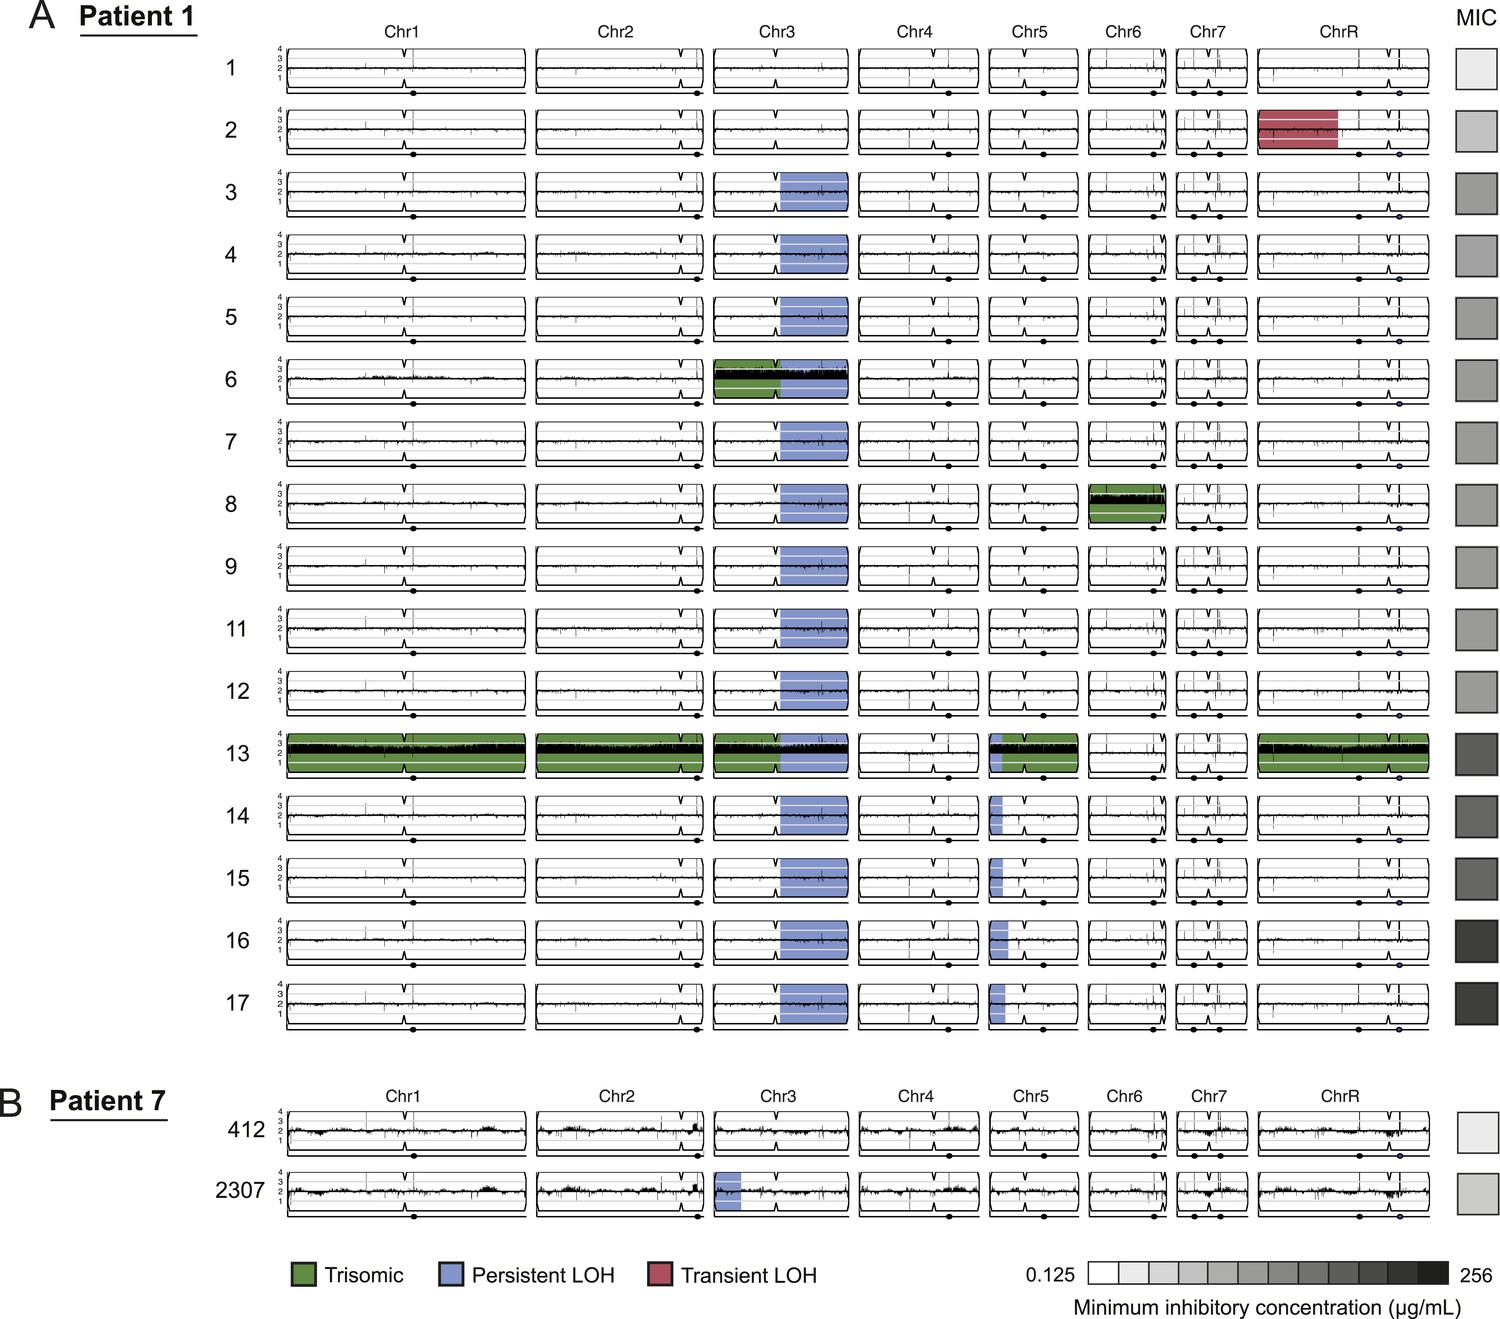
LOH events were often persistent while aneuploidies were often transient.
For each time series shown are the genomes of all isolates (rows) from a patient, ordered from the first isolate (progenitor, top) to the last (evolved, bottom). Boxes on right indicate the MIC of the respective strain (black: high, white: low; gray scale at bottom). Persistent LOHs: blue, transient LOHs: pink; trisomies (all transient): green. The sequence coverage along each chromosome is indicated by black tickmarks. (A) Patient 1 has four LOH events, each coinciding with an increase in MIC (gray scale boxes, right). One LOH is transient (isolate 2, chromosome R, pink) and three are persistent (isolate 3, chromosome 3; isolate 13, chromosome 5; and isolate 16, chromosome 5, blue). The ploidy changes (isolates 6, 8, 13) are all transient. (B) Patient 7 has one LOH event (isolate 2307, chromosome 3, blue) which coincides with an increase in MIC.
-
Figure 3—source data 1
Persistent LOH regions LOH map.
For each isolate (strain column) in each series (patient column), listed are the coordinates of any persistent LOH in that isolate. Coordinates in blue are persistent LOH events, coordinates in red are transient LOH events.
- https://doi.org/10.7554/eLife.00662.011
Figure 4
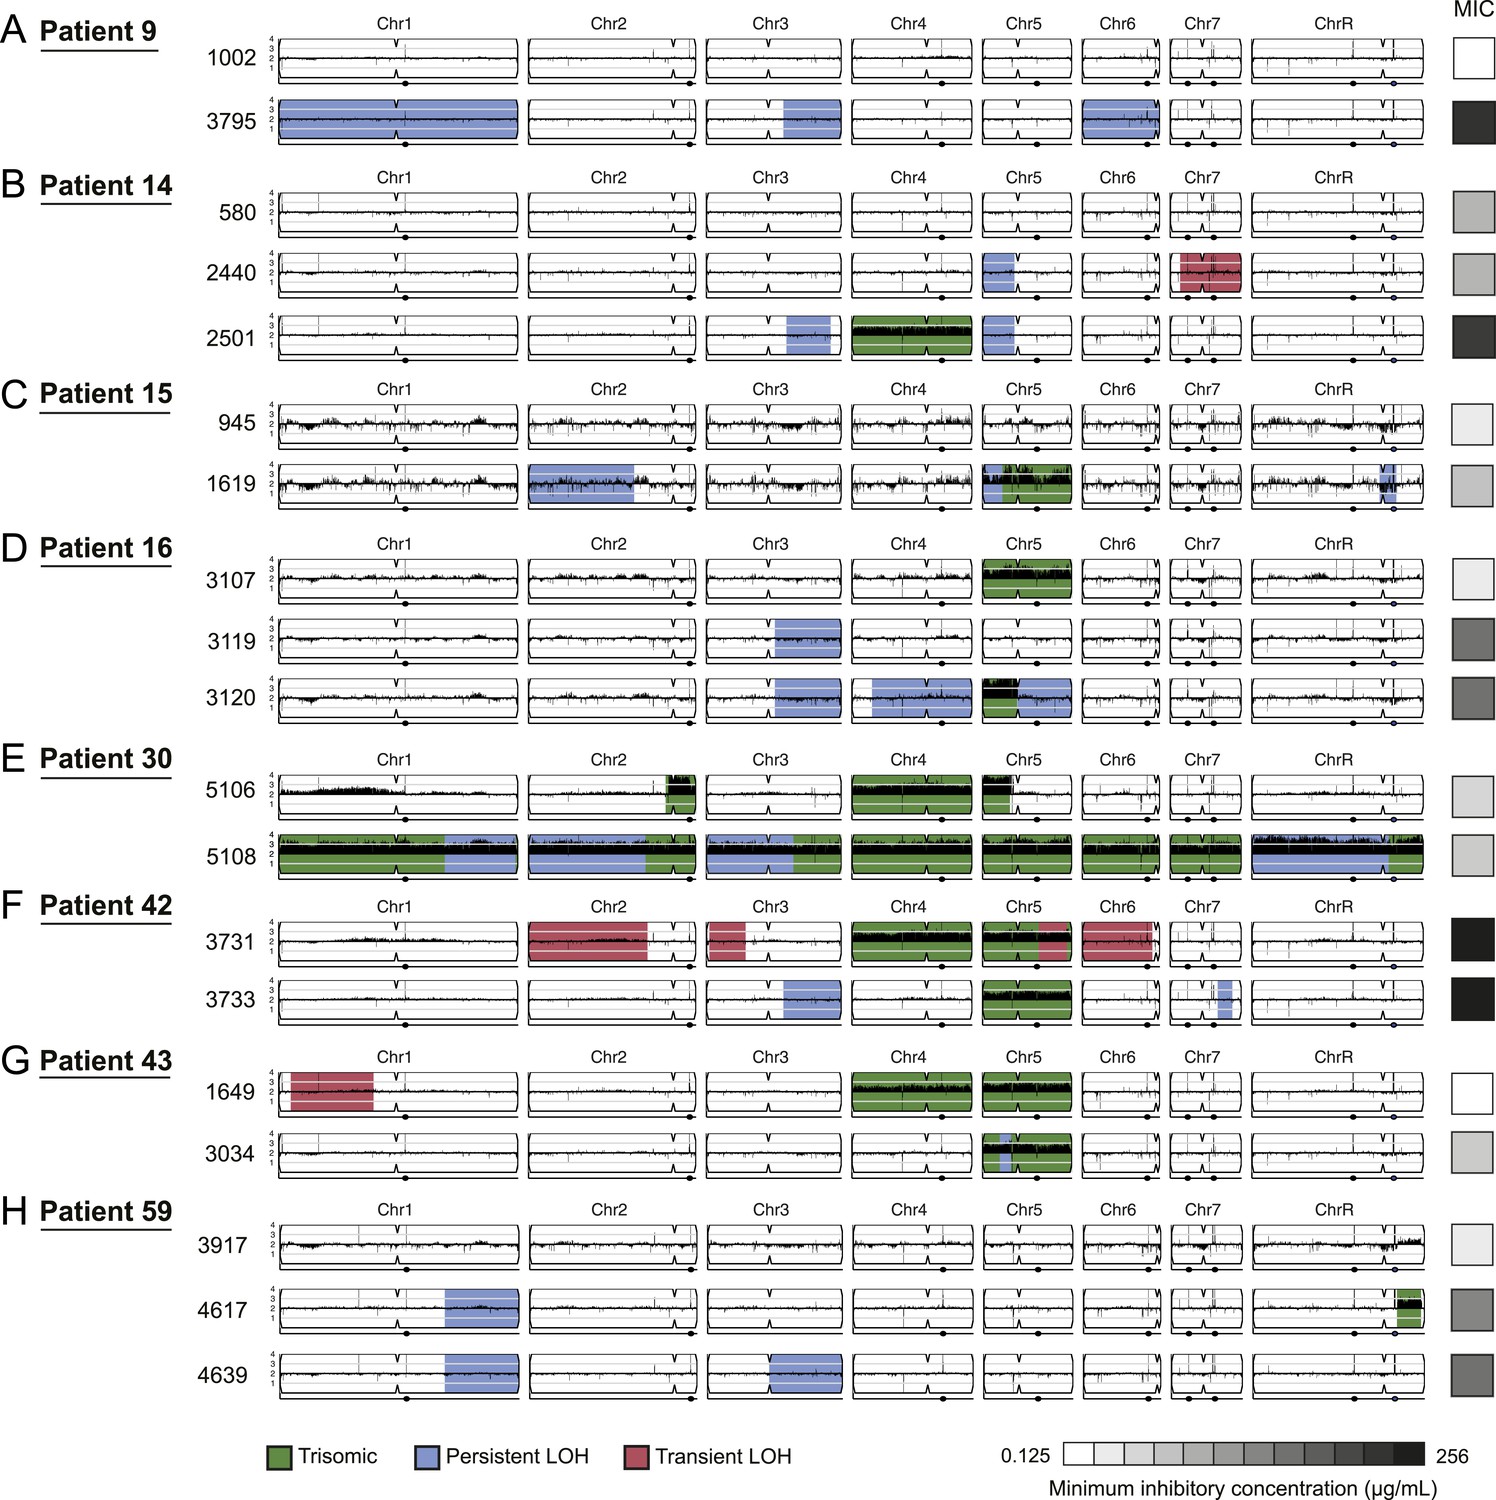
Persistent and transient LOH and aneuploidies.
For each time series shown are the genomes of all isolates (rows), ordered from the first isolate (progenitor, top) to the last (evolved, bottom). Boxes on right indicate the MIC of the respective strain (black: high, white: low, gray scale at bottom). Persistent LOHs: light blue, transient LOHs: pink; trisomies (all transient): green. The coverage along each chromosome is indicated by black tickmarks. (A) Patient 9; (B) Patient 14; (C) Patient 15; (D) Patient 16; (E) Patient 30; (F) Patient 42; (G) Patient 43; (H) Patient 59. Several LOHs are recurrent (right arm of chromosome 3, left arm of chromosome 5, and chromosome 1). Please note: data in Figure 3—source data 1 also applies to this figure.
-
Figure 4—source data 1
Persistent LOH regions LOH map.
For each isolate (strain column) in each series (patient column), listed are the coordinates of any persistent LOH in that isolate. Coordinates in blue are persistent LOH events, coordinates in red are transient LOH events.
- https://doi.org/10.7554/eLife.00662.013
Figure 5 with 1 supplement
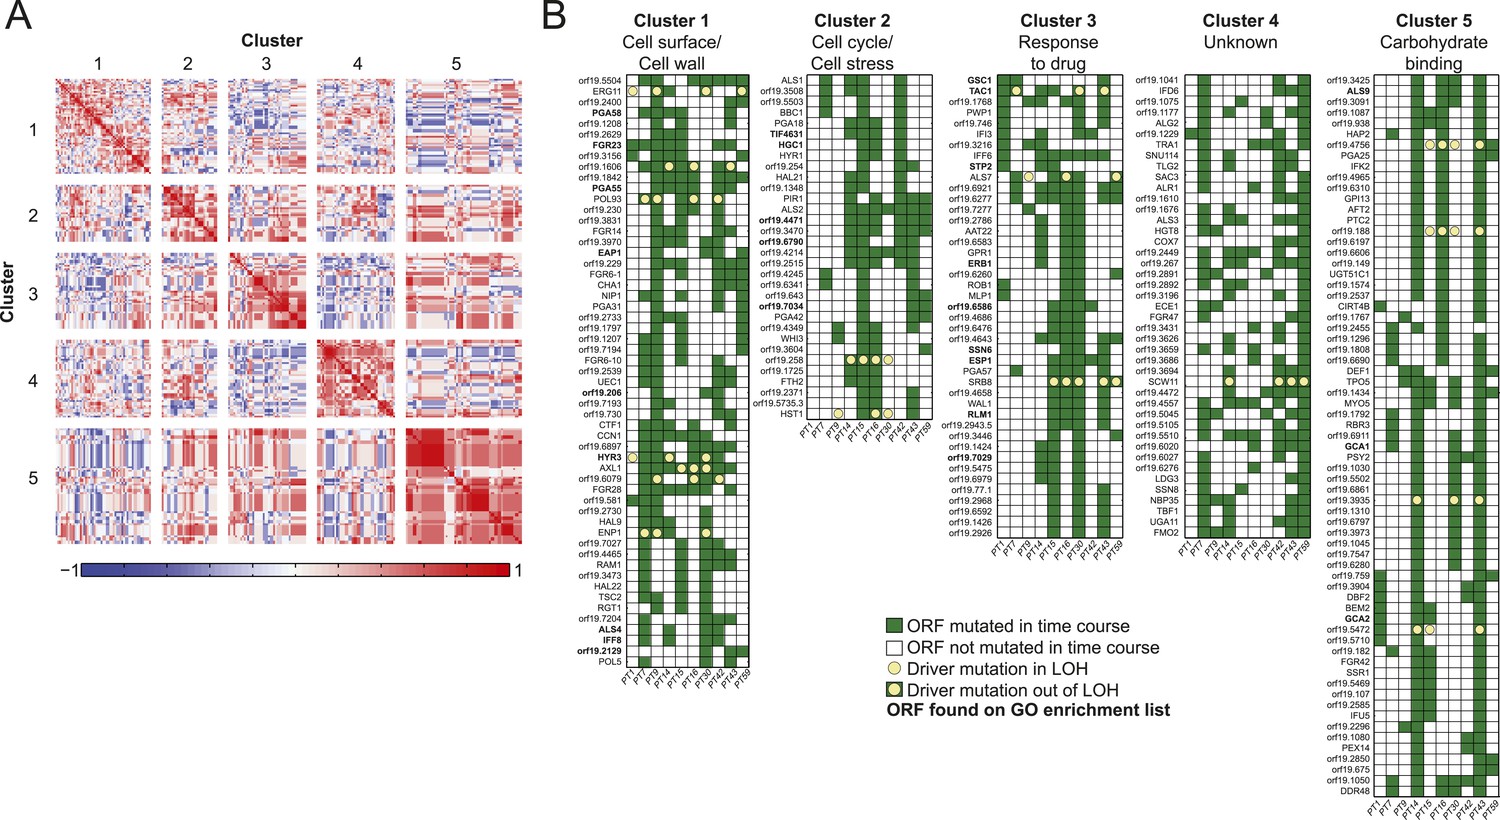
Co-occurrence of nonsynonymous substitutions across isolates reveals functional clusters.
(A) For each of the recurrently mutated 240 genes (genes in which nonsynonymous persistent SNPs appear in more than three patients and are not within an LOH region), we constructed a patient-by-gene binary vector. We clustered the resulting patient-by-gene matrix using NMF clustering to reveal five coherent clusters (correlation matrix of the clusters left; red: positive correlation; blue: negative correlation; white: no correlation). (B) Co-occurrence clusters. For the genes in each cluster (rows), shown are their mutated occurrences in each patient (columns); green: gene is persistently mutated in patient, white: no persistent mutation, yellow circle: driver mutation. Functional enrichment of clusters was revealed using gene ontology, and genes matching the enriched cluster function are bolded. We have overlaid recurrent driver mutations (e.g., G/T > A/A) (n = 17) occurring outside of LOH regions (yellow circle, green box) and inside LOH regions (yellow circle, white box).
-
Figure 5—source data 1
(A) Recurrence lists and clusters. 1 All Pers NS Genes.
Listed are all the ORFs with a persistent nonsynonymous SNPs, the series in which they occur as such (1 in relevant Patient 1-Patient 59 column), and the total number of series in which they recur (SUM column). 2 All Pers NS in LOH: Listed are all the ORFs with a persistent nonsynonymous SNPs within an LOH region. 3 All Pers NS not in LOH: Listed are all the ORFs with a persistent nonsynonymous SNPs NOT within an LOH region. 4 Cluster Rec. genes not in LOH: NMF Clustering of the occurrence matrix from ‘All Pers NS not in LOH’. 5 Cluster GO Enrichment: The GO enrichments for each of the clusters identified in ‘4 Cluster Rec. genes not in LOH’. (B) Driver mutations. Patient 1—59. Shown are all the positions where a nonsynonymous SNP changed from one homozygous genotype to another. Each column represents the base-call in that isolate of a given patient series. The formatting is consistent with Figure 2—source data 1. Drivers Recurrence in genome: for each of the driver candidates identified in the previous tabs, shown are the occurrence of a driver mutation in that ORF across each of the patient series. (C) Driver mutations in LOH regions. As above (Figure 5—source data 1B), but restricted to only driver mutations occurring within LOH regions. (D). Recurrence lists and clusters for MIC associated mutations. As above (Figure 5—source data 1A), but restricted to only recurrent mutations that occur in parallel with changes in MIC.
- https://doi.org/10.7554/eLife.00662.016
Figure 5—figure supplement 1
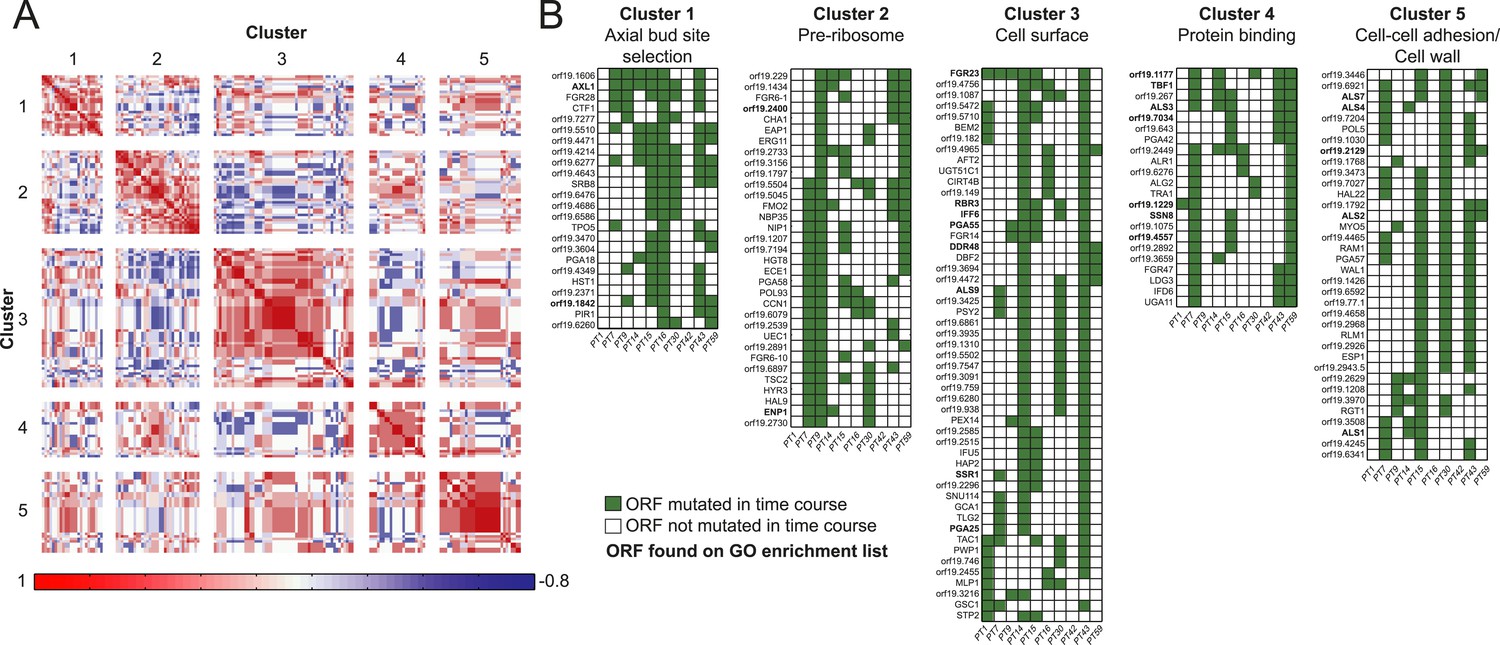
Co-occurrence of nonsynonymous SNPs occurring in conjunction with a shift in MIC.
(A) For each of the 166 recurrently mutated genes associated with a change in MIC, we constructed a patient-by-gene binary vector. We clustered the resulting patient by gene matrix using NMF clustering to reveal 5 coherent clusters (correlation matrix of the clusters left; red: positive correlation; blue: negative correlation; white: no correlation). (B) Co-occurrence clusters. For the genes in each cluster (rows), shown are their mutated occurrences in each patient (columns); green: gene is persistently mutated in patient, white: no persistent mutation. Functional enrichment of clusters was revealed using gene ontology, and genes matching the enriched cluster function are bolded.
Figure 6 with 1 supplement
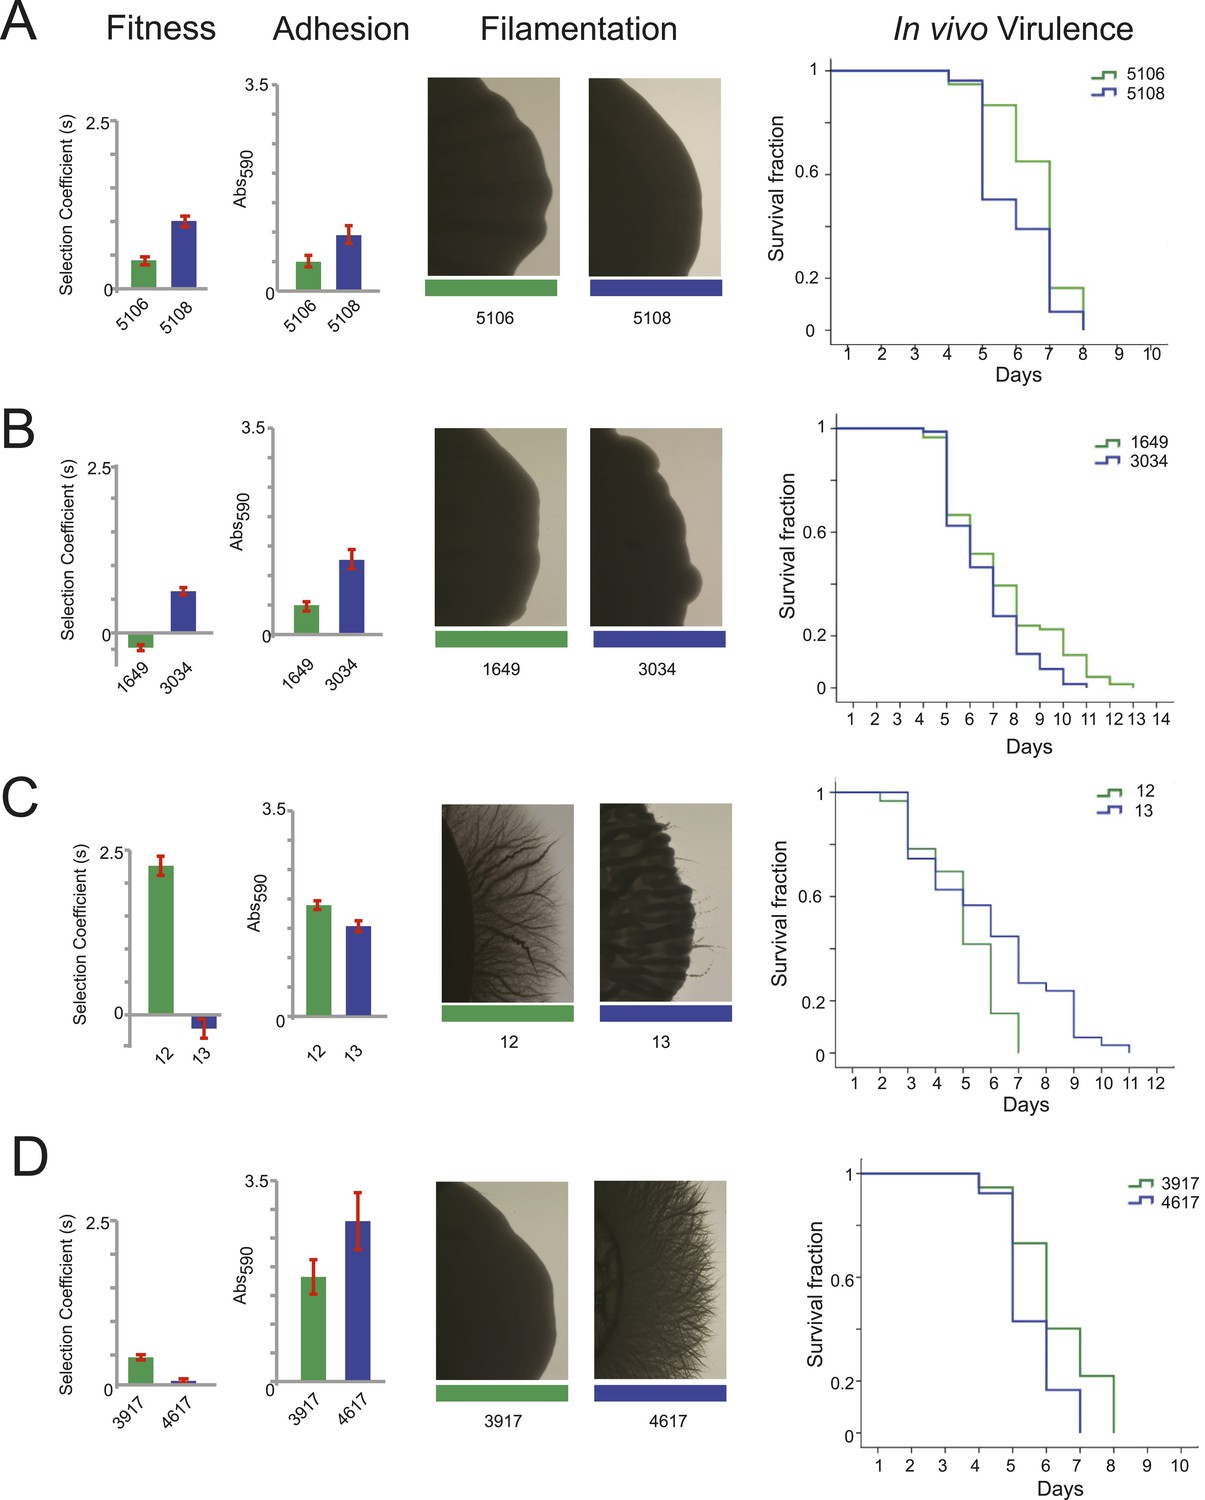
Filamentation, adhesion and virulence increase concurrently with fitness.
For each pair of consecutive isolates (green preceding blue), shown are the fitness, adhesion, filamentation, and virulence in a worm model of infection (each described in ‘Materials and methods’). A subset of fitness values are duplicated from Figure 7A, with selection coefficient (s) shown on the Y-axis. A subset of adhesion values are plotted from Figure 6—source data 1, with Abs590 nm on the Y-axis. A subset of images showing filamentation on spider media are shown, with the full set found in Figure 6—figure supplement 1. For virulence, shown are Kaplan–Meier plots of survival rates from C.elegans infection with the specified C. albicans isolates (‘Materials and methods’). For each isolate pair, significant changes in virulence were observed between the two isolates (in all cases, p < 0.001, log-rank test), with three of the four evolved isolates being more virulent than their corresponding progenitor. (A) Patient 30 isolates 5106 and 5108; (B) Patient 43 isolates 1649 and 3034; (C) Patient 1 isolates 12 and 13; (D) Patient 59 isolates 3917 and 4617.
-
Figure 6—source data 1
Adhesion values for the majority of isolates.
Adhesion was defined as described in ‘Materials and methods’ and measured eight times to determine the average adherence as measured by Abs590.
- https://doi.org/10.7554/eLife.00662.019
Figure 6—figure supplement 1
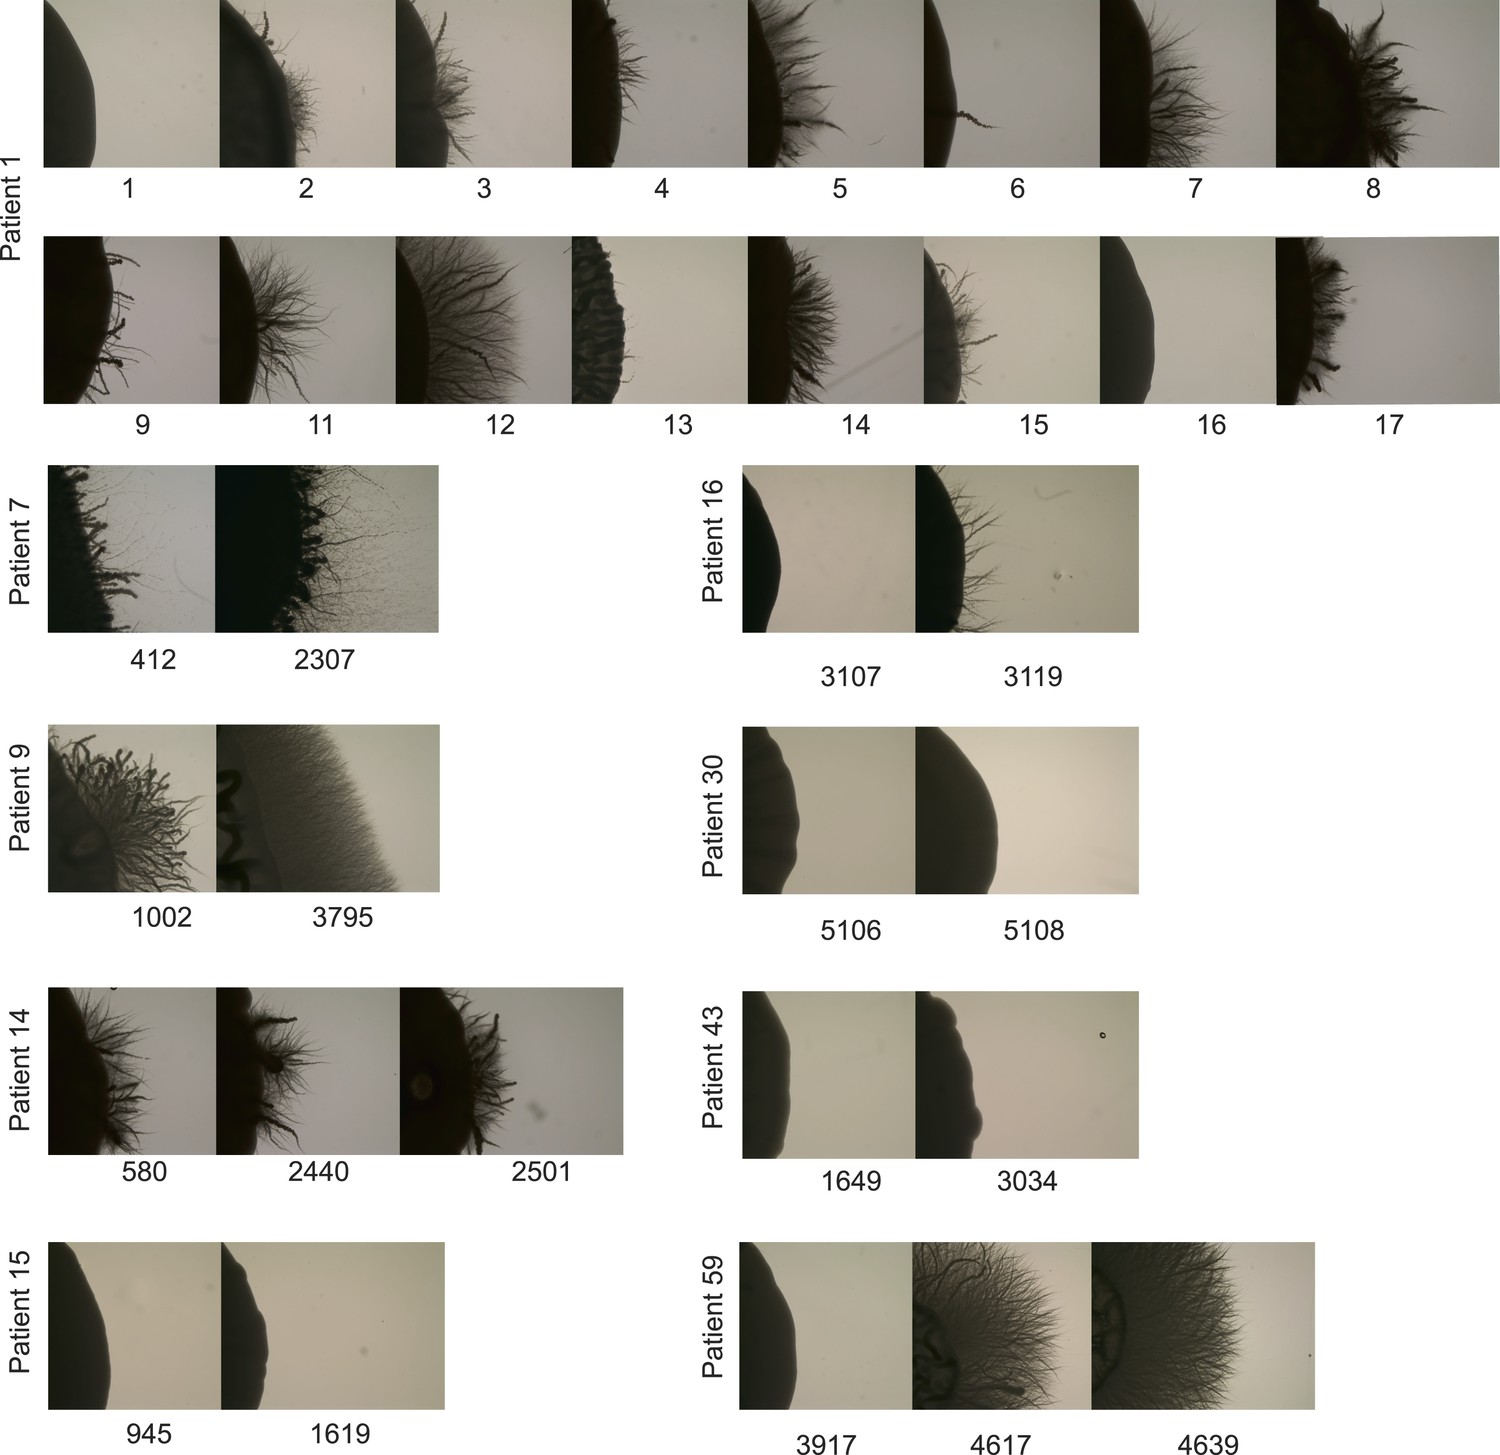
Filamentation increases in many patient series.
For several patient series, shown are the filamentation assay results after 7 days of growth on Spider Media (‘Materials and Methods’). These data, a subset of which is shown in Figure 6, demonstrate the heterogeneity seen between strains, as well as the general trend for filamentation to increase over time.
Figure 7
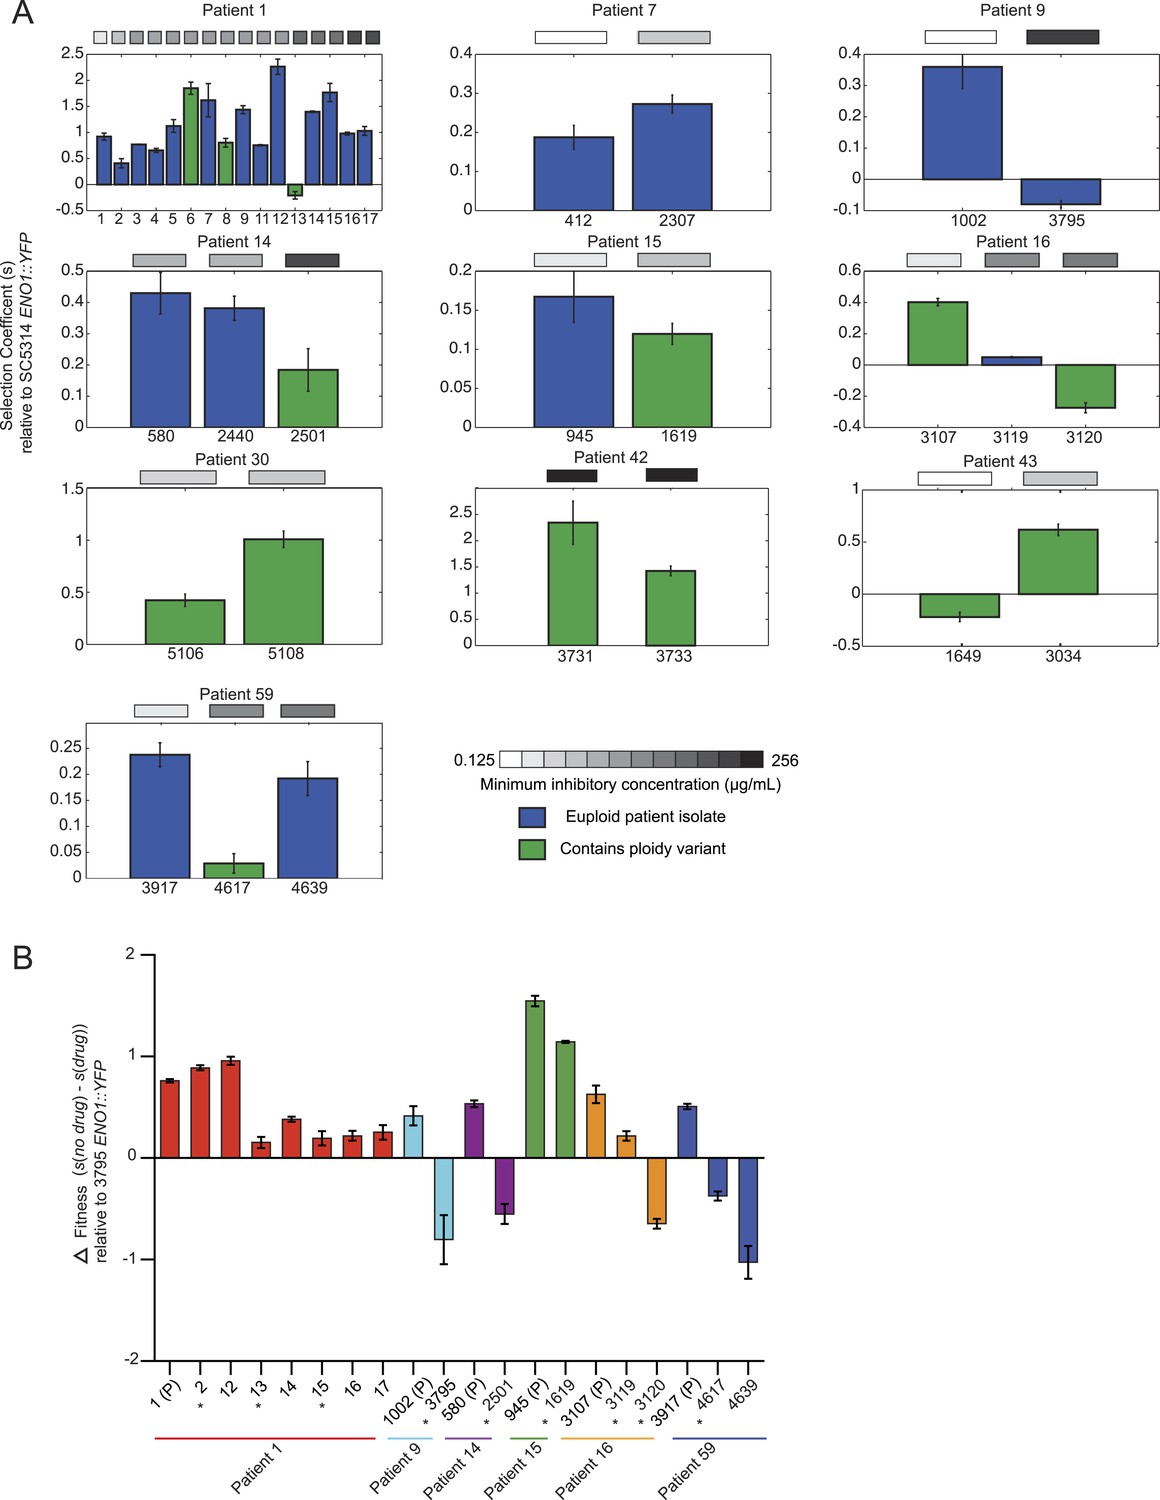
Emergence of increased drug resistance often coincides with reduction in fitness in the absence of drug, but an increase in the presence of drug.
(A) For each patient (panel) shown is the fitness (‘Materials and methods’) of each strain (Y axis, mean ± STDV), ordered from the progenitor to evolved isolates (left to right, X axis). Fitness is calculated relative to an ENO1::YFP SC5314 reference isolate. The MIC of each strain is shown in the gray boxes on top (white: low; black: high, color bar at bottom). Green: isolates with aneuploidies; Blue: euploid isolates. (B) Shown is the mean difference between fitness in the absence and presence of drug (Y axis, error bars are ± STDV; n > 3) for isolates (X axis) that showed a decrease in fitness (Figure 7A) in the absence of drug concomitant with an increase in MIC (asterisks), and flanking isolates in Patient 1 and 59 (ordered from the progenitor to evolved isolates, left to right, X axis). The difference in fitness is calculated as the difference in selection coefficient (s, Y axis) between matching competition experiments in RPMI and those in RPMI with one half the MIC for fluconazole (Table 1) for each isolate tested (X axis). Negative values indicate that the strain had higher fitness in the presence of fluconazole vs assays without fluconazole. For each assay, the fluconazole-resistant isolate 4639 ENO1::YFP was used as the reference strain.
Figure 8
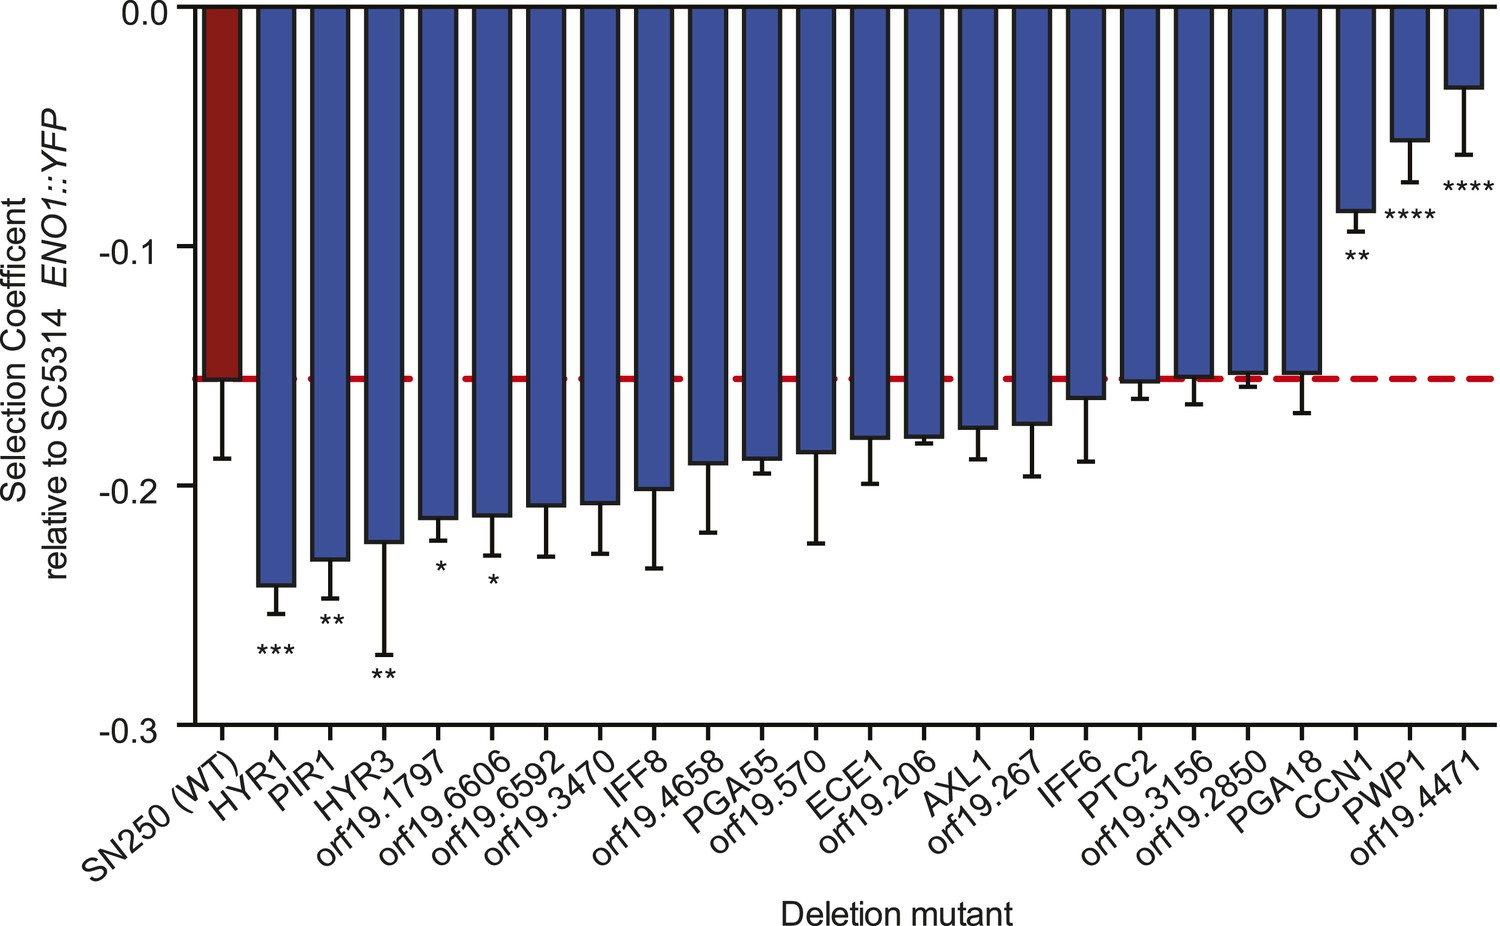
Deletion mutants of recurrently mutated genes reveal changes in relative fitness.
Shown is the fitness (‘Materials and methods’) for each deletion mutant strain and the corresponding wild-type strain (Y axis, mean ± STDV). The wild-type parental strain (SN250) is on the far left (red bar and dashed line). Fitness is calculated relative to an ENO1::YFP SC5314 reference isolate. Locus names are given for the mutant isolates (X axis). Asterisks denote statistical significance (* < 0.05, ** < 0.01, *** < 0.001, **** < 0.0001) by one-way ANOVA with Holm–Sidak correction for multiple comparisons.
Author response image 1

Null distributions of (a) the expected number of persistent, recurrent non synonymous SNPs outside of LOH regions, and (b) persistent non-synonymous SNPs associated with MIC changes outside of LOH regions.
Author response image 2
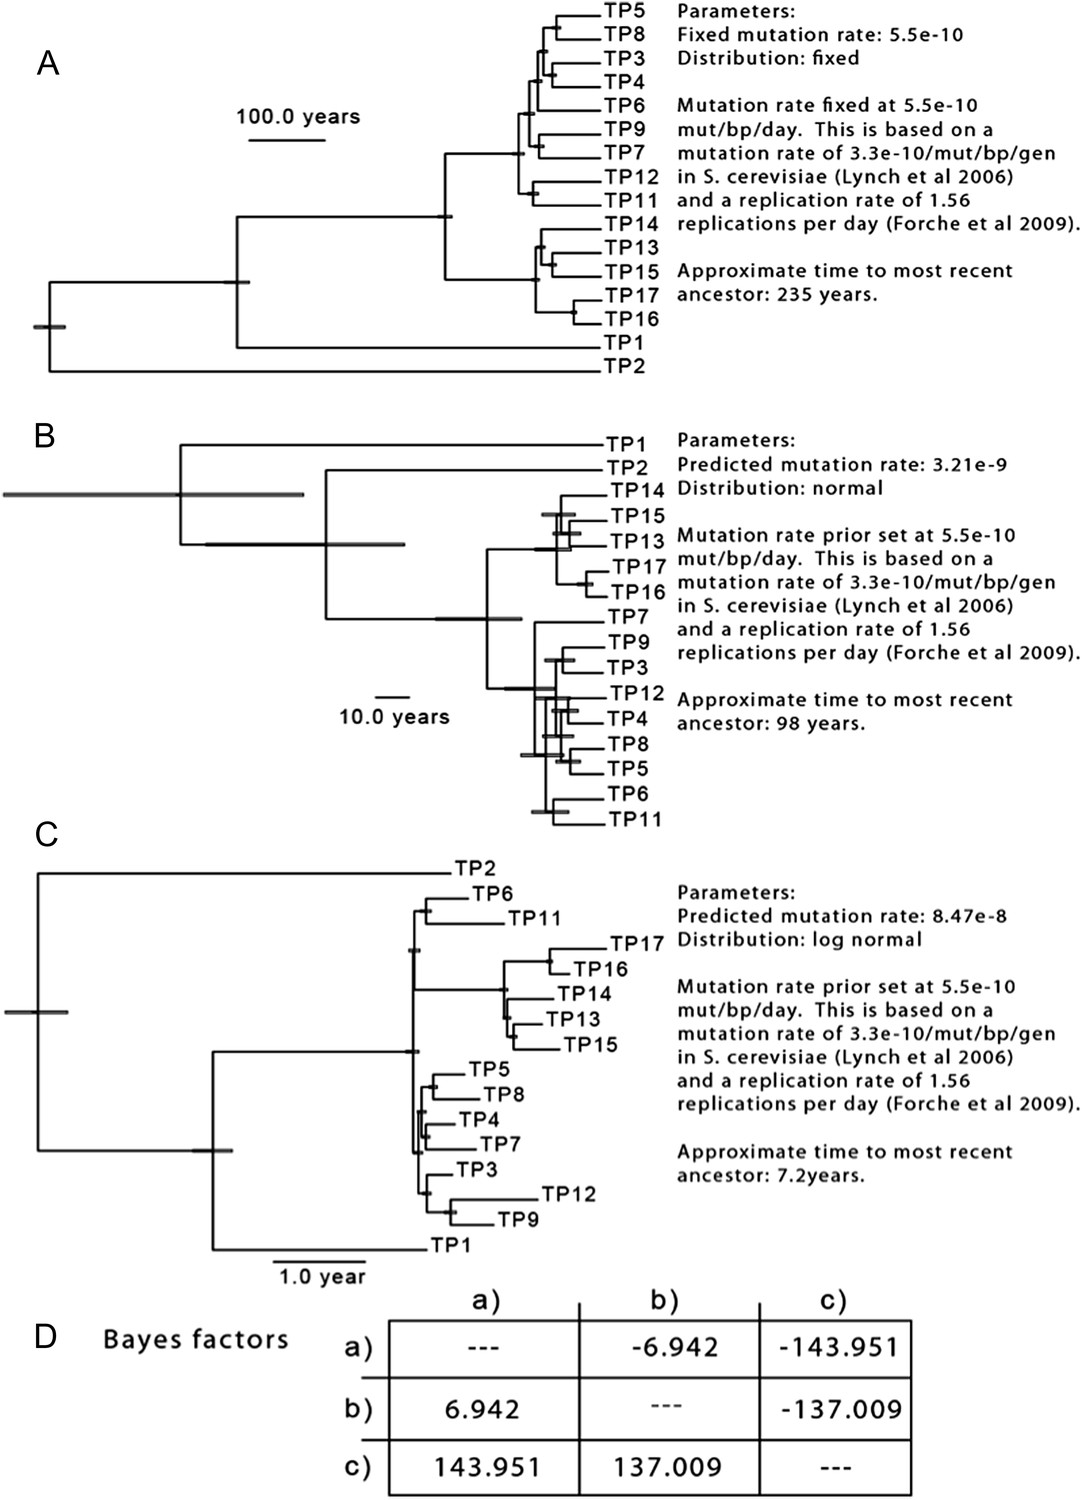
The results of three separate MCMC analyses based on differing priors for mutation rate are shown. This analysis is based only on SNPs from isolates of Patient 1.
Tables
Table 1
Isolate history and sequencing summary
| Publication name | PT | Strain | Entry date | Drug treatment | Dose (mg/day) | E-test MIC (ug/mL) | Depth of coverage | Reads | Percent aligned |
|---|---|---|---|---|---|---|---|---|---|
| White, T.C. | 1 | 1 | 9/10/90 | Fluconazole | 100 | 0.25 | 111.96 | 9,896,468 | 87.17% |
| 2 | 12/14/90 | Fluconazole | 100 | 1 | 69.20 | 12,797,328 | 87.43% | ||
| 3 | 12/21/90 | Fluconazole | 100 | 4 | 92.04 | 16,987,814 | 86.87% | ||
| 4 | 12/31/90 | Fluconazole | 100 | 3 | 80.69 | 14,858,710 | 87.81% | ||
| 5 | 2/8/91 | Fluconazole | 100 | 4 | 110.80 | 20,484,584 | 86.75% | ||
| 6 | 2/22/91 | Fluconazole | 100 | 4 | 101.94 | 18,837,954 | 86.63% | ||
| 7 | 3/25/91 | Fluconazole | 100 | 4 | 81.65 | 15,123,020 | 86.66% | ||
| 8 | 4/8/91 | Fluconazole | 100 | 4 | 112.53 | 20,778,562 | 86.64% | ||
| 9 | 6/4/91 | Fluconazole | 100 | 4 | 113.18 | 22,223,228 | 83.20% | ||
| 11 | 7/15/91 | Fluconazole | 100 | 4 | 53.28 | 9,896,468 | 87.17% | ||
| 12 | 11/26/91 | Fluconazole | 200 | 4 | 96.10 | 18,282,472 | 85.54% | ||
| 13 | 12/13/91 | Fluconazole | 400 | 32 | 123.67 | 22,070,518 | 89.13% | ||
| 14 | 1/28/92 | Fluconazole | 400 | 24 | 98.66 | 18,114,916 | 87.41% | ||
| 15 | 2/21/92 | Clotriminazole | 50 | 24 | 120.90 | 22,401,374 | 86.57% | ||
| 16 | 4/1/92 | Fluconazole | 400 | 96 | 87.44 | 16,061,560 | 87.17% | ||
| 17 | 8/25/92 | Fluconazole | 800 | 96 | 97.83 | 18,317,118 | 85.91% | ||
| Perea, S. et al. | 7 | 412 | 2/15/95 | Fluconazole | 0 | 0.25 | 93.15 | 17,417,588 | 86.69% |
| 2307 | 11/22/95 | Fluconazole | 400 | 0.75 | 95.79 | 18,014,242 | 85.25% | ||
| Perea, S. et al. | 9 | 1002 | 4/20/95 | Fluconazole | 100 | 0.125 | 188.49 | 34,834,970 | 86.74% |
| 4/6/96 | Fluconazole | 800 | 282.62 | 52,839,288 | 86.30% | ||||
| 3795 | 2/26/97 | Fluconazole | 800 | 128 | 77.63 | 13,901,062 | 88.78% | ||
| Perea, S. et al. | 14 | 580 | 3/13/95 | Fluconazole | 0 | 1.5 | 77.08 | 14,711,804 | 85.00% |
| 2440 | 1/3/96 | Fluconazole | 800 | 1.5 | 82.93 | 15,446,882 | 85.69% | ||
| 2501* | 1/4/96 | Fluconazole | 800 | 96 | 88.59 | 17,480,274 | 81.98% | ||
| Perea, S. et al. | 15 | 945 | 4/14/95 | Fluconazole | 300 | 4 | 108.59 | 20,591,044 | 85.19% |
| 1619 | 7/11/95 | Fluconazole | 500 | 64 | 93.14 | 17,565,080 | 84.69% | ||
| Perea, S. et al. | 16 | 3107 | 6/5/96 | Fluconazole | 800 | 4 | 97.01 | 18,361,266 | 84.84% |
| 3119 | 6/5/96 | Fluconazole | 800 | 96 | 87.92 | 16,615,462 | 84.67% | ||
| 3120 | 6/5/96 | Fluconazole | 800 | 96 | 105.95 | 19,442,016 | 86.79% | ||
| 7/1/96 | Fluconazole | 800 | 101.89 | 18,487,462 | 87.50% | ||||
| 7/16/96 | Fluconazole | 800 | 76.44 | 14,327,376 | 85.69% | ||||
| Perea, S. et al. | 30 | 5106 | 1/7/98 | Fluconazole | 800 | 0.5 | 87.21 | 16,466,524 | 84.67% |
| 5108 | 1/7/98 | Fluconazole | 800 | 0.75 | 82.32 | 17,480,274 | 81.98% | ||
| Perea, S. et al. | 42 | 8/3/95 | Fluconazole | 100 | 122.60 | 22,072,562 | 88.38% | ||
| 3731 | 12/27/96 | Fluconazole | 400 | 256 | 119.90 | 21,436,034 | 88.72% | ||
| 3733 | 12/27/96 | Fluconazole | 400 | 256 | 95.51 | 17,295,888 | 88.00% | ||
| Perea, S. et al. | 43 | 1649 | 7/19/95 | Fluconazole | 0 | 0.125 | 102.10 | 19,545,530 | 84.08% |
| 3034 | 5/15/96 | Fluconazole | 400 | 0.75 | 92.97 | 17,300,040 | 85.64% | ||
| Perea, S. et al. | 59 | 3917 | 2/19/97 | Fluconazole | 800 | 2 | 113.27 | 21,549,704 | 83.86% |
| 4617 | 8/28/97 | Fluconazole | 400 | 64 | 75.37 | 15,242,904 | 81.42% | ||
| 4639 | 9/2/97 | Fluconazole | 400 | 128 | 115.32 | 25,468,190 | 75.69% | ||
| Perea, S. et al. | 64 | 4018 | 4/2/97 | Fluconazole | 200 | 110.16 | 20,118,736 | 86.78% | |
| 7/14/97 | Fluconazole | 200 | 18.03 | 20,970,946 | 9.26% |
-
Strains and coverage.
-
-
*
isolated on same day from same patient as previously published strain, 2500.
Table 2
Sequenom iPLEX genotyping assay validation
| Patient | Isolate | Total discordant | Total concordant | Total Assayed | % Concordant |
|---|---|---|---|---|---|
| Patient_1 | TWTC1 | 2 | 31 | 33 | 93.94% |
| Patient_1 | TWTC2 | 1 | 32 | 33 | 96.97% |
| Patient_1 | TWTC3 | 1 | 32 | 33 | 96.97% |
| Patient_1 | TWTC12 | 1 | 32 | 33 | 96.97% |
| Patient_1 | TWTC13 | 1 | 32 | 33 | 96.97% |
| Patient_1 | TWTC15 | 1 | 32 | 33 | 96.97% |
| Patient_1 | TWTC16 | 1 | 31 | 32 | 96.88% |
| Patient_1 | TWTC17 | 1 | 32 | 33 | 96.97% |
| Patient_7 | 412 | 3 | 60 | 63 | 95.24% |
| Patient_7 | 2307 | 4 | 59 | 63 | 93.65% |
| Patient_9 | 1002 | 16 | 96 | 112 | 85.71% |
| Patient_9 | 3795 | 9 | 103 | 112 | 91.96% |
| Patient_14 | 580 | 3 | 49 | 52 | 94.23% |
| Patient_14 | 2440 | 2 | 27 | 29 | 93.10% |
| Patient_14 | 2501 | 3 | 33 | 36 | 91.67% |
| Patient_15 | 945 | 8 | 121 | 129 | 93.80% |
| Patient_15 | 1619 | 10 | 120 | 130 | 92.31% |
| Patient_16 | 3107 | 2 | 51 | 53 | 96.23% |
| Patient_16 | 3119 | 3 | 50 | 53 | 94.34% |
| Patient_16 | 3120 | 2 | 50 | 52 | 96.15% |
| Patient_30 | 5106 | 3 | 215 | 218 | 98.62% |
| Patient_30 | 5108 | 19 | 204 | 223 | 91.48% |
| Patient_43 | 1649 | 7 | 89 | 96 | 92.71% |
| Patient_43 | 3034 | 8 | 88 | 96 | 91.67% |
| Patient_59 | 3917 | 3 | 62 | 65 | 95.38% |
| Patient_59 | 4617 | 2 | 63 | 65 | 96.92% |
| Patient_59 | 4639 | 4 | 59 | 63 | 93.65% |
| TOTAL | 120 | 1853 | 1973 | 93.92% | |
Download links
A two-part list of links to download the article, or parts of the article, in various formats.
Downloads (link to download the article as PDF)
Open citations (links to open the citations from this article in various online reference manager services)
Cite this article (links to download the citations from this article in formats compatible with various reference manager tools)
The evolution of drug resistance in clinical isolates of Candida albicans
eLife 4:e00662.
https://doi.org/10.7554/eLife.00662


