Cell-cycle dependent phosphorylation of yeast pericentrin regulates γ-TuSC-mediated microtubule nucleation
- Universität Heidelberg, Germany
- University of Heidelberg, Germany
Figures
Figure 1 with 2 supplements
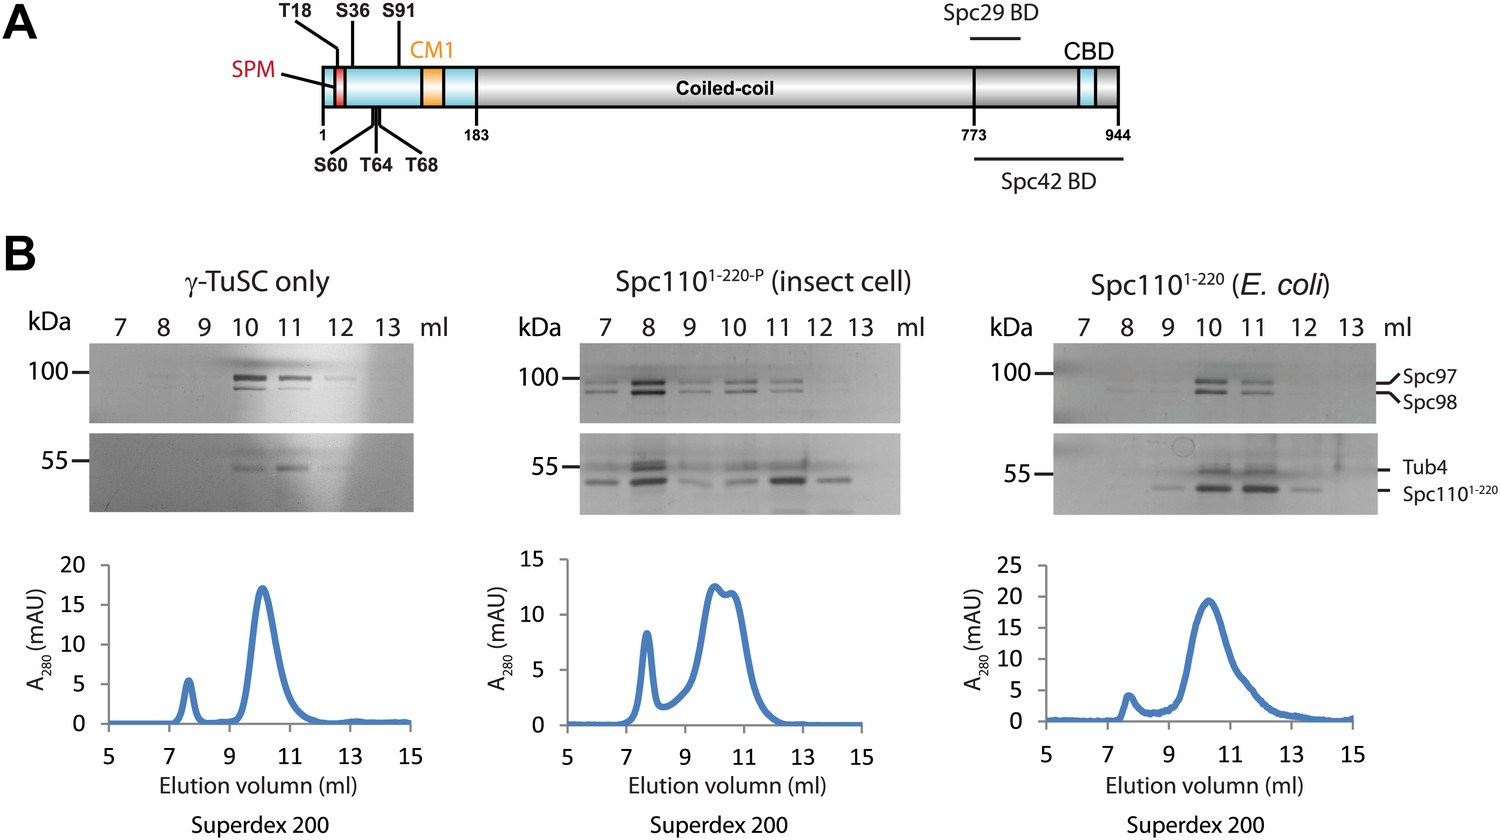
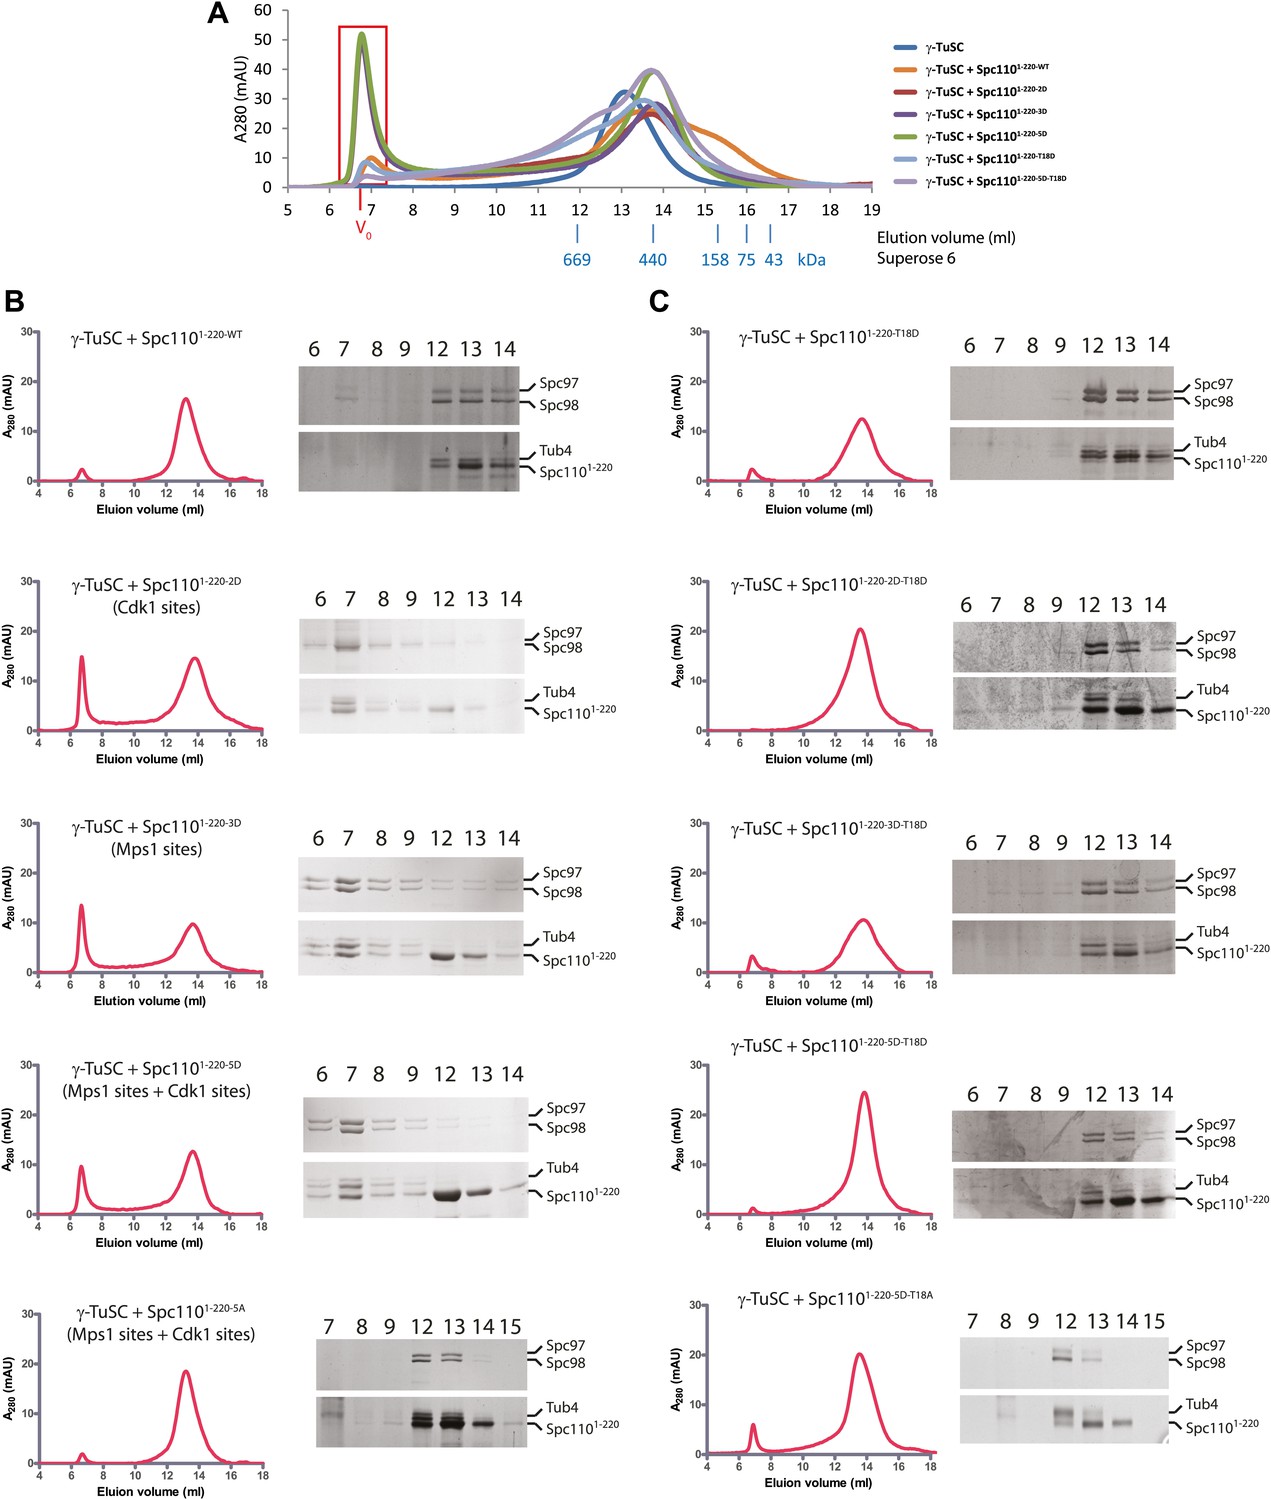
Phosphorylation of N-Spc110 is required for the γ-TuSC oligomerization.
(A) Diagram of Spc110's functional domain organization and the position of phospho-sites investigated in this study. These sites are located at the N-terminal domain of Spc110, which directly interacts with γ-TuSC (Vinh et al., 2002). The conserved centrosomin motif 1 (CM1) (Sawin et al., 2004; Zhang and Megraw, 2007) is also within the N-terminal domain. The C-terminal domain of Spc110 is involved in the interaction with SPB central plaque components Spc29 and Spc42 (Adams and Kilmartin, 1999; Elliott et al., 1999). CBD: calmodulin binding domain. (B) Post-translational modifications of Spc1101–220 are required for promoting γ-TuSC oligomerization. Spc1101–220 was expressed and purified from insect cells (middle panel) or from E. coli (right panel). Only Spc1101–220 from insect cells carried post-translational modifications (Figure 1—figure supplement 1). Recombinant γ-TuSC was incubated with Spc1101–220 or TB150 buffer only on ice. Oligomerization of γ-TuSC-Spc1101–220 was tested by gel filtration chromatography using a Superdex 200 10/300 column. Peak fractions of the chromatograms were analysed by SDS-PAGE and silver staining.
Figure 1—figure supplement 1
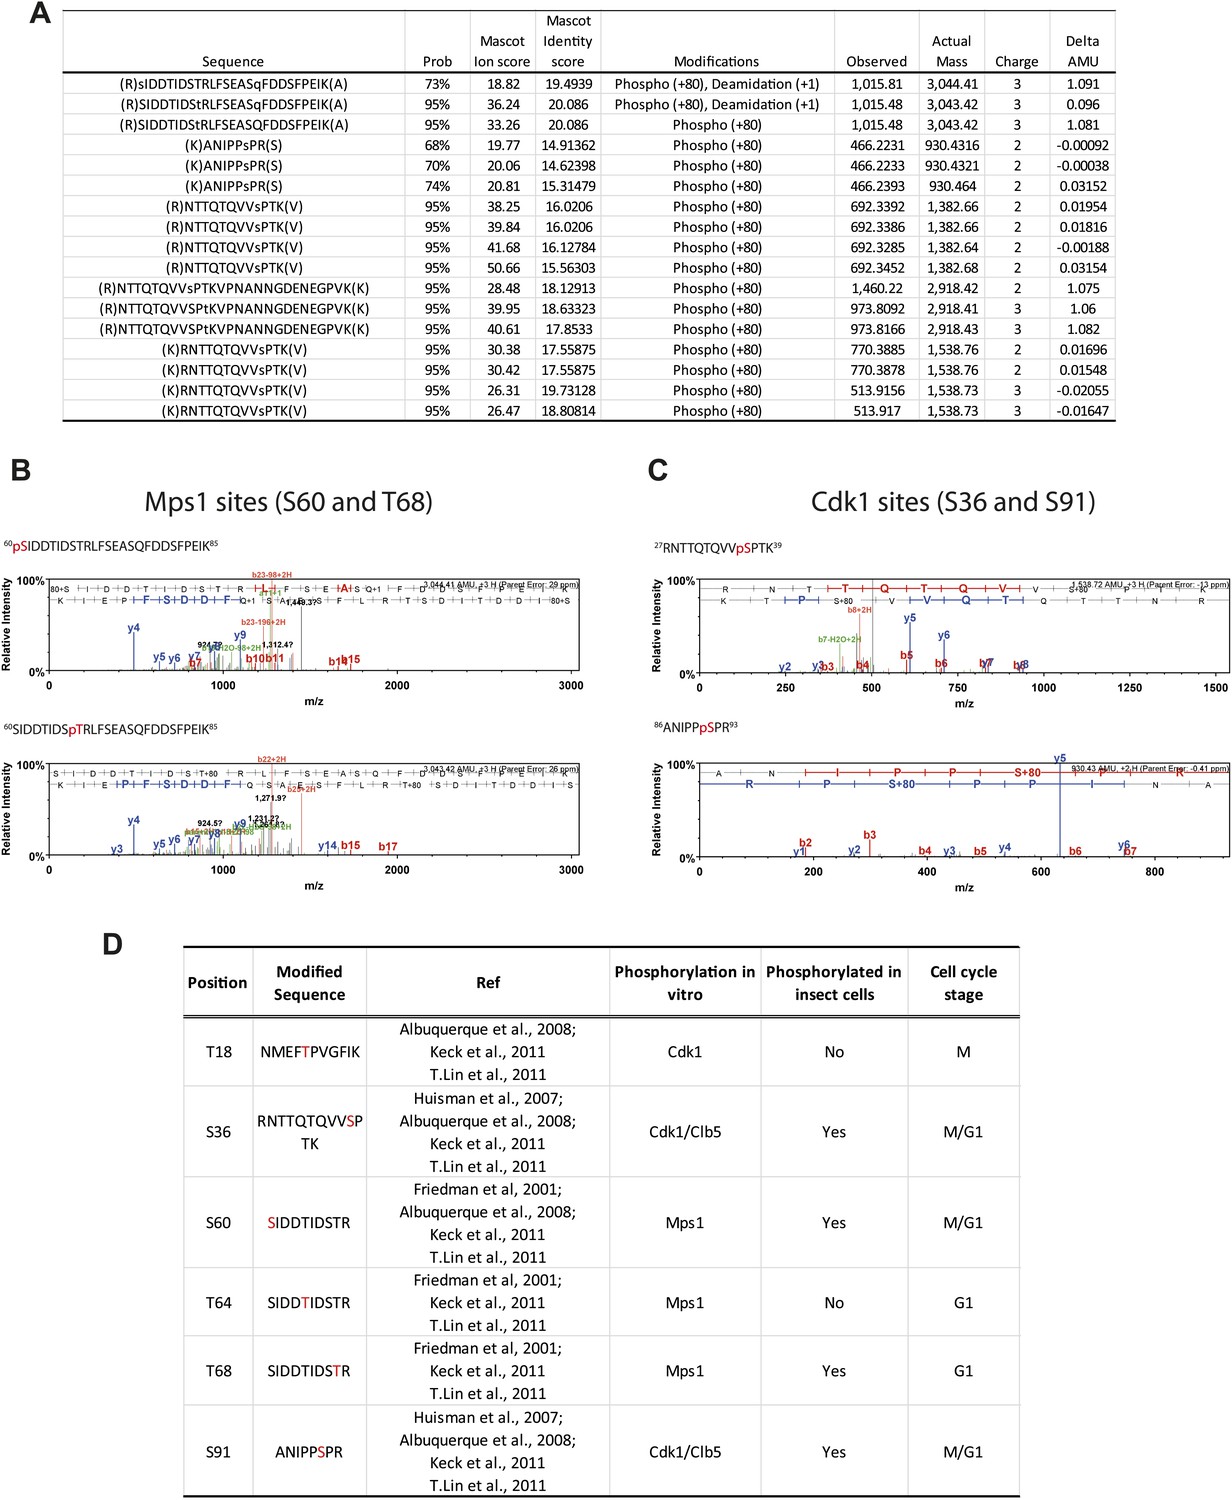
Phosphorylation of Spc1101–220 from insect cells.
(A) Table of mass-spectrometry identified phosphopeptides of Spc1101–220 purified from baculovirus-insect cell expression system. (B) Mass spectra of identified Mps1 sites (S60 and T68). (C) Mass spectra of identified Cdk1 sites (S36 and S91). (D) Comparison of investigated phospho-sites of Spc110 N-terminal domain with published data (Friedman et al., 2001; Huisman et al., 2007; Albuquerque et al., 2008; Keck et al., 2011; Lin et al., 2011).
Figure 1—figure supplement 2
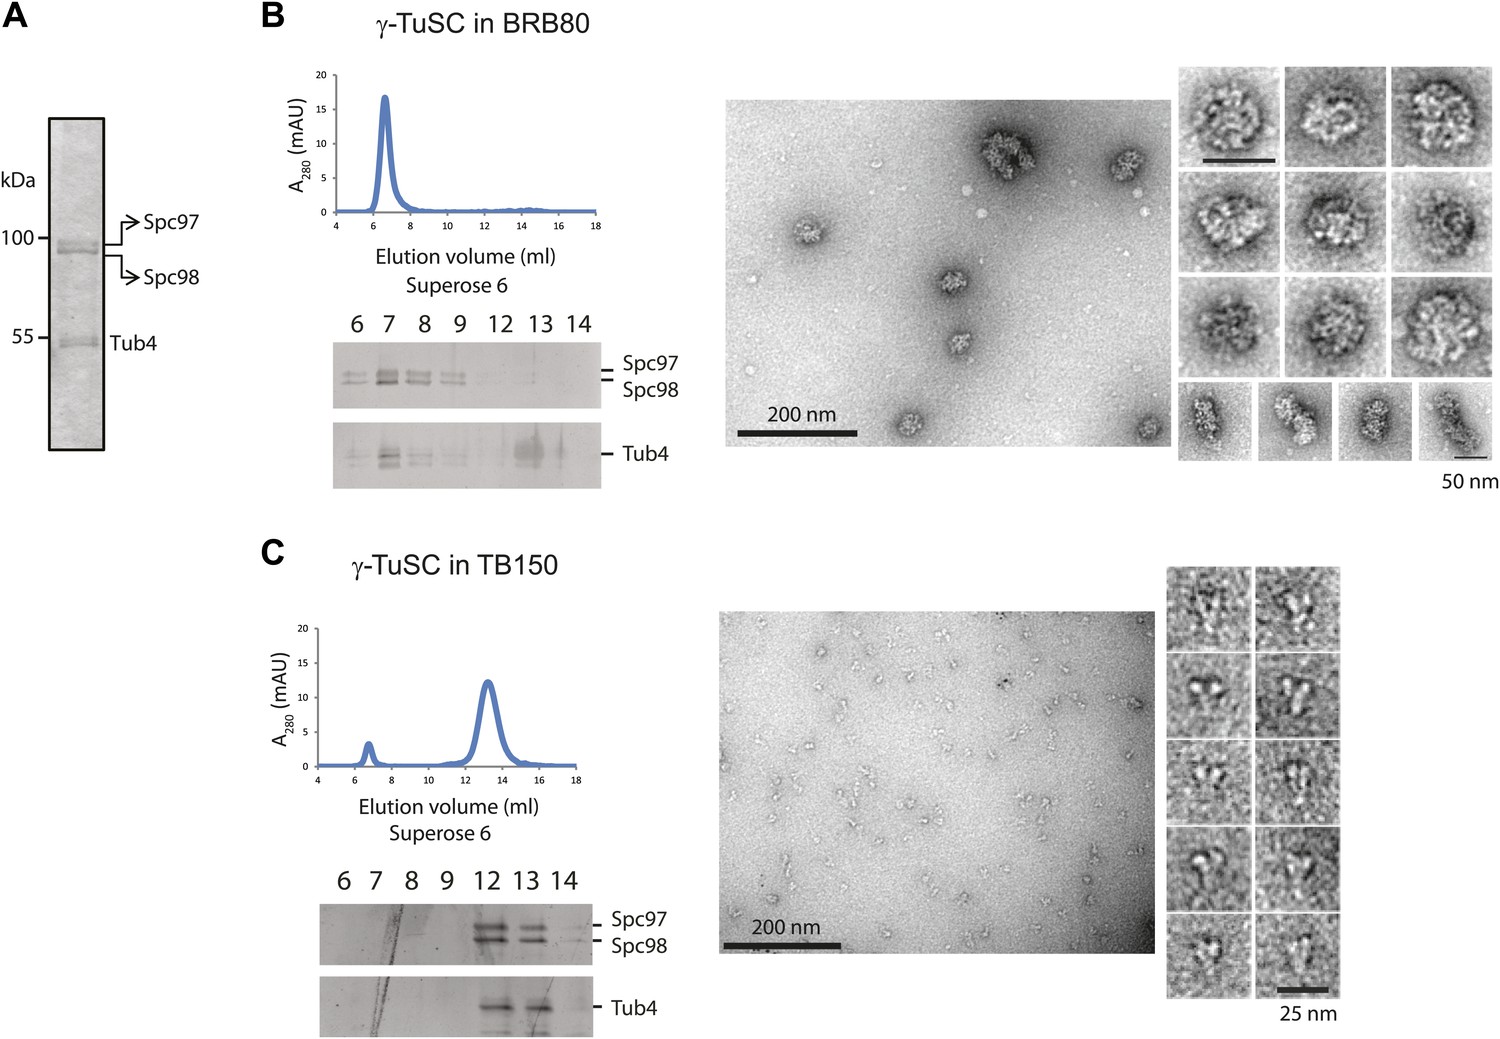
γ-TuSC does not oligomerize in TB150 buffer.
(A–C) Purified γ-TuSC (A) spontaneously oligomerizes in BRB80 buffer (B) but not in TB150 buffer (C). Proteins were analyzed by Superose 6 10/300 and subsequently gel filtration fractions were subjected to SDS-PAGE and silver staining. Samples in the peak fraction were subjected to negative staining and protein complexes were analyzed by electron microscopy. Corresponding scale bars are shown on the images.
Figure 2 with 6 supplements
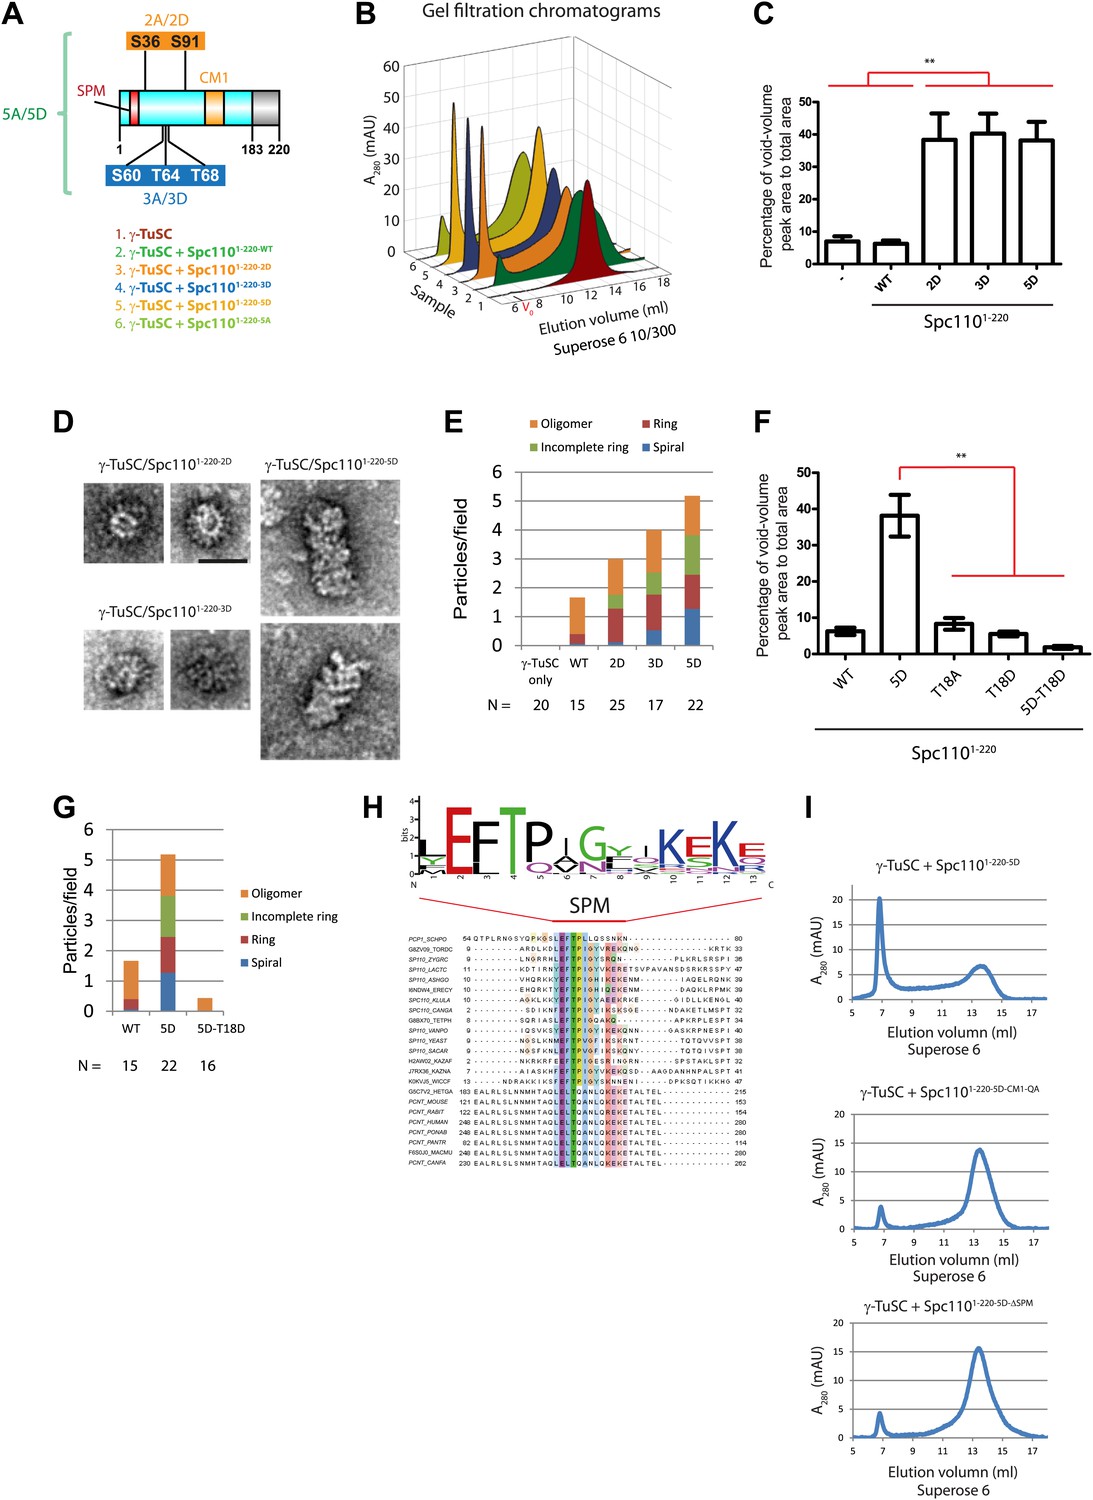
Mps1 and Cdk1 phosphorylation of N-Spc110 stimulates γ-TuSC oligomerization.
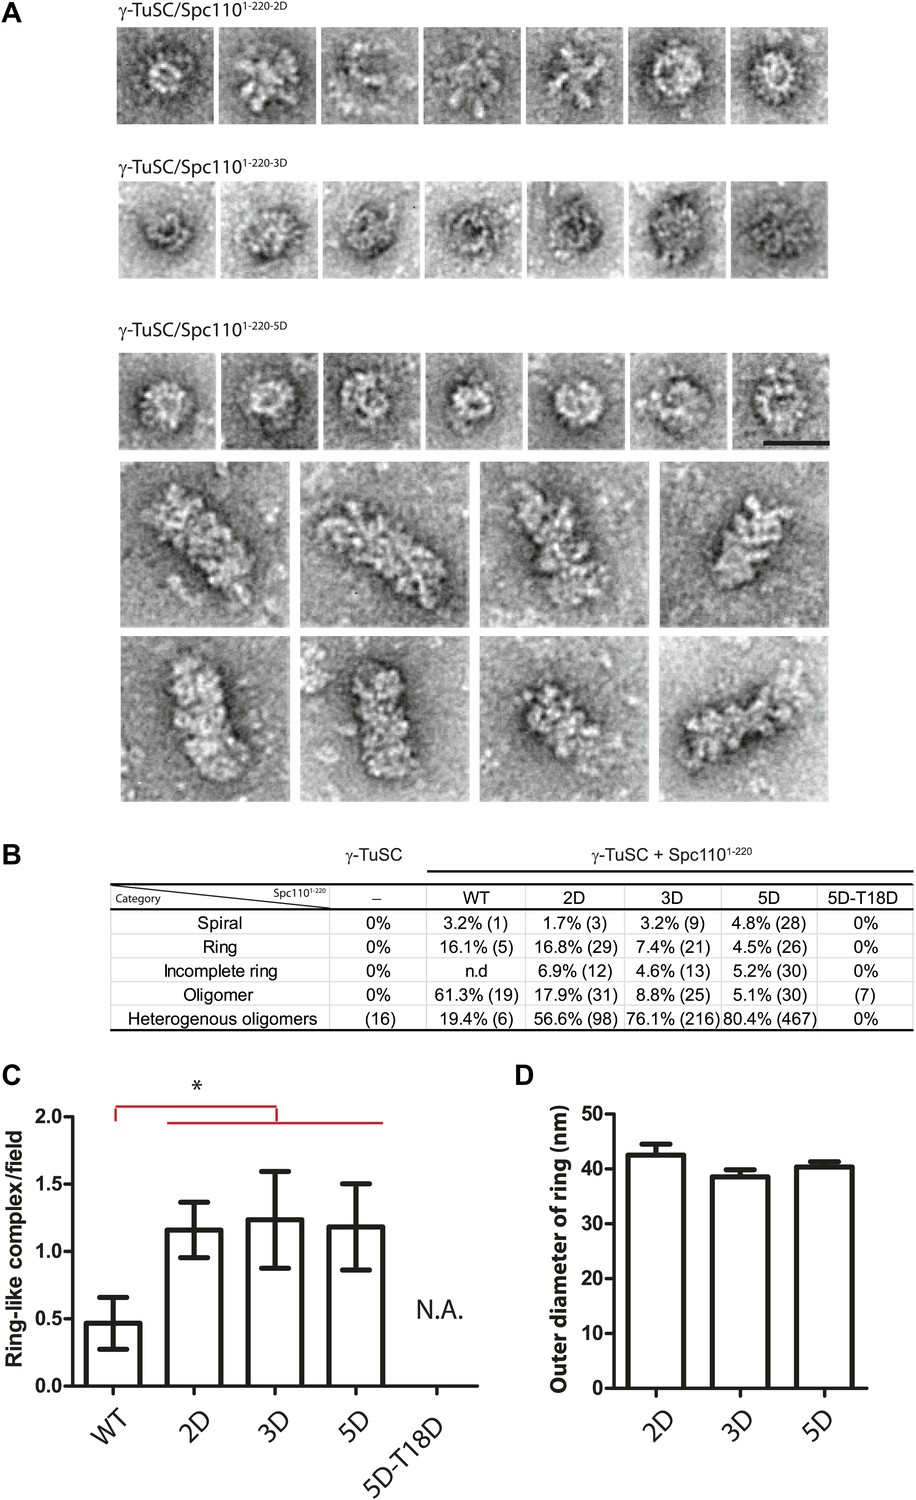
(A) Summary of combination of non-phosphorylatable and phospho-mimicking mutations in Spc110 used in this study. The indicated Spc1101–220 variants were expressed, purified from E. coli, and then tested for γ-TuSC oligomerization. WT: wild-type; 2A/D: S36A/D, S91A/D; 3A/D: S60A/D, T64A/D, T68A/D; 5A/D: S36A/D, S91A/D, S60A/D, T64A/D, T68A/D (see Figure 2—figure supplement 1A for SDS-PAGE of purified Spc1101–220 proteins and Figure 2—figure supplement 1C for gel filtration chromatograms). (B) Spc1101–220 phospho-mimicking proteins induced γ-TuSC oligomerization. Spc1101–220 proteins were incubated with γ-TuSC in TB150 buffer. The reconstituted complexes were separated according to size by gel filtration using a Superose 6 column. (C) Bar graph of area ratio of void-volume peak to total area of chromatogram of (B). ** marks statistical significance at p<0.01. Error bars represent SEM. N = 3 to 9 for the number of experiments performed. (D) Void-volume peak fractions of (B) were subjected to negative staining and protein complexes were analyzed with electron microscopy. Representative ring-like structures of γ-TuSC-Spc1101–220-2D, γ-TuSC-Spc1101–220-3D, and γ-TuSC-Spc1101–220-5D. See Figure 2—figure supplement 4A for additional EM pictures. Scale bar: 50 nm. (E) Quantification of (D). Shown is the particle number per field. Particles were categorized based on the morphology. N is indicated on the figure for the number of fields analysed. (F) Quantification of void-volume fractions of γ-TuSC chromatograms. γ-TuSC was incubated with Spc1101–220-WT, Spc1101–220-5D, Spc1101–220-T18A, Spc1101–220-T18D, and Spc1101–220-5D−T18D as described in (B). Bar graph of area ratio of void-volume peak to total area of chromatogram was calculated as in (C). ** marks statistical significance at p<0.01. Error bars represent SEM. N = 3 to 9 for the number of experiments performed. (G) Quantification of EM. Void-volume peak fractions of (F) were subjected to negative staining and protein complexes were analyzed with electron microscopy. Particles were categorized based on the morphology. Shown is the particle number per field. Note, the Spc1101–220−WT and Spc1101–220-5D graphs are the same as in (E). N is indicated on the figure for the number of fields analysed. (H) Multiple sequence alignment of SPM element of γ-complex receptors from yeast to human. Residues are marked according to the ClustalX colour scheme. The occurrence of each amino acid in each position of CM1 motif is presented with Weblogo 2.0. (I) The indicated Spc1101–220 proteins (Spc1101–220-5D, Spc1101–220-5D-CM1-QA, and Spc1101–220-5D-ΔSPM) were incubated with γ-TuSC in TB150 buffer. The reconstituted complexes were separated according to size by gel filtration using a Superose 6 column.
Figure 2—figure supplement 1

Purification of Spc1101–200 variants.
(A) Purified GST-Spc1101–220 variants. ∼1 μg of protein was loaded to each lane. The SDS-PAGE was stained with Coomassie Blue. (B) Calibration of Superose 6 10/300 gel filtration column. Following protein markers were used: thyroglobulin (667 kDa), ferritin (440 kDa), aldolase (158 kDa), conalbumin (75 kDa), ovalbumin (44 kDa). Partition coefficient (Kav) was calculated using the equation: (Ve–V0)/(Vc–V0), where V0 = column void volume, Ve = elution volume, and Vc = geometric column volume. The calibration curve (bottom) of Kav vs log molecular weight was plotted in semi-logarithmic scale. (C) Gel filtration chromatograms of purified GST-Spc1101–220 variants. Proteins were analyzed in TB150 buffer by Superose 6 10/300 chromatography.
Figure 2—figure supplement 2
Phosphomimetic but not SPM defective N-Spc110 proteins induce oligomerization of γ-TuSC.
(A) Overlapped gel filtration chromatograms with molecular weight markers. The peak of the void-volume (V0, boxed area) corresponds to molecular weight fractions higher than 5000 kDa. Note that the concentrations of γ-TuSC and Spc1101–220 variants in (A) were double as high compared to (B) and (C). (B) Gel filtration chromatograms of γ-TuSC incubated with phosphomimetic or non-phosphorylatable Spc1101–220 mutant proteins. γ-TuSC was incubated in TB150 buffer with Spc1101–220 proteins from Figure 2—figure supplement 1A. Complexes were analyzed by Superose 6 10/300 chromatography. Fractions corresponding to the peak were analyzed by SDS-PAGE and silver staining. (C) As (B) but with Spc1101–220 variants that have defective SPM due to T18D or T18A.
Figure 2—figure supplement 3
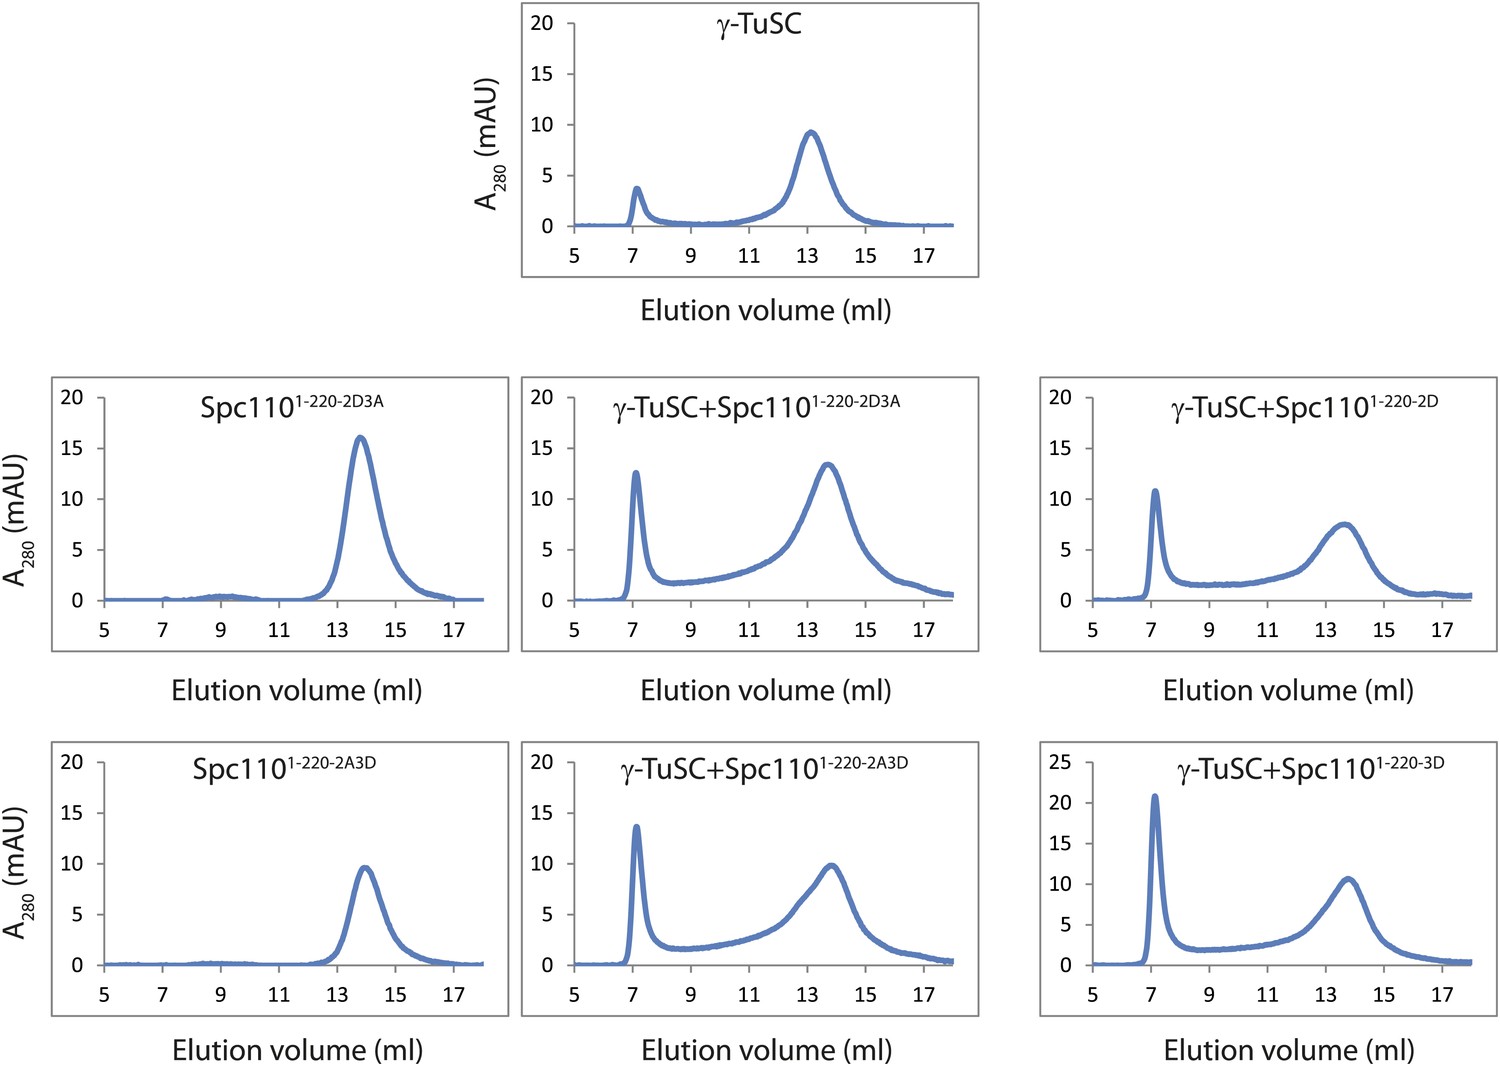
Non-phosphorylatable mutations in Mps1 or Cdk1 sites of Spc110 are neutral to γ-TuSC oligomerization induced by phosphomimetic mutations.
Gel filtration chromatograms of γ-TuSC incubated with indicated Spc1101–220 variants in TB150 buffer. Non-phosphorylatable mutations in addition to phosphomimetic mutations were introduced on Spc1101–220 to examine the possibility that non-phosphorylatable mutations alter overall structure and thus disrupt the activity to induce γ-TuSC oligomerization. Complexes were analyzed by Superose 6 10/300 chromatography.
Figure 2—figure supplement 4
EM single particle analysis of oligomerized γ-TuSC.
(A) Additional examples of ring-like and filament-like γ-TuSC-Spc1101–220 complexes. Scale bar: 50 nm. (B) Summary of particle numbers of γ-TuSC oligomerized by Spc1101–220 phospho-mimicking variants. Both the absolute particle number and the percentage of each particle category are shown. (C) Spc1101–220-2D, Spc1101–220-3D, and Spc1101–220-5D induced similar level of ring-like γ-TuSC-Spc1101–220 complexes. * marks statistical significance at p<0.05. Error bars represent SEM. N = 15–25 for the number of field analyzed. Correlated to Figure 2E,G. (D) The diameter of the ring-like γ-TuSC-Spc1101–220 complexes showed no difference among Spc1101–220 phosphomimetic variants. Error bars represent SEM. N = 9, 12, and 18 for the number of ring-like complexes measured in 2D, 3D, and 5D, respectively.
Figure 2—figure supplement 5

Mutations of T18 abolish the γ-TuSC oligomerization promoting activity by inactivating the SPM motif.
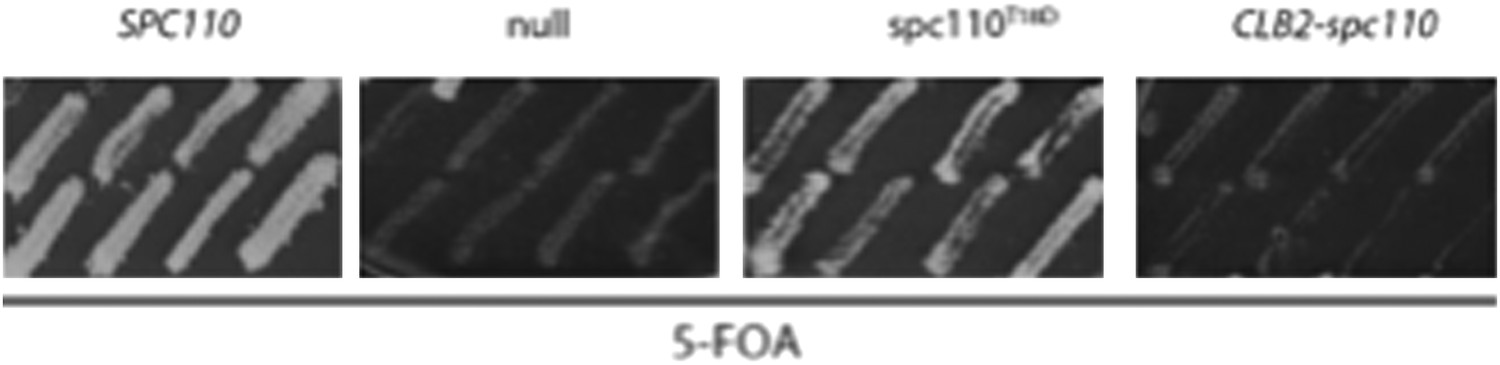
(A) Gel filtration chromatograms of γ-TuSC incubated with phosphomimetic Spc1101–220-5D with additional T18 mutations. Complexes were analyzed by Superose 6 10/300 chromatography in TB150 buffer. (B) Growth of ten-fold serial dilutions of SPC110 shuffle strains carrying the empty integration vector (null) or SPC110 (WT) or SPC110 mutant alleles on the integration vector. Wild type and SAC deficient mad2Δ cells were analyzed. Growth was tested either on synthetic complete (SC) plates containing 5-FOA or SC dropout plates.
Figure 2—figure supplement 6
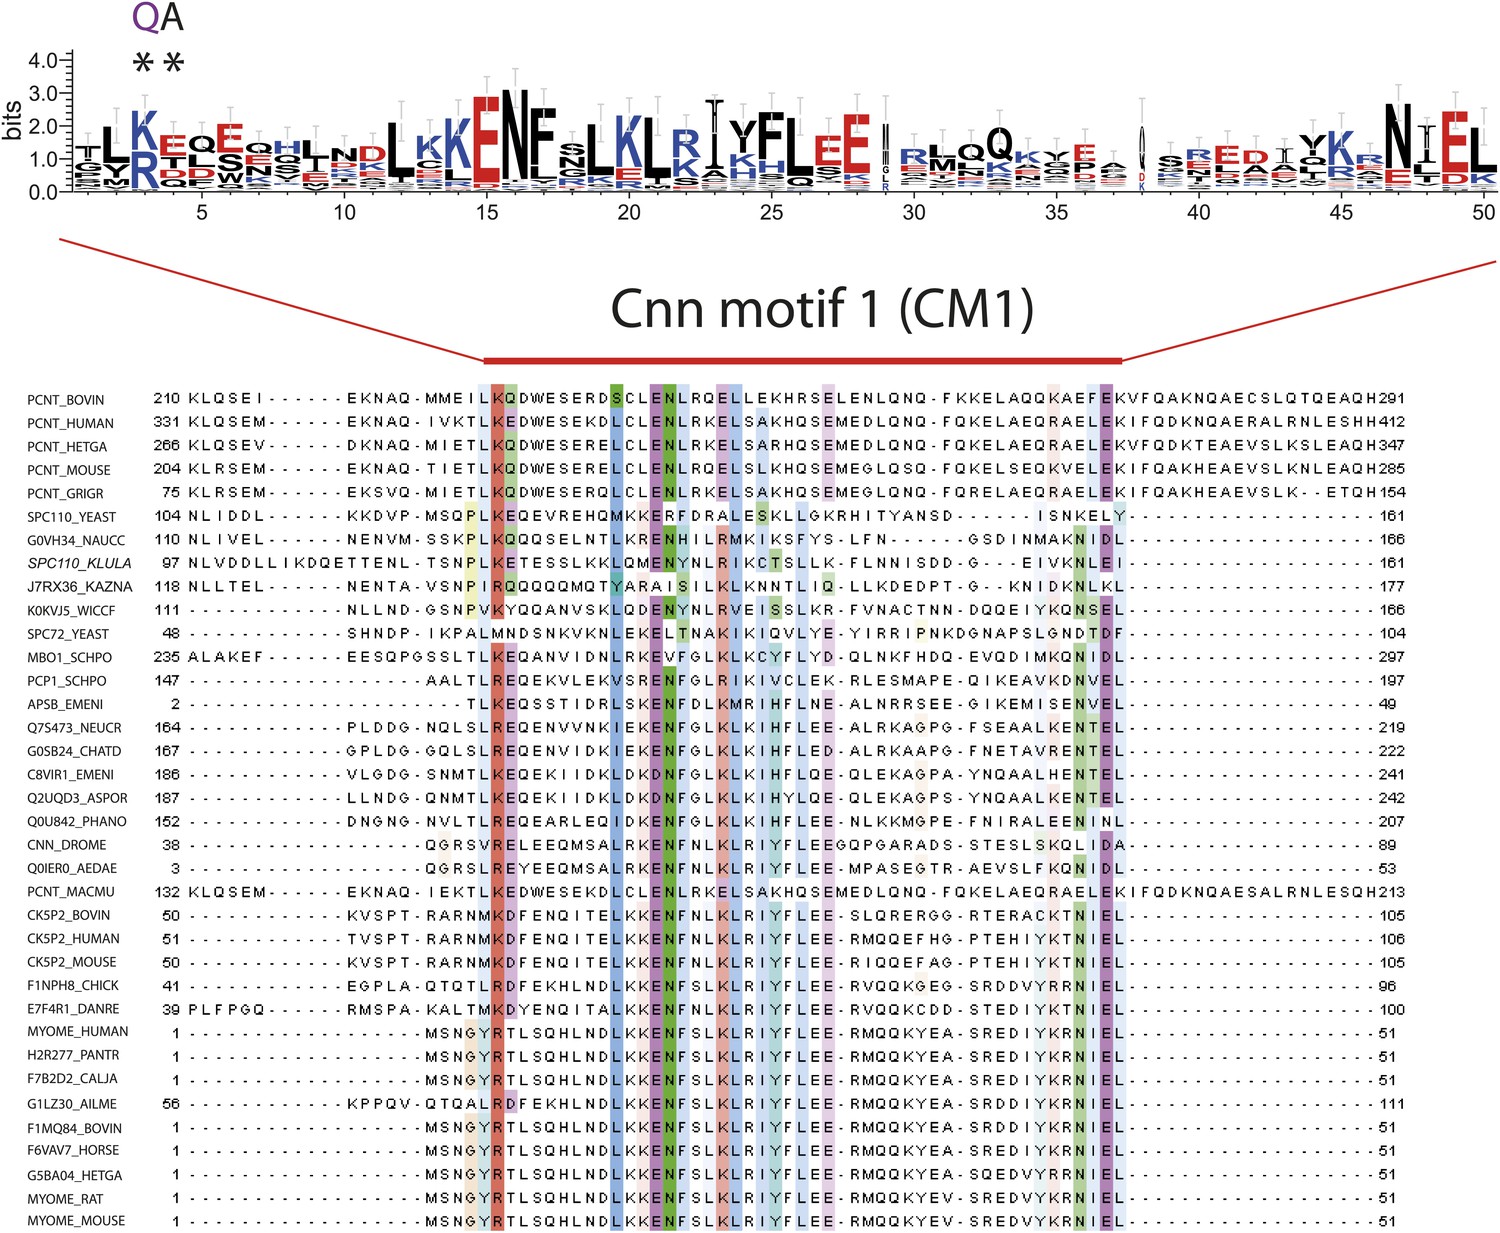
Multiple sequence alignment of CM1 motif-containing proteins.
Multiple sequence alignment of selected γ-TuSC receptor family members containing CM1 motifs. Two of the most conserved residues within CM1 motif are marked with asterisks and mutated to disrupt CM1 function in the spc110CM1-QA mutant. The occurrence of each amino acid in each position of CM1 motif is presented with Weblogo 2.0.
Figure 3
Phosphorylation of N-Spc110 regulates the affinity to γ-TuSC.
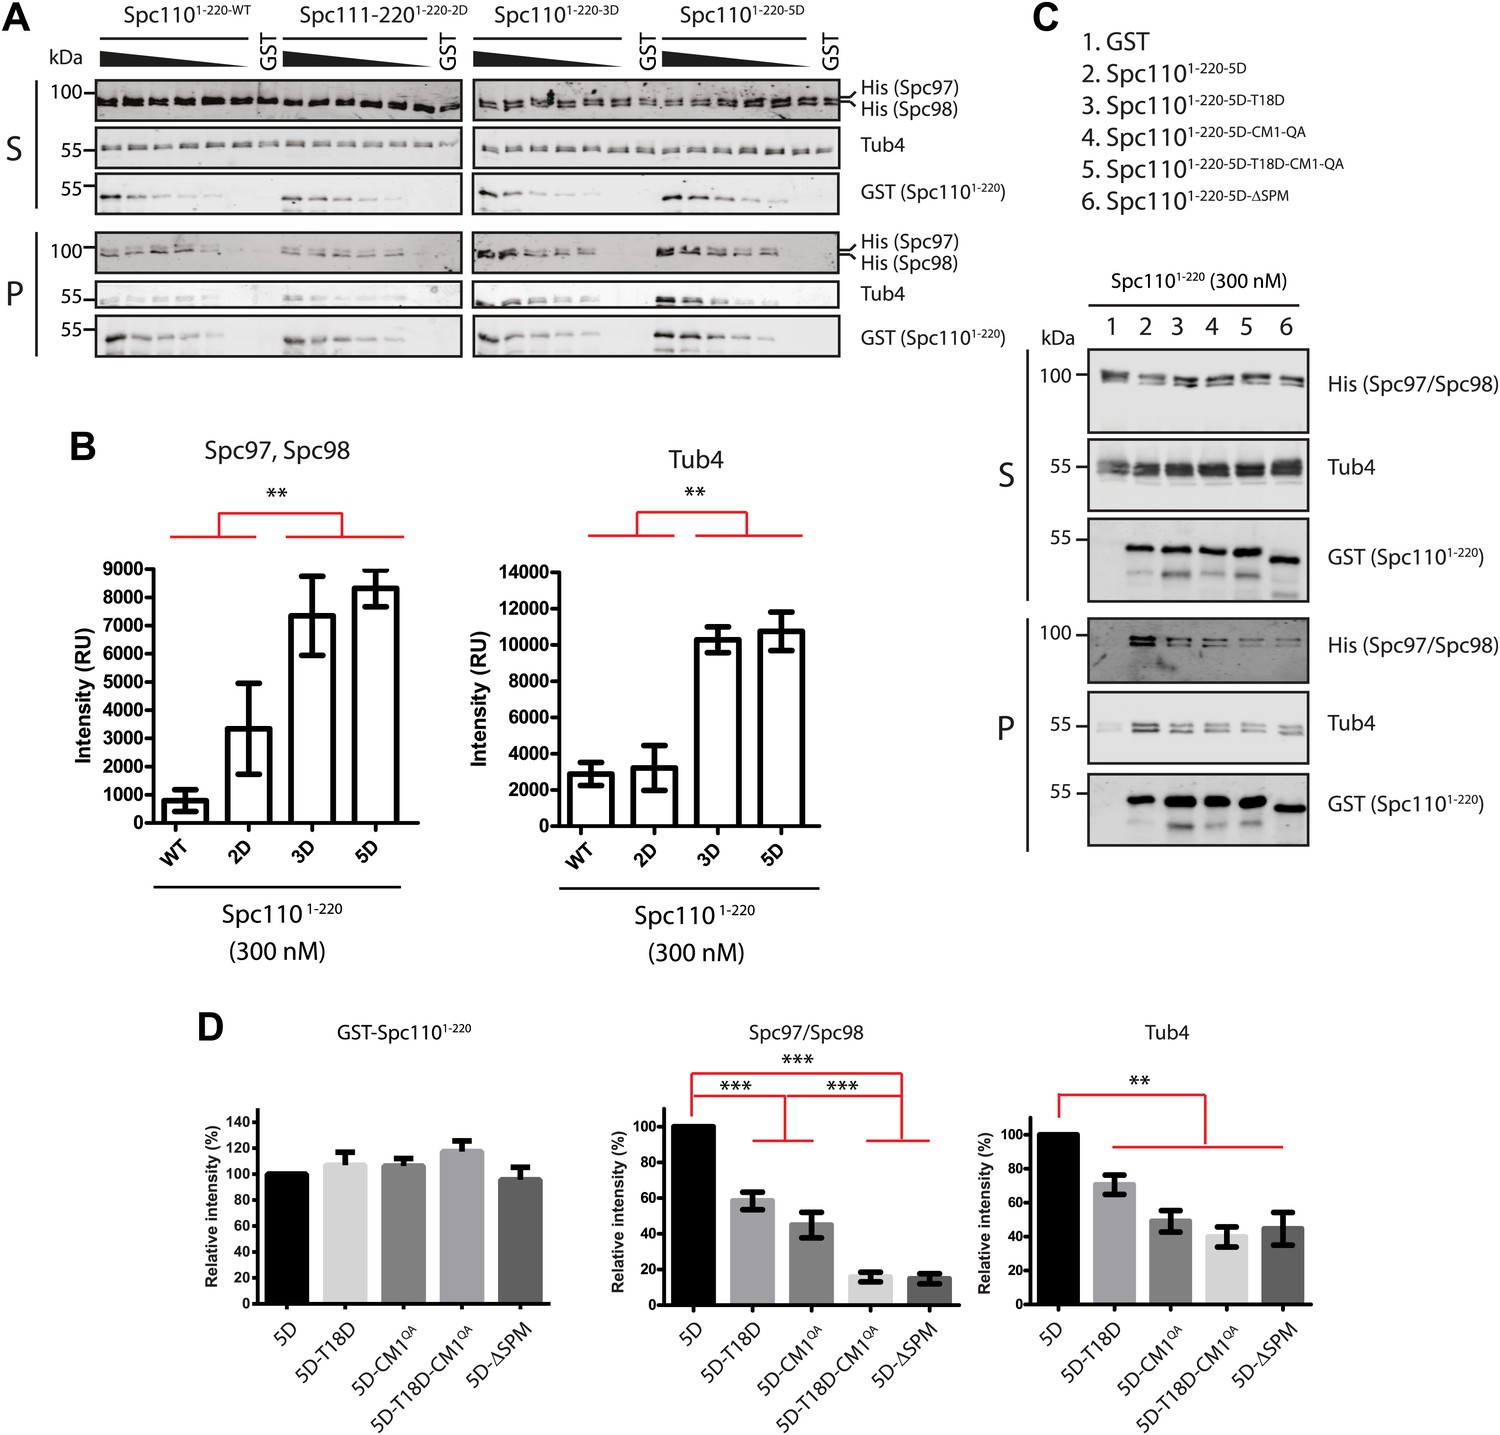
(A) GST pull-down assays were performed between γ-TuSC (containing His-tagged Spc97-6His and Spc98-6His) and the GST-tagged Spc1101–220 proteins. The bound proteins were eluted with sample buffer and separated on SDS-PAGE and analyzed by immunoblotting with anti-His, anti-GST, and anti-Tub4 antibodies. Infrared-dye-labelled secondary antibodies were applied and detected with Li-cor imaging system. (B) Quantification for bound Spc97, Spc98, and Tub4 from (A) at 300 nM Spc1101–220. ** marks statistical significance at p<0.01. Error bars represent SEM. N = 3 for the number of experiments performed. (C) Mutations in SPM or CM1 affect γ-TuSC binding. As (A) but performed with the indicated SPM and CM1 mutant Spc1101–220 constructs. (D) Quantification of Spc1101–220 variants and bound Spc97, Spc98, and Tub4 from (C) at 300 nM Spc1101–220. ** marks statistical significance at p<0.01 and *** at p<0.001. Error bars represent SEM. N = 3 for the number of experiments performed.
Figure 4
Spc1101–220 phosphorylation enhances MT nucleation activity in vitro.
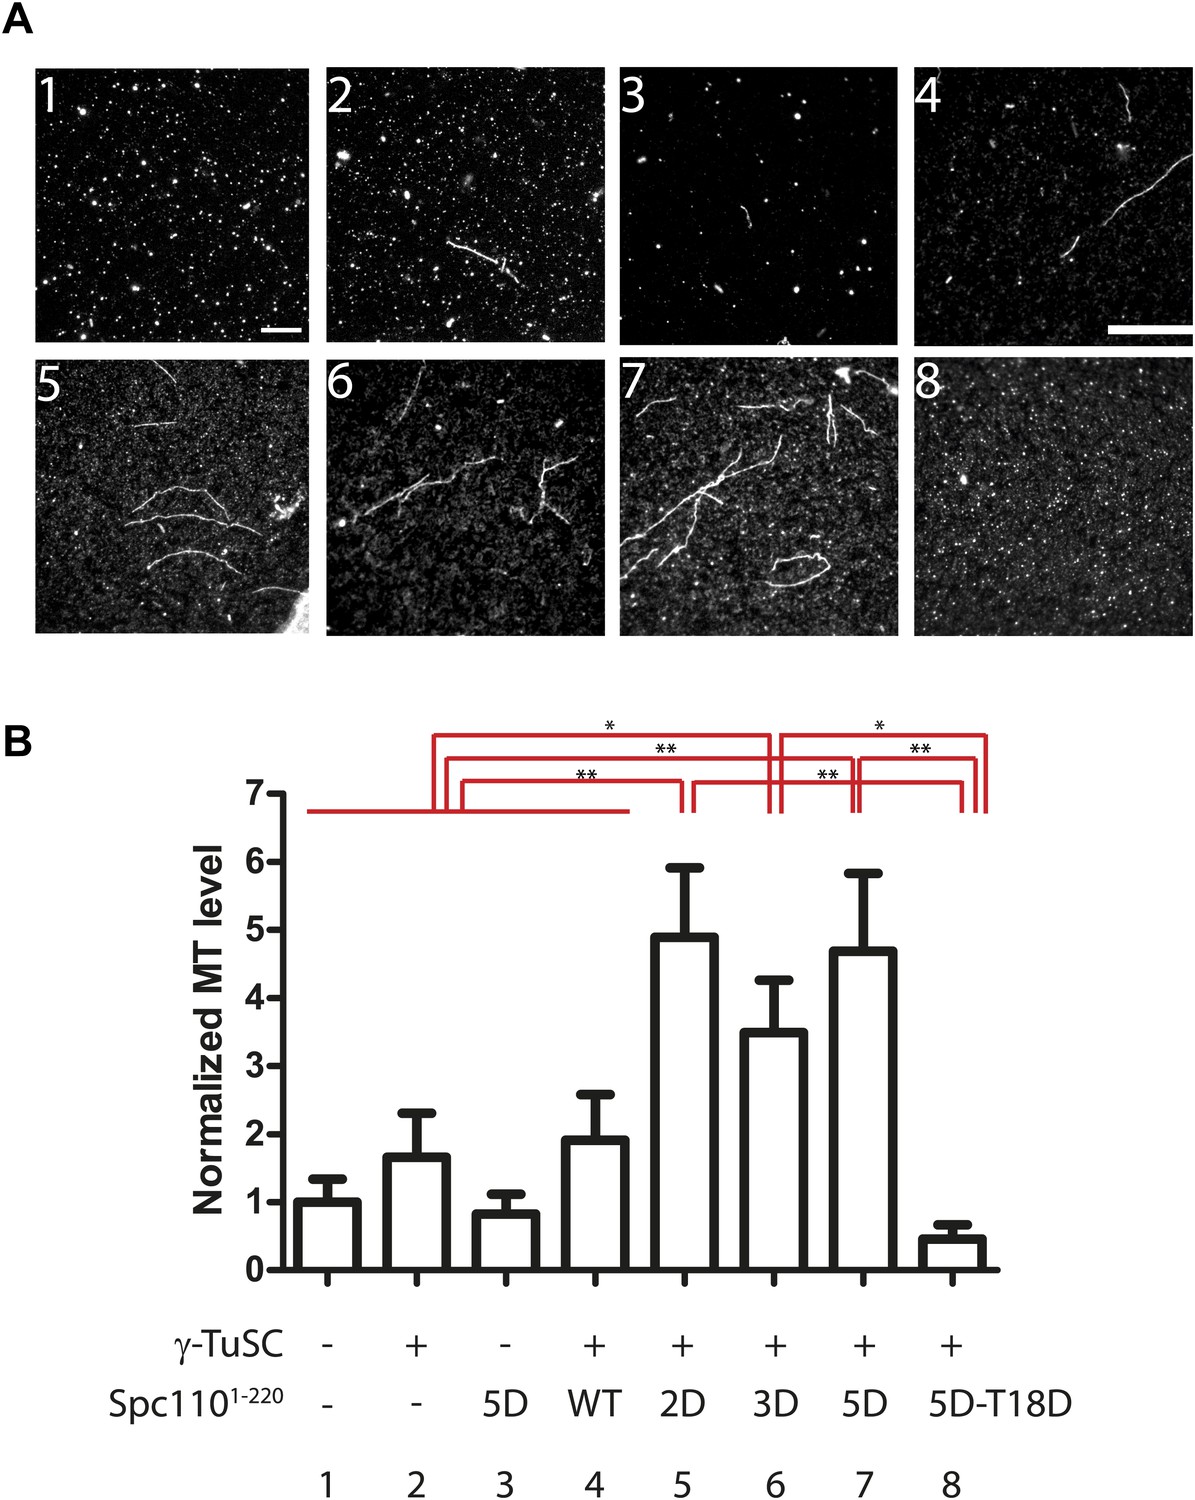
(A) Enhancement of MT nucleation activity of Spc110 by Mps1 and Cdk1 phosphorylation. Representative image fields of Alexa546-labeled microtubules from the nucleation assay polymerized in the presence of buffer, γ-TuSC and Spc1101–220 variants (B). Scale bar: 10 µm. (B) Quantification of the MT nucleation assay. For each experiment, the number of MTs was counted from 20 fields. The MTs/field was normalized with MTs/field obtained by the MT nucleation reaction in the presence of buffer only. N = 6 to 9 for the number of independent experiments performed. * marks statistical significance at p<0.05 and ** at p<0.01. Error bars represent SEM.
Figure 5 with 1 supplement

Cell cycle dependent phosphorylation of Spc110.
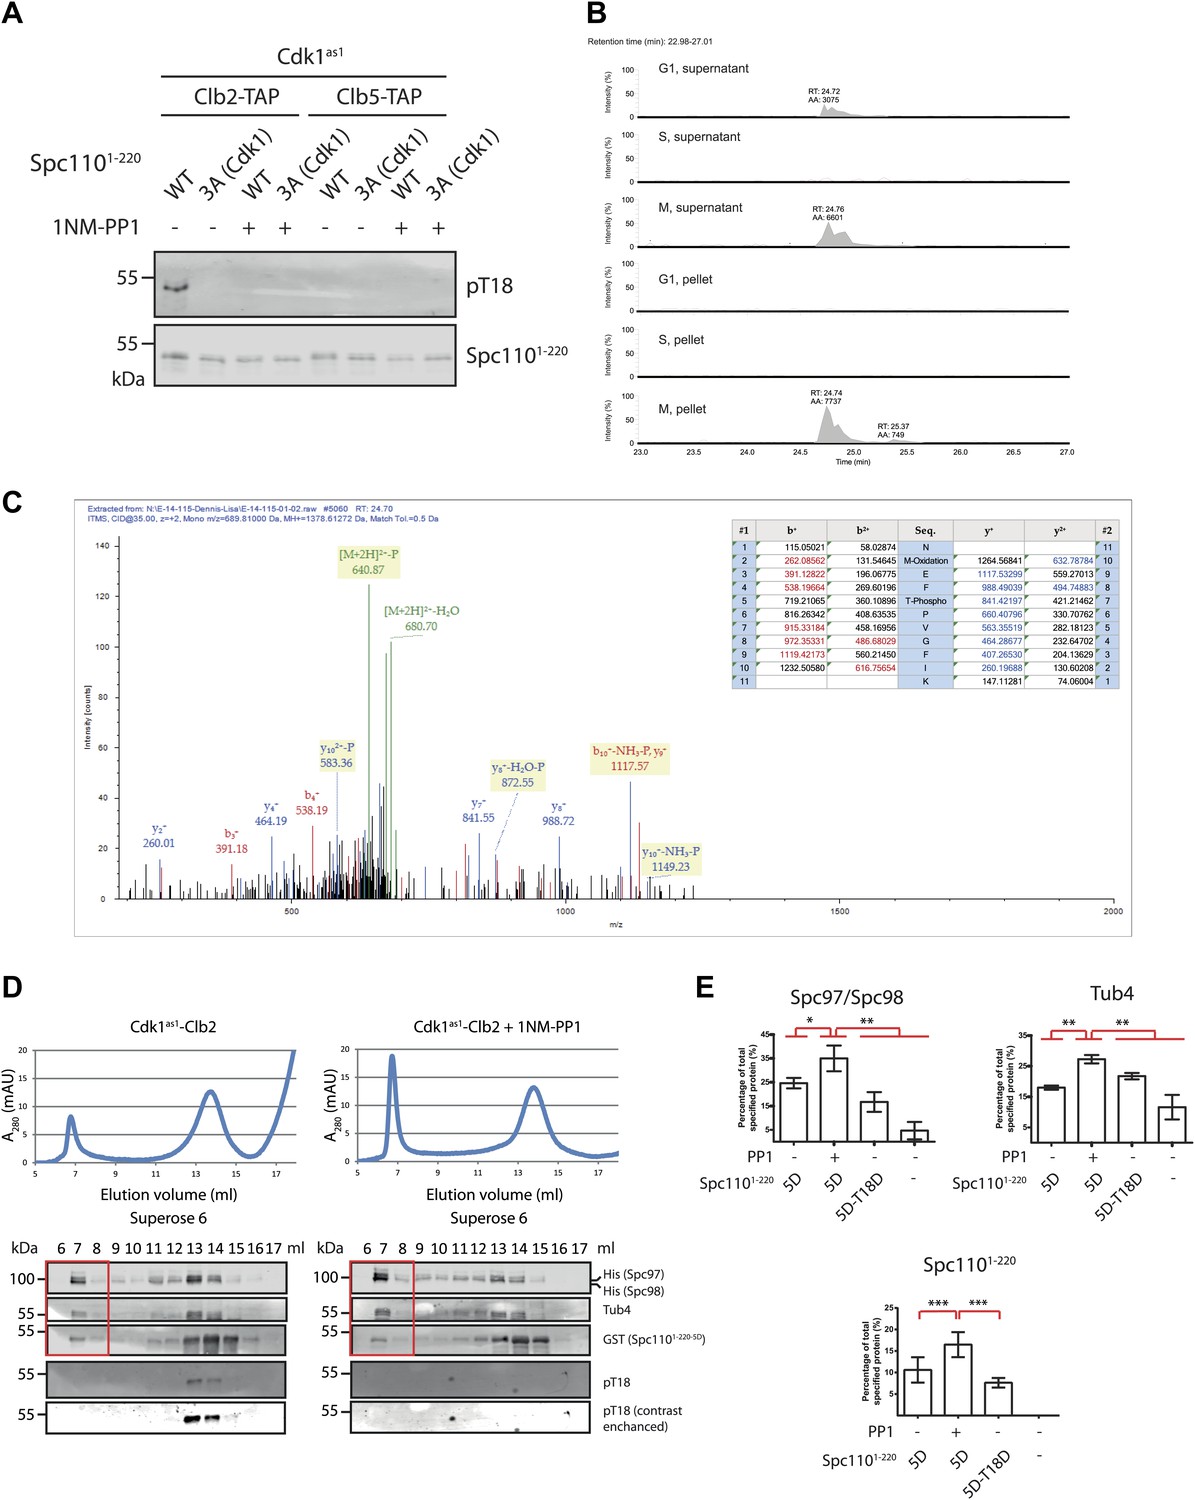
(A and B) Two phospho-specific antibodies were generated from guinea pigs to recognize phosphorylation of Cdk1 sites (pS36-pS91) (A) and Mps1 sites (p60-p64-pT68) (B). In vitro kinase assays were performed in the presence of recombinant Mps1 or Cdk1as1 and Spc1101–220, either wild type (WT) or non-phosphorylatable variants as indicated. 3A (Cdk1) indicates T18A-S36A-S91A and 3A (Mps1) S60A-T64A-T68A. In vitro phosphorylated Spc1101–220 was subjected to SDS-PAGE and immunoblot with the corresponding phospho-specific antibodies. The specific kinase activity of Cdk1as1-Clb2 and Cdk1as1-Clb5 was compared using human histone H1 as substrate (A, bottom). The numbers in the histone H1 experiment represent the relative kinase activity. As negative control of kinase activity, Mps1 was inactivated with chemical inhibitor SP600125 (B), while Cdk1as1-Clb2 and Cdk1as1-Clb5 overexpressed and purified from budding yeast were inactivated with 1NM-PP1 (A). (C) Phosphorylation of Spc110 and Spc1105A in vivo. SPC110-GFP wild type cells (WT) and spc1105A-GFP cells were arrested in mitosis with nocodazole. Spc110-GFP was enriched using GFP binder conjugated to beads, and the bound proteins were subject to immunoblotting with the indicated antibodies. (D) SPC110-GFP wild type cells were arrested in G1, S phase, and mitosis as indicated. Spc110-GFP was enriched with GFP-binder and analyzed by immunoblotting with the indicated P-specific antibodies. A non-specific band was used as loading control.
Figure 5—figure supplement 1
Phosphorylation of T18 most likely affects γ-TuSC oligomerization promoting activity of Spc110 in a negative manner.
(A) Phospho-specific antibody against phospho-T18 (pT18) was generated from guinea pigs. In vitro kinase assays were performed in the presence of Cdk1as1 and Spc1101–220, either wild type (WT) or non-phosphorylatable Spc1101–220-3A (Cdk1) (T18A-S36A-S91A). In vitro phosphorylated Spc1101–220 was subjected to SDS-PAGE and immunoblot with the phospho-specific antibody. As negative control of kinase activity, Cdk1as1-Clb2 and Cdk1as1-Clb5 overexpressed and purified from budding yeast were inactivated with 1NM-PP1. Note that the same Spc1101–220 samples were analyzed in Figure 5A with the anti-pS36-pS91 antibody. The Spc1101–220 blot on the bottom is the same as in Figure 5A. (B) Quantification of tryptic phospho-T18 peptide (NMEFpTPVGFIK). Data were acquired in a data independent fashion in a pseudo MRM experiment in the Orbitrap mass spectrometer fragmenting peptides with m/z = 689.81. Extracted ion chromatogram of phosphorylated NMEFTPVGFIK was quantified. Expected retention time of the tryptic phospho-T18 peptide is 24.7 min. (C) Mass spectrum of fragmented phospho-T18 peptide. The graph summarizes the identified fragmented ions. (D) Gel filtration chromatograms of γ-TuSC. Spc1101–220-5D was incubated with Cdk1as1-Clb2 in the presence (+1NM-PP1) and absence of the Cdk1as1 inhibitor 1NM-PP1 and ATP. This allowed Spc110T18 phosphorylation in the absence but not in the presence of 1NM-PP1. Adding 1NM-PP1 stopped all Cdk1as1 kinase reactions. The so modified Spc1101–220-5D-pT18 was then incubated with γ-TuSC. γ-TuSC was analysed by gel filtration using a Superose 6 column for oligomerization. The gel filtration fractions were analyzed by immunoblotting for Spc97/Spc98, Tub4, Spc1101–220, and Spc1101–220−pT18 distribution. The anti-pT18 blot on the bottom is a 25-times of contrast enhancement of the blot on top. Fractions covering the void-volume peak were marked with a red rectangle outline. (E) Quantification of void-volume fractions shown in (D). Spc1101–220-5D-T18D was included as control. Indicated protein band intensities of fractions covering the void-volume peak (red rectangle outline in (D)) were summed and divided by the total intensity of fractions. * marks statistical significance at p<0.05, ** at p<0.01, and *** at p<0.001. Error bars represent SEM. N = 4 for the number of experiments performed.
Figure 6 with 1 supplement
Cells with spc110 phospho-, SPM-, or CM1-mutant alleles have defects in spindle formation.
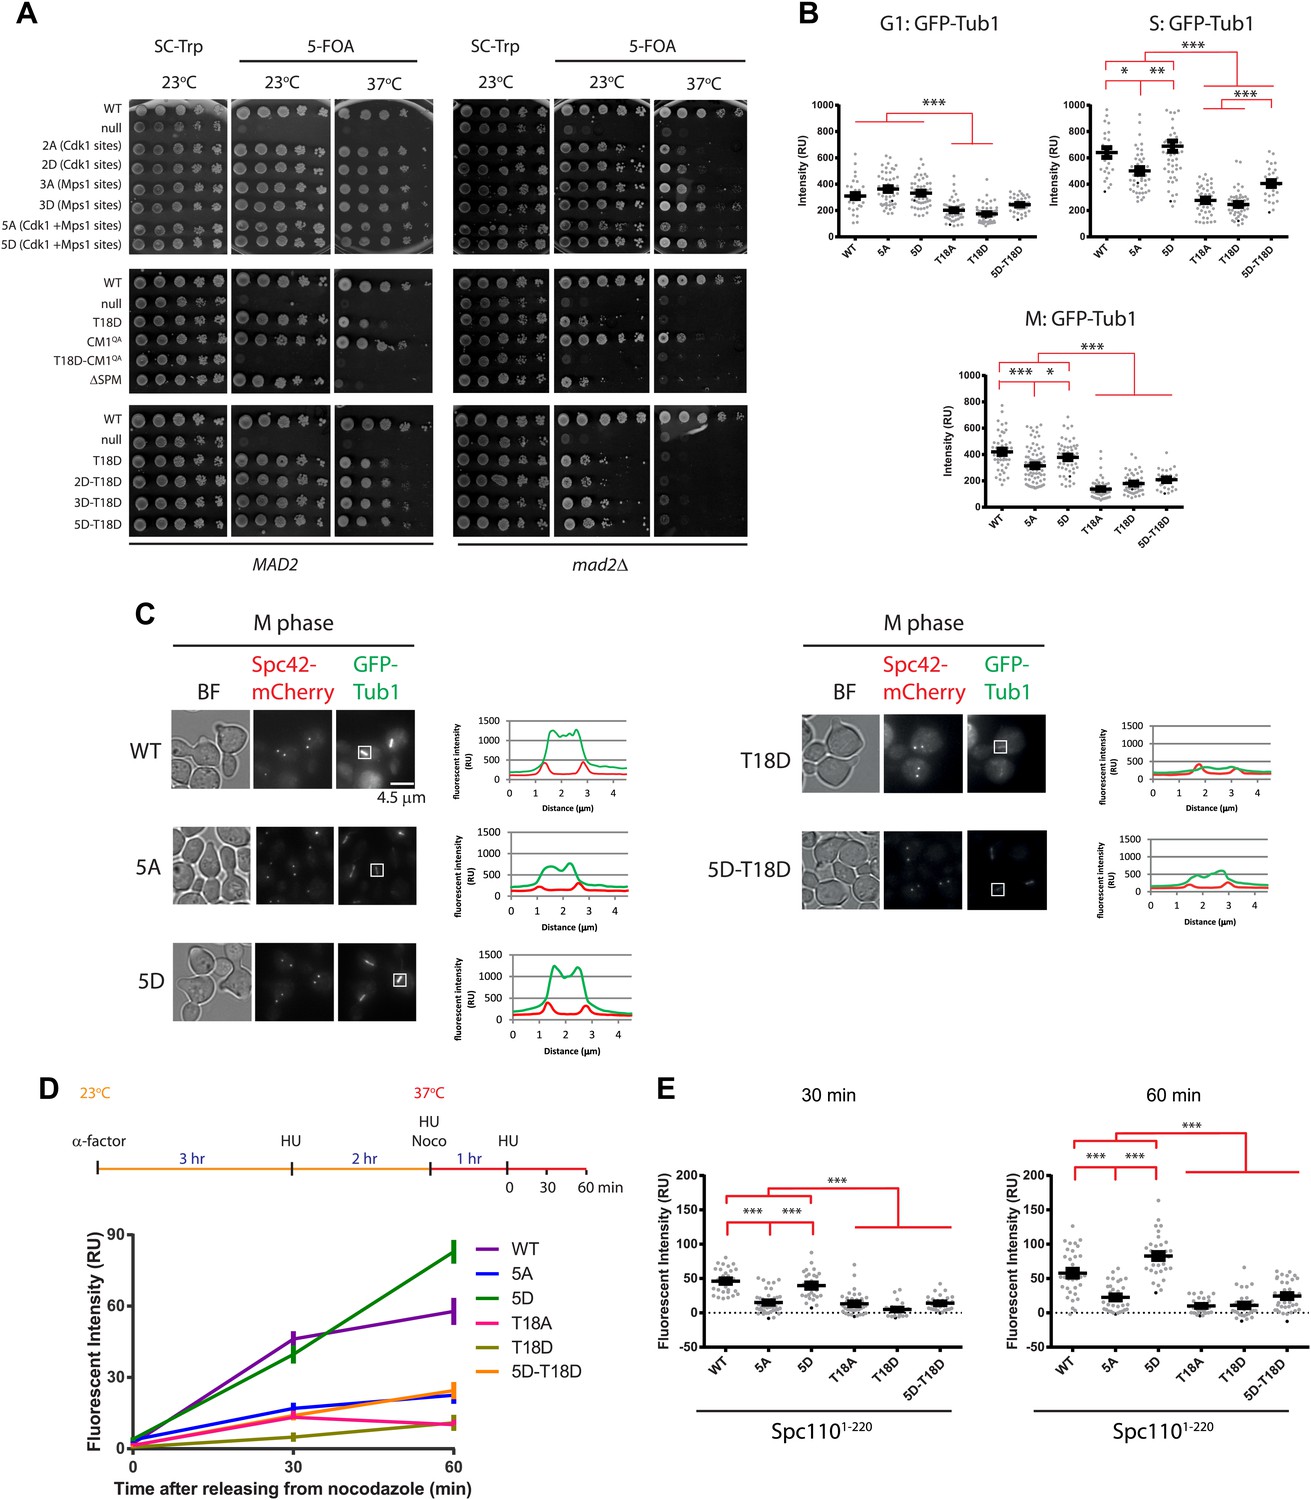
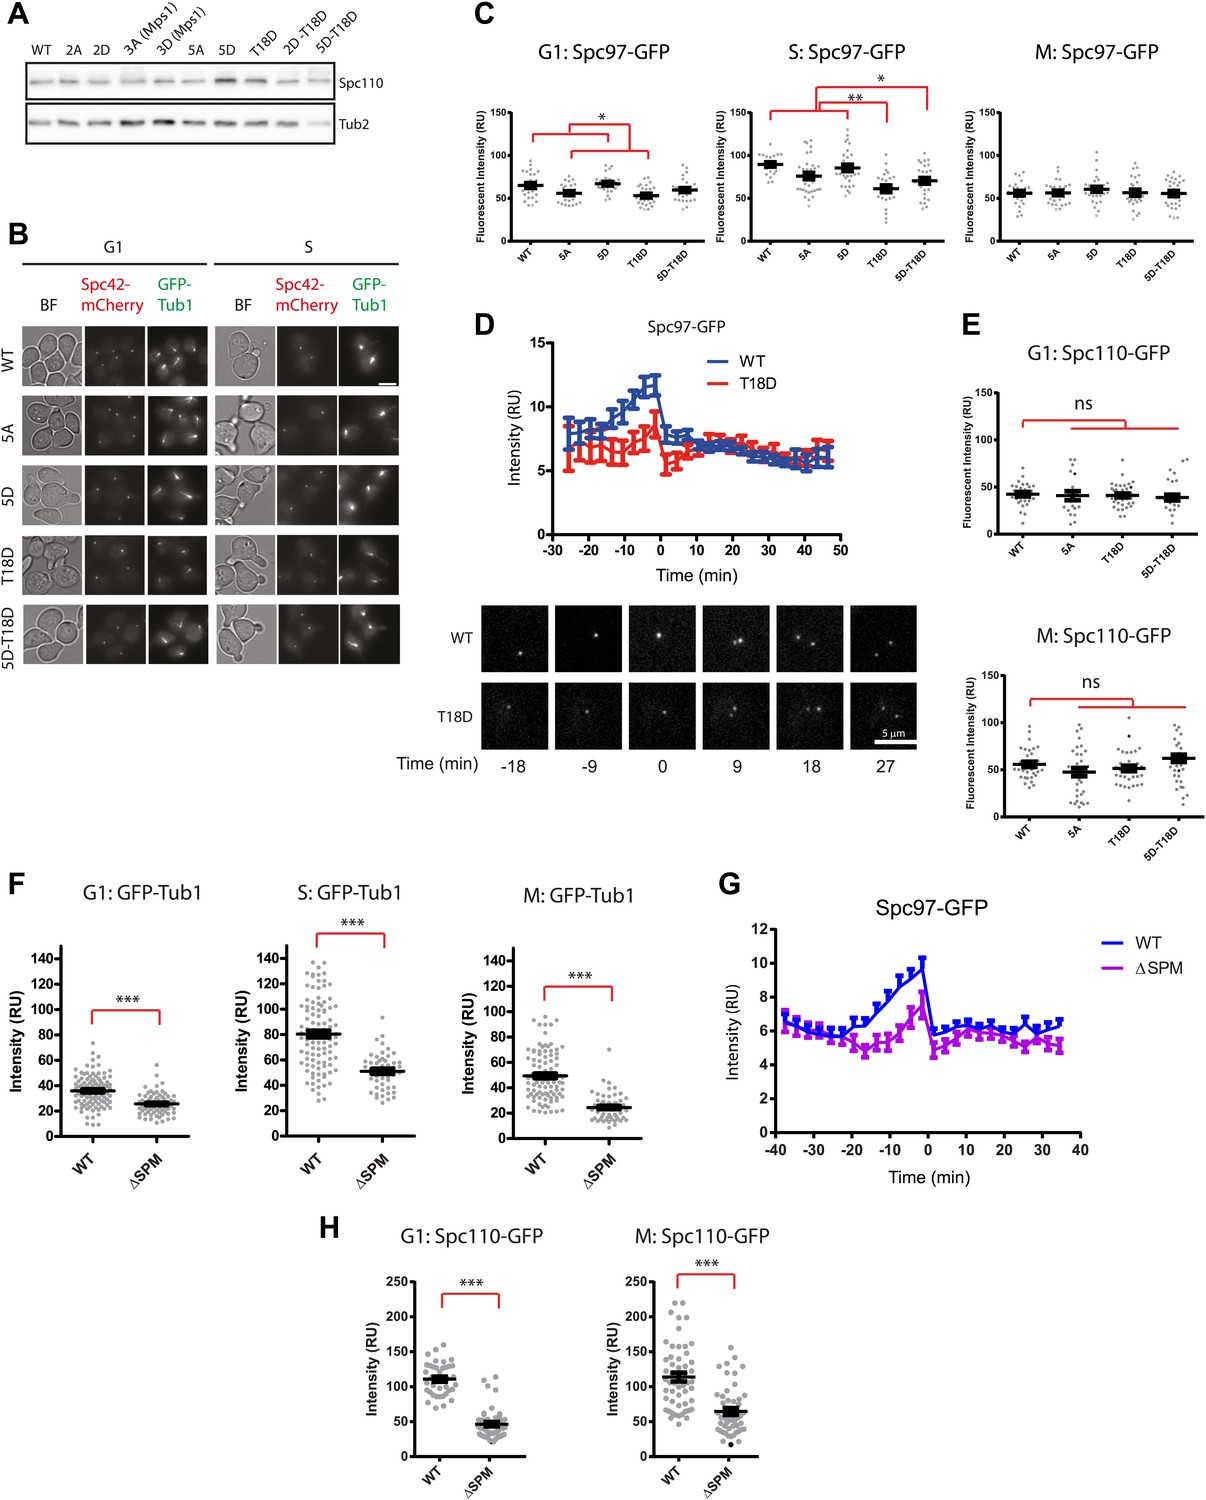
(A) Growth of 10-fold serial dilutions of SPC110 shuffle strains with integration vector encoding SPC110 (WT) or SPC110 mutants with and without the SAC gene MAD2. Growth was tested either on synthetic complete (SC) plates containing 5-FOA or SC dropout plates. (B) The indicated SPC110 wild type cells and spc110 mutant cells carrying GFP-TUB1 SPC42-mCherry were incubated at 37°C, the restrictive temperature of some of the spc110 mutants (Figure 6A). The fluorescent signal of GFP-Tub1 at SPBs was quantified in G1 phase cells (no buds), early S phase cells (small bud with unsplit SPBs) and M phase cells (large bud with split SPBs and spindle length within 2 μm). 50 cells were analyzed per cell cycle phase and strain. Error bars represent SEM. * marks statistical significance at p<0.05, ** at p<0.01, and *** at p<0.001. N = 2 or 3 for the number of experiments performed. (C) The representative metaphase cells from (B) were scanned for the distribution of the GFP-Tub1 and the Spc42-mCherry signal along the spindle axis. Scale bar: 4.5 µm. (D) In vivo MT re-nucleation assay. Wild-type SPC110 cells (WT) and the indicated spc110 cells with GFP-TUB1 were treated as indicated in the outline. The GFP-Tub1 signal at SPBs was measured at 0, 30, and 60 min after nocodazole washout. N = 40 for the number of cells analyzed per time point and strain. Error bars represent SEM. (E) Data of (D) after 30 and 60 min. Error bars represent SEM. *** marks statistical significance at p<0.001.
Figure 6—figure supplement 1
Phenotype of SPC110 mutants.
(A) There was no significant difference in the protein levels of Spc110 variants. Asynchronous cells grown to OD600 0.5 were harvested and subjected to TCA extraction for whole cell protein lysates. SDS-PAGE and immunoblotting with anti-Spc110 were performed. Tub2 was loading control. (B) The representative images of wild type SPC110 (WT) and spc110 cells in G1 (no bud) and S phase (small bud). Microtubules were marked with GFP-Tub1 and SPBs were marked with Spc42-mCherry. See Figure 6B for experimental set-up. BF: bright field. Scale bar: 4.5 µm. (C) The indicated wild type SPC110 (WT) and spc110 cells were grown at 37°C. The cell cycle stages were determined according to cell morphology and spindle length. Unfixed cells were analyzed for Spc97-GFP signal at SPBs. N = 30 for the number of cells analyzed for each category. * marks statistical significance at p<0.05 and ** at p<0.01. Error bars represent SEM. (D) SPC110 and spc110T18D cells with SPC97-GFP were analyzed by time lapse analysis. The fluorescent intensity was recorded and measured over time (top). Error bars represent SEM. N = 17 for the number of cells analysed for each strains. The Spc97-GFP signals of selected cells are shown on the bottom. Scale bar: 5 μm. (E) The indicated wild type SPC110 (WT) and spc110 cells were grown at 37°C. The cell cycle stages were determined according to cell morphology and spindle length. Unfixed cells were analyzed for Spc110-GFP signal at SPBs. Error bars represent SEM. N = 30 for the number of cells analyzed for each category. (F) Similar experiment as performed in Figure 6B. The indicated SPC110 wild type and spc110ΔSPM carrying GFP-TUB1 SPC42-mCherry were incubated at 37°C. The fluorescent signal of GFP-Tub1 at SPBs was quantified in G1 phase cells (no buds), early S phase cells (small bud with unsplit SPBs) and M phase cells (large bud with split SPBs and spindle length within 2 μm). 100 cells were analyzed per cell cycle phase and strain. Error bars represent SEM. ** marks statistical significance at p<0.01, and *** at p<0.001. (G) Similar experiment as performed in (D) with SPC110 and spc110ΔSPM cells. SPC110 and spc110ΔSPM cells with SPC97-GFP were analyzed by time lapse analysis. Error bars represent SEM. N = 17 for the number of cells analysed for each strain. (H) Similar experiment as performed in (E). The wild type SPC110 (WT) and spc110ΔSPM cells were grown at 37°C. The cell cycle stages were determined according to cell morphology and spindle length. Unfixed cells were analyzed for Spc110-GFP signal at SPBs. Error bars represent SEM. N = 40 for the number of cells analyzed for each category.
Figure 7 with 2 supplements
The N-terminus of Spc98 mediates binding to N-Spc110.
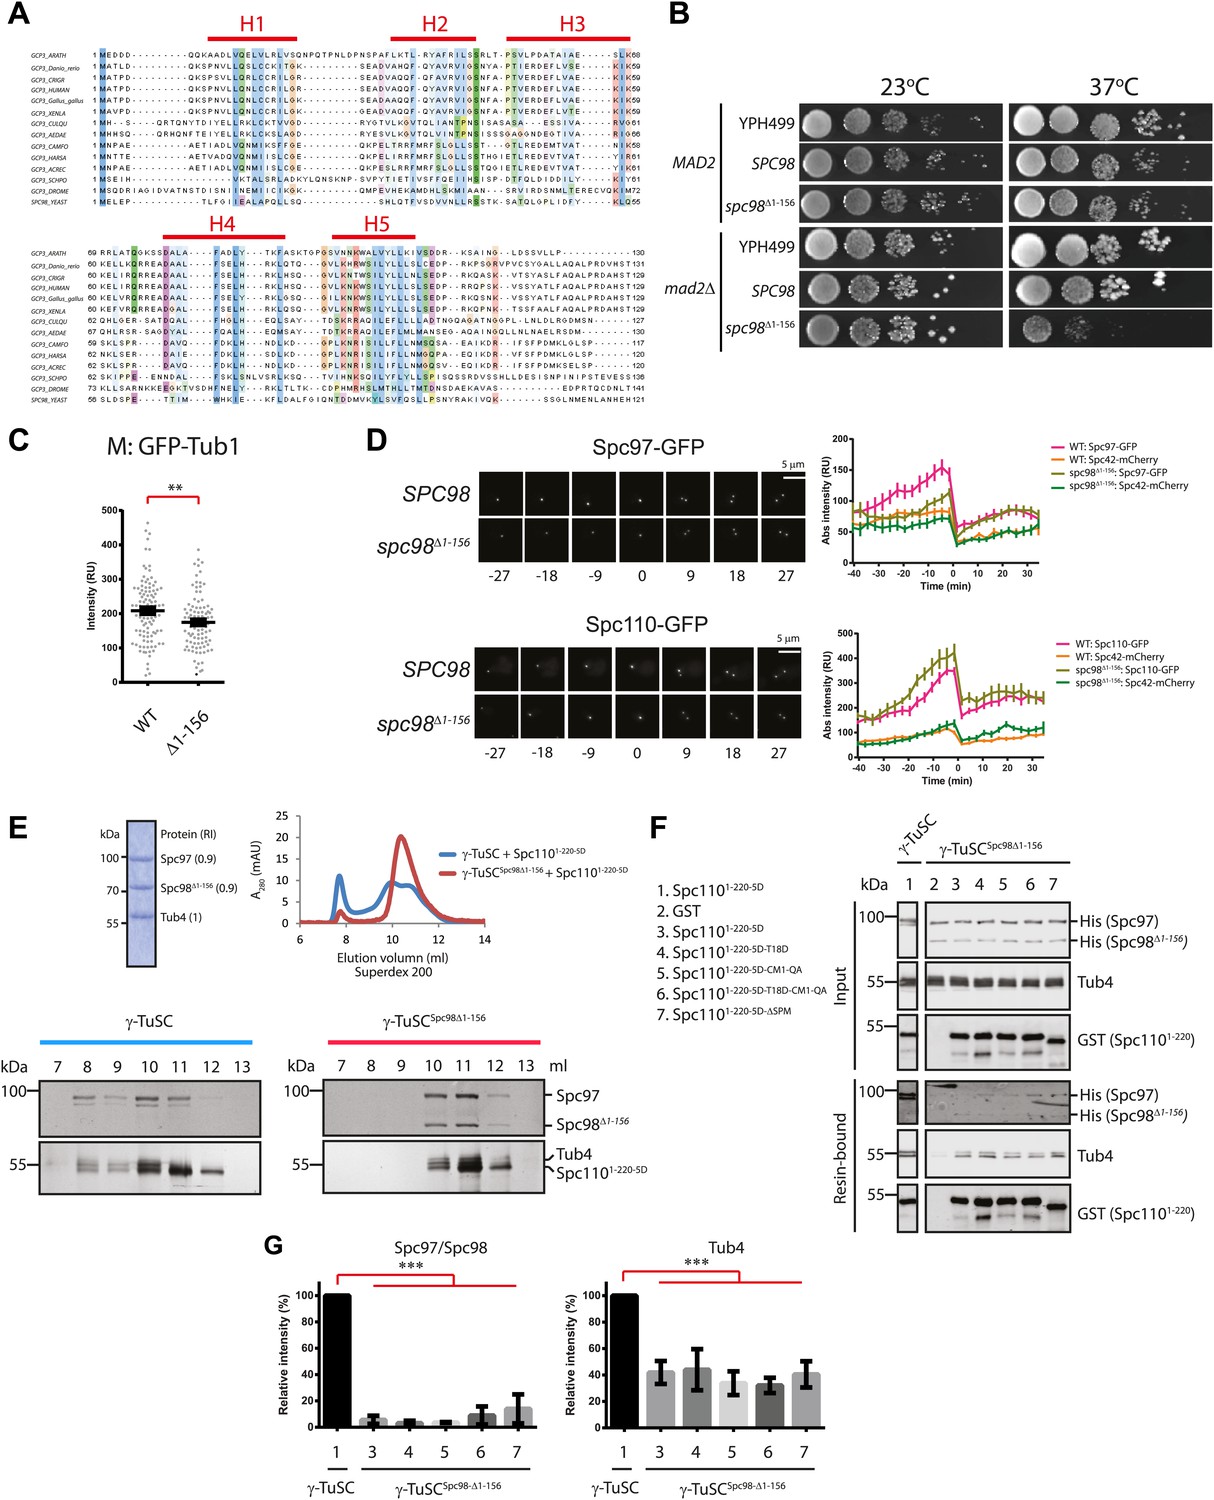
(A) Alignment of the amino acid sequence of GCP3 homologues from yeast to human. Shown are the putative α-helical regions H1–H5. Residues are marked according to the ClustalX colour scheme. (B) Growth test of spc98Δ1–156 cells with and without the SAC gene MAD2 at 23°C and 37°C. “SPC98” indicates the spc98ΔSPC98 cells while YPH499 is the unmodified wild type strain. (C) GFP-Tub1 signal at SPBs in SPC98 wild type or spc98Δ1–156 cells. The experiment was performed as in Figure 6B. ** marks statistical significance at p<0.01. N = 100 cells analysed for each strain. (D) SPC98 and spc98Δ1–156 cells with SPC42-mCherry, SPC97-GFP, or SPC110-GFP were analyzed by time lapse analysis. The fluorescent intensity was measured over time (right). t=0 for the time point of SPB separation. Error bars represent SEM. N = 14 and 19 for the number of cells analysed in SPC97-GFP and SPC-110-GFP strains respectively. The Spc97-GFP and Spc110-GFP signals of selected cells are shown on the left panel. Scale bar: 5 μm. (E) Spc1105D combined with γ-TuSCSpc98Δ1–156 fails to induce oligomerization in TB150 buffer. The experiment was performed as in Figure 2B. The purified γ-TuSCSpc98Δ1–156 after SDS-PAGE and Coomassie Blue staining is shown with relative intensity of the protein bands. The protein distribution in the Superdex 200 10/300 chromatogram was analyzed with SDS-PAGE and silver staining. (F) Binding of γ-TuSC and γ-TuSCSpc98Δ1–156 to Spc1101–220 mutant proteins. The binding reaction was performed and analyzed by immunoblotting as described in Figure 3A. (G) Quantification of Figure 7F. Pull-downed Spc97, Spc98, and Tub4 proteins at 300 nM Spc1101–220-5D. Error bars represent SEM. N = 3 for the number of experiments performed. *** marks statistical significance at p<0.001.
Figure 7—figure supplement 1
The importance of the N-terminal region of Spc98.
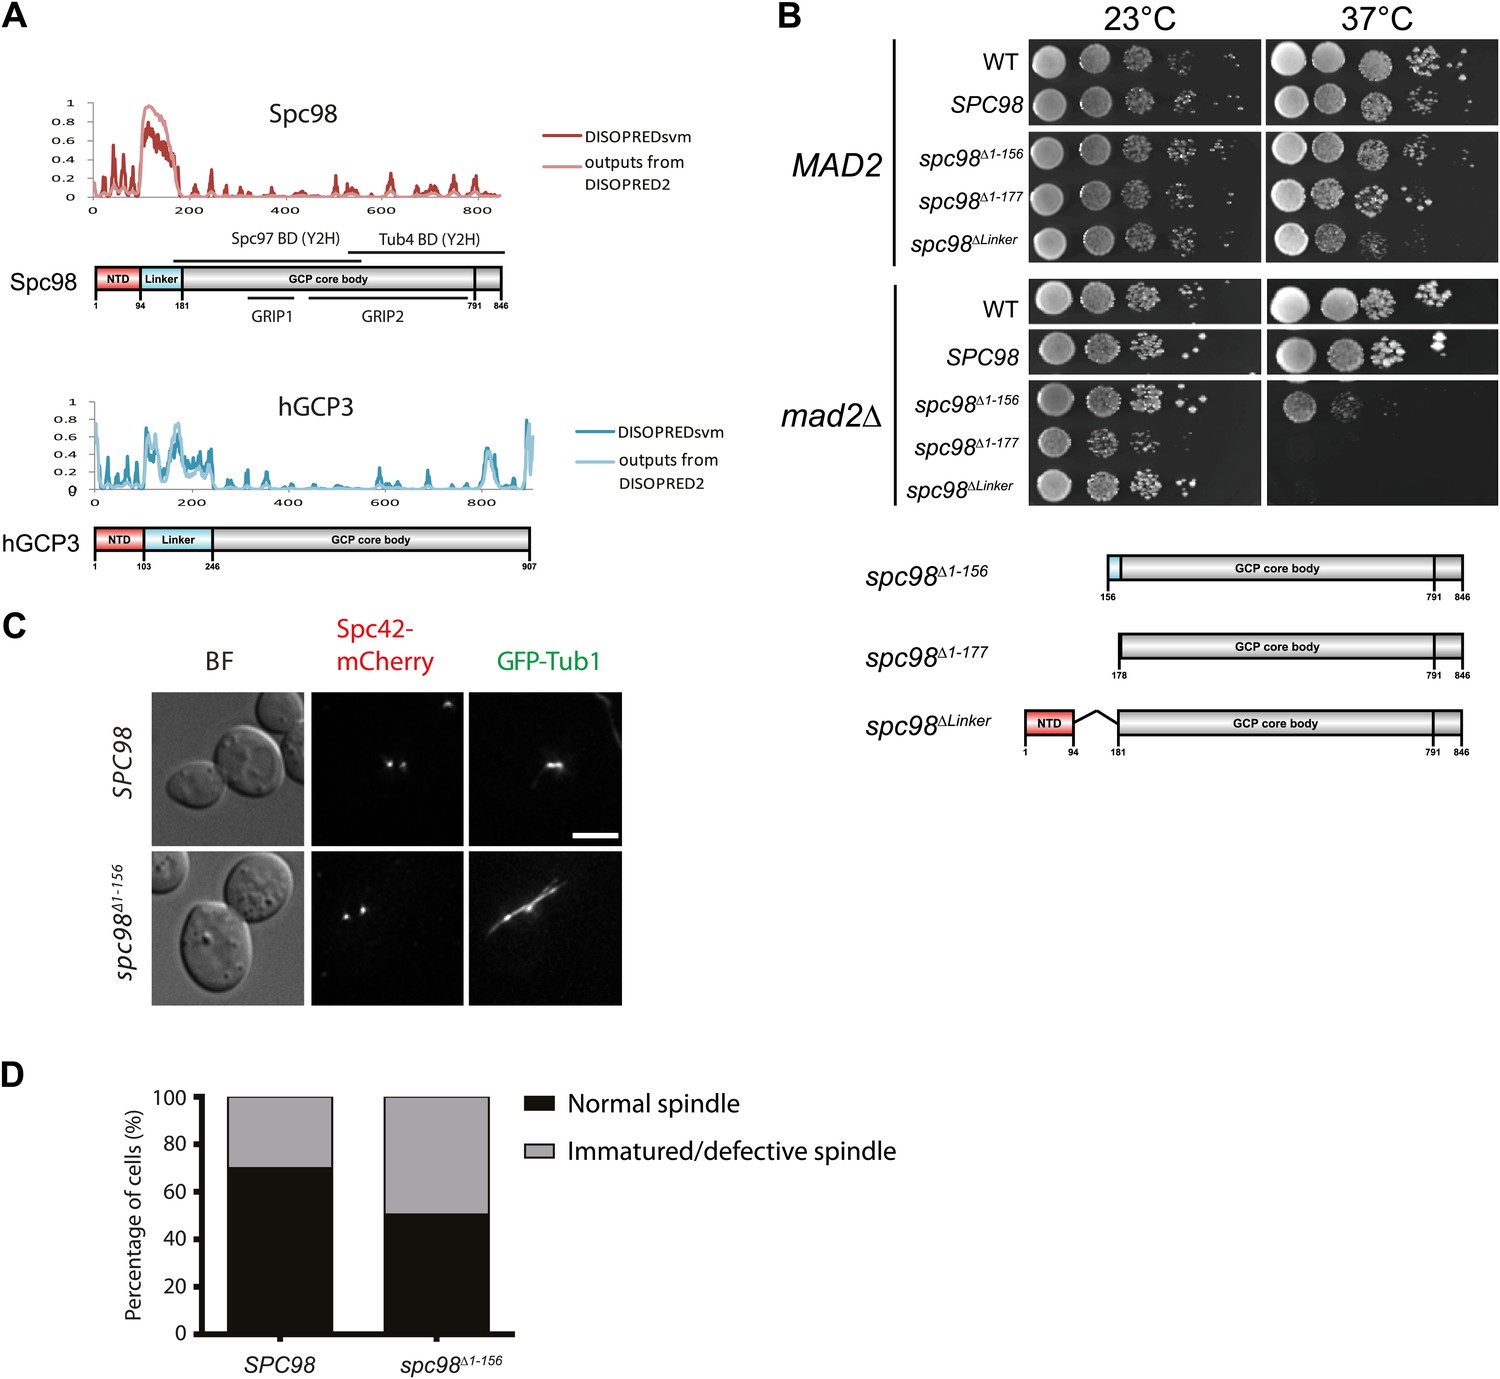
(A) Structure and functional domain organization of budding yeast Spc98 and human GCP3. Both Spc98 and GCP3 share the conserved N-terminal domain (NTD), the GCP core body and the divergent, unstructured linker connecting NTD and GCP core body. The GRIP1 region is within the region interacting with Spc97, while the GRIP2 covers the region interacting with Tub4 (Knop et al., 1997; Pereira et al., 1998; Wiese and Zheng, 2006; Kollman et al., 2010). (B) The growth test of MAD2 or mad2Δ cells with spc98 N-terminal truncated mutant alleles. Serial diluted cells were spotted on YPAD plates and incubated at indicated temperatures for two or three days. SPC98 indicates the spc98Δ SPC98 cells while WT is the unmodified wild type strain. The design of each truncated variant is shown in the cartoon below. (C) The representative images of spc98Δ1–156 cells in M phase (large budded, bipolar spindle within 2 μm long). SPC98 wild type and spc98Δ1–156 cells with SPC42-mCherry GFP-TUB1 were grown at 37°C for 2 hr. Metaphase-like cells were analyzed for the presence of bipolar spindles. BF: bright field. Scale bar: 4 μm. (D) Quantification of MT phenotype of metaphase cells of (C). One hundred SPC98 and spc98Δ1–156 cells with a large bud and a SPB distance of ∼2 µm were categorized into ‘normal spindle’ or ‘immature/defective spindle’.
Figure 7—figure supplement 2

γ-TuSCSpc98Δ1–156 maintains self-oligomerization capability in BRB80 buffer.
(A) γ-TuSCSpc98Δ1–177 was purified from insect cells, incubated in TB150 buffer, and then analyzed by Superose 6 10/300. The left panel presents the Coomassie Blue stained SDS-gel of purified γ-TuSCSpc98Δ1–177. (B) γ-TuSCSpc98Δ1–177 in fraction 7 from (A) were subjected to negative staining and analyzed with electron microscopy. The particles showed irregular morphology, suggesting the formation of protein aggregates. Corresponding scale bars are shown in the images. (C) Similar experiment as performed in (A). Purified γ-TuSCSpc98Δ1–156 was incubated in TB150 or BRB80 buffer and then analyzed by Superose 6 10/300. γ-TuSCSpc98Δ1–156 oligomerized in BRB80 but not in TB150 buffer. (D and E) Similar experiment as performed in (B). After the gel filtration shown in (C), the peak fraction of γ-TuSCSpc98Δ1–156 (fraction 7 in BRB80 and fraction 13 in TB150) was subjected to negative staining and analyzed with electron microscopy. Corresponding scale bars are shown on the images.
Figure 8 with 1 supplement
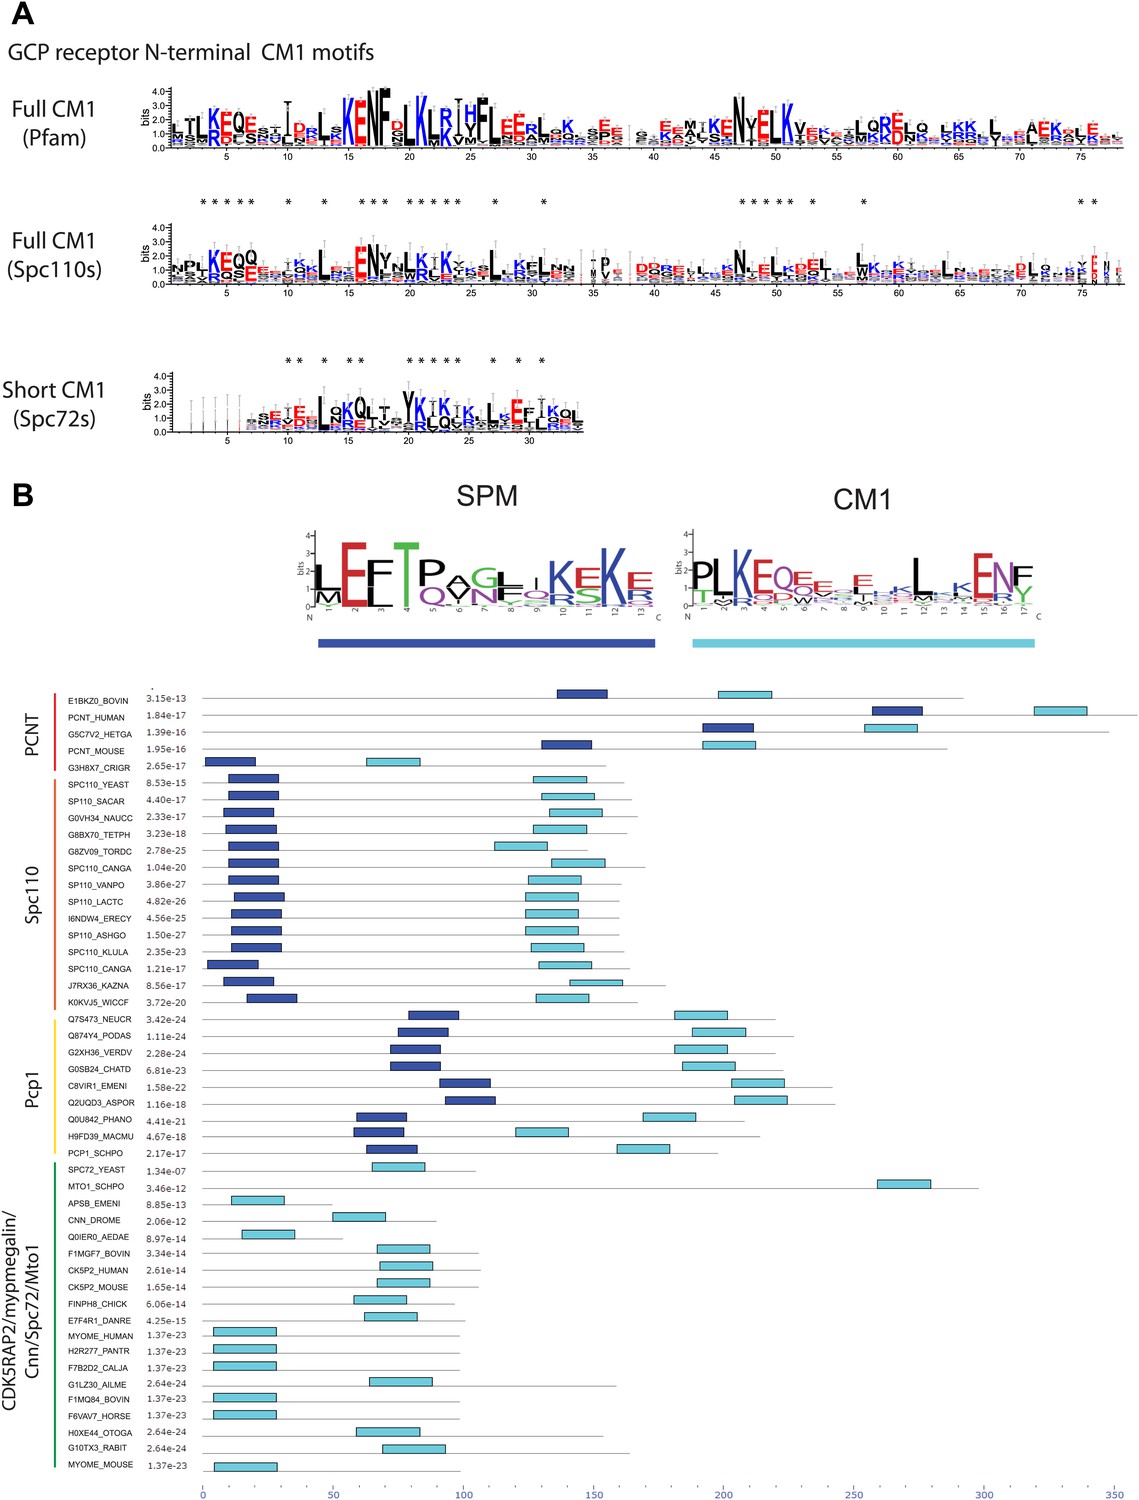
Two types of γ-TuCRs defined by the N-terminal γ-TuSC binding motifs: SPM-CM1 and CM1-only.
(A) Graphical representations of the patterns of CM1 motif within the multiple sequence alignment of γ-TuCR protein sequences. The CM1 motif sequence logos were shown for γ-TuCR protein sequences retrieved from Pfam database (Microtub_assoc, Pfam id: PF07989), Spc110s and Spc72s from subphylum Saccharomycotina. The Spc72 sequences used to generate the short CM1 logo are shown in Figure 8—figure supplement 1C. The sequence logos were generated with Weblogo 3.0 server. The conserved residues shared by CM1 defined by Pfam, Spc110s, and Spc72s are marked with asterisks. (B) SPM and CM1 in PCNT, Spc110, and Pcp1 homologues (SPM-CM1 type) and in CDK5RAP2/Cnn/Spc72/Mto1 (CM1 type). The occurrences of the motif in the training set sequences were calculated and shown as coloured blocks on a line with MEME motif scanning analysis (Bailey et al., 2009). Weblogo motif diagram is shown for each sequence showing the sites contributing to that motif in that sequence. The best p-value for the sequence/motif combination is listed. The p-value of an occurrence is the probability of a single random subsequence with the length of the motif, generated according to the zero-order background model, having a score at least as high as the score of the occurrence.
Figure 8—figure supplement 1
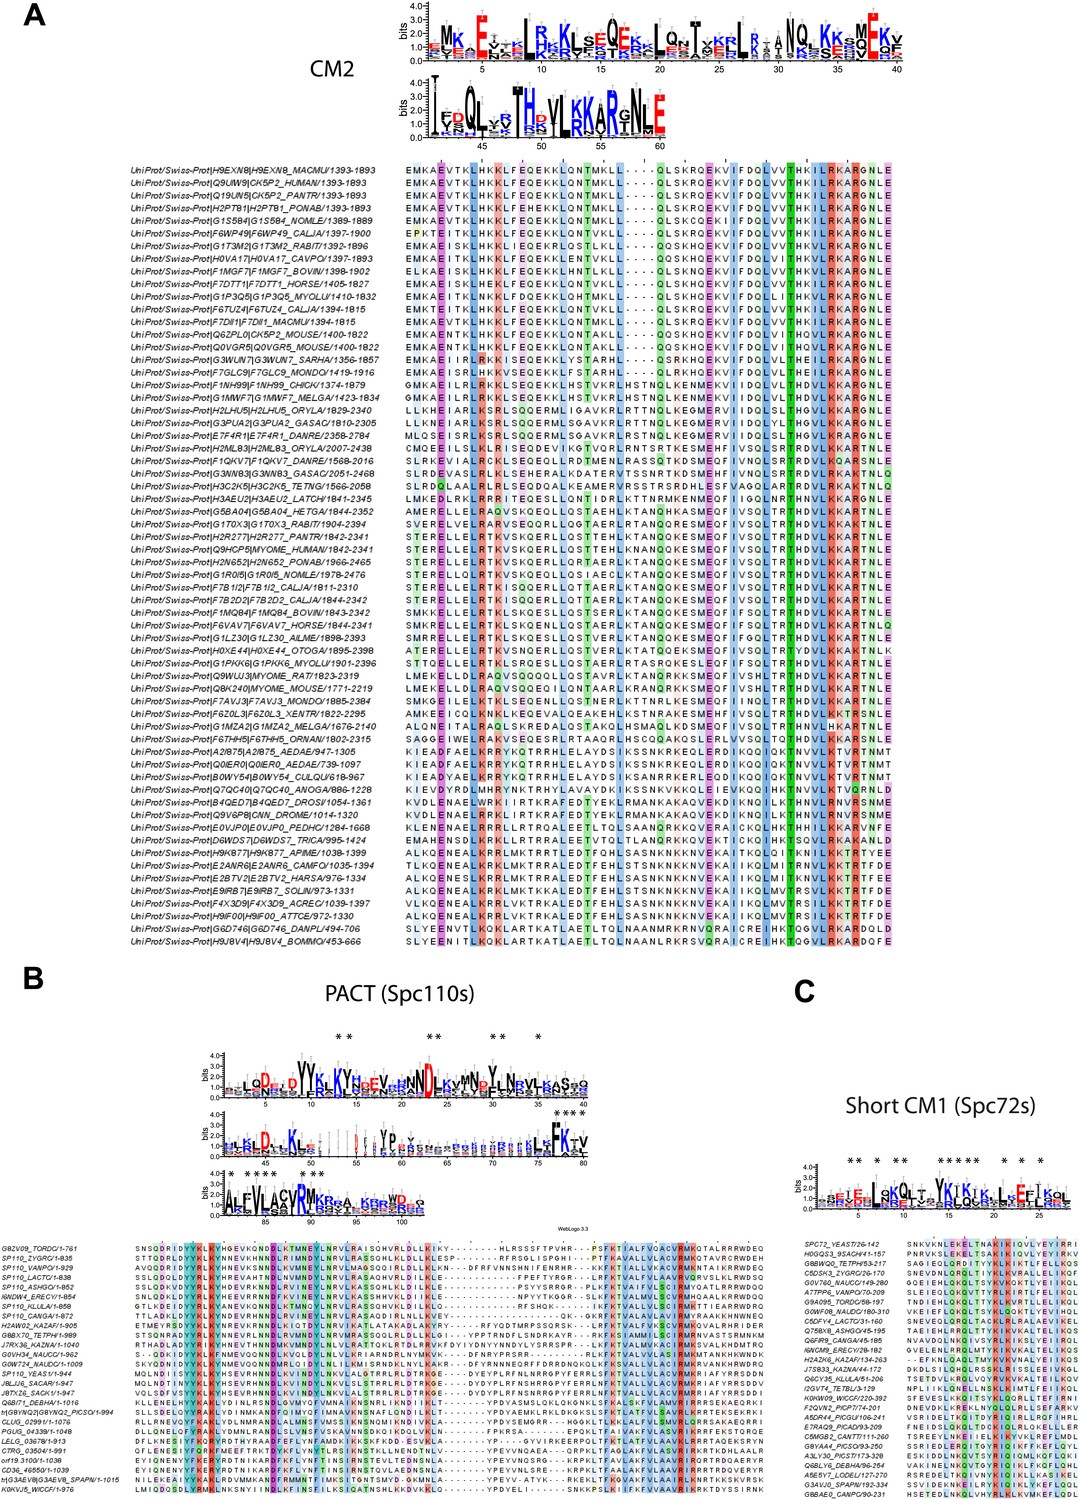
Raw sequence input for the sequence logo of CM2, Spc110 PACT, and Spc72 CM1 motifs.
(A) Multiple sequence alignment of selected γ-TuSC receptor family members containing CM2 motif. Residues are marked according to the ClustalX colour scheme. The occurrence of each amino acid in each position of CM2 motif is presented with Weblogo 3.0. The CM2 motif is present in human CDK5RAP2, myomegalin, and Drosophila centrosomin (Cnn). (B) Multiple sequence alignment of PACT motif sequences of Spc110s from the subphylum Saccharomycotina. The graphic presentation was generated as in (A). (C) Multiple sequence alignment of CM1 motif sequences of Spc72s from the subphylum Saccharomycotina. The graphic presentation was generated as in (A).
Figure 9
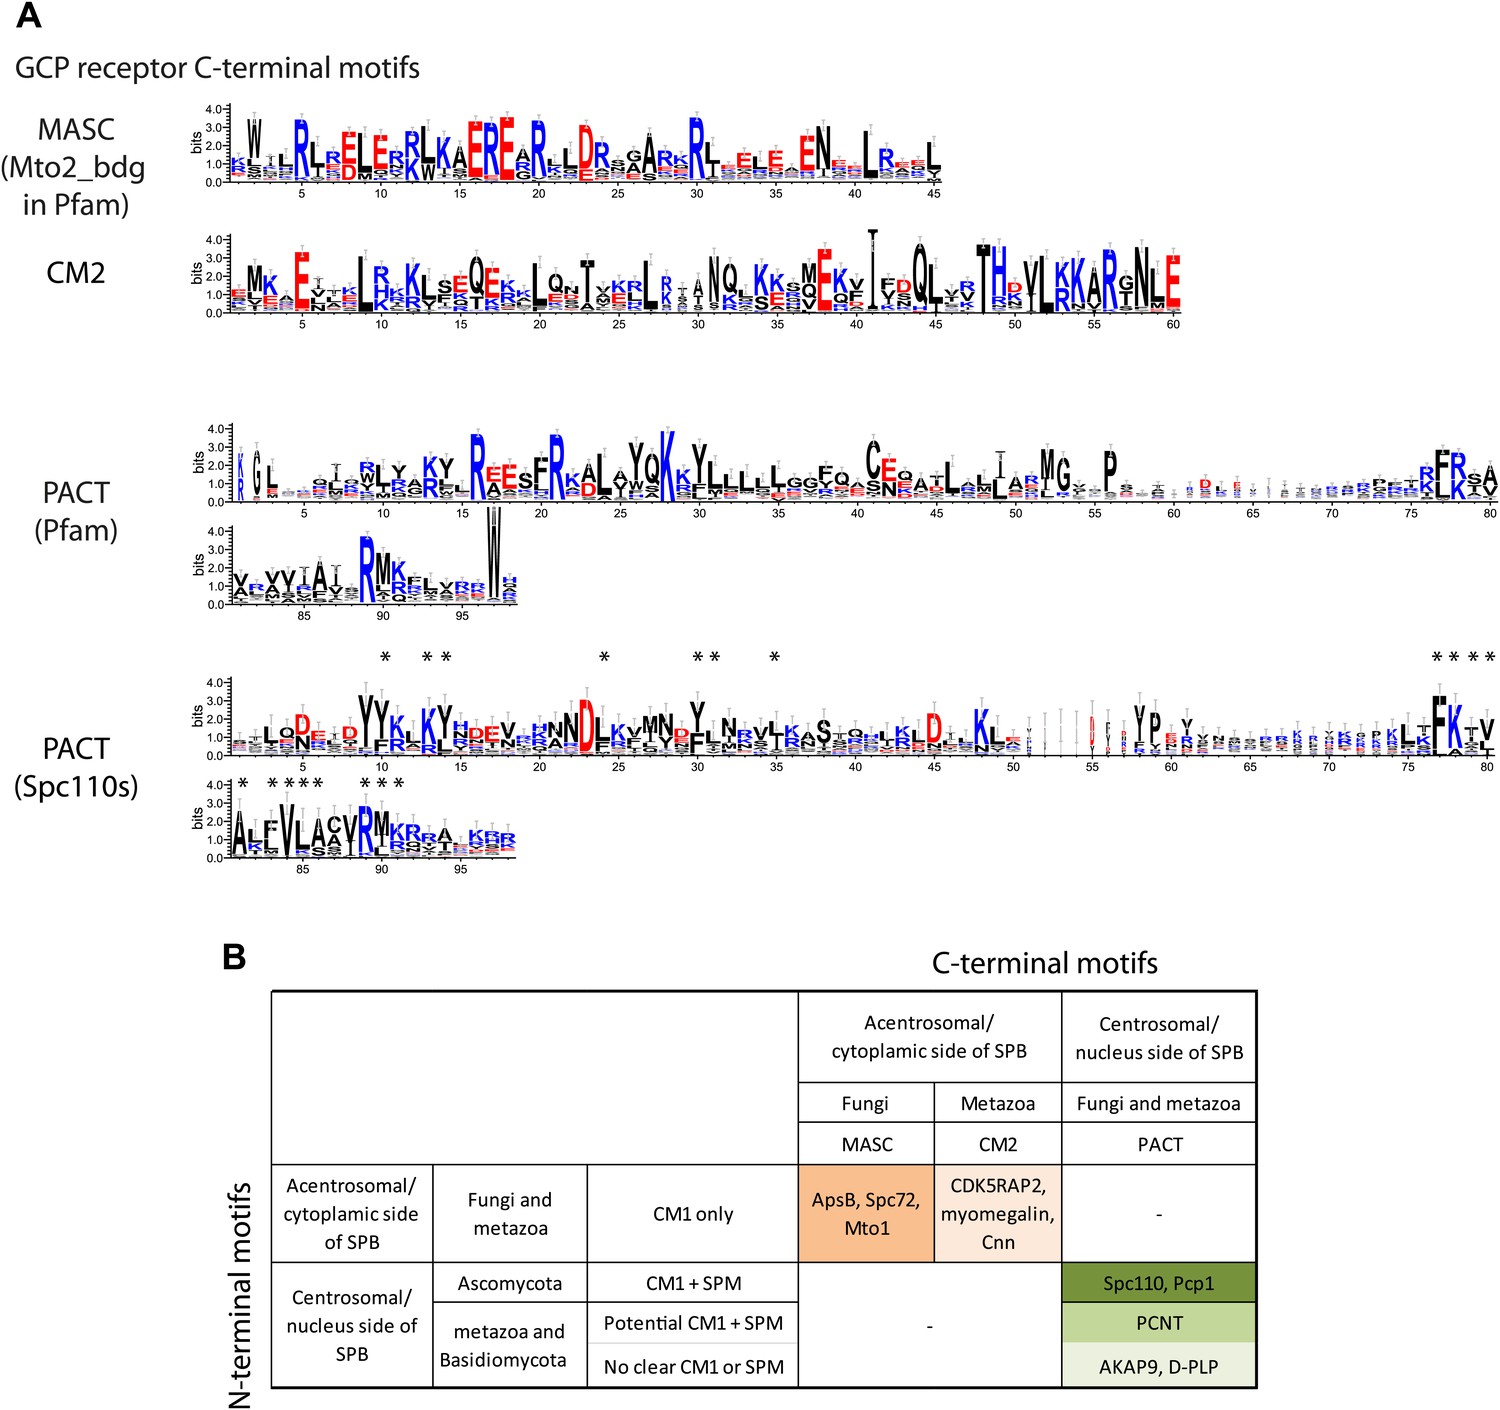
γ-TuCRs are classified into three subgroups based on N-terminal γ-TuSC binding motifs and C-terminal MTOC targeting motifs.
(A) Graphical representations of the patterns of C-terminal MTOC targeting motifs within the multiple sequence alignment of γ-TuCR protein sequences. The MASC and PACT motif sequence logos were shown for γ-TuCR protein sequences retrieved from Pfam database (Mto2_bdg, Pfam id: PF12808; PACT_coil_coil, Pfam id: PF10495) and Spc110s from subphylum Saccharomycotina. The γ-TuCR and Spc110 protein sequences used to generate the CM2 and PACT motif logo are shown in Figure 8—figure supplement 1A,B. The sequence logos were generated with Weblogo 3.0 server. The conserved residues shared by PACT motif defined by Pfam and Spc110s are marked with asterisks. (B) Summary table of categorization of γ-TuCR protein family. Based on the presence of N-terminal γ-TuSC interacting motifs (CM1 and SPM) and C-terminal MTOC targeting motifs (MASC, CM2, and PACT), γ-TuCR protein family can be divided into three subgroups: N-terminal CM1 motif only with either C-terminal MASC or CM2 motifs, and N-terminal CM1 and SPM motifs combined with C-terminal PACT domain. Some PACT domain proteins (AKAP9 or D-PLP) have yet undefined γ-TuSC binding motifs.
Figure 10
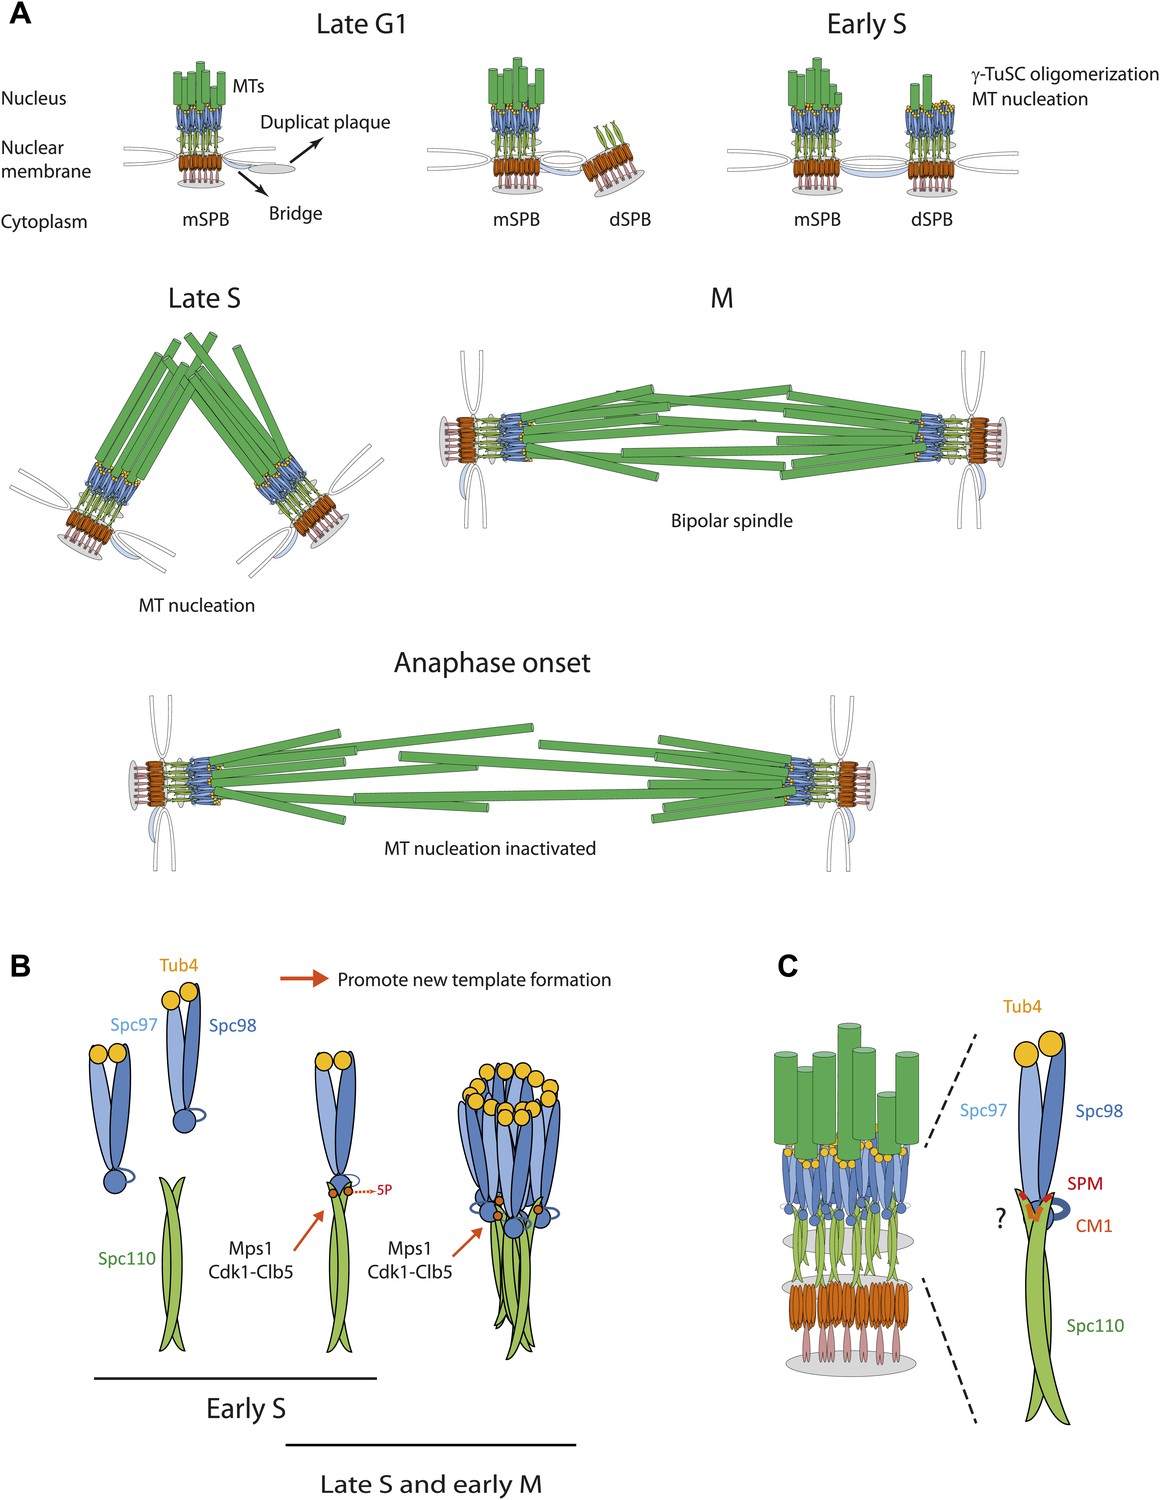
Role of Spc110 phosphorylation during SPB duplication.
(A) MT nucleation by the SPB during the cell cycle. See ‘Discussion’ for details. (B) Cell cycle dependent, stimulatory phosphorylations of Spc110 by Mps1 and Cdk1-Clb5 (early S phase to early M). (C) Model for the interaction of γ-TuSC with Spc110. The Spc110 dimer interacts via the SPM and CM1 motifs with the N-terminus of Spc98 (GCP3) and possibly also with other regions of γ-TuSC.
Author response image 1
Additional files
-
Supplementary file 1
Plasmids used in this study.
- https://doi.org/10.7554/eLife.02208.026
-
Supplementary file 2
Strains used in this study.
- https://doi.org/10.7554/eLife.02208.027
Download links
A two-part list of links to download the article, or parts of the article, in various formats.
Downloads (link to download the article as PDF)
Open citations (links to open the citations from this article in various online reference manager services)
Cite this article (links to download the citations from this article in formats compatible with various reference manager tools)
Cell-cycle dependent phosphorylation of yeast pericentrin regulates γ-TuSC-mediated microtubule nucleation
eLife 3:e02208.
https://doi.org/10.7554/eLife.02208


