The role of photorespiration during the evolution of C4 photosynthesis in the genus Flaveria
- Heinrich-Heine-Universität, Germany
Figures
Figure 1

The genus Flaveria as a model organism to study C4 evolution.
Schematic view of the photorespiratory pathway (A), the NADP-ME type C4 pathway as it can be found in C4 Flaveria species (B) and the C2 photosynthesis pathway (C). (D) Phylogeny and physiological properties of selected Flaveria species. The phylogeny was redrawn according to McKown et al. (2005), CO2 compensation points are taken from Ku et al. (1991), incorporation of 14CO2 is from Moore et al. (1987) and the ratios of GLDP B (expressed in all chlorenchyma cells) and GLDP A (expressed in bundle sheath cells only) are from Schulze et al. (2013). (Abbreviations: AGT: serine glyoxylate aminotransferase; AlaAT: alanine aminotransferase; AspAT: aspartate aminotransferase; GDC: glycine decarboxylase complex; GGT: glutamate, glyoxylate-aminotransferase; GLYK: D-glycerate 3-kinase; GOX: glycolate oxidase; HPR: hydroxypyruvate reductase; MDH: malate dehydrogenase; NADP-ME: NADP dependent malic enzyme; PEPC: phosphoenolpyruvate carboxylase; PGLP: 2-phosphoglycerate phosphatase; PPDK pyruvate, phosphate-dikinase; RUBISCO: Ribulose-1,5-bisphosphat-carboxylase/-oxygenase; SHM: serine hydroxymethyltransferase; 2-OG: oxoglutarate; 2-PG 2-phosphoglycolate; 3-PGA: 3-phosphoglycerate; Gln: glutamine; Glu: glutamate; OAA: oxaloacetate; PEP: phosphoenolpyruvate; TP: triosephosphate).
Figure 2
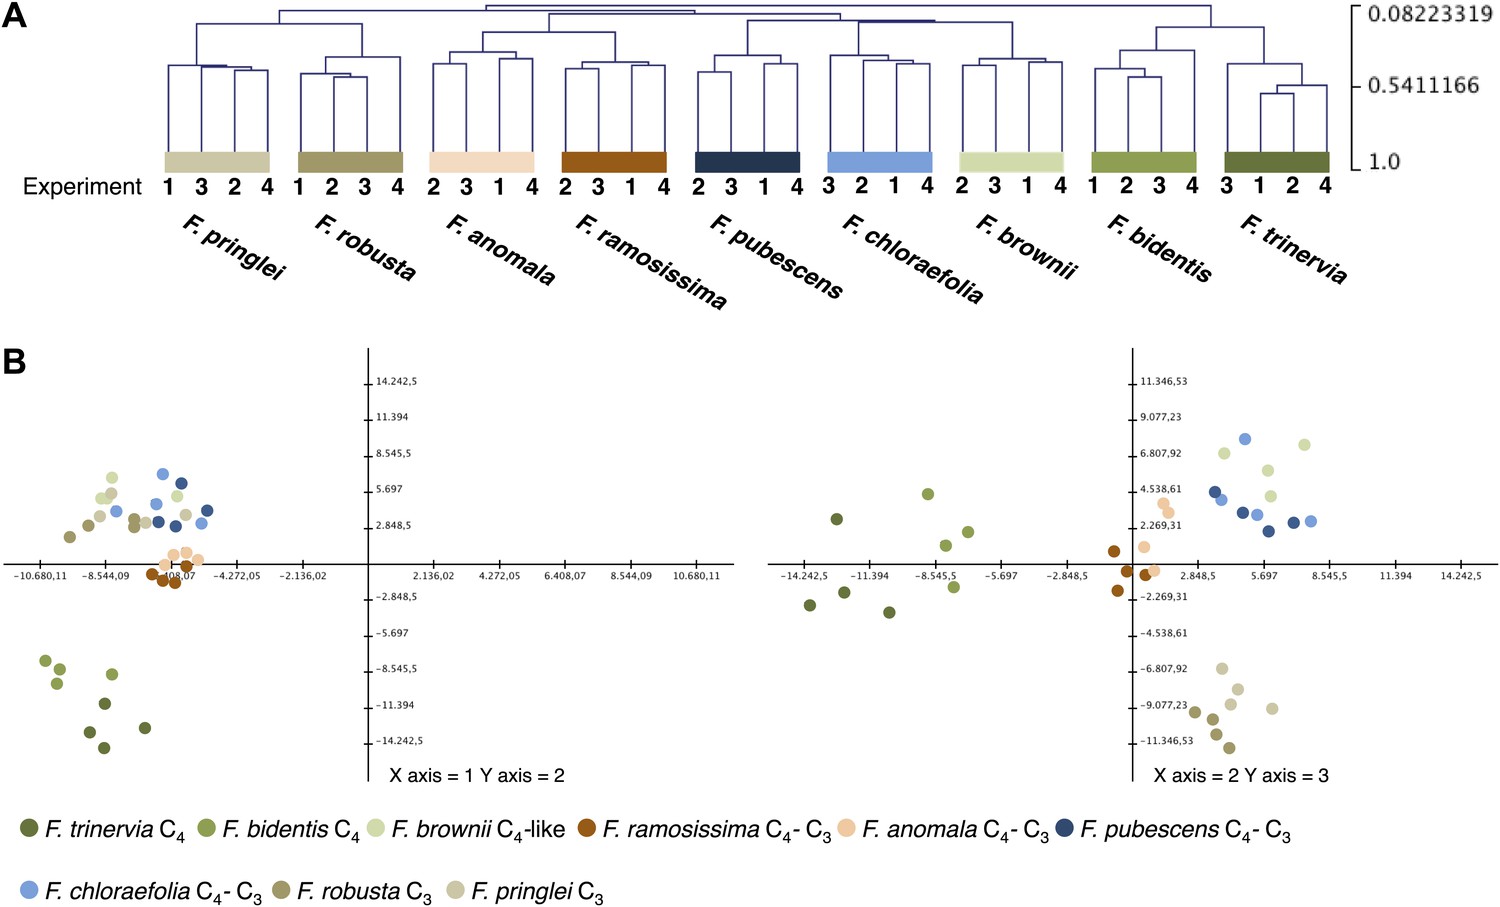
Variation of transcript profiles of the individual Flaveria species between the four experiments.
(A) Hierarchical sample clustering of all expressed transcripts. The tree was calculated with the MEV program using the HCL module with Pearson correlation and the average linkage method. (B) Principal component analysis of transcript levels. The first three components explain 27% of the total variance.
-
Figure 2—source data 1
Results of the Illumina sequencing and cross species read mapping.
- https://doi.org/10.7554/eLife.02478.005
-
Figure 2—source data 2
Quantitative information for all reads mapped in a cross species approach onto the reference transcriptome from Arabidopsis thaliana.
- https://doi.org/10.7554/eLife.02478.006
Figure 3 with 2 supplements

Abundance of photorespiratory transcripts and proteins in leaves of individual Flaveria species.
Normalized transcript (A) and protein (B) amounts are plotted as heat maps. Transcript amounts were determined by Illumina sequencing of the leaf transcriptomes and read mapping on selected F. robusta full length transcript sequences. Protein amounts were determined by protein gel blots. See Figure 3—source data 1 for absolute transcript levels, Figure 3—source data 2 for protein quantification and Figure 3—figure supplements 1 and 2 for immunoblots. Fp: F. pringlei (C3); Fro: F. robusta (C3); Fc: F. chloraefolia (C3–C4); Fpu: F. pubescens (C3–C4); Fa: F. anomala (C3–C4); Fra: F. ramosissima (C3–C4); Fbr: F. brownii (C4-like); Fb: F. bidentis (C4); Ft: F. trinervia (C4).
-
Figure 3—source data 1
Transcript abundance of photorespiratory genes determined by read mapping on F. robusta full length transcript sequences.
- https://doi.org/10.7554/eLife.02478.008
-
Figure 3—source data 2
Quantification of photorespiratory proteins by protein gel blot.
- https://doi.org/10.7554/eLife.02478.009
Figure 3—figure supplement 1
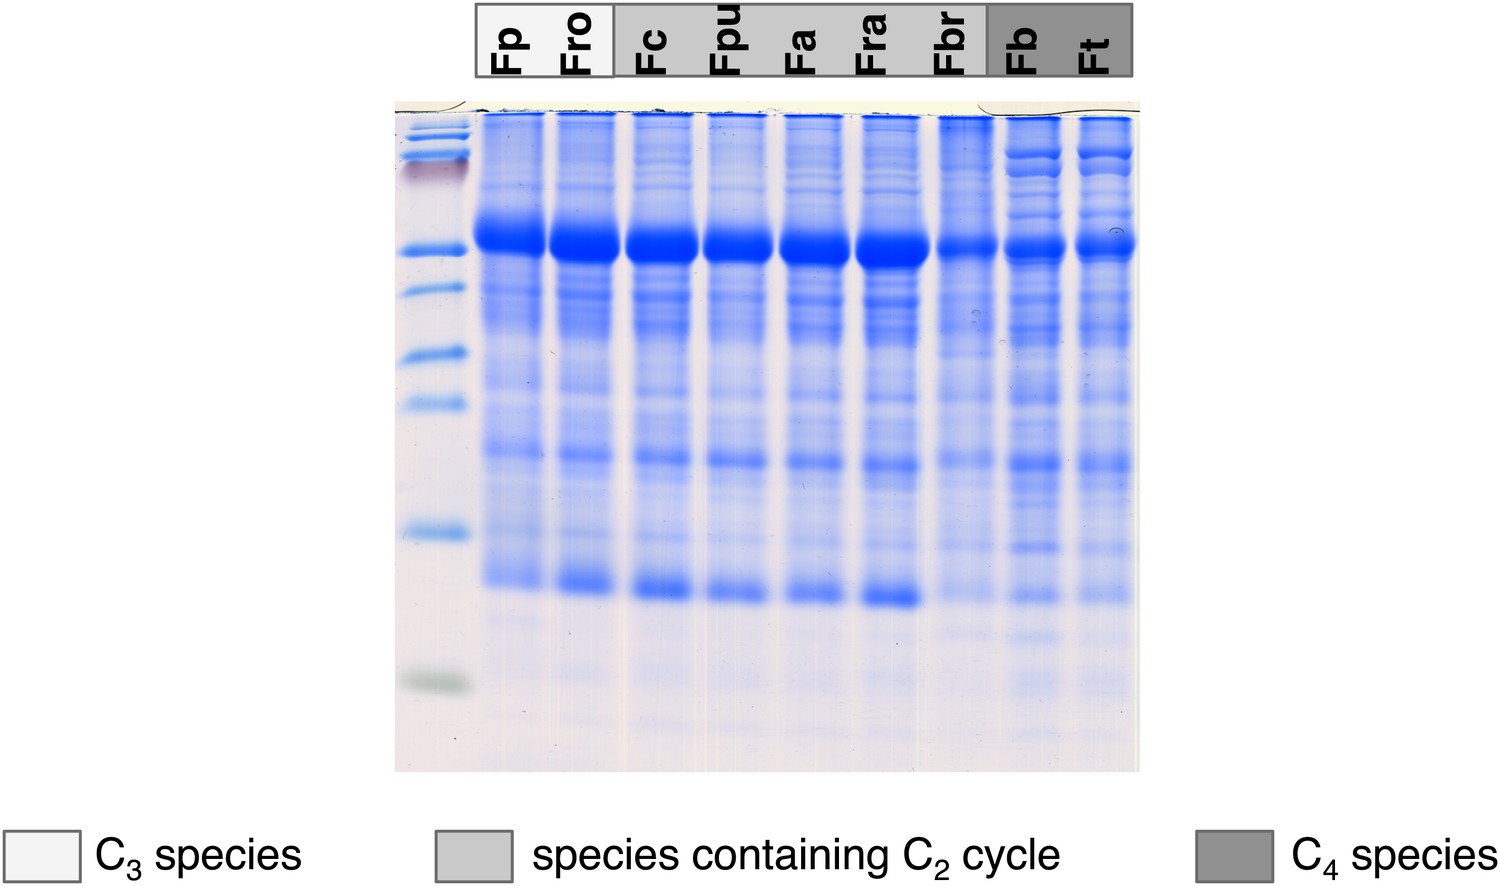
Results of the protein analyses.
30 µg of total protein was electrophoresed on a polyacrylamide-SDS gel and stained with coomassie blue as control of total protein concentrations. Fp: F. pringlei (C3); Fro: F. robusta (C3); Fc: F. chloraefolia (C3–C4); Fpu: F. pubescens (C3–C4); Fa: F. anomala (C3–C4); Fra: F. ramosissima (C3–C4); Fbr: F. brownii (C4-like); Fb: F. bidentis (C4); Ft: F. trinervia (C4).
Figure 3—figure supplement 2
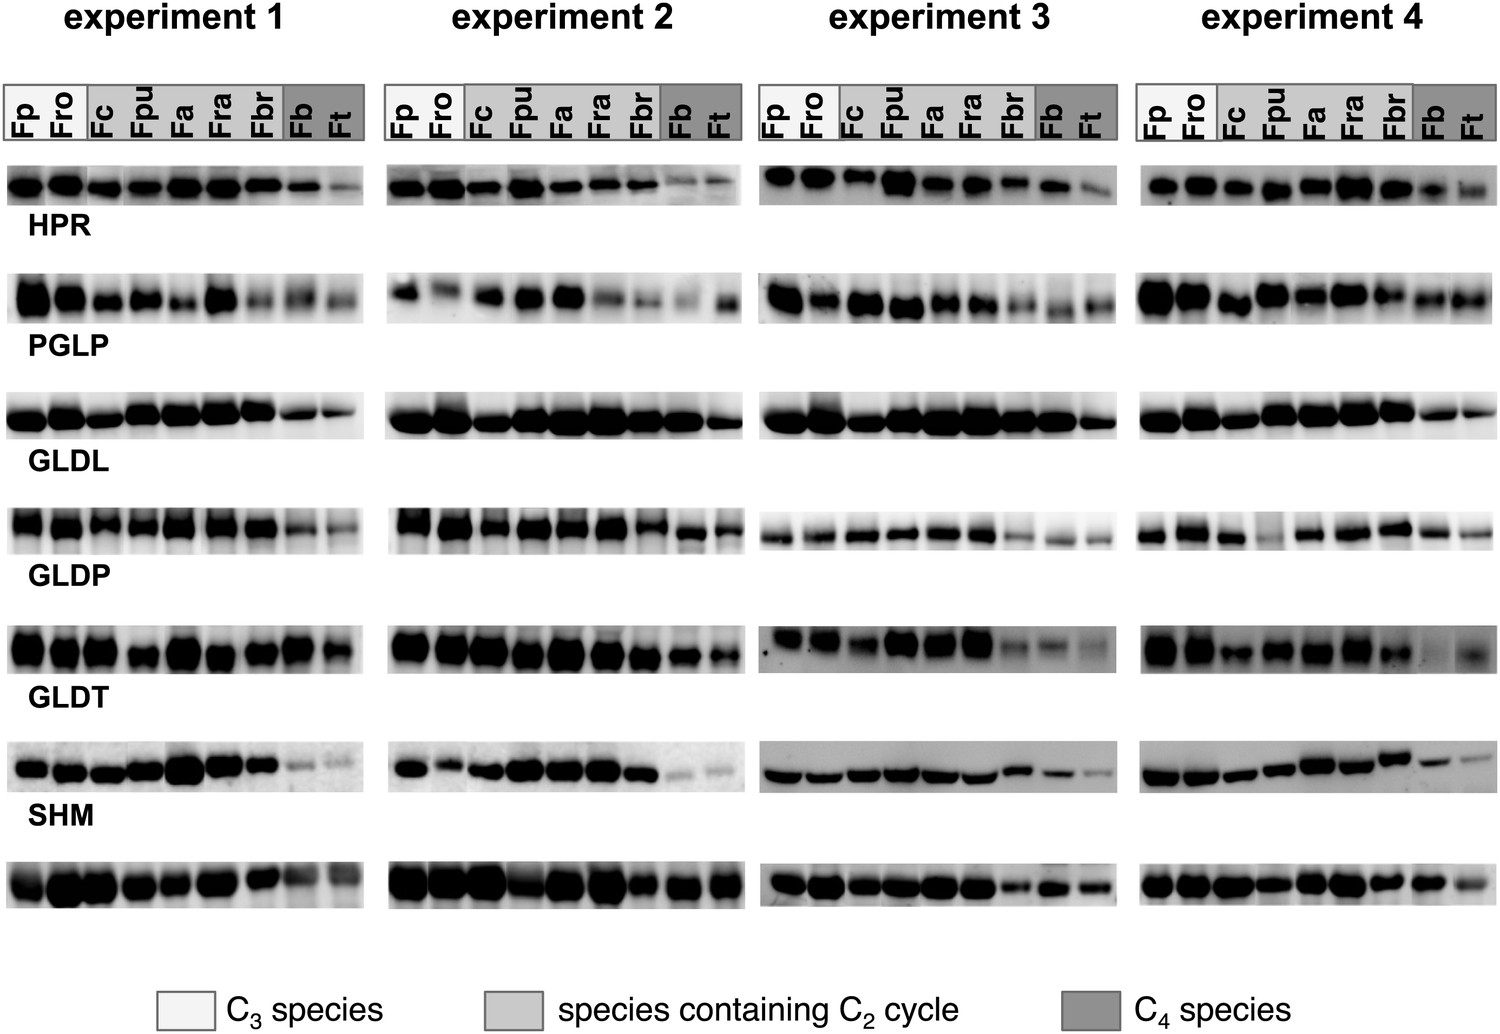
Results of the protein analyses.
Immunoblot results with antibodies against photorespiratory proteins (C) Immunoblot results with antibodies against C4 proteins. Fp: F. pringlei (C3); Fro: F. robusta (C3); Fc: F. chloraefolia (C3–C4); Fpu: F. pubescens (C3–C4); Fa: F. anomala (C3–C4); Fra: F. ramosissima (C3–C4); Fbr: F. brownii (C4-like); Fb: F. bidentis (C4); Ft: F. trinervia (C4).
Figure 4
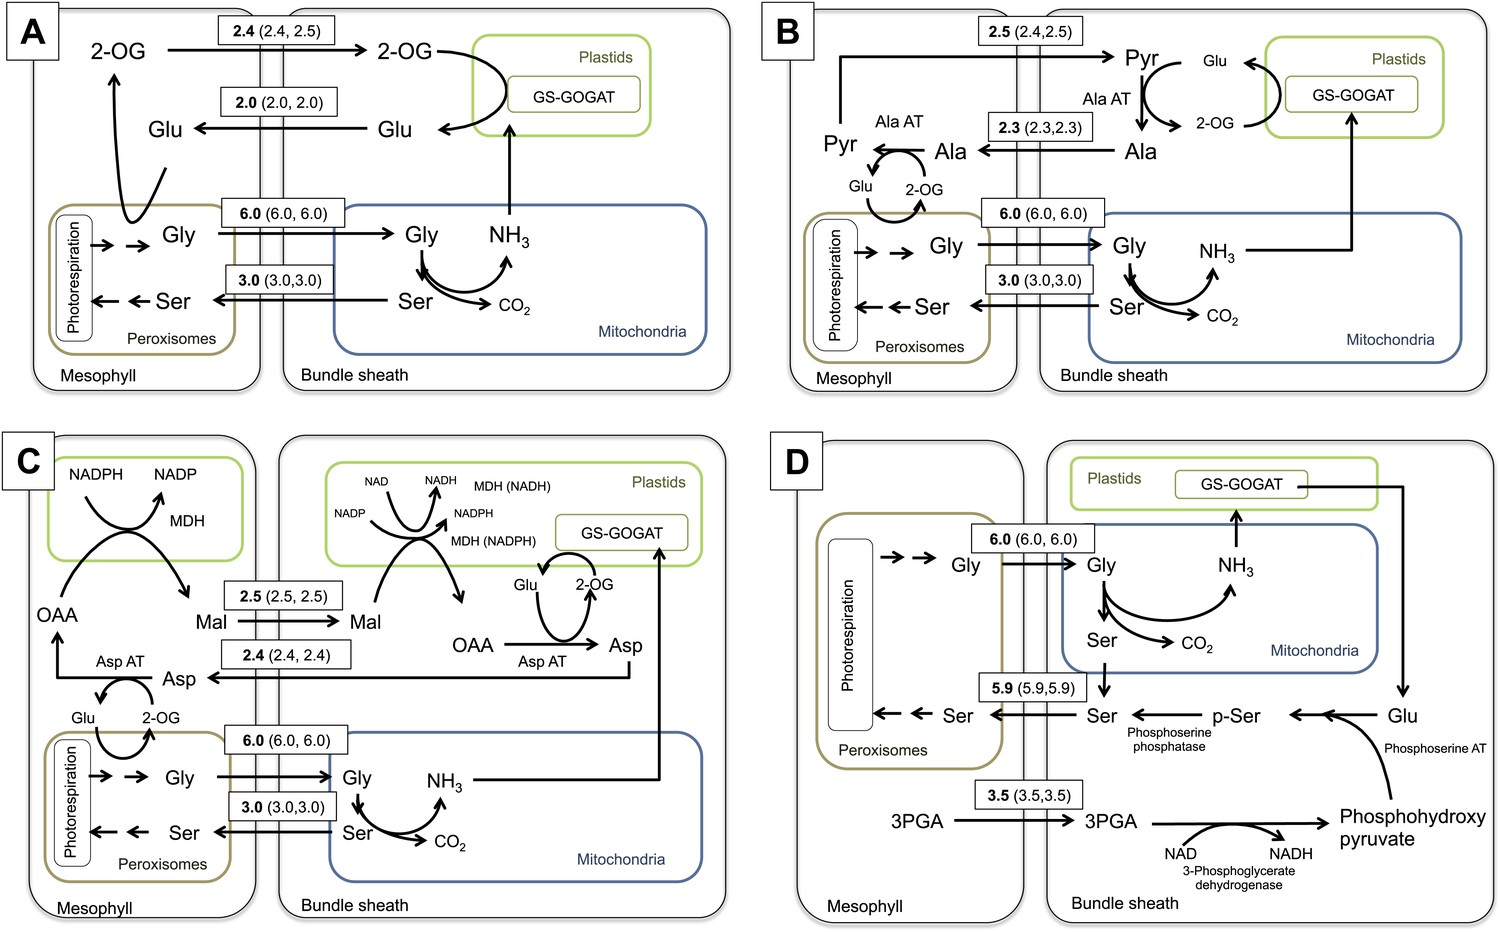
Flux Balance Analysis of the C2 photosynthetic pathway.
Predicted fluxes if (A) major amino acids and the corresponding oxoacids and dicarbonic acids are allowed to freely diffuse between cells, (B) the α-ketoglutarate and glutamate transfer between mesophyll and bundle sheath was constrained (C) additionally the transfer of alanine and pyruvate between mesophyll and bundle sheath was constrained (D) transfer of all nitrogen containing compounds except for glycine and serine, which are used by the C2 cycle were constrained. Fluxes are given in µmol s−1 m−2. Values in brackets show minimum and maximum of flux resulting from flux variability analysis. Flux of dissolved gasses, sucrose, inorganic compounds and processes that carry flux below 1 µmol s−1 m−2 are not shown. The sums of absolute fluxes over the plasmodesmata for the different variants were (A): 17.8 µmol s−1 m−2; (B): 18.4 µmol s−1 m−2; (C): 19.0 µmol s−1 m−2; (D): 22.1 µmol s−1 m−2. See Figure 4—source data 1 for plasmodesmatal fluxes.
-
Figure 4—source data 1
Fluxes over plasmodesmata depending on the weight on plasmodesmatal fluxes including flux variability analysis.
- https://doi.org/10.7554/eLife.02478.013
Figure 5

Mechanistic interaction between C2 and C4 cycle.
(A) Predicted fluxes when the model is parameterized to include activity of the C4 cycle enzymes. Fluxes are given in µmol s−1 m−2. Values in brackets show minimum and maximum of flux resulting from flux variability analysis. The sum of absolute flux over plasmodesmata was 21.9 µmol s−1 m−2. Flux of dissolved gasses, sucrose, inorganic compounds and processes that carry flux below 1 µmol s−1 m−2 are not shown. See Figure 5—source data 1 for plasmodesmatal fluxes. (B) Predicted activities of Ala-AT in mesophyll (black line) and bundle sheath (gray line) cells and predicted transfer of α-ketoglutarate from mesophyll to bundle sheath cells (black dashed line) and glutamate from bundle sheath to mesophyll cells (gray dashed line) at low C4 cycle activities. (C) Changes in biomass production with varying (low) activity of the C4 cycle in a C2 plant.
-
Figure 5—source data 1
Fluxes over plasmodesmata depending on the weight on plasmodesmatal fluxes including flux variability analysis.
- https://doi.org/10.7554/eLife.02478.015
Figure 6 with 1 supplement
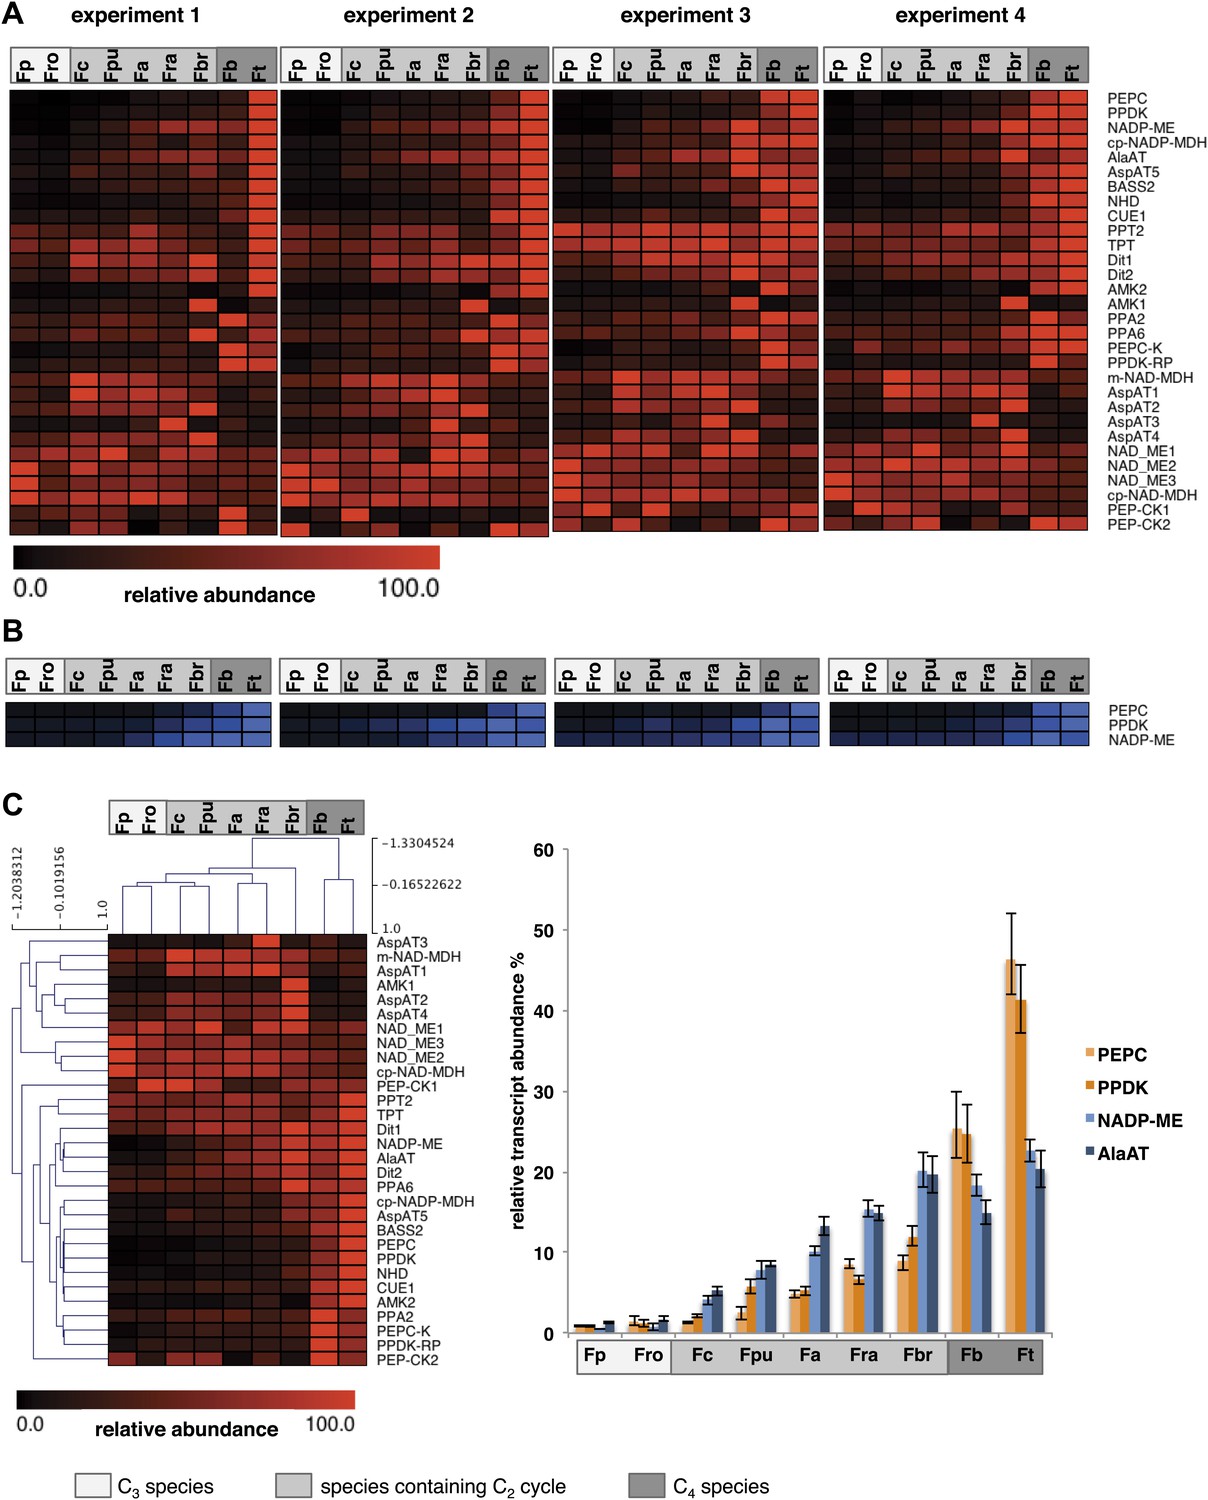
Abundance of C4 related transcripts and proteins in leaves of individual Flaveria species.
Normalized transcript (A) and protein (B) levels are plotted as heat maps. Transcript amounts were determined by Illumina sequencing of the leaf transcriptomes and read mapping on selected F. robusta full length transcript sequences. Protein amounts were determined by protein gel blots. See Figure 6—source data 2 for absolute transcript level, Figure 6—source data 2 for protein quantification and Figure 3—figure supplement 1 for immunoblots. (C) Mean values of transcript levels from all four experiments were clustered by hierarchical using the HCL module of MEV program with Pearson correlation and the average linkage method. The relative transcript abundance for PEPC, PPDK, NADP-ME and Ala-AT (mean values from all four experiments) are plotted for all nine species. Fp: F. pringlei (C3); Fro: F. robusta (C3); Fc: F. chloraefolia (C3–C4); Fpu: F. pubescens (C3–C4); Fa: F. anomala (C3–C4); Fra: F. ramosissima (C3–C4); Fbr: F. brownii (C4–like); Fb: F. bidentis (C4); Ft: F. trinervia (C4).
-
Figure 6—source data 1
Transcript abundance of C4 cycle genes determined by read mapping on F. robusta full length transcript sequences.
- https://doi.org/10.7554/eLife.02478.017
-
Figure 6—source data 2
Quantification of C4 proteins by protein gel blots.
- https://doi.org/10.7554/eLife.02478.018
Figure 6—figure supplement 1
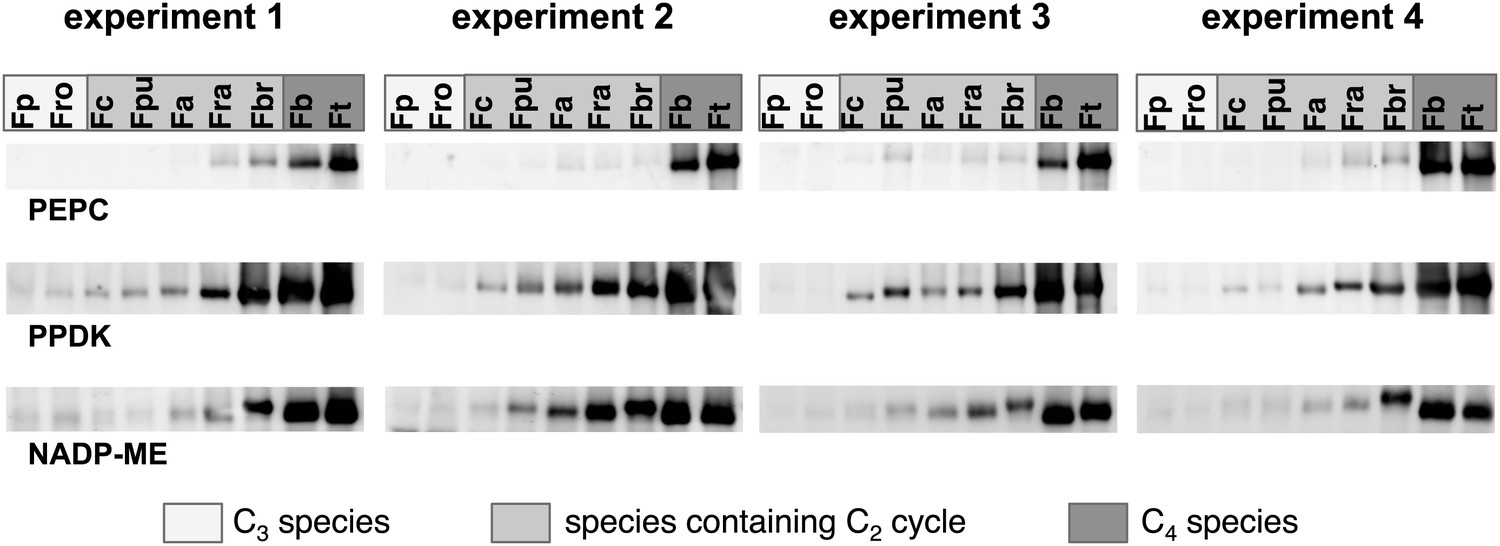
Results of the protein analyses.
Immunoblot results with antibodies against C4 proteins. Fp: F. pringlei (C3); Fro: F. robusta (C3); Fc: F. chloraefolia (C3–C4); Fpu: F. pubescens (C3–C4); Fa: F. anomala (C3–C4); Fra: F. ramosissima (C3–C4); Fbr: F. brownii (C4-like); Fb: F. bidentis (C4); Ft: F. trinervia (C4).
Download links
A two-part list of links to download the article, or parts of the article, in various formats.
Downloads (link to download the article as PDF)
Open citations (links to open the citations from this article in various online reference manager services)
Cite this article (links to download the citations from this article in formats compatible with various reference manager tools)
The role of photorespiration during the evolution of C4 photosynthesis in the genus Flaveria
eLife 3:e02478.
https://doi.org/10.7554/eLife.02478


