Global distribution maps of the leishmaniases
- University of Oxford, United Kingdom
- UFR Médecine, Université Montpellier 1 and UMR ‘MiVEGEC’, CNRS 5290/IRD 224, France
- CHRU de Montpellier, Centre National de Référence des Leishmanioses, France
- Harvard Medical School, United States
- Boston Children's Hospital, United States
- Boston University, United States
- National Institutes of Health, United States
- RTI International, United States
Figures
Figure 1 with 1 supplement
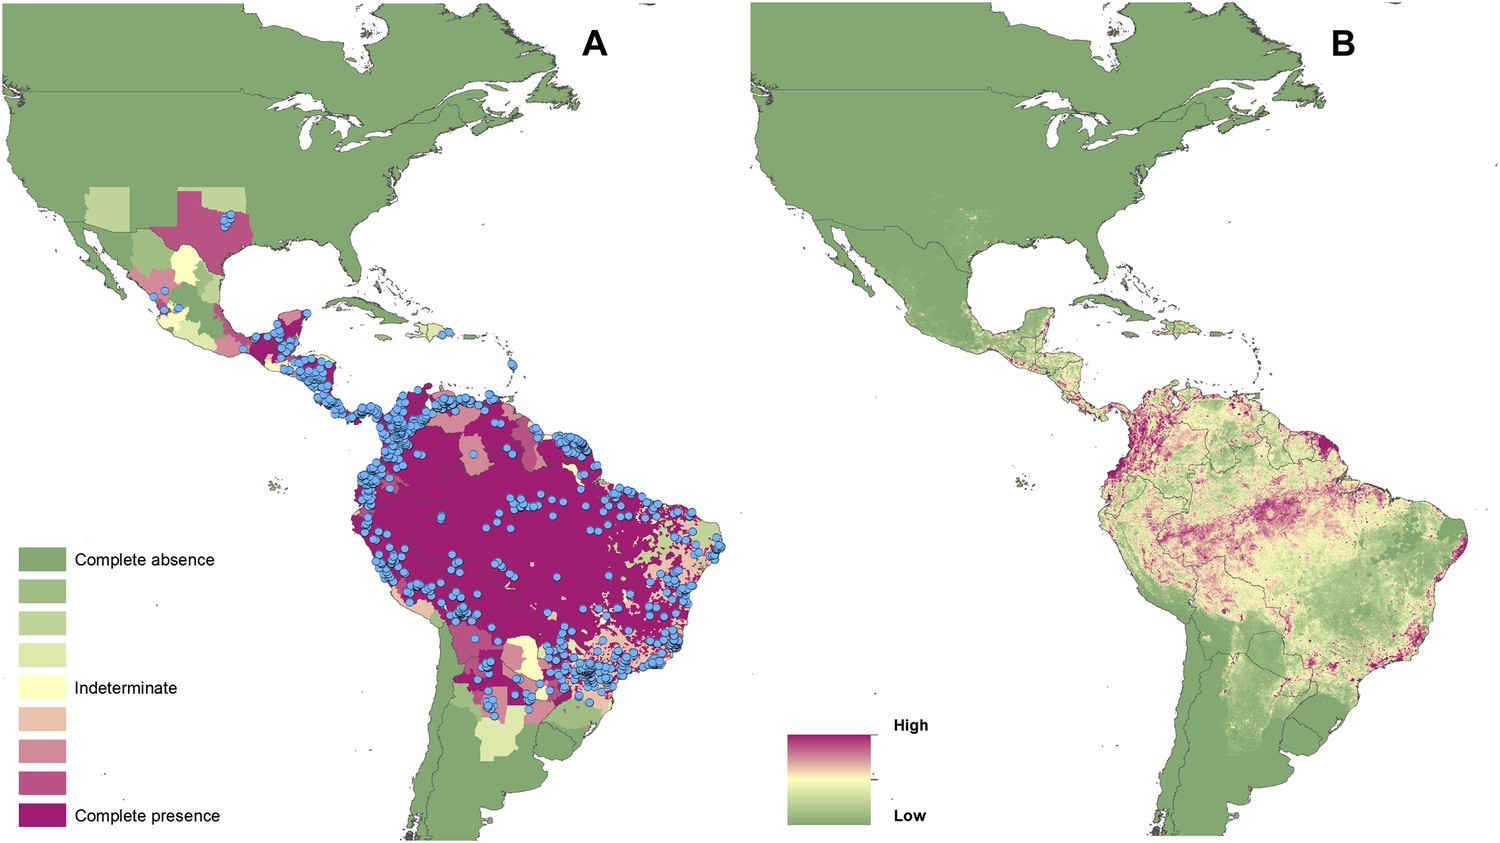
Reported and predicted distribution of cutaneous leishmaniasis in the New World.
(A) Evidence consensus for presence of the disease ranging from green (complete consensus on the absence: −100%) to purple (complete consensus on the presence of disease: +100%). The blue spots indicate occurrence points or centroids of occurrences within small polygons. (B) Predicted risk of cutaneous leishmaniasis from green (low probability of presence) to purple (high probability of presence).
Figure 1—figure supplement 1
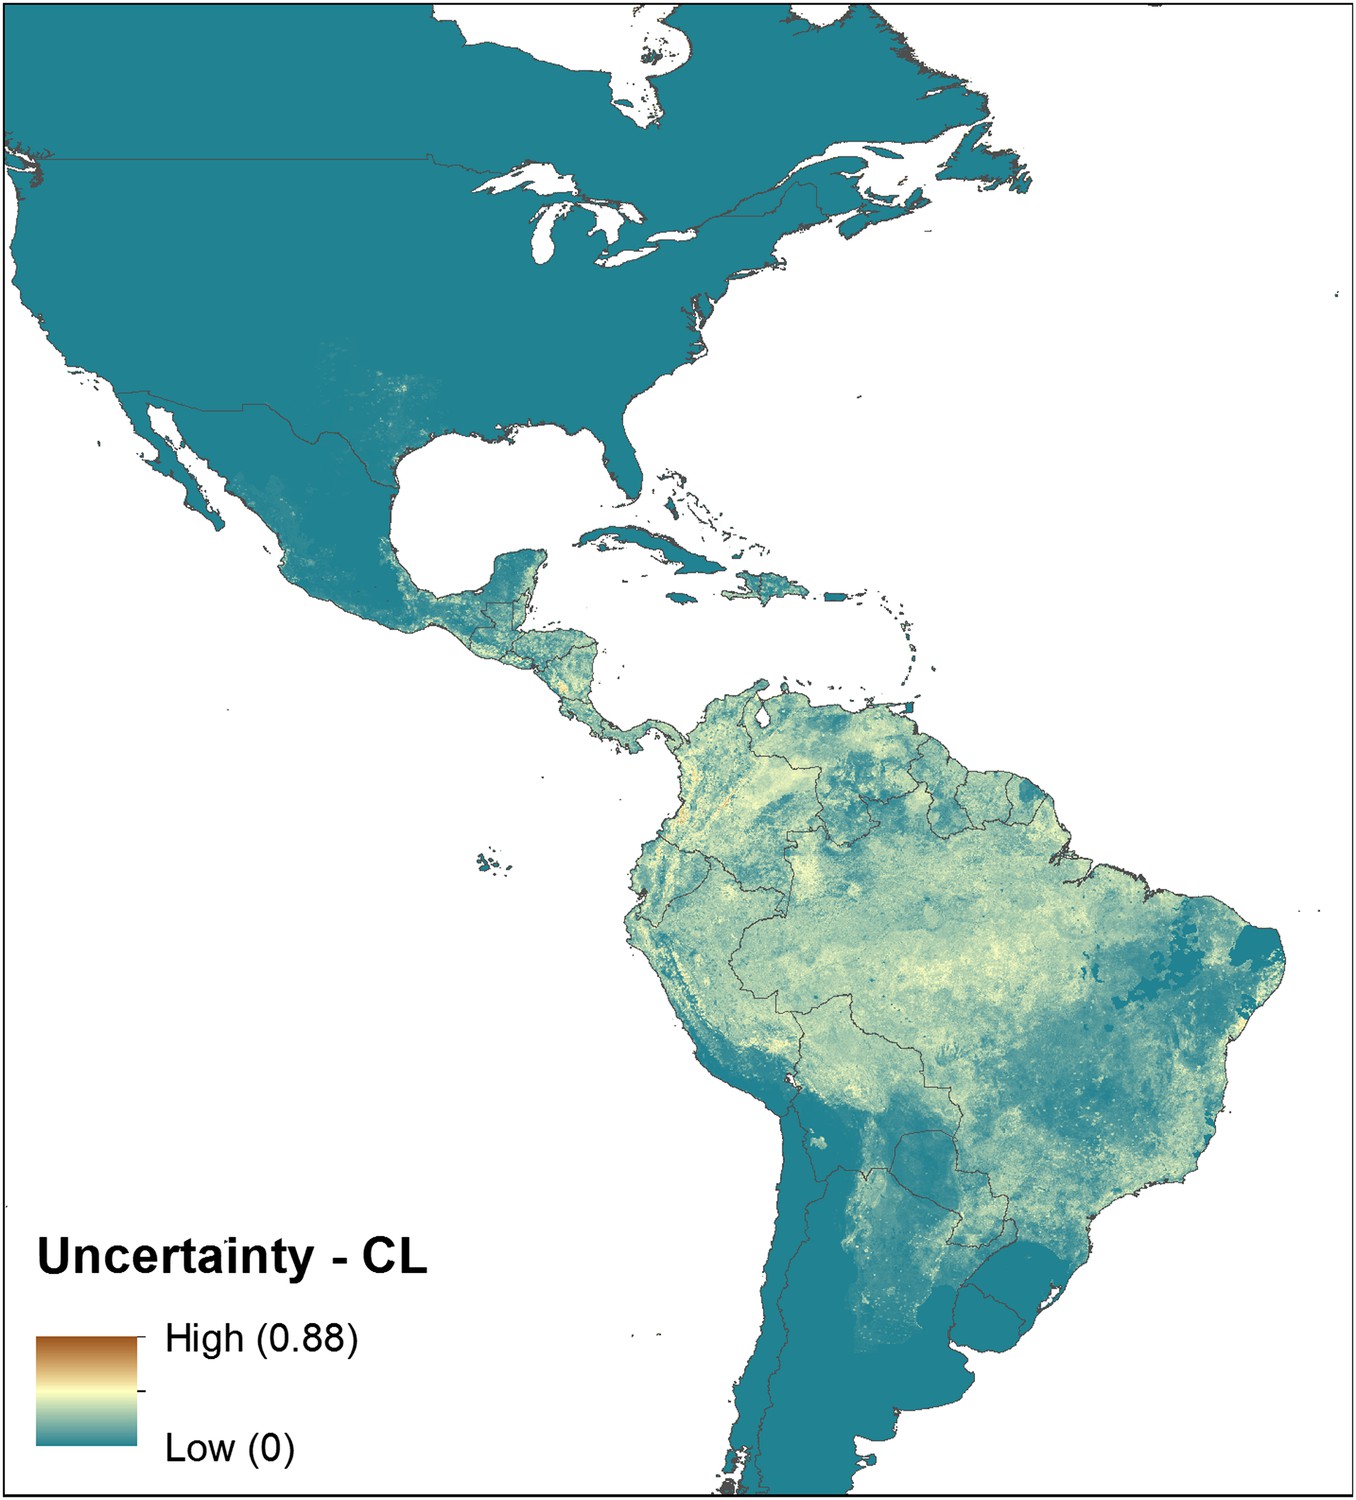
Uncertainty associated with predictions in Figure 1B.
Uncertainty was calculated as the range of the 95% confidence interval in predicted probability of occurrence for each pixel. Regions of highest uncertainty are in dark brown, with blue representing low uncertainty.
Figure 2 with 1 supplement
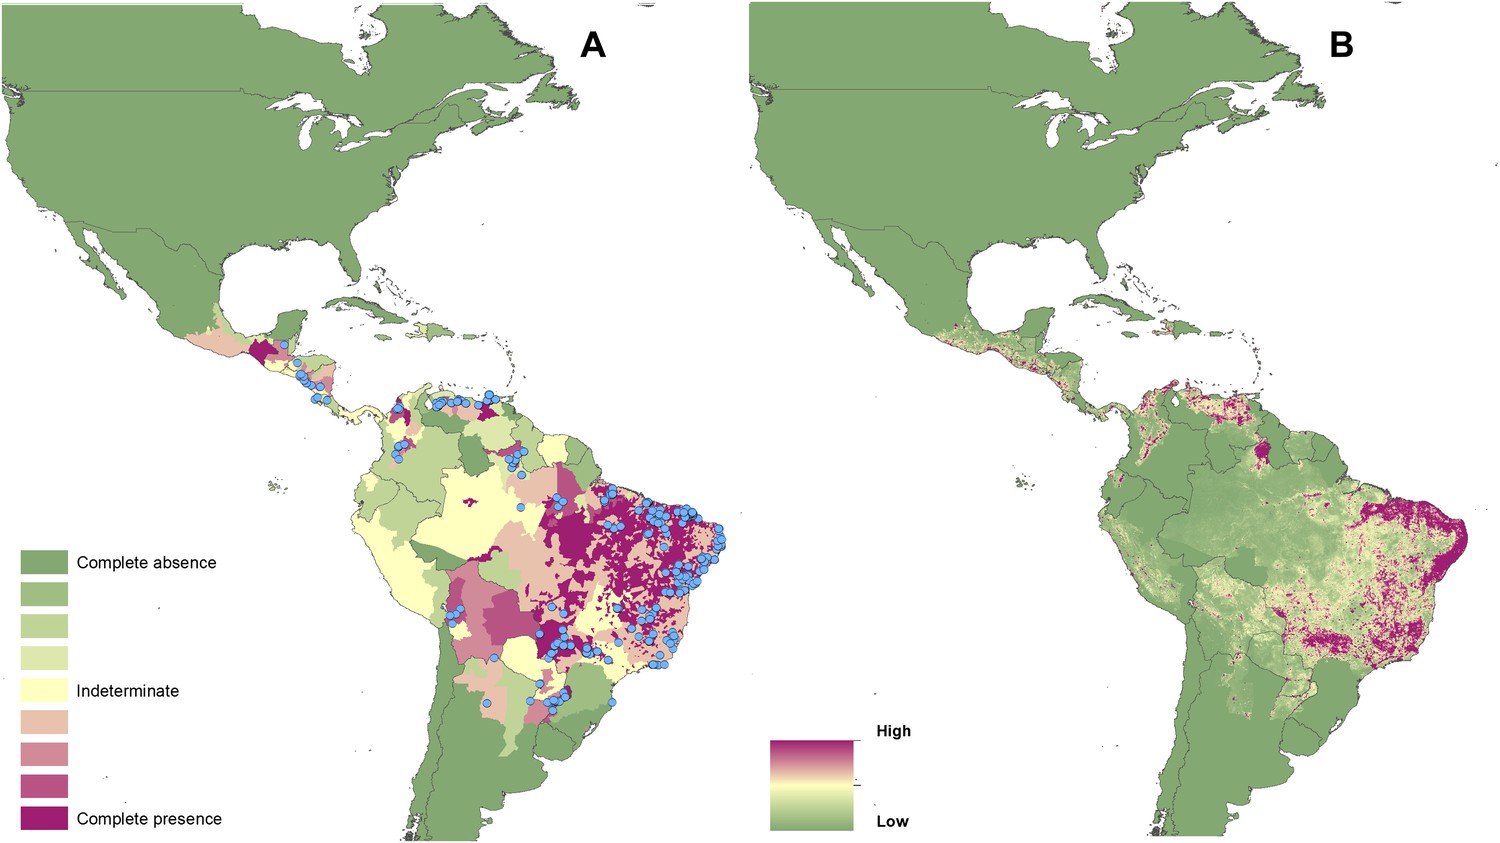
Reported and predicted distribution of visceral leishmaniasis in the New World.
(A) Evidence consensus for presence of the disease ranging from green (complete consensus on the absence: −100%) to purple (complete consensus on the presence of disease: +100%). The blue spots indicate occurrence points or centroids of occurrences within small polygons. (B) Predicted risk of visceral leishmaniasis from green (low probability of presence) to purple (high probability of presence).
Figure 2—figure supplement 1
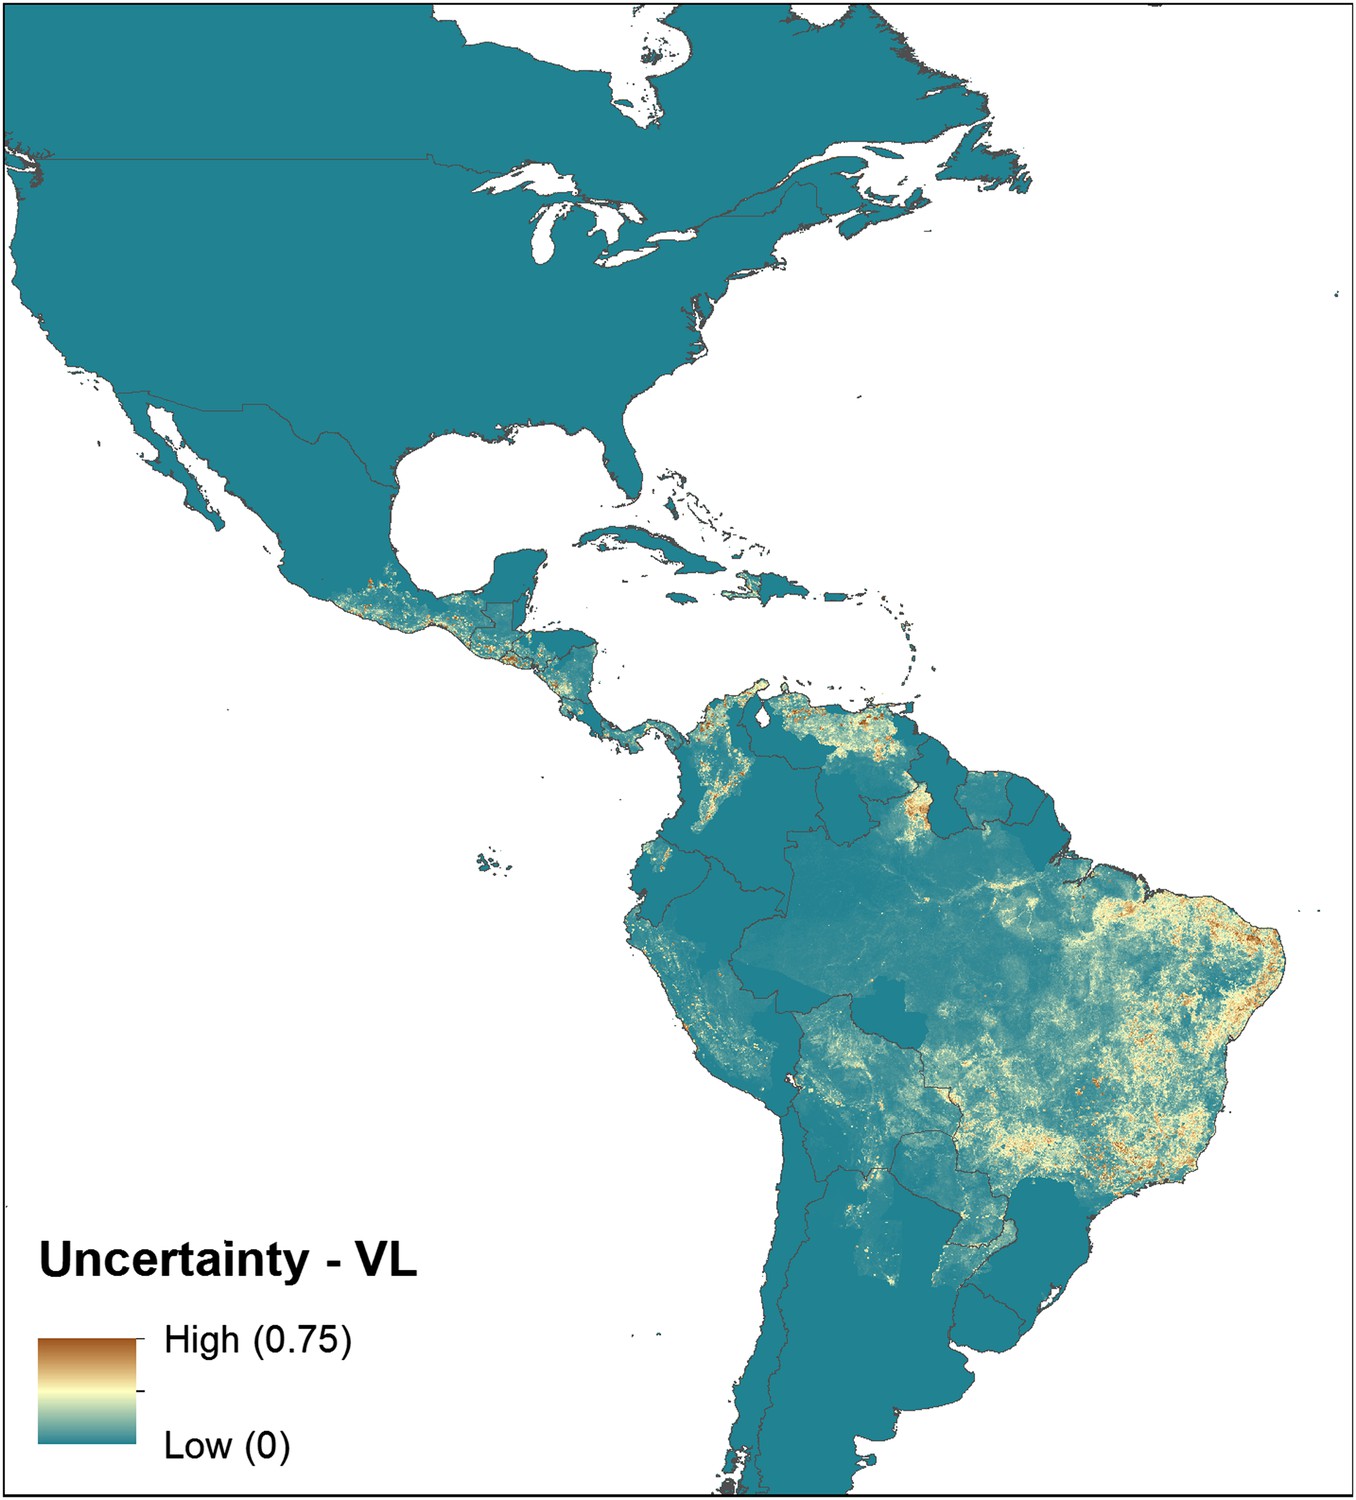
Uncertainty associated with predictions in Figure 2B.
Uncertainty was calculated as the range of the 95% confidence interval in predicted probability of occurrence for each pixel. Regions of highest uncertainty are in dark brown, with blue representing low uncertainty.
Figure 3 with 3 supplements

Reported and predicted distribution of cutaneous leishmaniasis in the Old World.
(A) Evidence consensus for presence of the disease ranging from green (complete consensus on the absence: −100%) to purple (complete consensus on the presence of disease: +100%). The blue spots indicate occurrence points or centroids of occurrences within small polygons. (B) Predicted risk of cutaneous leishmaniasis from green (low probability of presence) to purple (high probability of presence).
Figure 3—figure supplement 1
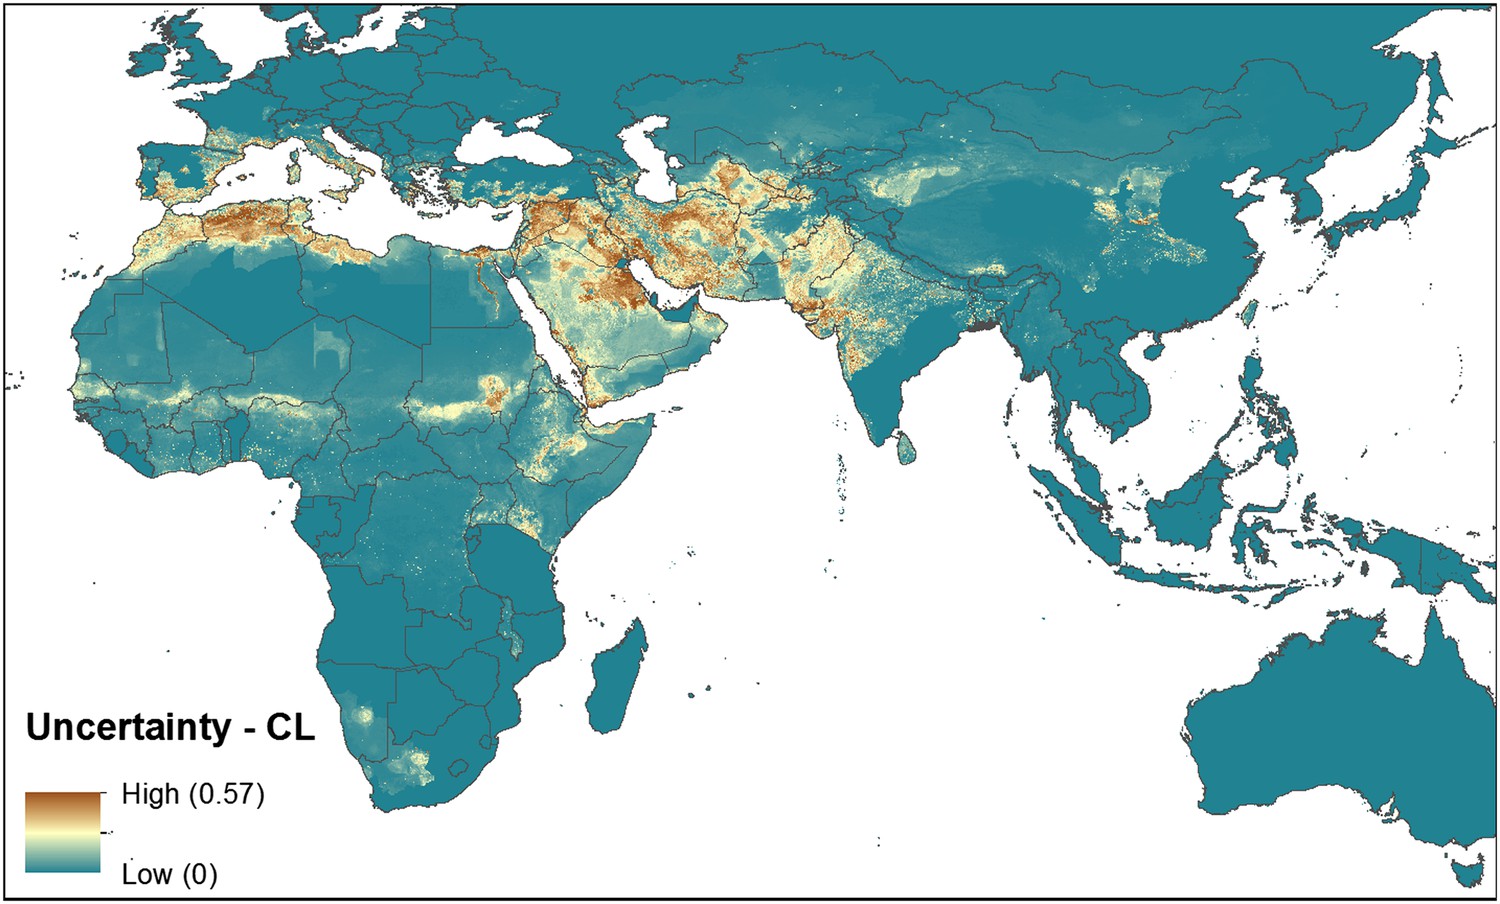
Uncertainty associated with predictions in Figure 3B.
Uncertainty was calculated as the range of the 95% confidence interval in predicted probability of occurrence for each pixel. Regions of highest uncertainty are in dark brown, with blue representing low uncertainty.
Figure 3—figure supplement 2
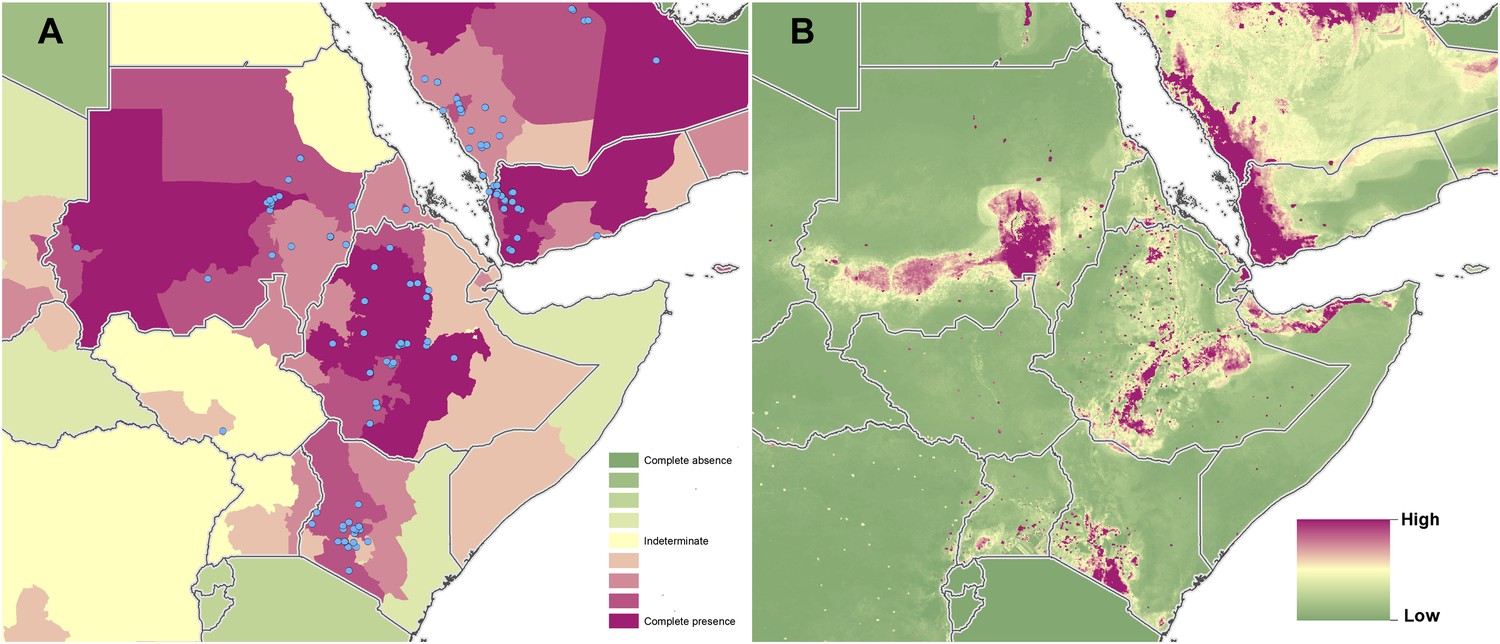
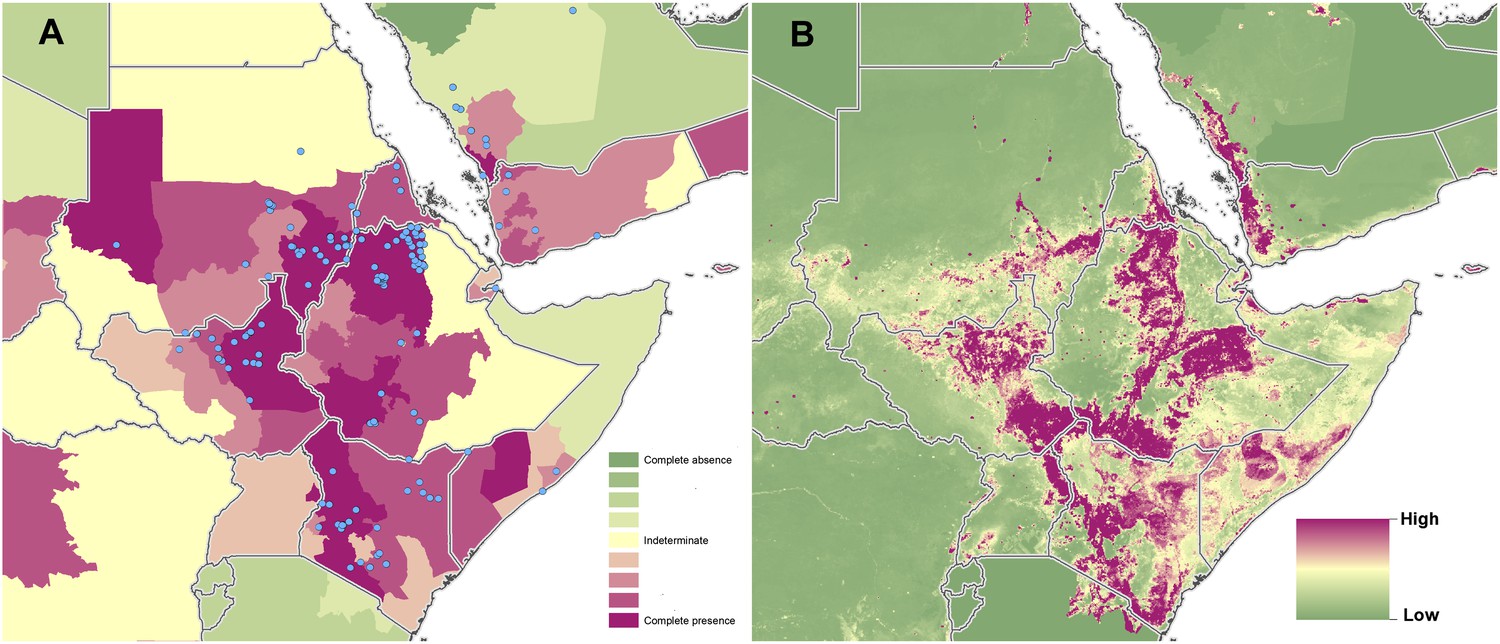
Reported and predicted distribution of cutaneous leishmaniasis in northeast Africa.
(A) Evidence consensus for presence of the disease ranging from green (complete consensus on the absence: −100%) to purple (complete consensus on the presence of disease: +100%). The blue spots indicate occurrence points or centroids of occurrences within small polygons. (B) Predicted risk of cutaneous leishmaniasis from green (low probability of presence) to purple (high probability of presence).
Figure 3—figure supplement 3
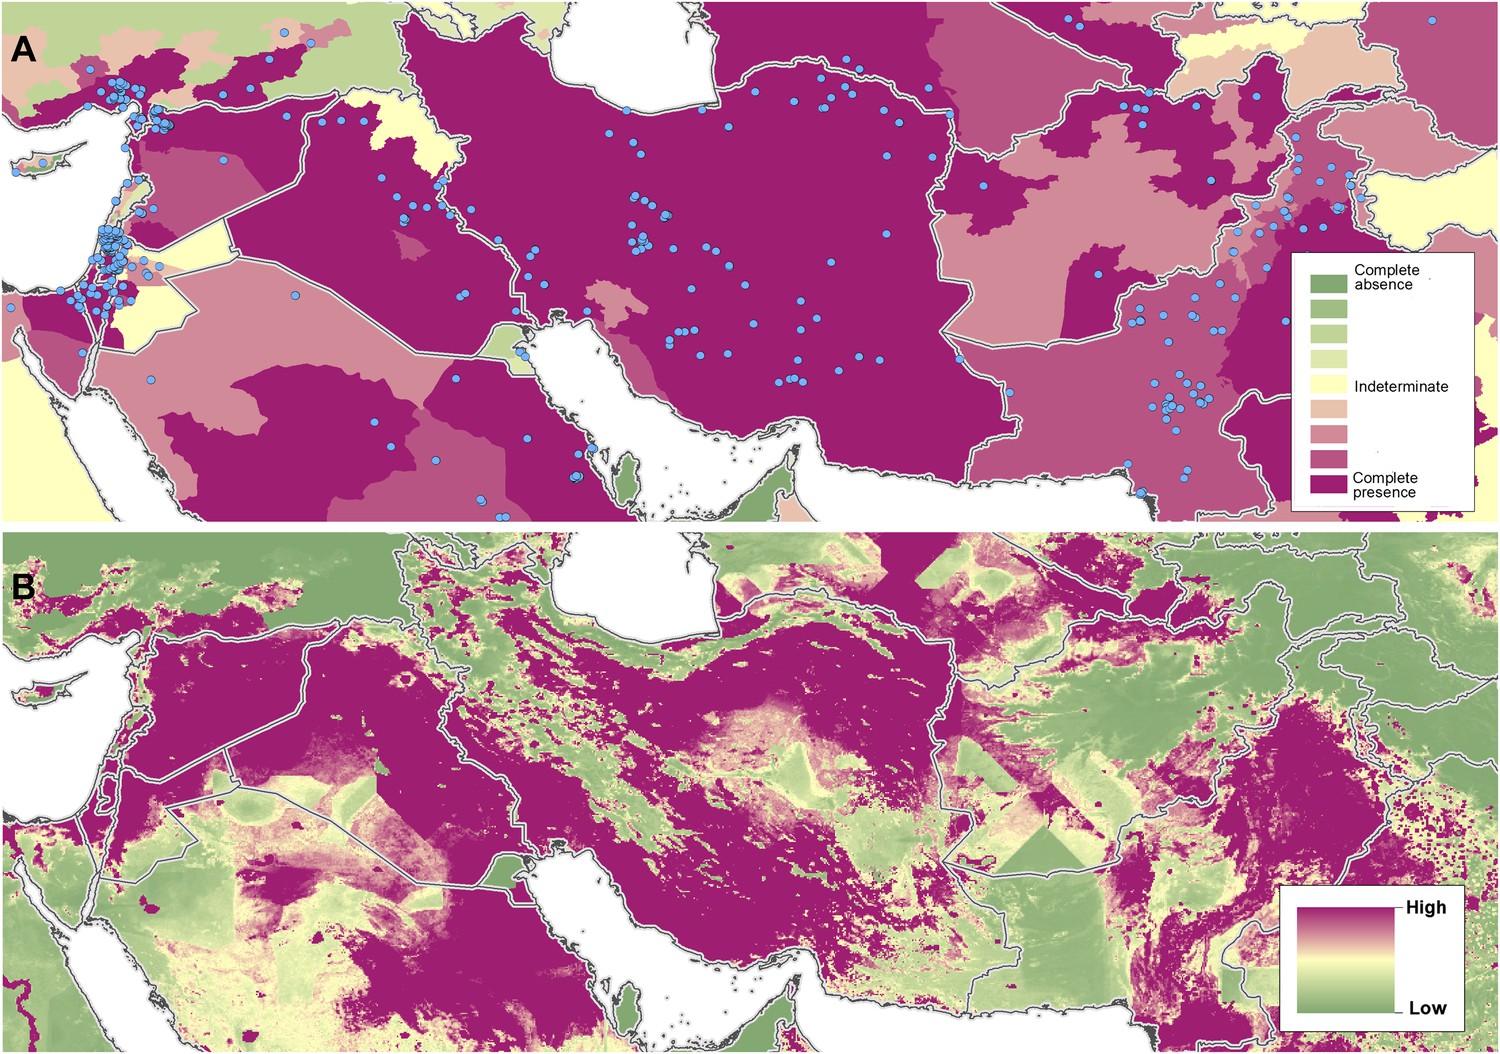
Reported and predicted distribution of cutaneous leishmaniasis across the Near East, including Syria, Iran and Afghanistan.
(A) Evidence consensus for presence of the disease ranging from green (complete consensus on the absence: −100%) to purple (complete consensus on the presence of disease: +100%). The blue spots indicate occurrence points or centroids of occurrences within small polygons. (B) Predicted risk of cutaneous leishmaniasis from green (low probability of presence) to purple (high probability of presence).
Figure 4 with 4 supplements

Reported and predicted distribution of visceral leishmaniasis in the Old World.
(A) Evidence consensus for presence of the disease ranging from green (complete consensus on the absence: −100%) to purple (complete consensus on the presence of disease: +100%). The blue spots indicate occurrence points or centroids of occurrences within small polygons. (B) Predicted risk of visceral leishmaniasis from green (low probability of presence) to purple (high probability of presence).
Figure 4—figure supplement 1
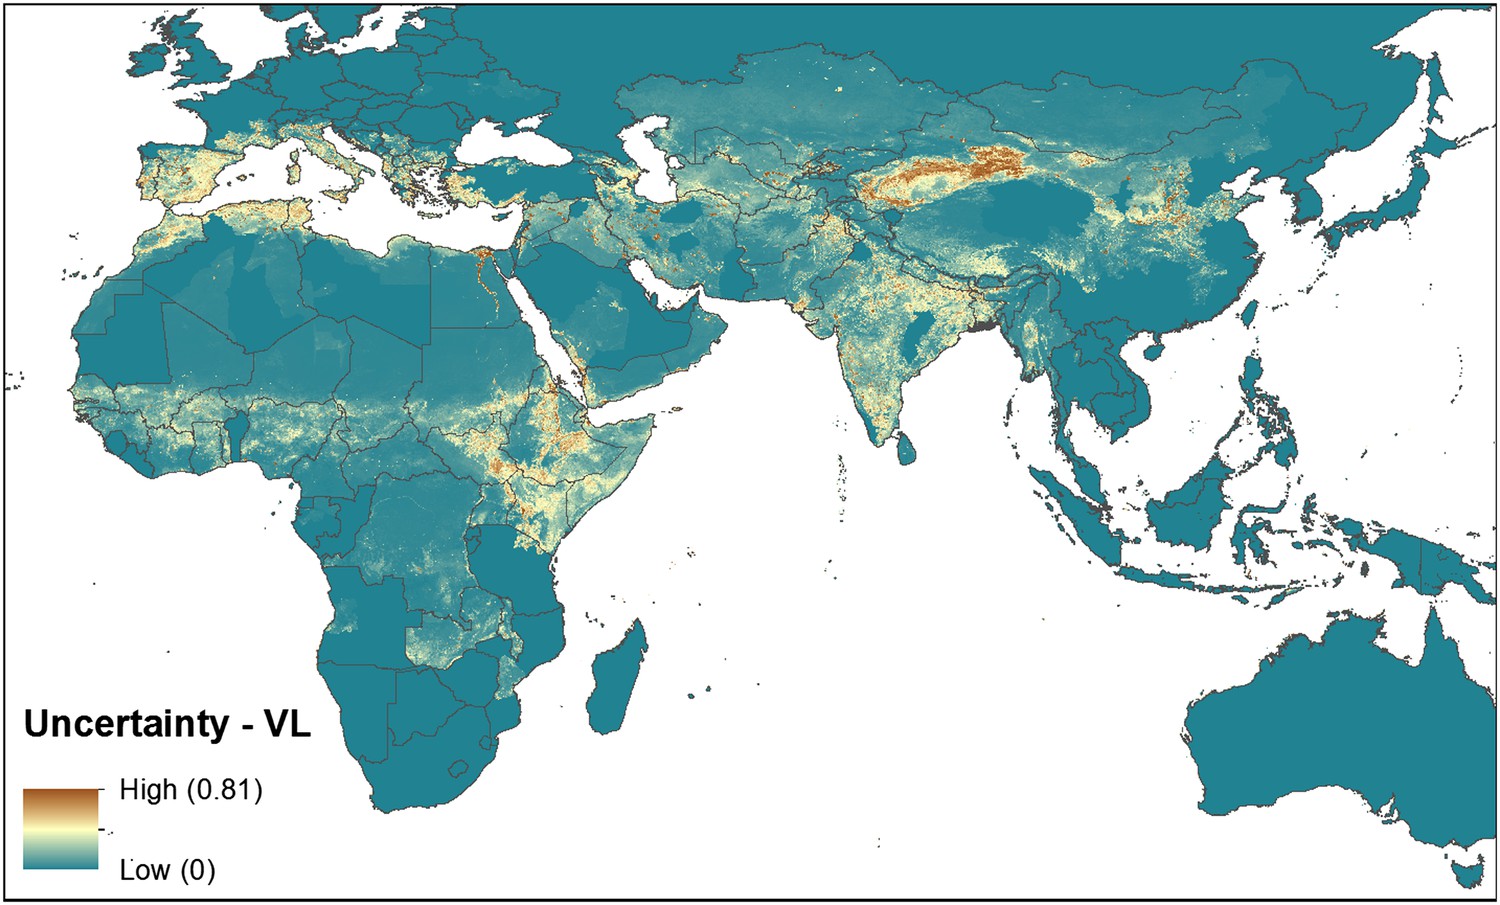
Uncertainty associated with predictions in Figure 4B.
Uncertainty was calculated as the range of the 95% confidence interval in predicted probability of occurrence for each pixel. Regions of highest uncertainty are in dark brown, with blue representing low uncertainty.
Figure 4—figure supplement 2
Reported and predicted distribution of visceral leishmaniasis in northeast Africa.
(A) Evidence consensus for presence of the disease ranging from green (complete consensus on the absence: −100%) to purple (complete consensus on the presence of disease: +100%). The blue spots indicate occurrence points or centroids of occurrences within small polygons. (B) Predicted risk of visceral leishmaniasis from green (low probability of presence) to purple (high probability of presence).
Figure 4—figure supplement 3
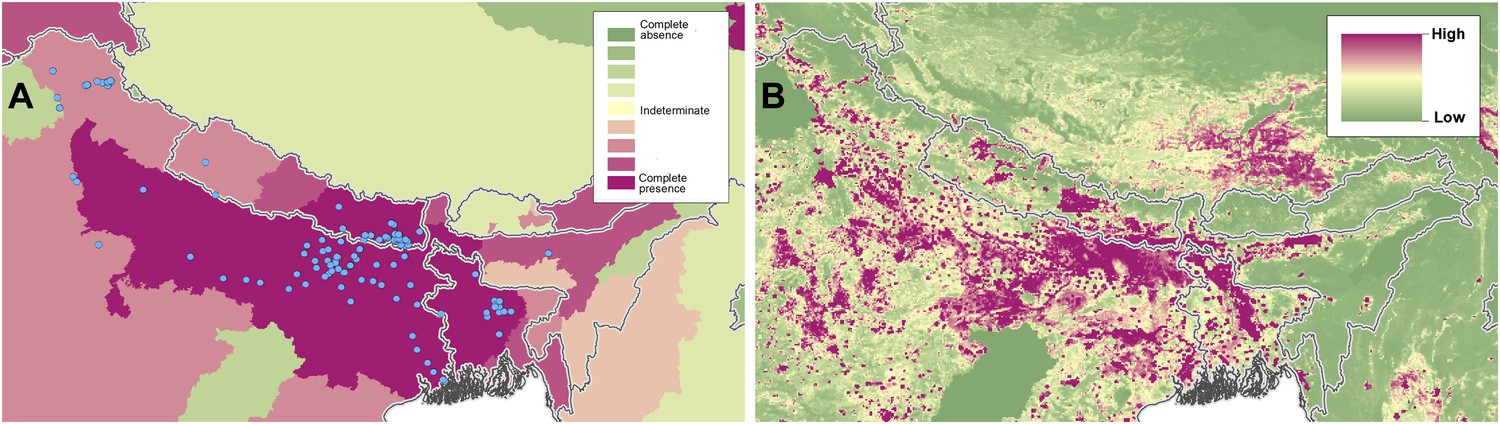
Reported and predicted distribution of visceral leishmaniasis in the Indian subcontinent.
(A) Evidence consensus for presence of the disease ranging from green (complete consensus on the absence: −100%) to purple (complete consensus on the presence of disease: +100%). The blue spots indicate occurrence points or centroids of occurrences within small polygons. (B) Predicted risk of visceral leishmaniasis from green (low probability of presence) to purple (high probability of presence).
Figure 4—figure supplement 4
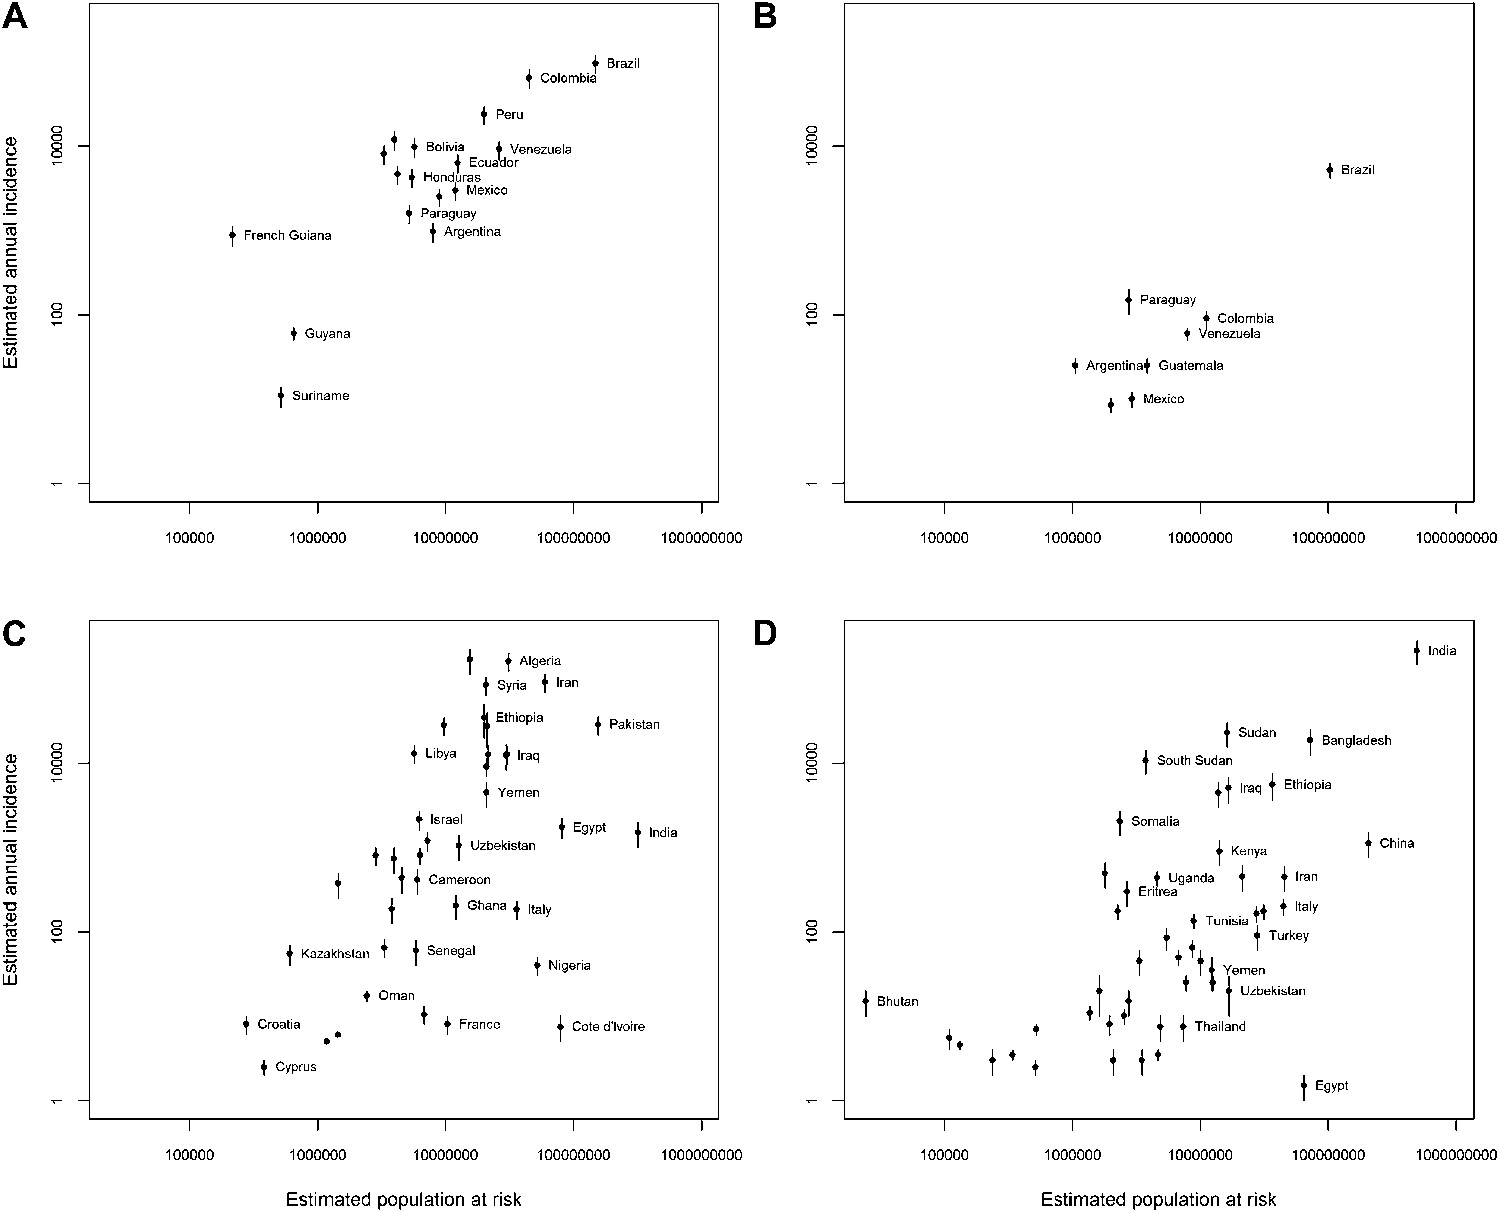
Population at risk estimates for leishmaniasis.
Four scatterplots showing the relationship between non-zero estimated mean annual incidence (Alvar et al., 2012) and estimated population at risk derived from the cartographic approach for (A) New World cutaneous leishmaniasis, (B) New World visceral leishmaniasis, (C) Old World cutaneous leishmaniasis, and (D) Old World visceral leishmaniasis. For each country the bars represent the annual incidence estimate range.
Tables
Table 1
Origin and spatial resolution of leishmaniasis occurrence data
| Origin and resolution of occurrence data | ||||
|---|---|---|---|---|
| Point data | Province level data | District level data | Total | |
| Cutaneous leishmaniasis | ||||
| Literature | 3680 | 879 | 1220 | 5779 |
| CNR-L | 531 | 47 | 31 | 609 |
| HealthMap | 31 | – | – | 31 |
| GenBank | 6 | – | 1 | 7 |
| Total | 4248 | 926 | 1252 | 6426 |
| Visceral leishmaniasis | ||||
| Literature | 3050 | 1500 | 1068 | 5618 |
| CNR-L | 429 | 24 | 29 | 482 |
| HealthMap | 32 | 1 | – | 33 |
| GenBank | 3 | – | 1 | 4 |
| Total | 3514 | 1525 | 1098 | 6137 |
-
Each cell gives the number of occurrence records added to the data set by considering each additional datasource after removing duplicate records. Occurrence records are separated by spatial resolution—whether they are recorded as points (typically representing settlements) or as province level (admin 1) or district level (admin 2) data.
Table 2
Mean relative contribution of predictor variables to the ensemble BRT models of CL and VL in both the Old and New World
| Top predictors of CL | Relative contribution | Top predictors of VL | Relative contribution |
|---|---|---|---|
| Old world | |||
| Peri-urban extents | 47.34 | Peri-urban extents | 51.50 |
| Minimum LST | 18.36 | Urban extents | 17.38 |
| Urban extents | 9.01 | Maximum NDVI | 7.87 |
| G-Econ | 7.33 | Minimum LST | 5.87 |
| Minimum Precipitation | 4.95 | Maximum Precipitation | 4.00 |
| New World | |||
| Maximum LST | 36.91 | Peri-urban extents | 25.90 |
| Peri-urban extents | 18.61 | Urban extents | 21.24 |
| Maximum precipitation | 12.06 | Mean LST | 9.18 |
| Minimum precipitation | 6.21 | Mean NDVI | 7.83 |
| Minimum LST | 4.39 | Maximum LST | 6.40 |
-
LST = Land Surface Temperature, G-Econ = Geographically based Economic data, NDVI = Normalised Difference Vegetation Index.
Download links
A two-part list of links to download the article, or parts of the article, in various formats.
Downloads (link to download the article as PDF)
Open citations (links to open the citations from this article in various online reference manager services)
Cite this article (links to download the citations from this article in formats compatible with various reference manager tools)
Global distribution maps of the leishmaniases
eLife 3:e02851.
https://doi.org/10.7554/eLife.02851


