Flattop regulates basal body docking and positioning in mono- and multiciliated cells
- Helmholtz Center Munich, Germany
- Université libre de Bruxelles, Belgium
- University of Edinburgh, United Kingdom
- Univeristy of Edinburgh, United Kingdom
Figures
Figure 1 with 2 supplements
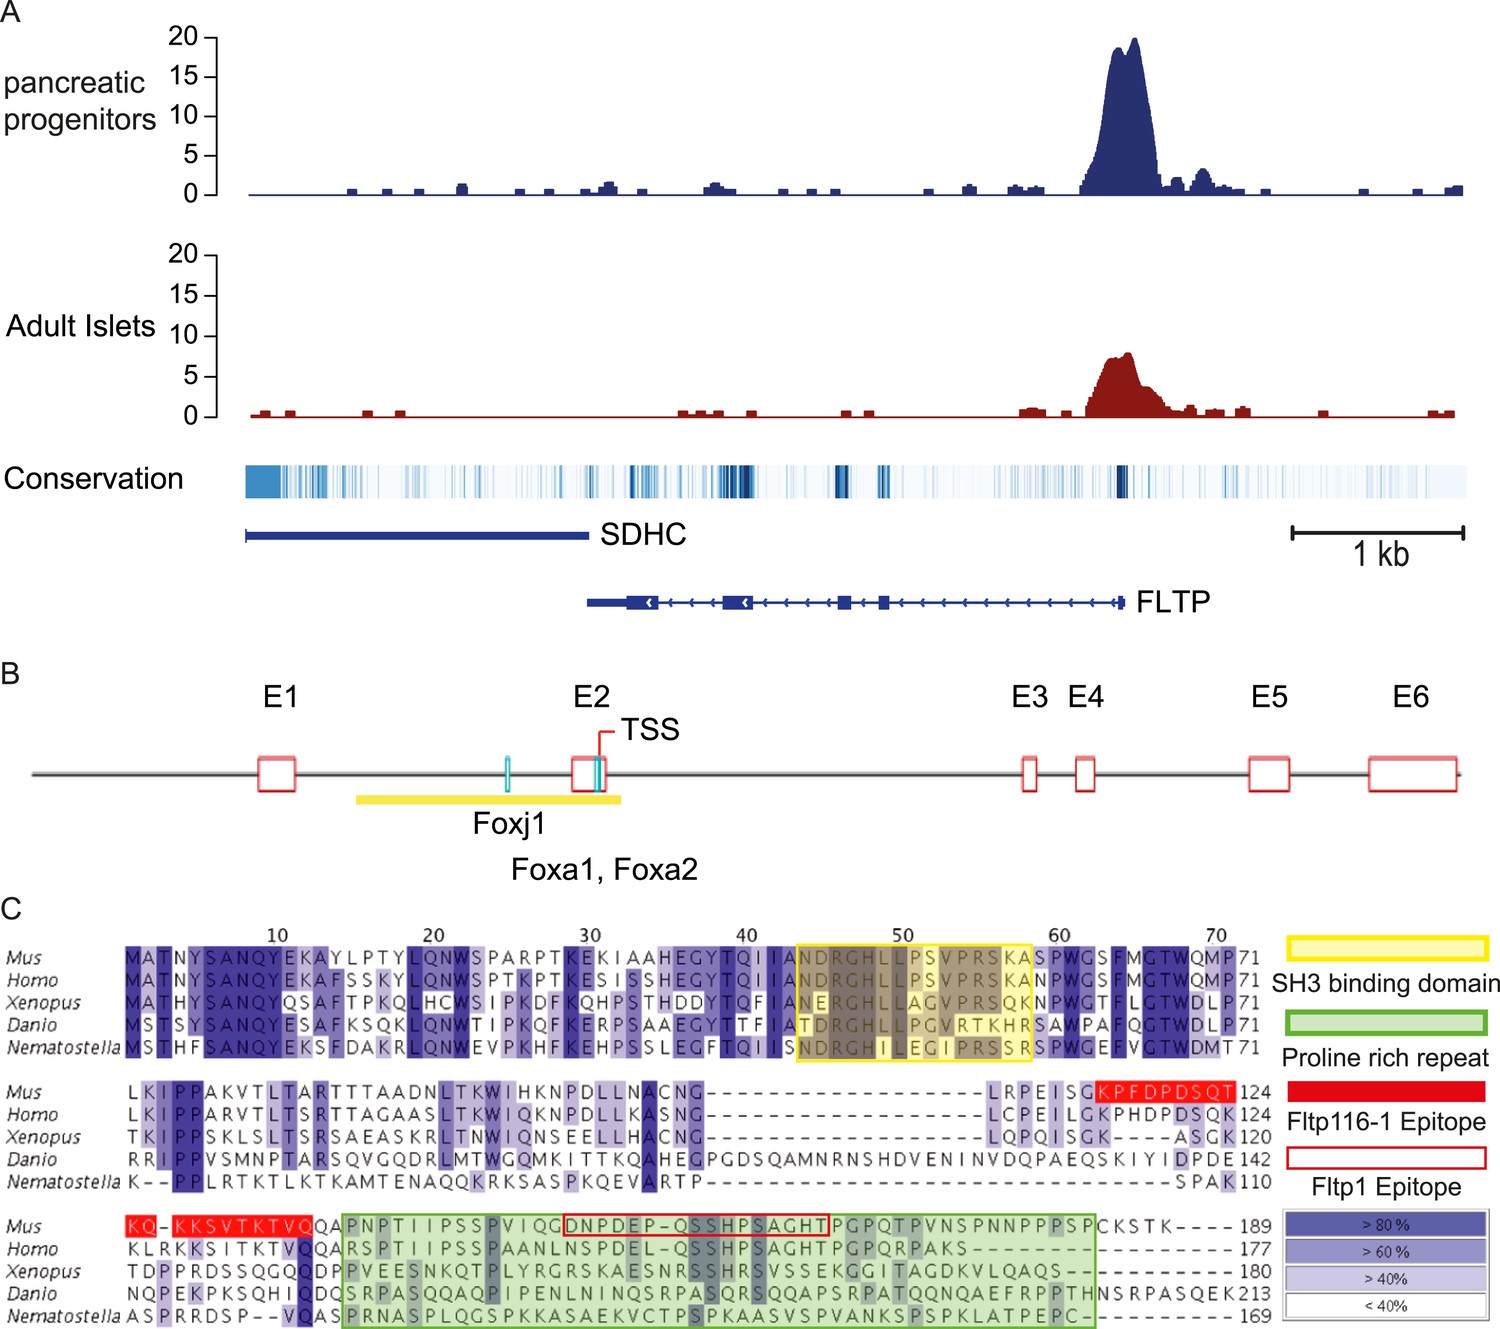
FLTP has active FOXA2 binding sites in its promoter and is conserved among species.
(A) A high amount of the endodermal transcription factor FOXA2 binds the human FLTP promoter in pancreatic progenitors and in adult islets, indicating that FLTP is a direct target of FOXA2 and expressed in these cells. (B) Fltp shows predicted (Genomatix) Foxj1, Foxa1, and Foxa2 binding sites in its promoter (clear red boxes: exons (E1–E6); yellow box: promoter; TSS: transcriptional start site; light blue boxes: Foxj1, Foxa1, Foxa2 binding sites). (C) Fltp protein alignment shows high conservation between different species (highest conservation in the first 76 amino acids). The mouse and human proteins are highly homologous (yellow box: SH3 binding domain; green box: predicted proline rich repeat (PRR); red filled box: peptide sequence of the Fltp116-1 epitope; red empty box: peptide sequence of the Fltp1 epitope; dark blue indicates conservation over 80%; lighter colors indicate less conservation).
-
Figure 1—source data 1
Mendelian ratio of Fltp intercrosses on different backgrounds.
(A–C) Fltp animals are born roughly at the expected Mendelian ratio in C57Bl6/6NCrl, 129S6/SvEvTac, or CD1 background. Note: FltpZV/ZV animals are slightly underrepresented on the C57Bl6 and 129S6 background.
- https://doi.org/10.7554/eLife.03842.004
Figure 1—figure supplement 1
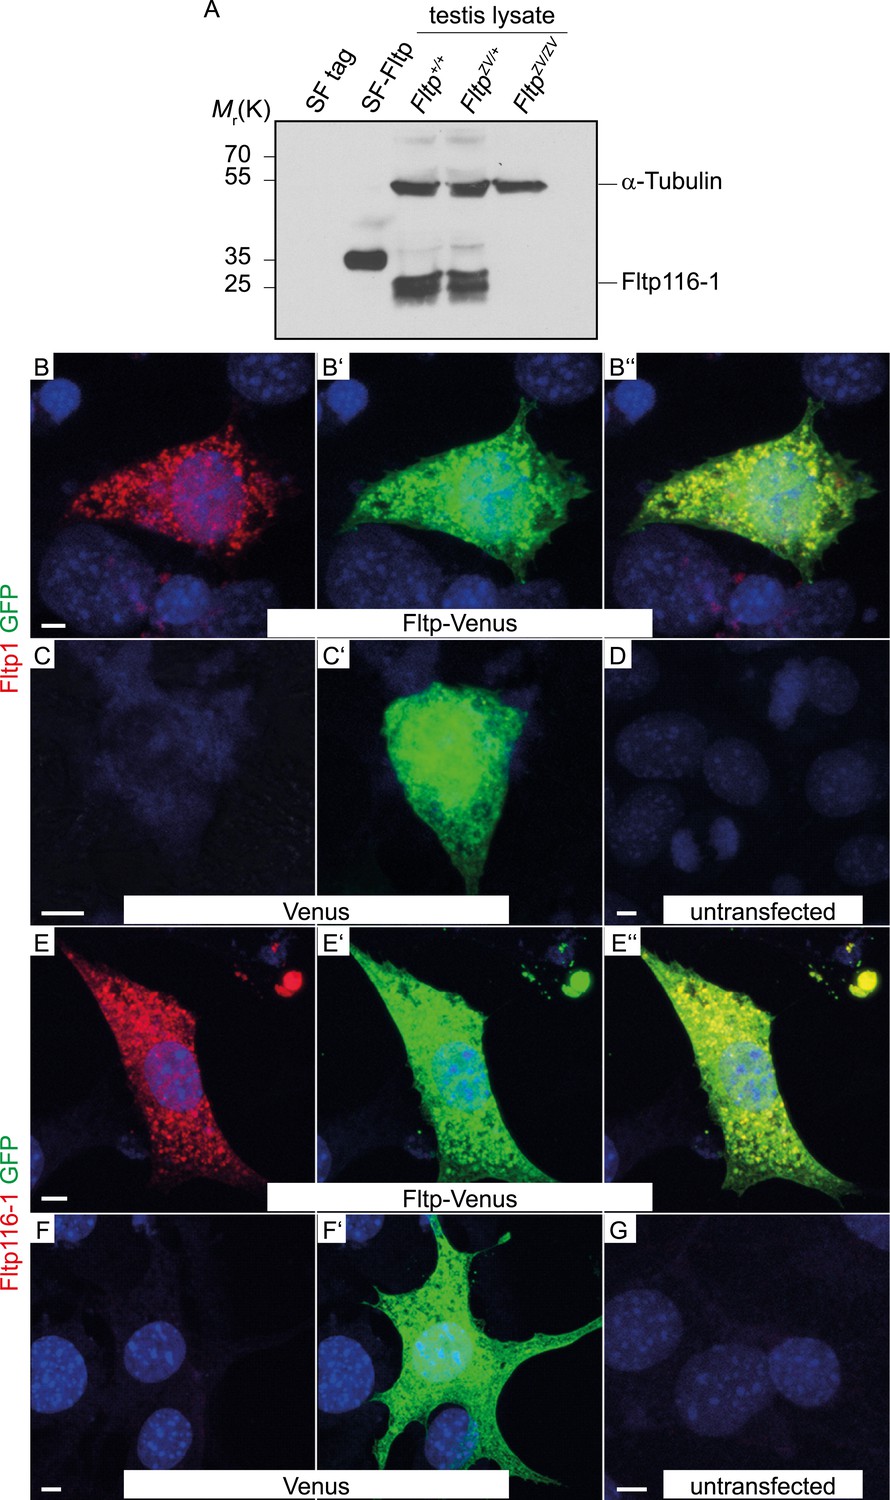
Fltp antibody specificity.
(A) Western blot of Strep Flag (SF) Tag, Fltp SF-tagged transiently transfected HEK293T cells and testis lysate of Fltp+/+, FltpZV/+, and FltpZV/ZV animals incubated with Fltp116-1 antibody. Note, Fltp1 (Figure 1—figure supplement 2D) detects one specific and Fltp116-1 two bands at approximately the calculated size of Fltp, likely representing post-translationally modified Fltp protein. Anti-alpha-Tubulin antibody was subsequently used on the same blot to confirm equal loading. (B–D) Laser scanning microscopy (LSM) of HEK293T cells transiently transfected with a vector encoding for Fltp-Venus (B–B″), Venus (C–C′), and an untransfected control (D) stained with Fltp1 and GFP (for Venus). Fltp-Venus can be detected in the cytoplasm by both antibodies. (E–G) LSM of HEK293T cells transiently transfected with a vector encoding for Fltp-Venus (E–E″), Venus (F–F′), and an untransfected control (G) stained with Fltp116-1 and GFP. Fltp-Venus can be detected in the cytoplasm by both antibodies. Scale bars; 5 µm (C–G).
Figure 1—figure supplement 2
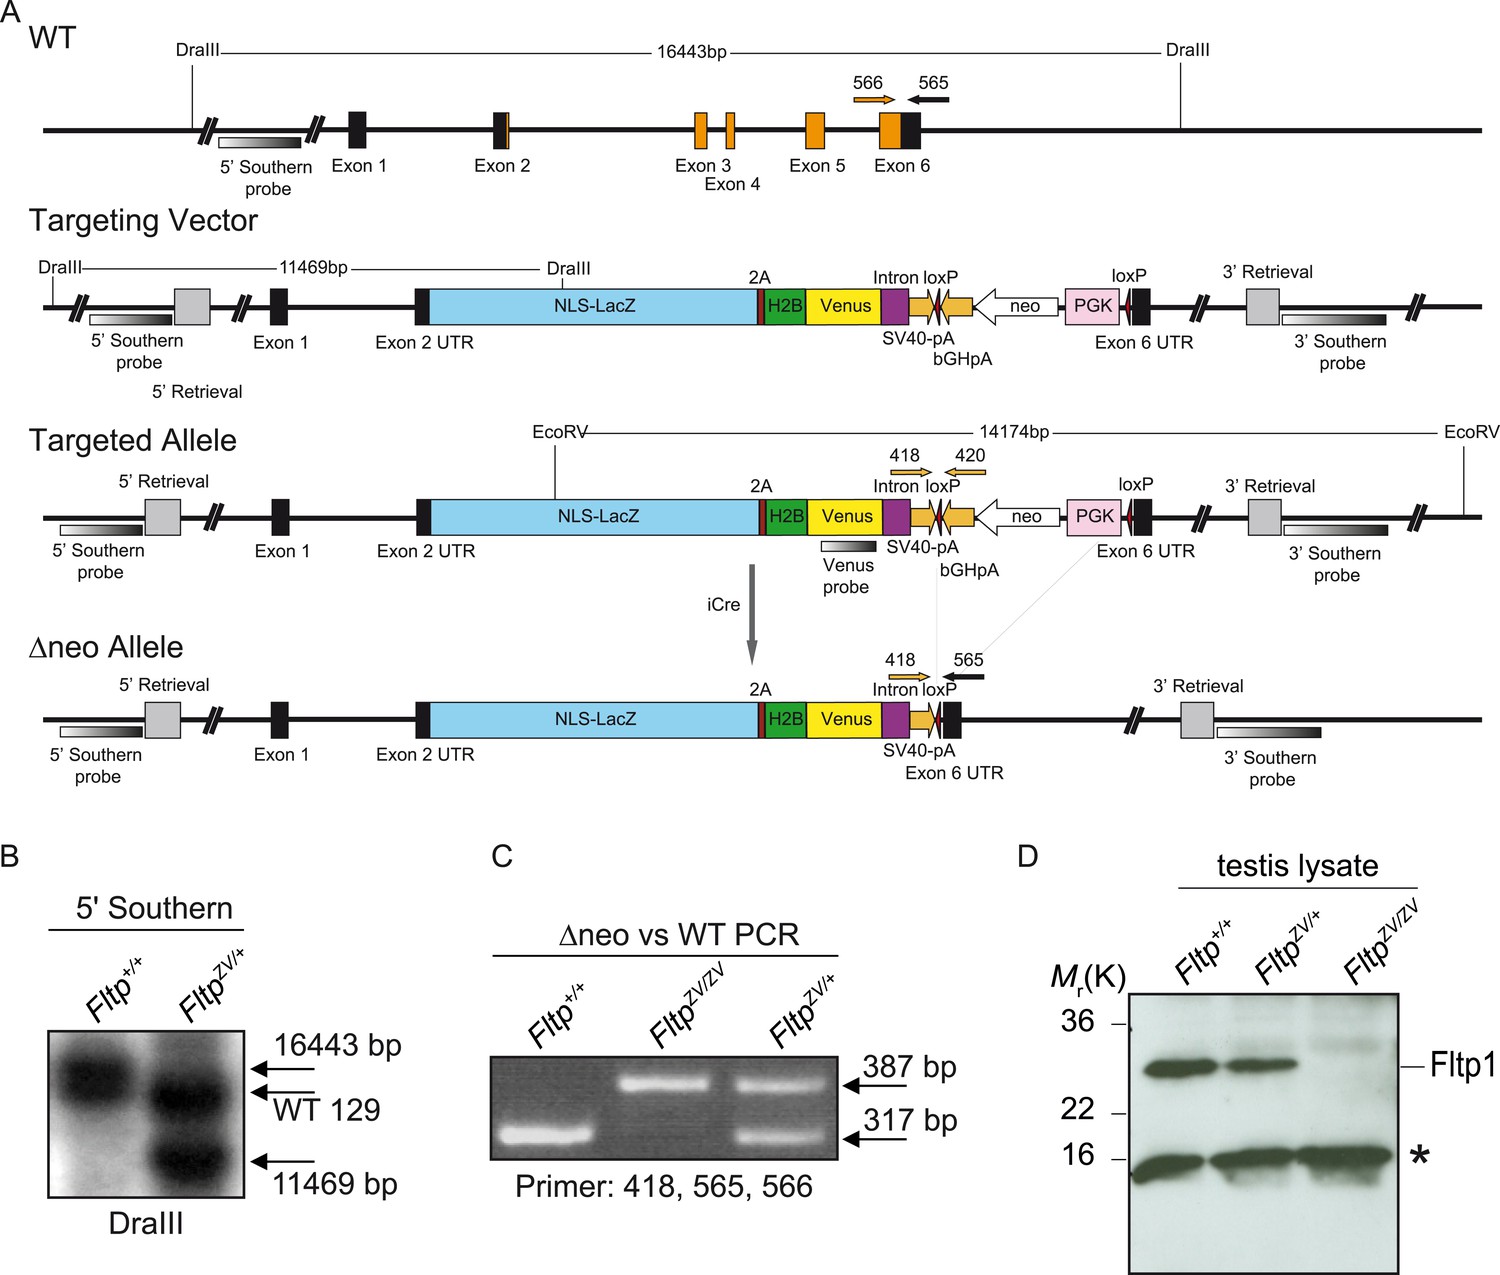
Fltp construct and confirmation of the knock-out strategy.
(A) The FltpZV targeting strategy deletes the entire open reading frame (ORF) from exon 2 to 6 (exons: black and orange boxes; orange boxes: ORF, primers for genotyping: 418, 420, 565, 566; for primer sequences see Supplemental ‘Materials and methods’). The external 5′- as well as the 3′-probe are indicated. Restriction enzyme sites for DraIII and EcoRV are shown. Homology regions for recombination of the targeting construct are indicated as 5′- and 3′-Retrieval. The figure is on scale (NLS-LacZ: nuclear localization signal-beta-galactosidase; 2A: viral T2A sequence; H2B: histon-2B; Venus: yellow fluorescent reporter gene; SV40-pA: Simian Virus 40 polyadenylation signal; loxP: site of Cre-mediated recombination; bGHpA: bovine Growth Hormone polyadenylation signal; neo: neomycin resistance cassette; PGK: phospho-glycerate kinase; UTR: untranslated region). (B) Southern blot of Fltp+/+ embryonic stem (ES) cells vs FltpZV/+ ES cells digested with DraIII and hybridized with the external 5′ Southern probe showing the Bl6 (16,443 bp), 129 WT allele, and the Bl6 targeted allele (11,469 bp). Notice the shift of the WT band due to restriction length polymorphism. (C) Genotyping PCR to discriminate between Fltp+/+, FltpZV/+, and FltpZV/ZV (primers: 418, 565, 566; WT band (317 bp); targeted Δneo band (387 bp)). (D) Western blot of testis lysate of Fltp+/+, FltpZV/+, and FltpZV/ZV animals incubated with Fltp1 antibody. Fltp protein band is detectable at around 25 kDa (calculated weight 20 kDa). Fltp protein is absent in FltpZV/ZV lysate. The asterisk marks an unspecific band.
Figure 2 with 1 supplement
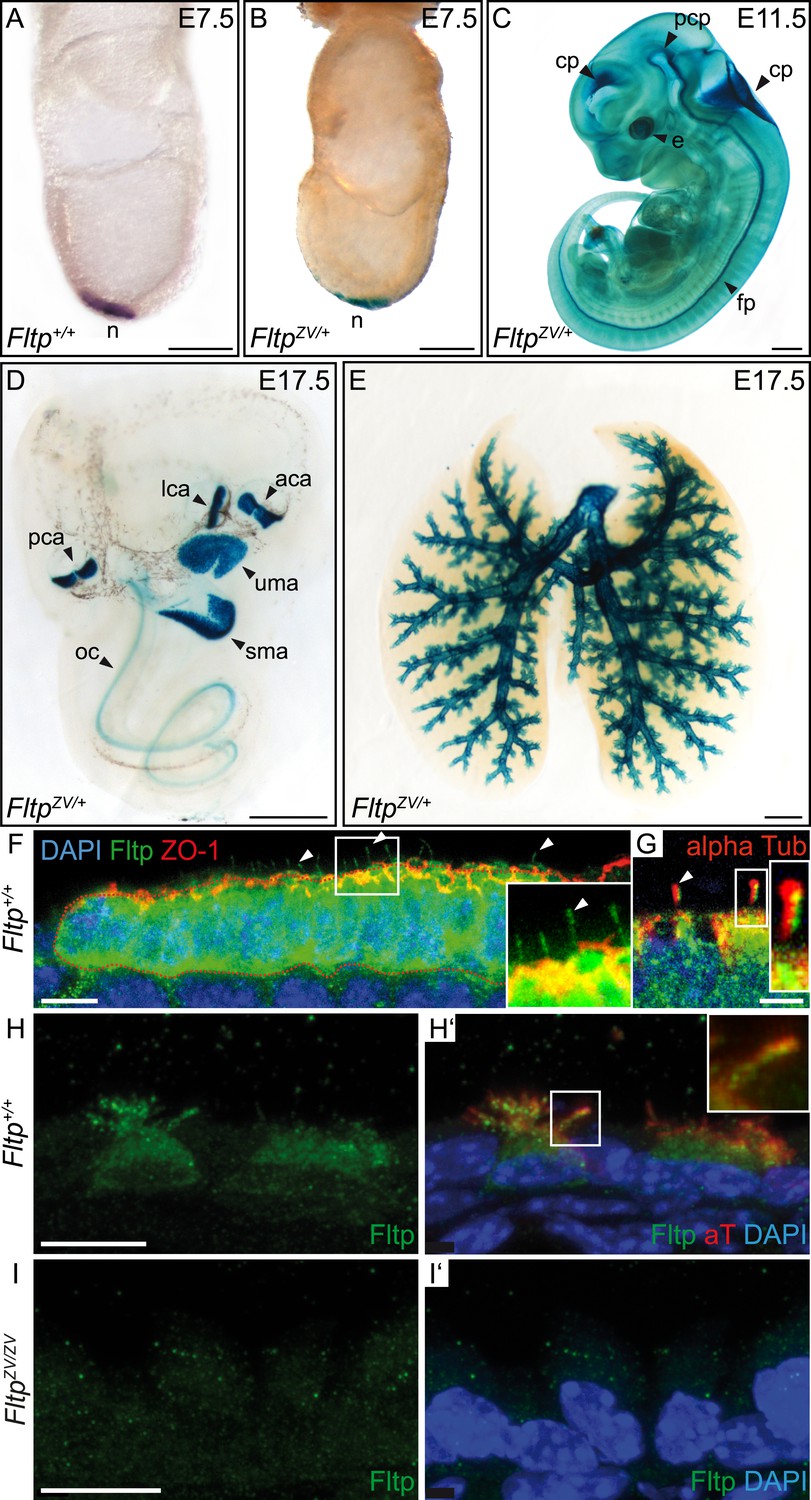
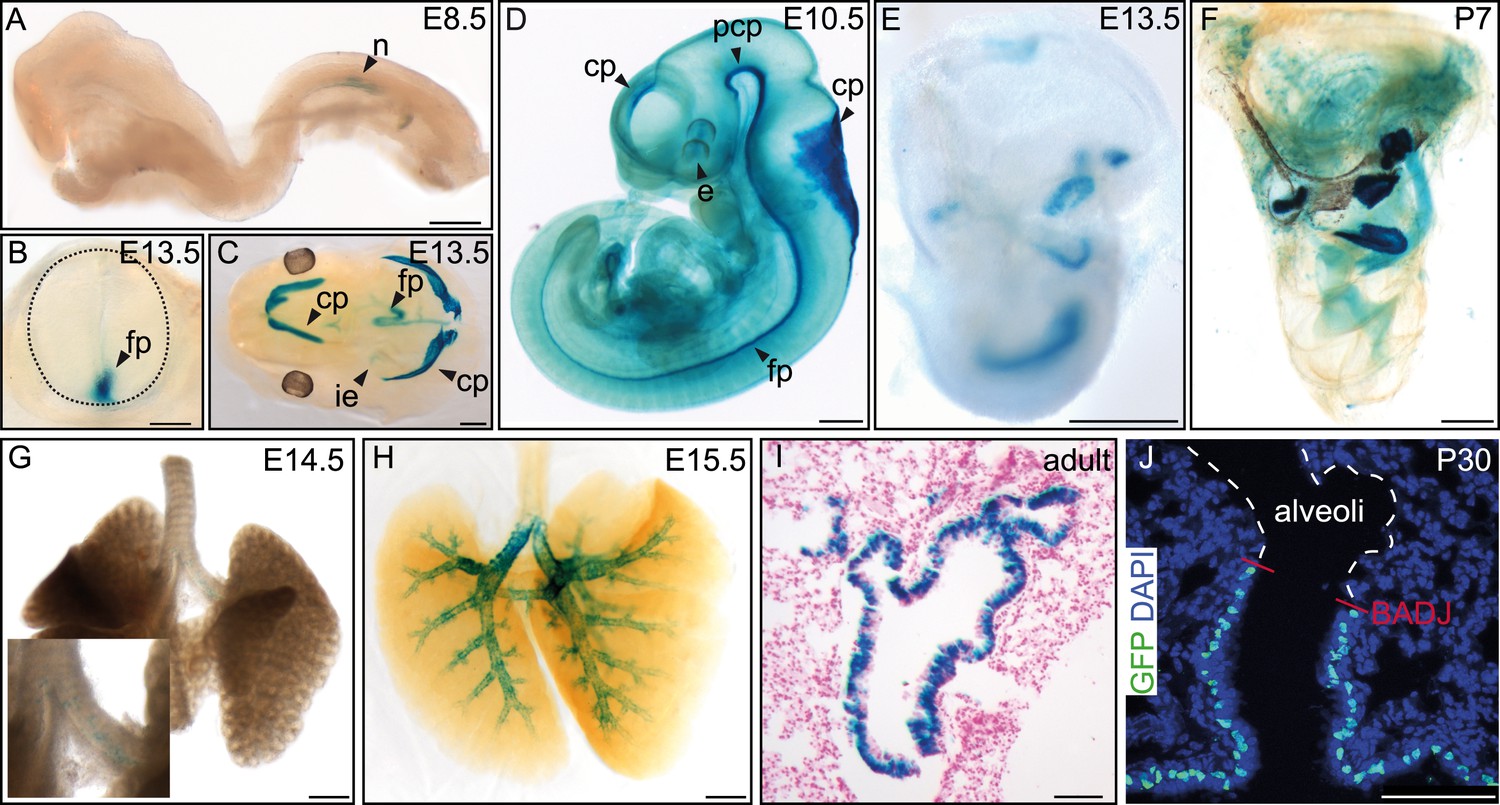
Fltp reporter and protein is detectable in mono- and multiciliated tissues.
(A and B) mRNA (Fltp in situ hybridization) (A) and lacZ reporter expression (B) are restricted to the node (n) at E7.5. (C–E)Whole-mount lacZ stained and benzyl alcohol/benzyl benzoate (BABB) cleared FltpZV/+ embryo and organs. (C) E11.5 embryo reveals reporter expression in the choroid plexi (cp), prechordal plate (pcp), eye (e), and floor plate (fp). (D) E17.5 IE shows reporter expression in posterior crista ampullaris (pca), lateral crista ampullaris (lca), anterior crista ampullaris (aca), utricular macula (uma), and saccular macula (sma) of the vestibular part as well as in the organ of Corti (oc). (E) E17.5 lung shows lacZ reporter activity in multiciliated lung epithelial cells. (F and G) Whole-mount antibody stained embryo (node, E7.75) analyzed by LSM reveals Fltp protein in vesicular fashion in the cytoplasm and along primary cilia (white arrow heads). (H–I′) Immunohistochemistry on cryosections combined with LSM analysis reveals Fltp at the apical plasma membrane and at cilia in multiciliated lung epithelial cells of Fltp+/+adult animals (H and H′). No Fltp immunoreactivity is detected in FltpZV/ZV lungs (I and I′). ZO-1 marks apical TJs, α-Tubulin (alpha Tub), and acetylated-Tubulin (aT), the tubulin network and cilia; nuclei are marked by DAPI and Fltp by Fltp1 (F and G) and Fltp116-1 (H–I′). Scale bars; 100 µm (A and B), 500 µm (C, D, E), 10 µm (F), 4 µm (G), and 10 µm (H–I′).
Figure 2—figure supplement 1
Additional Fltp reporter expression in mono- and multiciliated tissues.
(A–H) Whole-mount lacZ stained and benzyl alcohol/benzyl benzoate (BABB) cleared (D, F, H) FltpZV/+ embryos and organs. β-gal activity is restricted to the node (n) (A). (B) Cross-section of the neural tube (dotted line) reveals reporter expression in the floor plate (fp). (C) Reporter expression can be detected in the four choroid plexi (cp), the fp, and the inner ear (ie). (D) lacZ expression analysis reveals β-gal activity in the developing cp of the first, second, third, and fourth ventricle, in the prechordal plate (pcp), in the developing eye (e), and in the fp. (E and F) LacZ reporter is expressed in the 6 sensory regions of the IE. Onset of reporter expression is at E12.5. (G and H) LacZ staining of whole-mount lungs shows onset of reporter expression in the main stem bronchi at E14.5 (G). Later, expression is restricted to the lung epithelium (H). (I) Histological section through a lacZ stained adult lung showing β-gal activity in the lung epithelium. (J) Laser scanning microscopy of lung cryosections reveals Fltp reporter expression in epithelial lung cells. Expression directly stops at the broncho-alveolar-duct junction (BADJ). The alveoli are absent of Fltp reporter staining. Fltp reporter positive cells are marked by GFP and nuclei by DAPI. Scale bars; 200 µm (A), 250 µm (B), 500 µm (C–H), 150 µm (I), 75 µm (J).
Figure 3
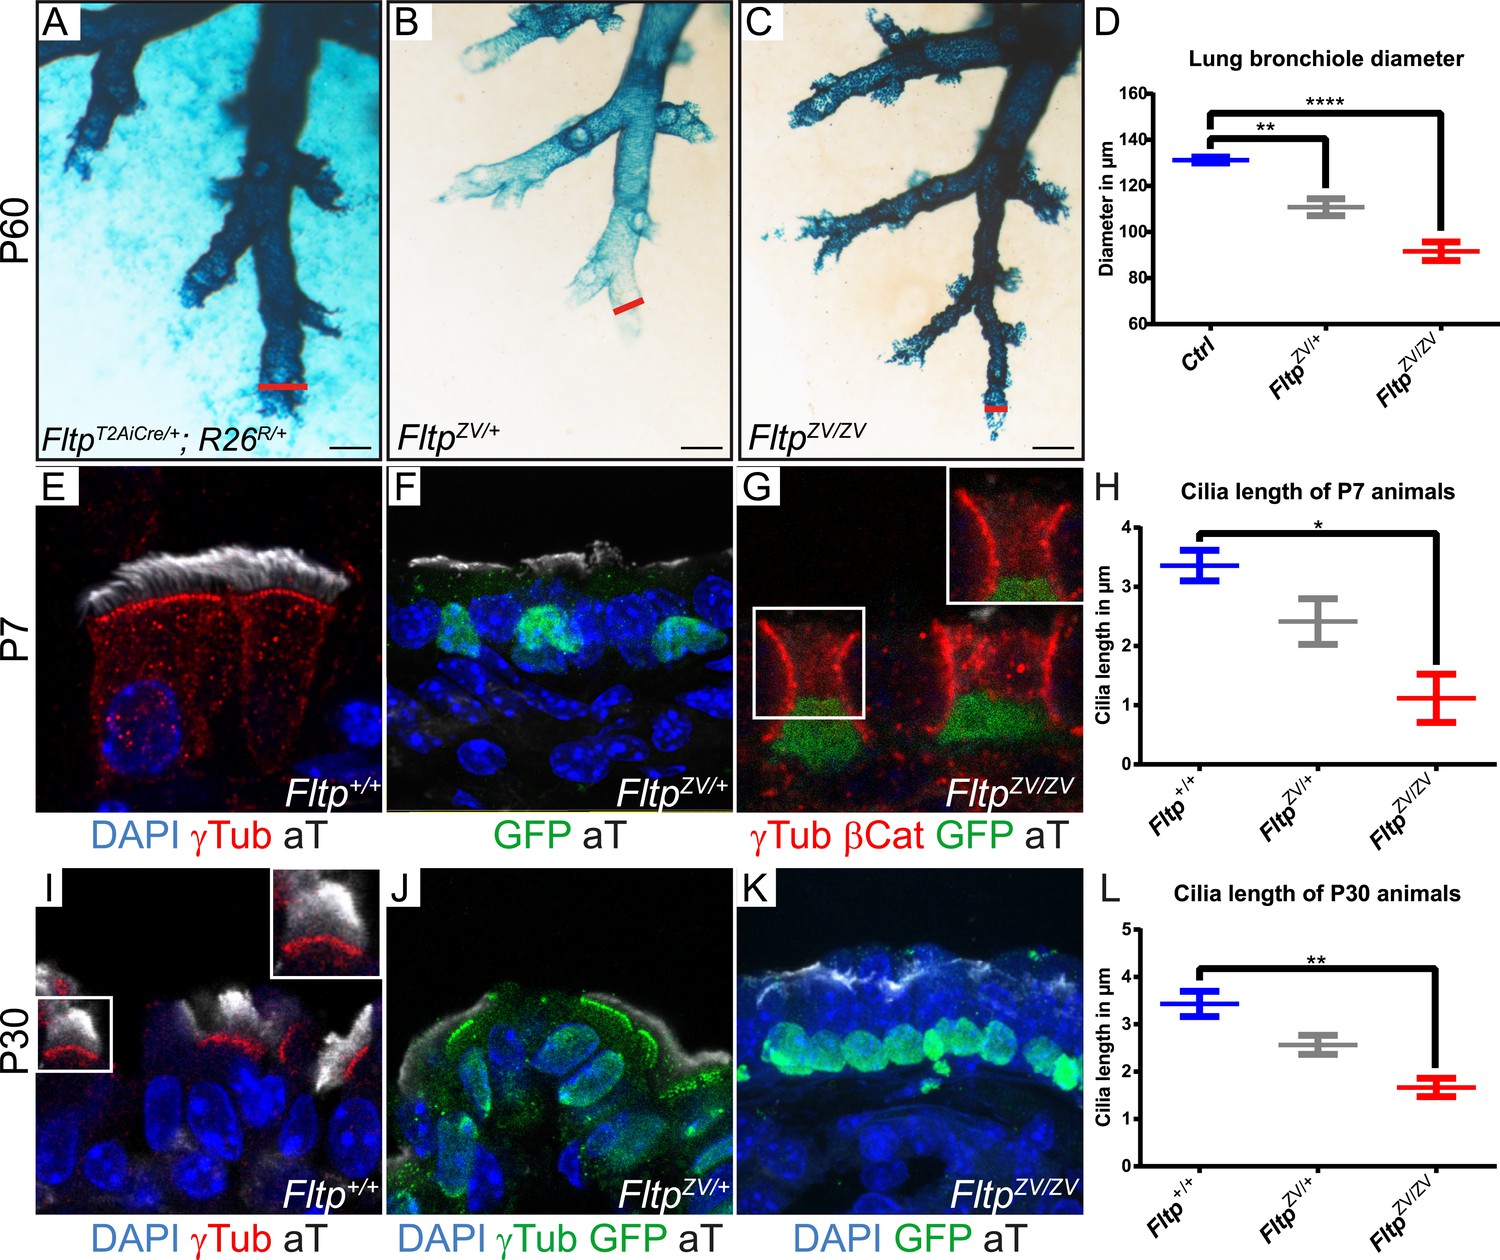
Loss of Fltp leads to constricted distal airways and cilia formation defects in the lung.
(A–C) Whole-mount lacZ stained and BABB cleared distal airways of left lung lobes at P60. Red lines show how diameters were measured. (A) FltpT2AiCre/+; R26R/+is used as control (Ctrl). (B and C) FltpZV/+ and FltpZV/ZV animals show constricted distal airways. (D) Average distal airway diameter of Ctrl animals is 132.25 µm (n = 4; 125 bronchi), of FltpZV/+ animals is 99.68 µm (n = 3; 90), and of FltpZV/ZV animals is 90.06 µm (n = 3; 95). (E–G and I–K) Immunohistochemistry on cryosections of lung distal airway epithelium combined with LSM analysis. (E and I) In Fltp+/+animals BBs project cilia at the apical surface. (F and J) In FltpZV/+ animals less and shorter cilia are detectable. (G and K) FltpZV/ZV animals often show absence of or shorter cilia at the apical surface. Note that only very few BBs are docked at the apical surface. (H and L) FltpZV/ZV animals show significant shorter cilia than Fltp+/+ animals. In total we examined n = 3 (81 cells) for Fltp+/+, n = 2 (22) for FltpZV/+, and n = 2 (93) for FltpZV/ZV P7 animals. For P30 we examined n = 3 (121 cells) for Fltp+/+, n = 3 (134) for FltpZV/+, and n = 2 (138) for FltpZV/ZV. BBs are marked by γ-Tubulin (γTub), cilia by acetylated-Tubulin (aT), cell membrane by β-Catenin (βCat), nuclei by DAPI, and nuclei of Fltp reporter expressing cells by GFP. Statistical analysis uses an one way ANOVA (**p = 0.0028; ***p < 0.0001 for (D) and *p = 0.0143; **p = 0.0025 for (H and L)). Error bars show the 95% confidence interval of the mean (D) and the standard error of the mean (H and L). Scale bars; 200 µm (A–C).
Figure 4 with 1 supplement

Fltp is expressed and necessary during BB docking.
(A) Scheme of multiciliated cell (MCC) maturation. A MCC progenitor projects a primary cilium at the apical surface (stage I). Centrosome amplification is the first sign of differentiation (stage II) followed by apical transport and docking of BBs (stage III). Fully differentiated cells project multiple motile cilia at the apical surface (stage IV). Staging according to Vladar and Stearns (2007). The green nucleus indicates Fltp reporter gene expression. (B–G) LSM of ALI culture of FltpZV and WT mTECs. (B) Onset and level of Fltp reporter expression correlate with the onset of BB amplification and ciliogenesis (stage II–IV) in cultured ALI mTECs as shown in the scheme in (A). (C–C′′′) Confocal sections of a single cell from the sub-apical actin level (C) over the apical actin level (C′ and C″) to the cilia level (C′′′) (ALI day 4). Fltp co-localizes with the MT-plus end binding protein EB-1 (D) (ALI day 4) next to the pericentriolar matrix (E) (ALI day 4) and to cilia in multiciliated Fltp+/+ cells (C′′′). (F) Fltp+/+ cell showing all BBs (red dots) projecting cilia (white stripes) at the apical surface (ALI day 4). (G) In many FltpZV/ZV cells the majority of BBs are not docked at the level of tight junctions marked by ZO-1 and do not project cilia (ALI day 4). (H and I) Side view IMARIS surface rendering shows that all BBs are docked at the apical surface in Fltp+/+ (H) (ALI day 4) in contrast to FltpZV/ZV cells where most BBs stay in the cytoplasm (I) (ALI day 4). BBs are marked by γ-Tubulin (γTub) and pericentrin (Peric), cilia and the tubulin network by tyrosinated-Tubulin (Tyr Tub) and acetylated-Tubulin (aT), the actin network by Phalloidin (Phall), MT plus ends by EB-1, Fltp protein by Fltp116-1, nuclei by DAPI, and nuclei of Fltp reporter expressing cells by GFP. Scale bars; 2 µm (C–C′′′, D, E), 5 µm (F and G).
Figure 4—figure supplement 1
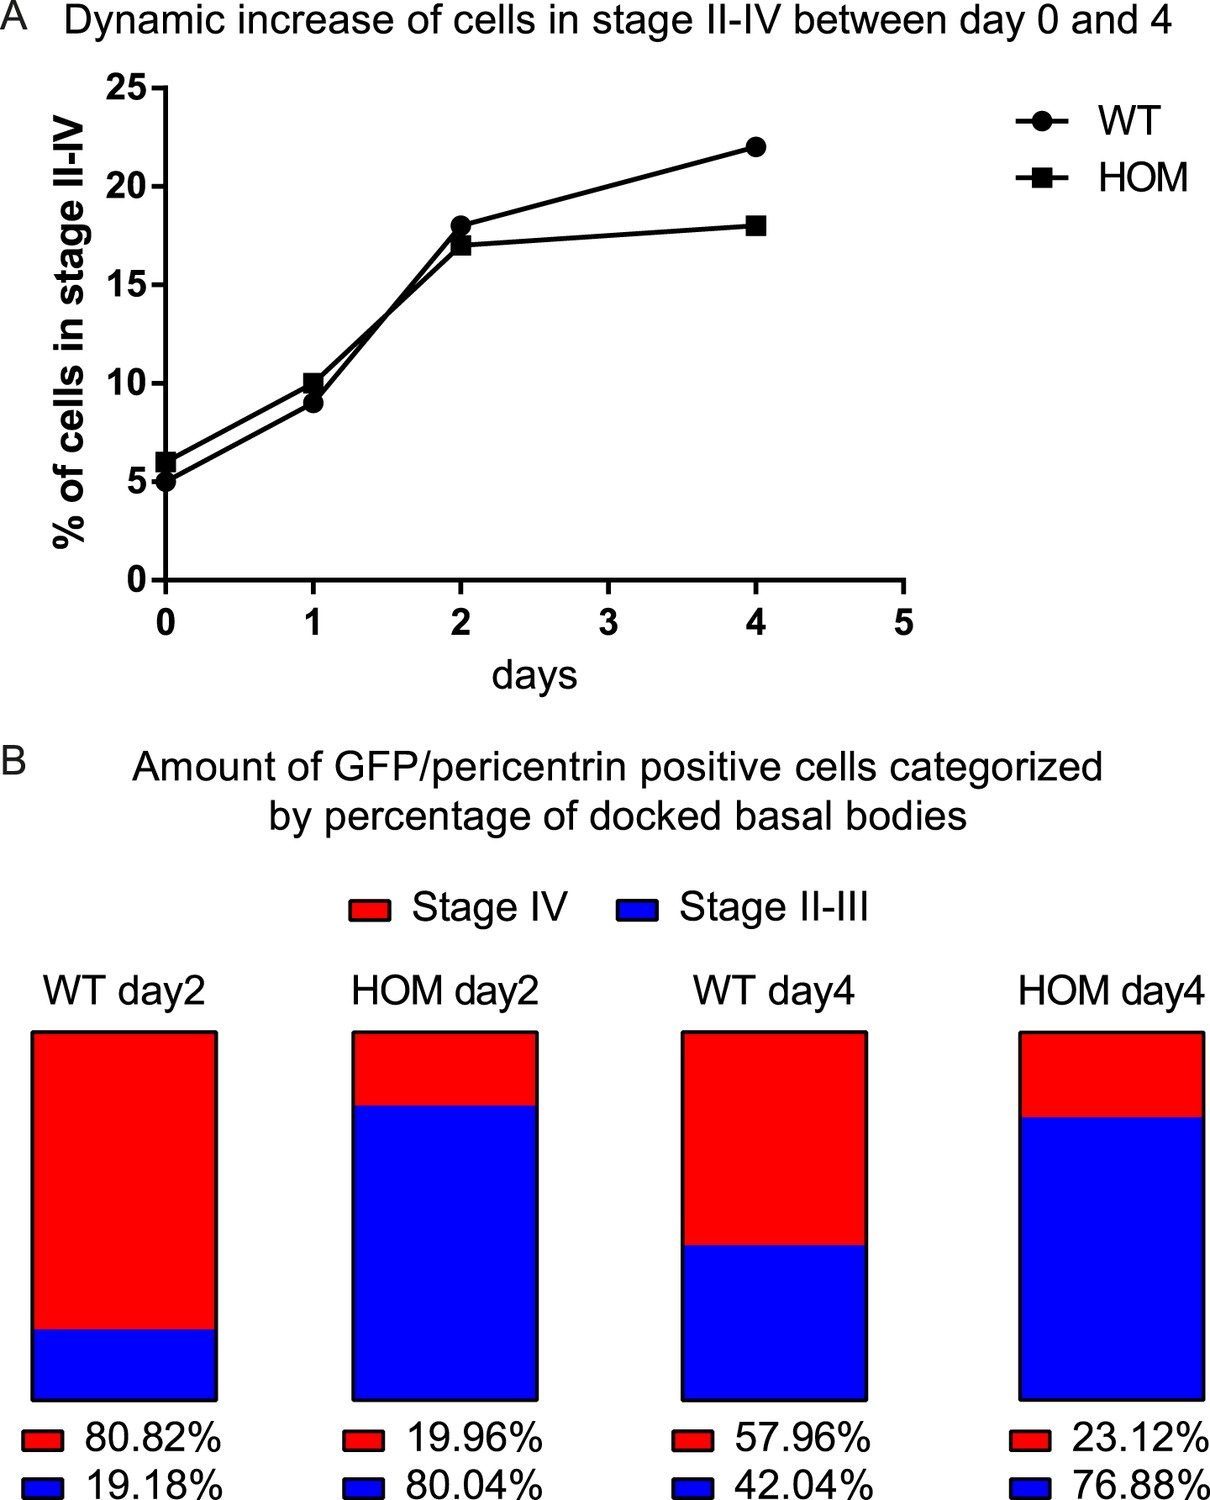
ALI differentiation efficiency and quantification of BB docking defect.
(A) Graph showing the percentage of cells in stage II–IV for WT and FltpZV/ZV (HOM) ALIs at day zero (before the switch to ALI condition), one, two, and four measured by GFP and pericentrin (HOM) and only pericentrin (WT) staining compared to the total amount of cells in the ALI culture stained by DAPI (representative images were analyzed). For WT analysis we counted n = 1 (1493 cells) for day 0, n = 1 (1345) for day 1, n = 2 (1635) for day 2, n = 2 (1262) for day 4 and for HOM n = 1 (1367 cells) for day 0, n = 1 (1542) for day 1, n = 3 (942) for day 2, n = 4 (1123) for day 4. (B) Shows the percentage of ciliation (measured by acetylated-Tubulin staining) of cells with amplified centrosomes (measured by pericentrin staining) for WT and HOM ALIs at day two and four categorized into stage II–III and stage IV. For WT analysis we counted n = 4 (609 cells) for day 2, n = 4 (231) for day 4 and for HOM n = 10 (611) for day 2, n = 7 (286) for day 4.
Figure 5
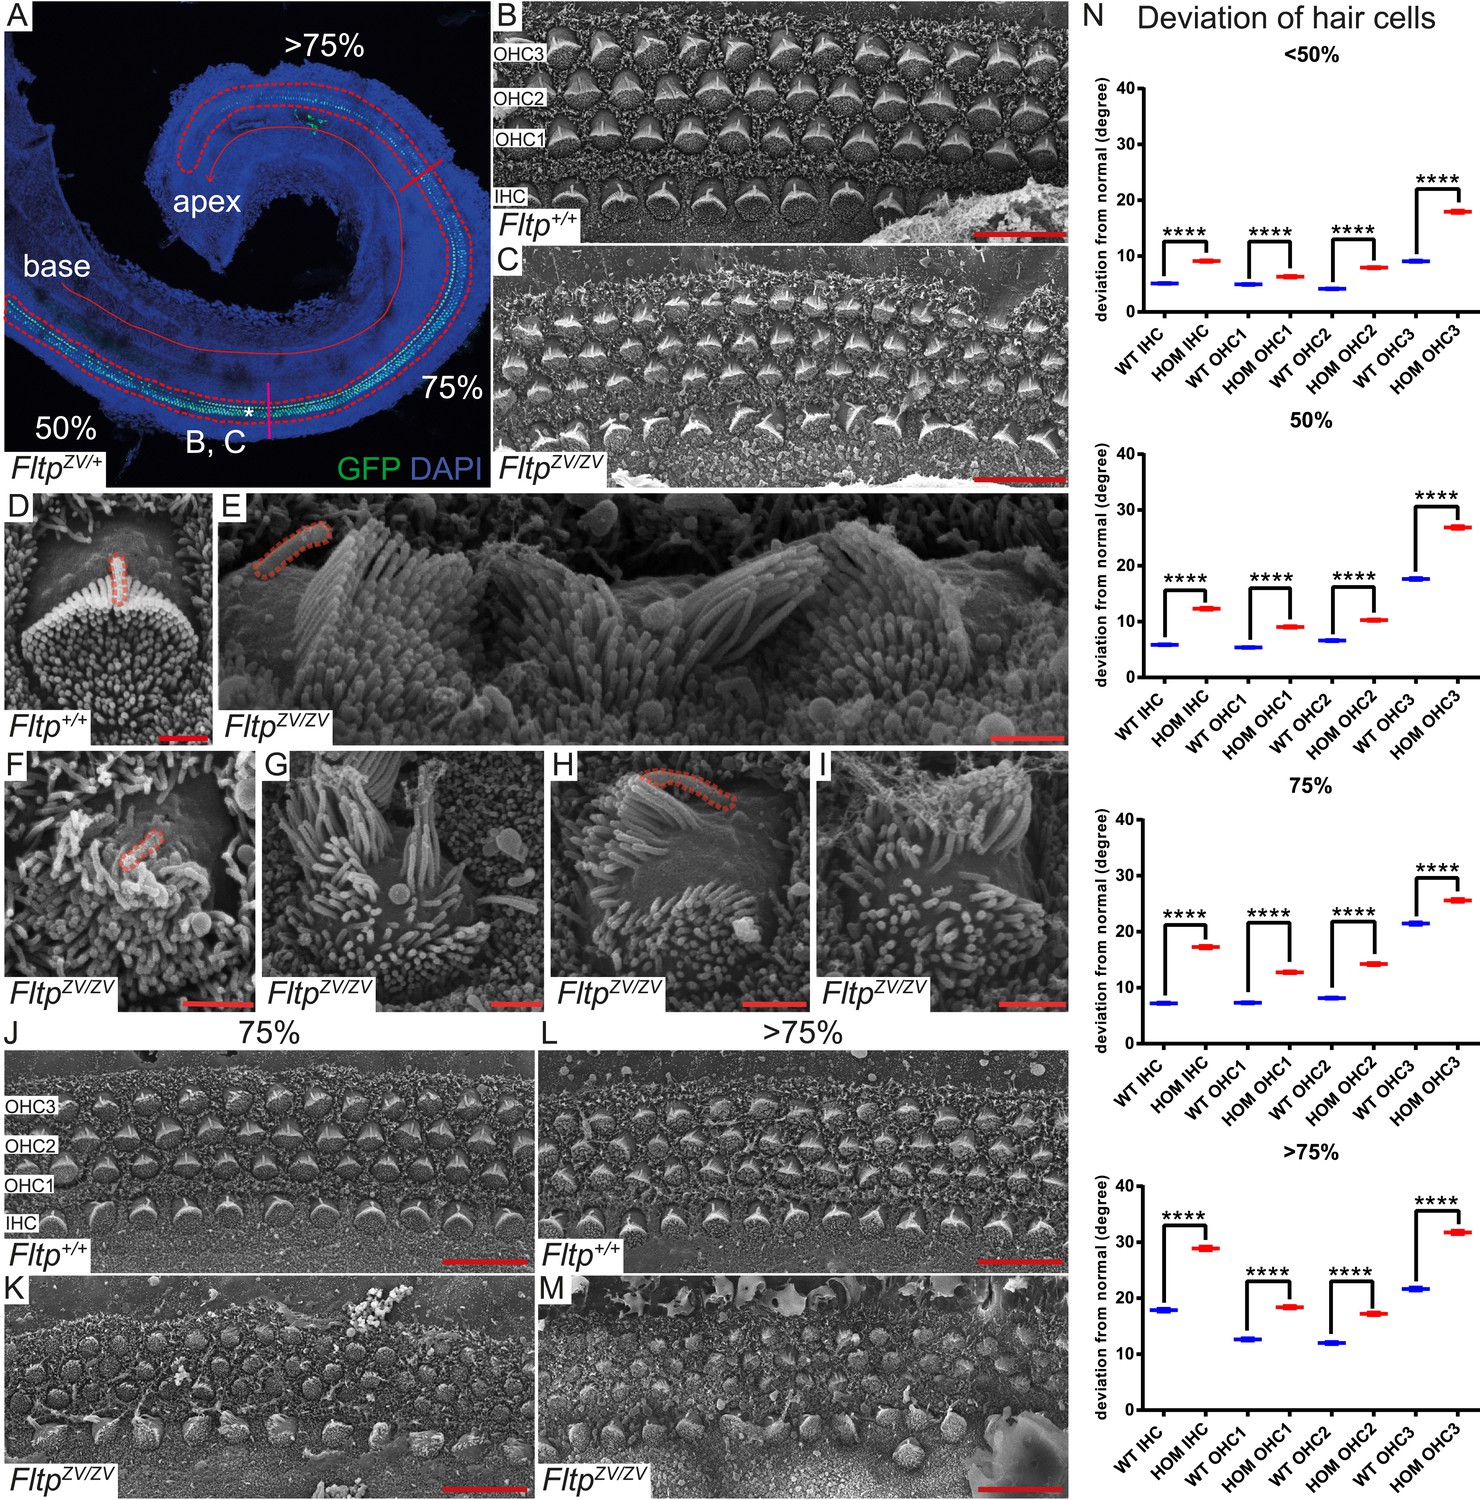
Fltp is required for kinocilium positioning and stereocilia bundle formation.
(A) Whole-mount LSM of an FltpZV/+ organ of Corti (OC) showing its different regions. Fltp reporter expression is restricted to all sensory HCs (IHC and OHC) of the OC (red dashed line). (B–M) Whole-mount SEM pictures of an E18.5 OC. (B and C) Fltp+/+ (WT) HCs at 50% of the OC length are perfectly polarized (B) whereas FltpZV/ZV (HOM) HCs show orientational defects (C). (D–I) Enlargements of HCs reveal perfect polarized kinocilia as well as highly ordered stereocilia in WT (D). HOM cells are misaligned and show split stereocilia bundles (E, G–I), general bundle morphology defects (E–I), as well as detached kinocilia (E). Polarity and stereocilia bundles disruption increases in HOM hair cells from 75% (K) to >75% (M) of OC length compared to WT cells (J and L). (N) Deviation of HCs from the polarity axis for WT and HOM animals significantly differs in all OC regions (<50%, 50%, 75%, >75%). Quantification of HC rotation was performed by measuring the angle from the normal tissue polarity (measured by the medial to distal alignment of the HC rows) to the middle of the stereocilia bundle. In total we examined n = 4 (219 HCs) of WT and n = 7 (426) of HOM animals. Statistical analysis uses circular statistics (****p < 0.0001). Error bars show the standard deviation. Kinocilia are marked by the red dashed lines, nuclei by DAPI, and nuclei of Fltp reporter expressing cells by GFP. Abbreviations: inner hair cell (IHC), outer hair cell (OHC1-3). Scale bars; 10 µm (B and C), 1 µm (D–I).
Figure 6
Fltp is a potential downstream mediator of PCP signaling.
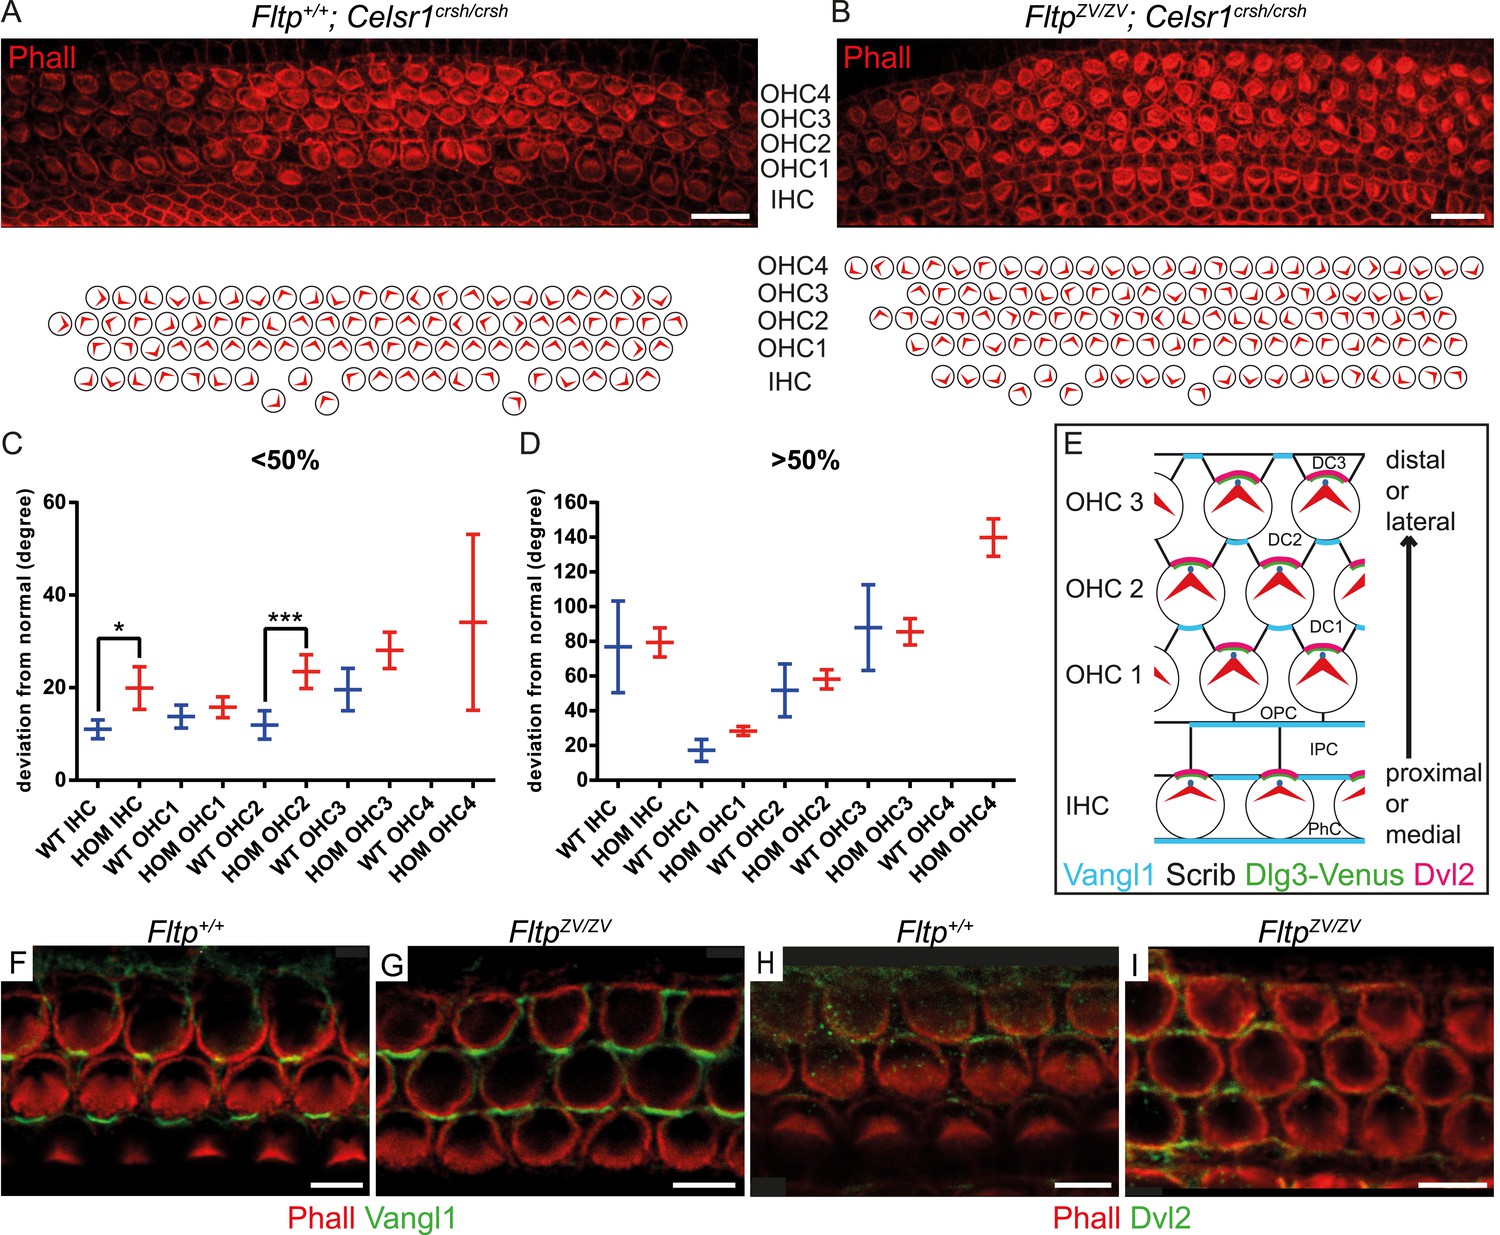
(A–B) LSM of an E18.5 Fltp+/+; Celsr1crsh/crsh (WT) organ of Corti (OC) (A) revealed rotated outer (OHC) and inner hair cells (IHC). FltpZV/ZV; Celsr1crsh/crsh (HOM) OC (B) shows more severely rotated IHCs and OHCs as well as an additional OHC row in comparison to (A). (C and D) Hair cells of HOM (red) animals show a more pronounced PCP phenotype compared to WT (blue) in the region <50% and >50% of the OC (for cochlea region nomenclature and quantification method see Figure 5). In total we analyzed n = 1 (130 cells) at <50%, n = 1 (90) at >50% for WT, n = 5 (298) at <50%, n = 5 (743) at >50% for HOM. Statistical analysis uses a Kruskal–Wallis test (*p = 0.0375; ***p = 0.0003). Error bars show the 95% confidence interval of the mean. (E) Model illustrating PCP molecule localization in IE hair cells. (F–I) Whole-mount IE (E18.5) LSM of 3 OHC rows revealed Vangl1 localization at the lateral side of supporting cells in Fltp+/+ (F) and FltpZV/ZV (G) animals and Dvl2 localization at the lateral side of IE hair cells in Fltp+/+ (H) and FltpZV/ZV (I) animals indicating that core PCP protein localization is not disrupted. The actin network and stereocilia are marked by Phalloidin (Phall) and core PCP proteins by Vangl1 and Dvl2. Abbreviations: inner phalangeal cells (PhC), inner pillar cells (IPC), outer pillar cells (OPC), Deiters' cells (DC1-3). Scale bars; 10 µm (A and B), 5 µm (F–I).
Figure 7
Fltp is located at the interface of apical actin and Dlg3 in IE hair cells.
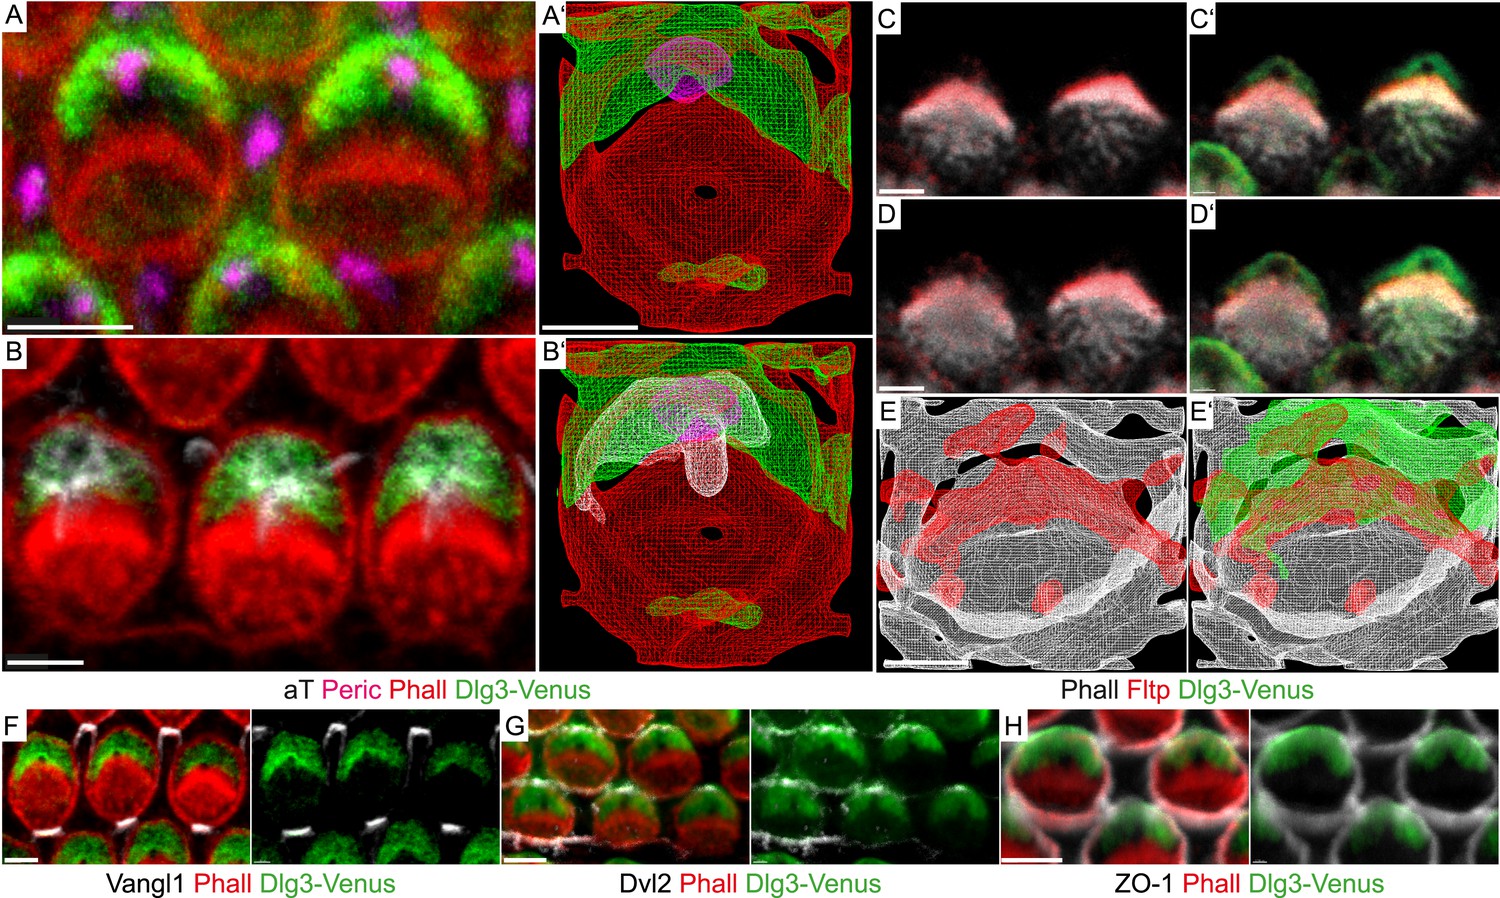
(A, B, C–D′, F–H) Single section LSM of outer HCs of an Fltp+/+; Dlg3-Venus animal at E18.5 reveals that Dlg3-Venus is located at the lateral membrane and at the medial membrane (or the lateral membrane of the supporting cell) of IE HCs (A and B). Fltp is localized lateral to the cuticular plate (CP) and the stereocilia bundles (SC) (C and D). Dlg3-Venus is located in a lateral crescent overlapping with Fltp localization (C′ and D′). The unstained area marks the region of the BB (C′ and D′). Dlg3-Venus is co-localized with Dvl2 (G) at the most lateral membrane directly opposite of Vangl1 (F) and with ZO-1 at the apical membrane (H). (A′, B′, E, E′) IMARIS wireframe animation of a Dlg3-Venus IE HC showing Dlg3-Venus co-localization with the BB, the kinocilium, and actin (A′ and B′) and a Fltp+/+; Dlg3-Venus IE HC showing Fltp, Dlg3-Venus, and Phalloidin co-localization (E and E′). The actin network, the CP, and the SC are marked by Phalloidin (Phall), Fltp protein by Fltp116-1 (Fltp), the kinocilium by acetylated-Tubulin (aT), the BB by pericentrin (Peric), the apical cell membrane by ZO-1, core PCP proteins by Vangl1 and Dvl2, and Dlg3-Venus fusion protein by GFP. Scale bars; 2 µm (A–E′), 3 µm (F–H).
Figure 8 with 1 supplement
Loss of Fltp or Dlg3 leads to BB mispositioning in IE hair cells.
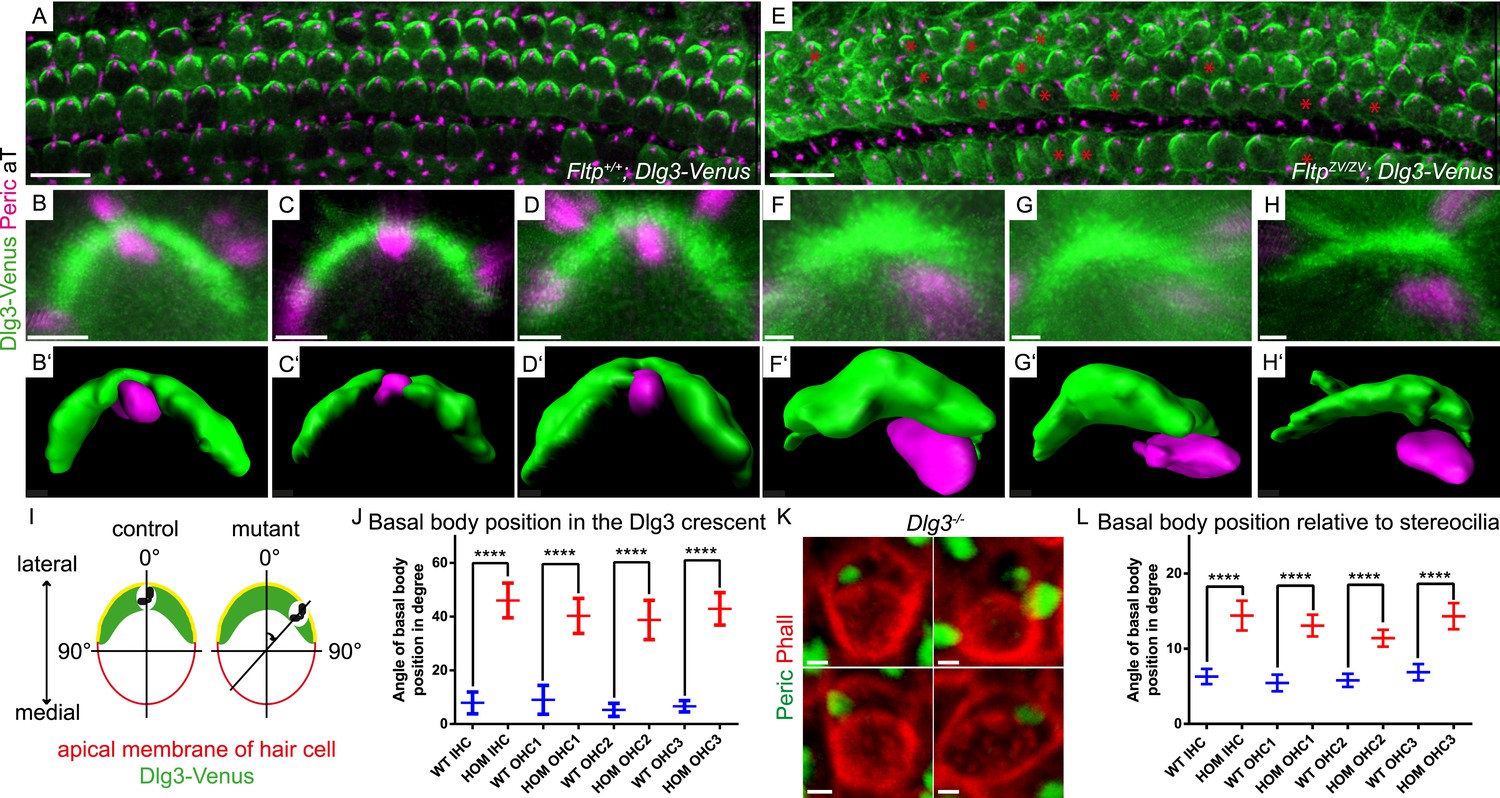
(A–D) LSM of Fltp+/+; Dlg3-Venus (WT) IE HCs at E18.5 reveals BBs in the middle of the lateral Dlg3-Venus crescent. (B′–D′) IMARIS surface rendering pictures of WT HCs. (E–H) LSM of FltpZV/ZV; Dlg3-Venus (HOM) IE HCs at E18.5. BBs are located at the edge of the lateral Dlg3-Venus crescent. The crescent itself often shows defective localization. The red asterisk marks some affected cells. (F′–H′) IMARIS surface rendering pictures of HOM HCs. For quantification see Figure 8—figure supplement 1A. (I) For BB mispositioning analyses the angle between the middle of the Dlg3-Venus crescent and the BB location was measured. (J) BB position in affected HCs of HOM animals significantly differs from the position in the WT. In total we analyzed n = 2 (73 cells) for WT and n = 2 (119) for HOM. (K) LSM of Dlg3−/− (Dlg3tm1Grnt) IE HCs reveals mislocalized BBs and rotated hair cells. For quantification Figure 8—figure supplement 1B,C. (L) Analysis of BB mispositioning was performed as described in (I). BB position in affected HCs of Dlg3−/− (HOM) animals significantly differs from the Dlg3+/+ (WT) position. In total we analyzed n = 7 (470 cells) for WT and n = 13 (804) for HOM. Statistical analysis uses an one-way ANOVA (J) or a Kruskal–Wallis test (L) (****p < 0.0001). Error bars show the 95% confidence interval of the mean. The actin network and stereocilia are marked by Phalloidin (Phall), BBs by pericentrin (Peric), cilia by acetylated-Tubulin (aT), and Dlg3-Venus fusion protein by GFP. Abbreviation: inner hair cell (IHC), outer hair cell (OHC 1-3). Scale bars; 10 µm (A and E), 1 µm (B–D′, F–H′, K).
Figure 8—figure supplement 1
BB mispositioning in FltpZV; Dlg3-Venus and Dlg3 animals.
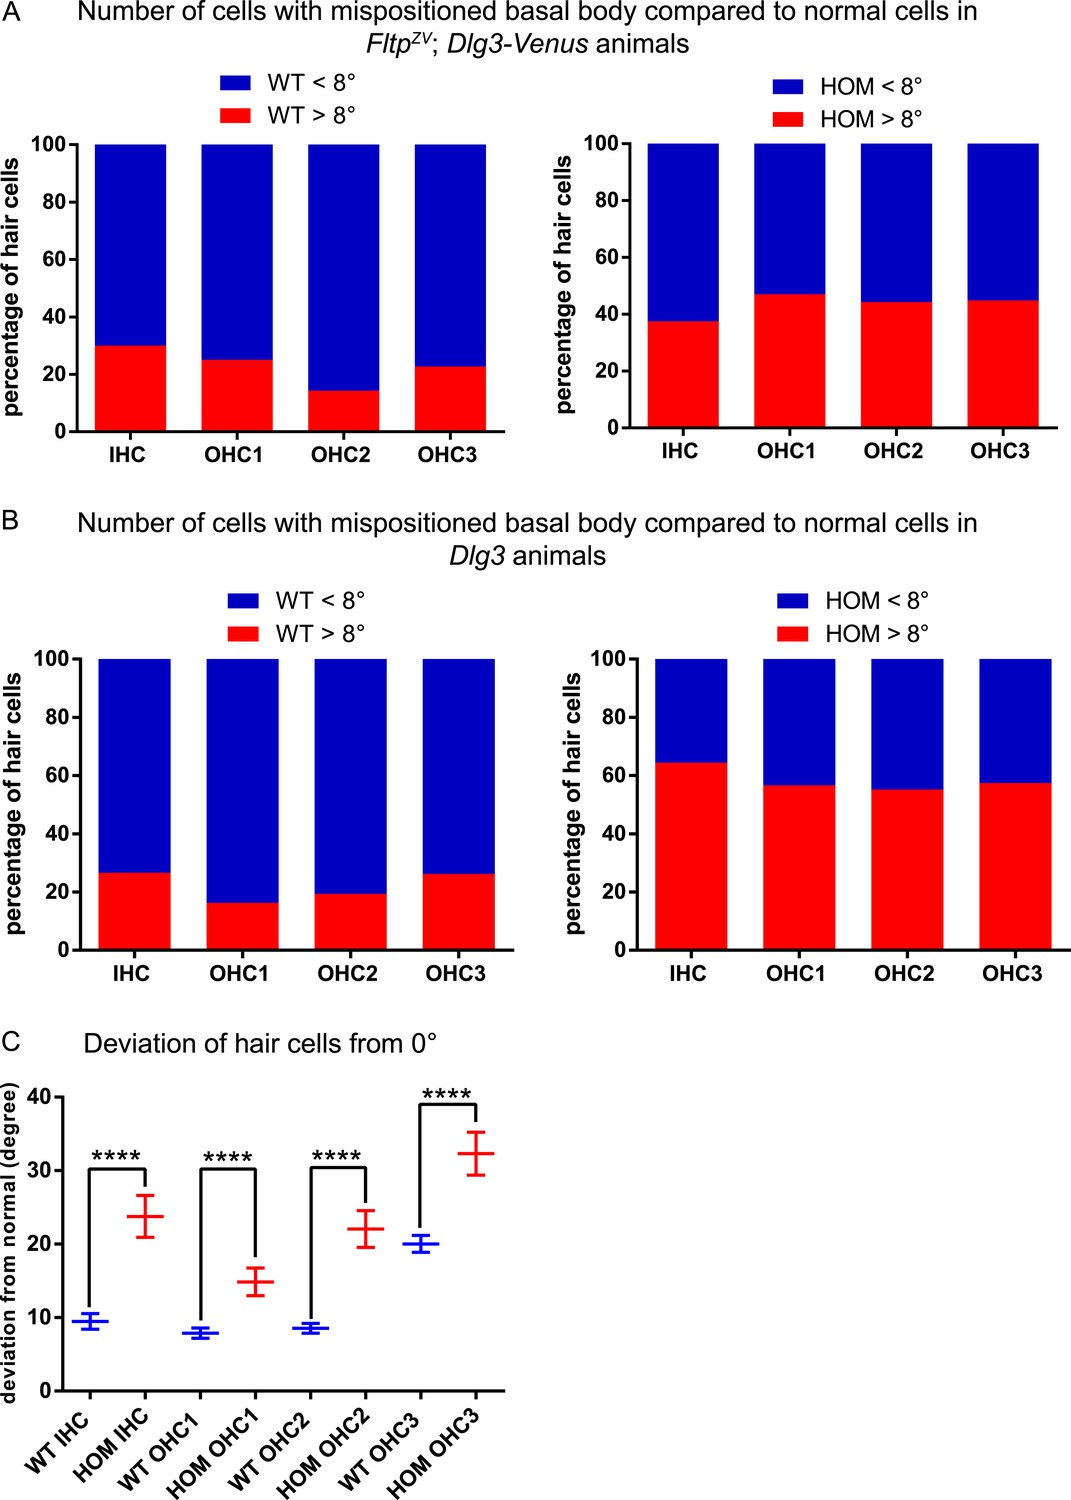
(A) In FltpZV/ZV; Dlg3-Venus (HOM) IE significantly more hair cells across all rows show BB mispositioning over 8° (red) compared to controls Fltp+/+; Dlg3-Venus (WT). (B) The same analysis as in (A) only for Dlg3−/− (HOM). HOM animals show higher number of cells with mispositioned BBs compared to Dlg3+/+ (WT) animals. (C) The deviation of hair cells from the polarity axis shows a clear PCP defect in Dlg3−/− (HOM) animals (WT = blue, HOM = red). In total we analyzed n = 4 (1769 cells) for WT and n = 8 (583) for HOM. Statistical analysis uses a Kruskal–Wallis test (****p < 0.0001). Abbreviation: inner hair cell (IHC), outer hair cell (OHC 1-3).
Figure 9
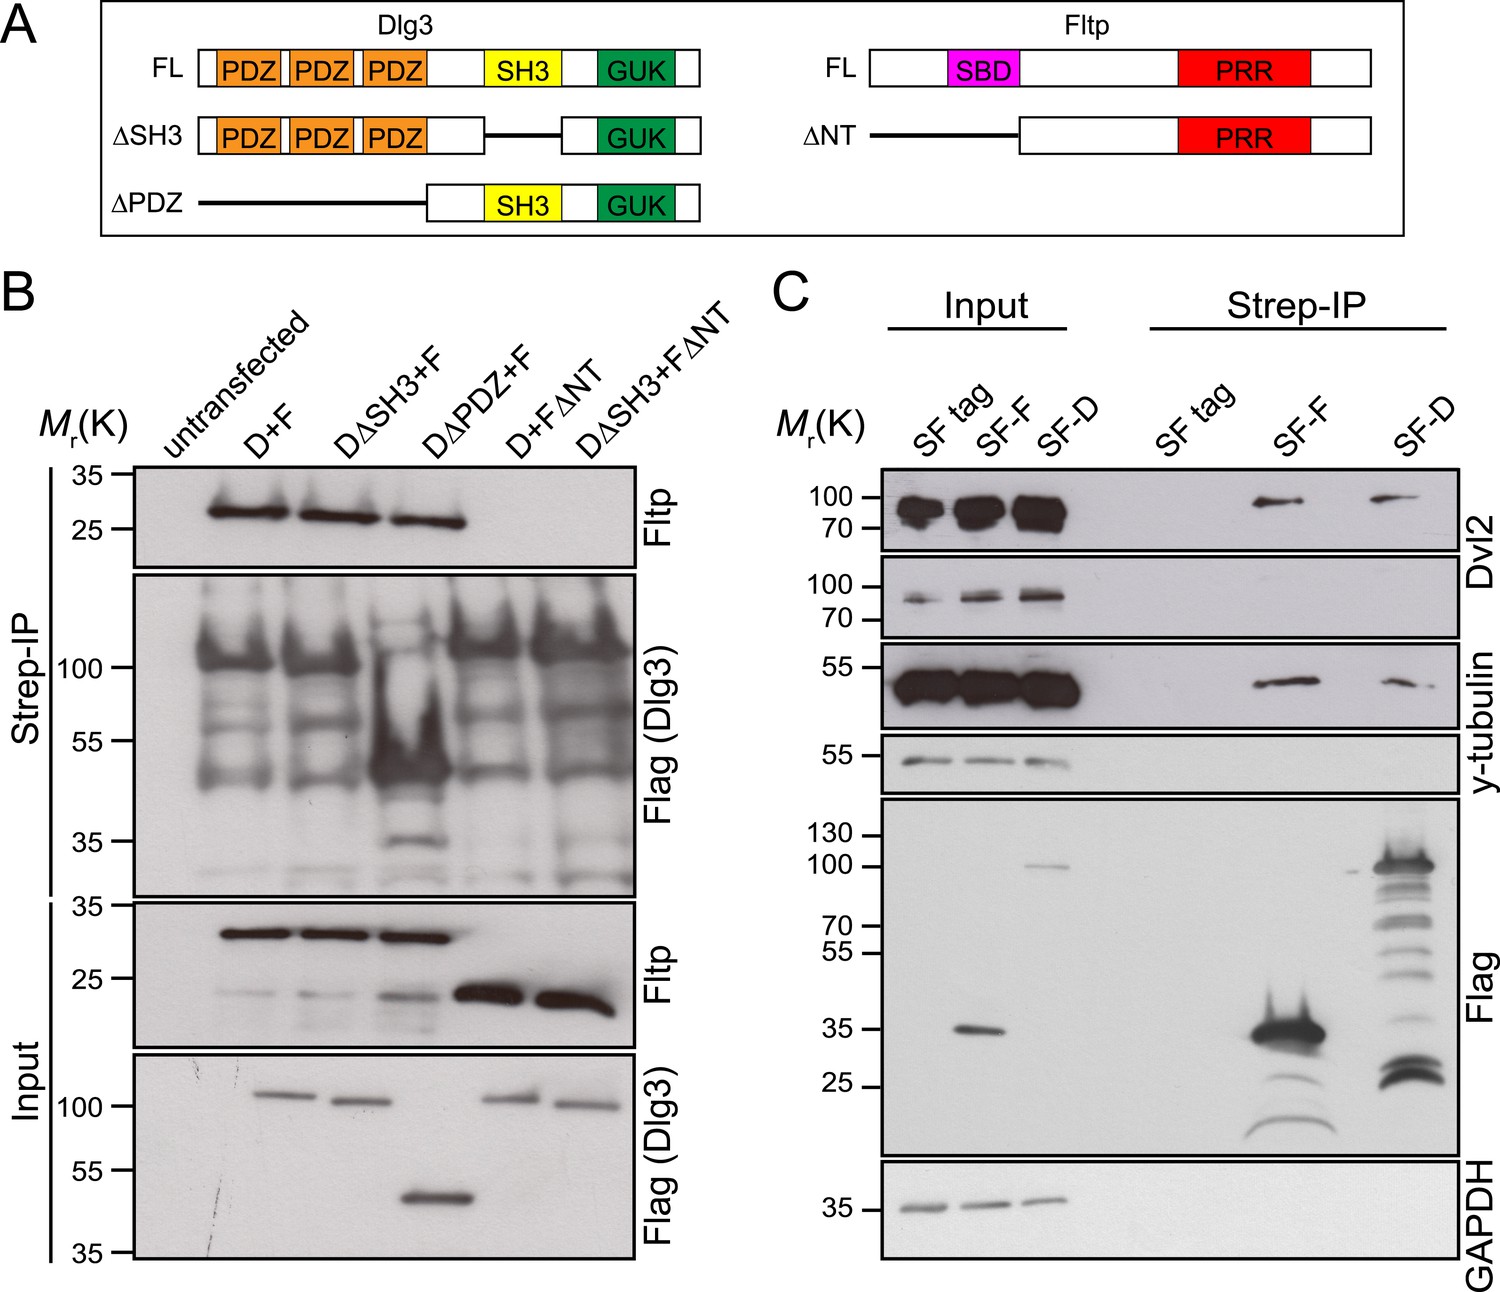
Fltp interacts with proteins associated with the TJ complex (Dlg3), the BB (γ-Tubulin) and with the core PCP protein Dvl2.
(A) Dlg3 and Fltp constructs used for interaction domain mapping. (B) N-terminus of Fltp is essential for interaction with Dlg3. HEK293T cells were transfected with SF Dlg3 variants and with Fltp-myc variants. SF-tagged Dlg3 was immunoprecipitated using Streptavidin beads (Strep-IP). Full-length Fltp-myc was detected in the Strep-IP in the presence of full-length SF-Dlg3, SF-Dlg3ΔSH3, and SF-Dlg3ΔPDZ. FΔNT cannot be co-immunoprecipitated with SF-Dlg3. (C) Fltp and Dlg3 are found in a complex together with Dvl2 and γ-Tubulin. HEK293T cells were transfected with SF Dlg3 and SF Fltp. In a Strep-IP for Fltp and Dlg3, endogenous Dvl2 and γ-Tubulin were co-immunoprecipitated. Abbreviations: D: Dlg3; F: Fltp; SBD: SH3 binding domain; PRR: proline rich repeat.
Author response image 1

Author response image 2
Author response image 3
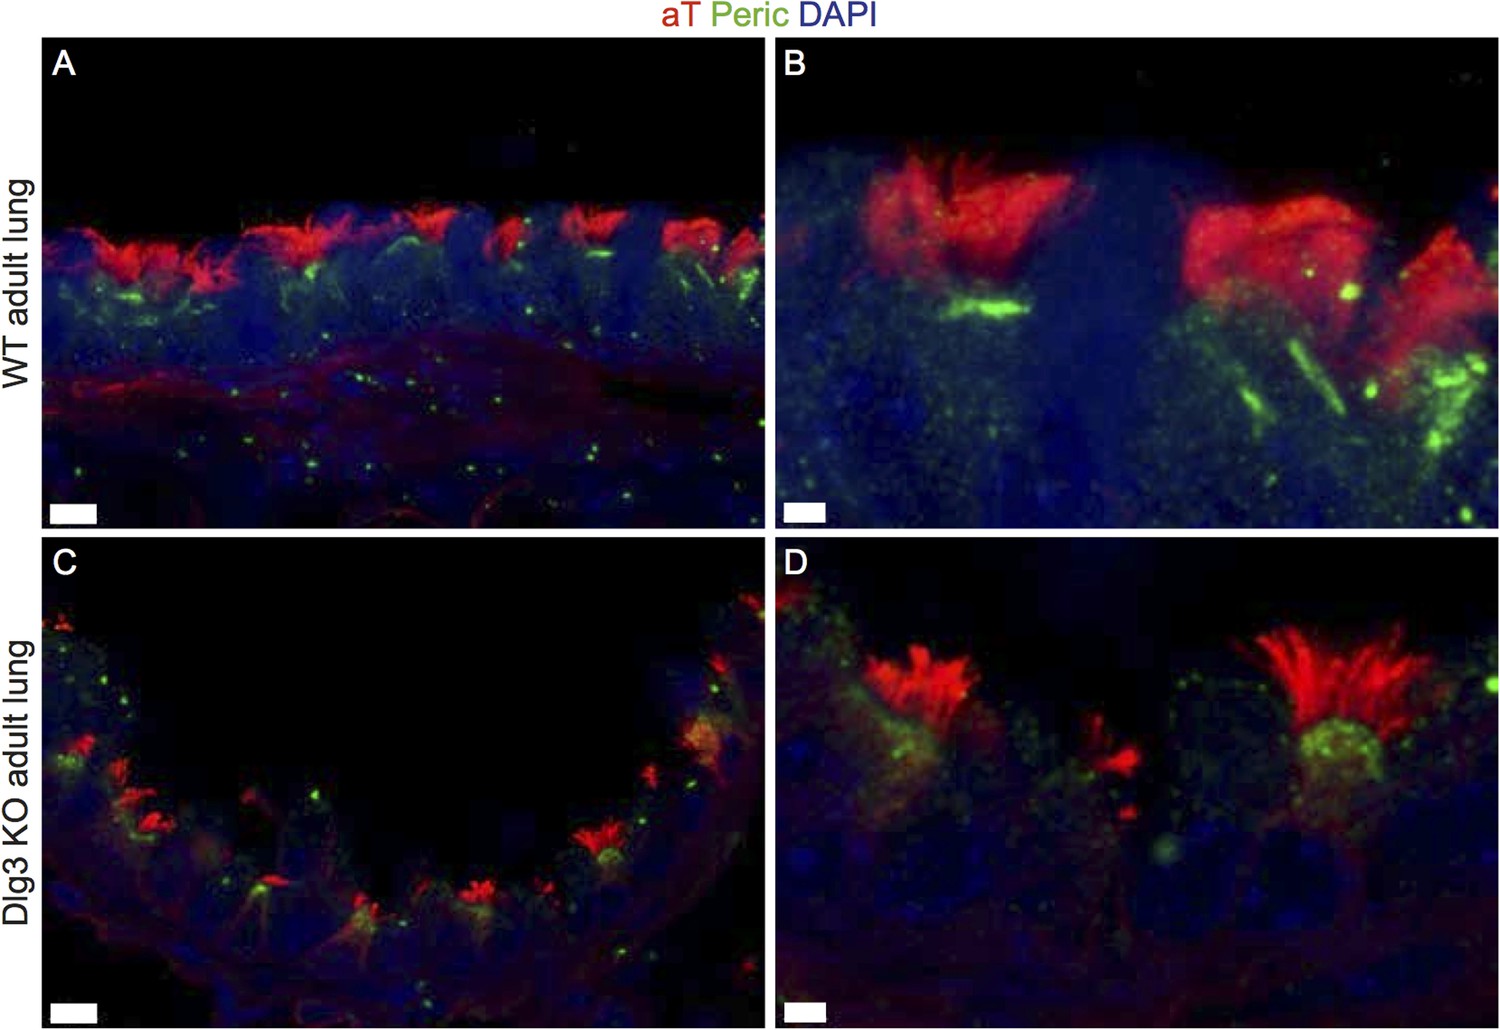
(A-B) Show cryosections of a WT lung stained with acetylated tubulin (red) and pericentrin (green) and DAPI (blue). BBs are docked and cilia formed. (C-D) Cryosections of a Dlg3 KO animal show docked BBs and cilia. Scale bars: (A,C) 7μm, (B,D) 2μm.
Author response image 4
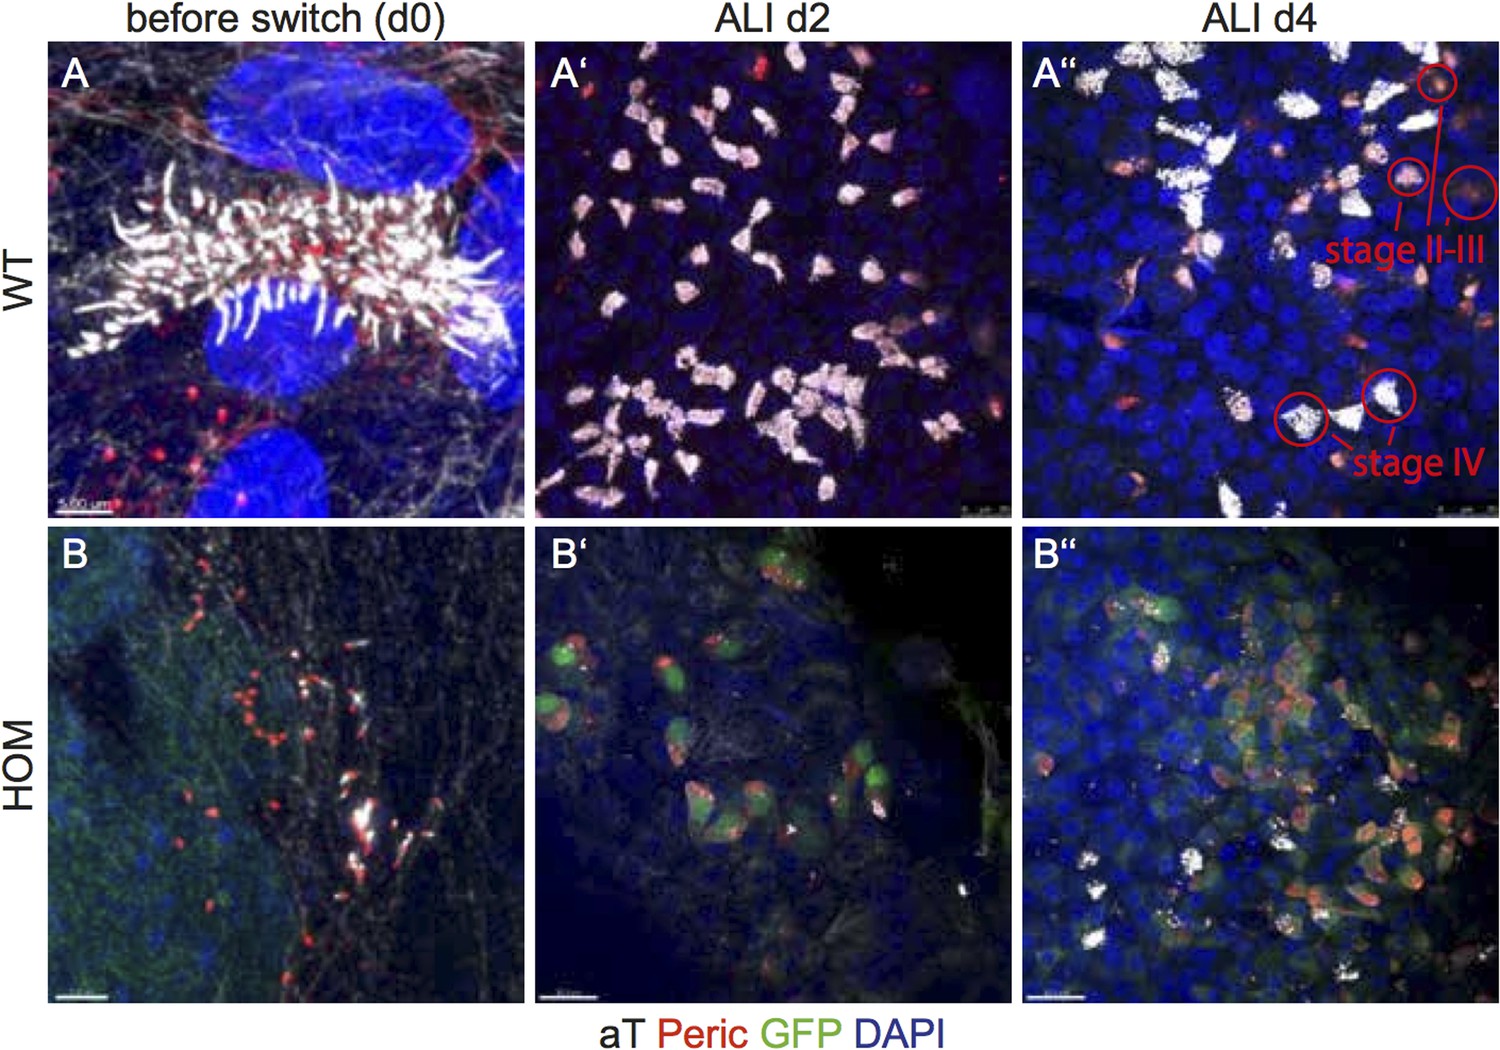
(A-A’’) WT cultures at day 0, ALI day 2 and ALI day 4. In day 0 cultures MCCs are already present (A). Day 2 and day 4 ALIs show mostly 100% docked BBs (red, pericentrin; white, cilia) (A’,A’’). (B-B’’) In HOM cultures at day 0 some cells are already multiciliated but not to the same extend as WT cultures. At day 2 most stage II-III cells do not have docked their BBs yet. Significantly more BBs are docked in WT cultures (A’-A’’) than in HOM cultures (B’-B’’). Light white staining marks the intracellular MT network. Only bright white staining marks cilia.Scale bars; (A,B) 5μm; (A’,A’’) 25μm; (B’,B’’) 30μm.
Download links
A two-part list of links to download the article, or parts of the article, in various formats.
Downloads (link to download the article as PDF)
Open citations (links to open the citations from this article in various online reference manager services)
Cite this article (links to download the citations from this article in formats compatible with various reference manager tools)
Flattop regulates basal body docking and positioning in mono- and multiciliated cells
eLife 3:e03842.
https://doi.org/10.7554/eLife.03842


