Ancestral resurrection reveals evolutionary mechanisms of kinase plasticity
- University of California, Berkeley, United States
- University of California, San Francisco, United States
- Yale University School of Medicine, United States
Figures
Figure 1 with 2 supplements

The IME2/RCK/LF4 superfamily of kinases has variable specificity at the +1 position.
(A) Positional scanning peptide libraries were used to profile the specificity of various kinases: left, M. musculus MOK; middle, N. gruberi LF4; right, S. cerevisiae Ime2. Yellow indicates preference for a given amino acid while blue indicates counter selection. A schematic of the peptide library is shown above (see text for details). Data show the average of two replicates for each kinase. Raw data for these kinases and four other superfamily members are shown in Figure 1—figure supplement 1. Data shown here exclude peptides containing fixed Ser and Thr residues that typically produce an artificially increased signal due to the presence of an additional phosphoacceptor residue; heat maps of full peptide array results for all extant kinases are shown in Figure 1—figure supplement 2. (B) Michaelis–Menten plots for individual 8-mer IME2/RCK/LF4 consensus peptides (schematic, below) in which the +1 position is varied to be either proline (red) or arginine (blue). (C) Positional scanning peptide library data showing the average +1 preference of 8 kinases from the IME2/RCK/LF4 subgroup of CMGC kinases.
Figure 1—figure supplement 1
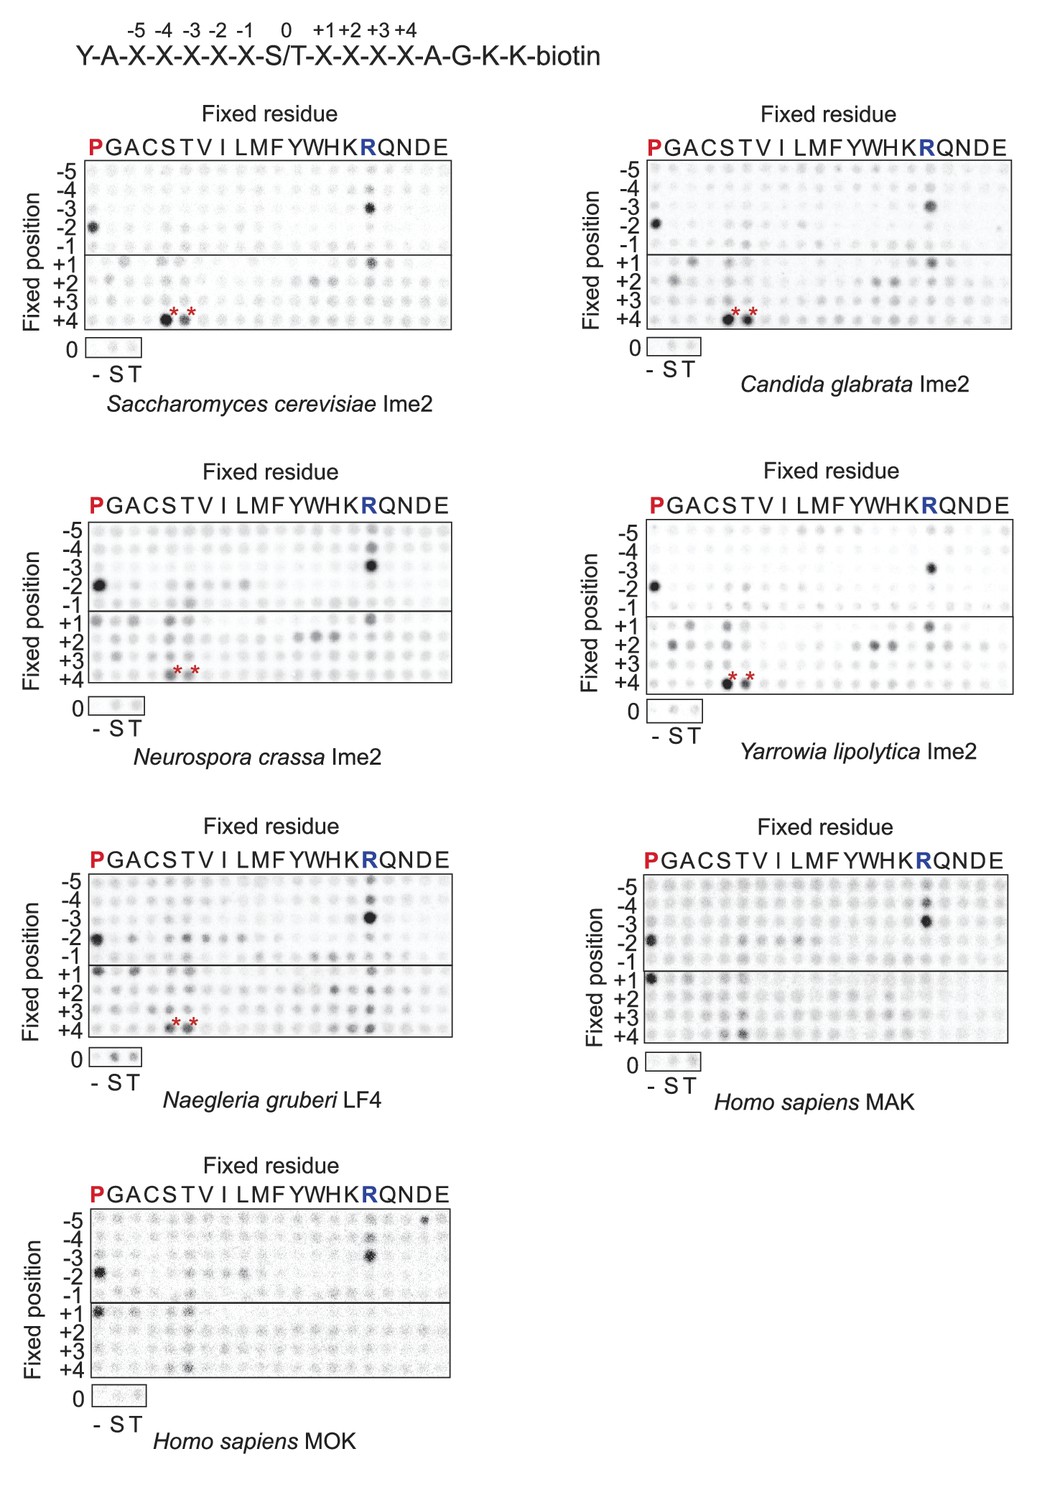
Raw data for positional scanning peptide library arrays.
A set of 182 peptides with the general sequence shown at bottom, but with the indicated position in the array fixed to the indicated amino acid residue, were phosphorylated with the indicated kinase with radiolabeled ATP. Aliquots of each reaction were transferred to a streptavidin-coated membrane, which was washed and dried for autoradiography. Spot intensities reflect the extent of radiolabel incorporation into the indicated peptide mixture. Note: Peptide mixtures having fixed Ser and Thr residues generally give spuriously higher signals than other components of the library due to the presence of an additional phosphoacceptor site. This artifact is particularly evident at the +4 position for most kinases (red asterisks) as an artifact that arises from the nature of the linker sequence that follows the +4 position. This linker contains two residues (+1 Ala and +2 Gly relative to the +4 S/T) that are fixed to preferred amino acids, and so the +4 S/T gets heavily phosphorylated. We have previously verified that there is actually no preference for S/T at the +4 position (Holt et al., 2007).
Figure 1—figure supplement 2
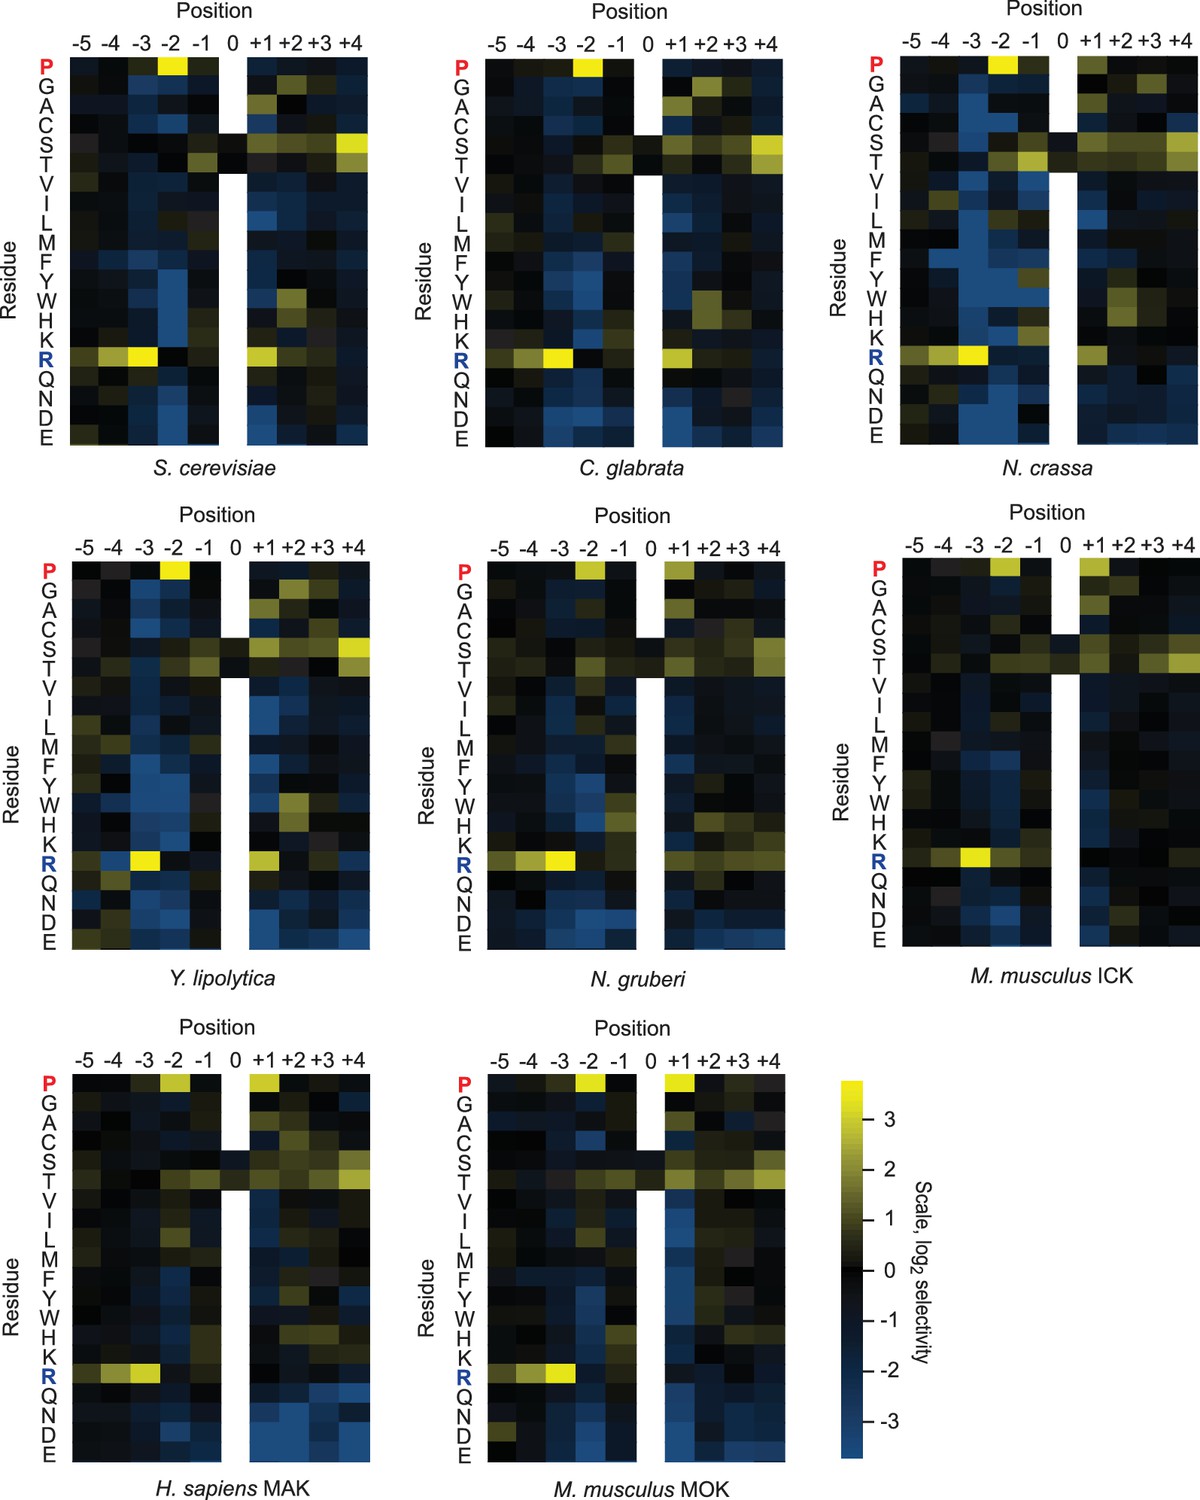
Quantified positional scanning peptide library data for all extant kinases analyzed.
Spot intensities shown in Figure 1—figure supplement 1 and a replicate run of the same kinase were quantified (using BioRad QuantityOne software) and normalized so that the average signal in a given row was equal to unity. Data from the two replicates were averaged, log2 transformed, and used to generate heat maps in Microsoft Excel. Positively selected residues are shown in yellow and negatively selected residues are shown in blue according to the scale at bottom right. Data for ICK were previously published (Fu et al., 2006) and are shown here in heat map form for comparison.
Figure 2 with 3 supplements
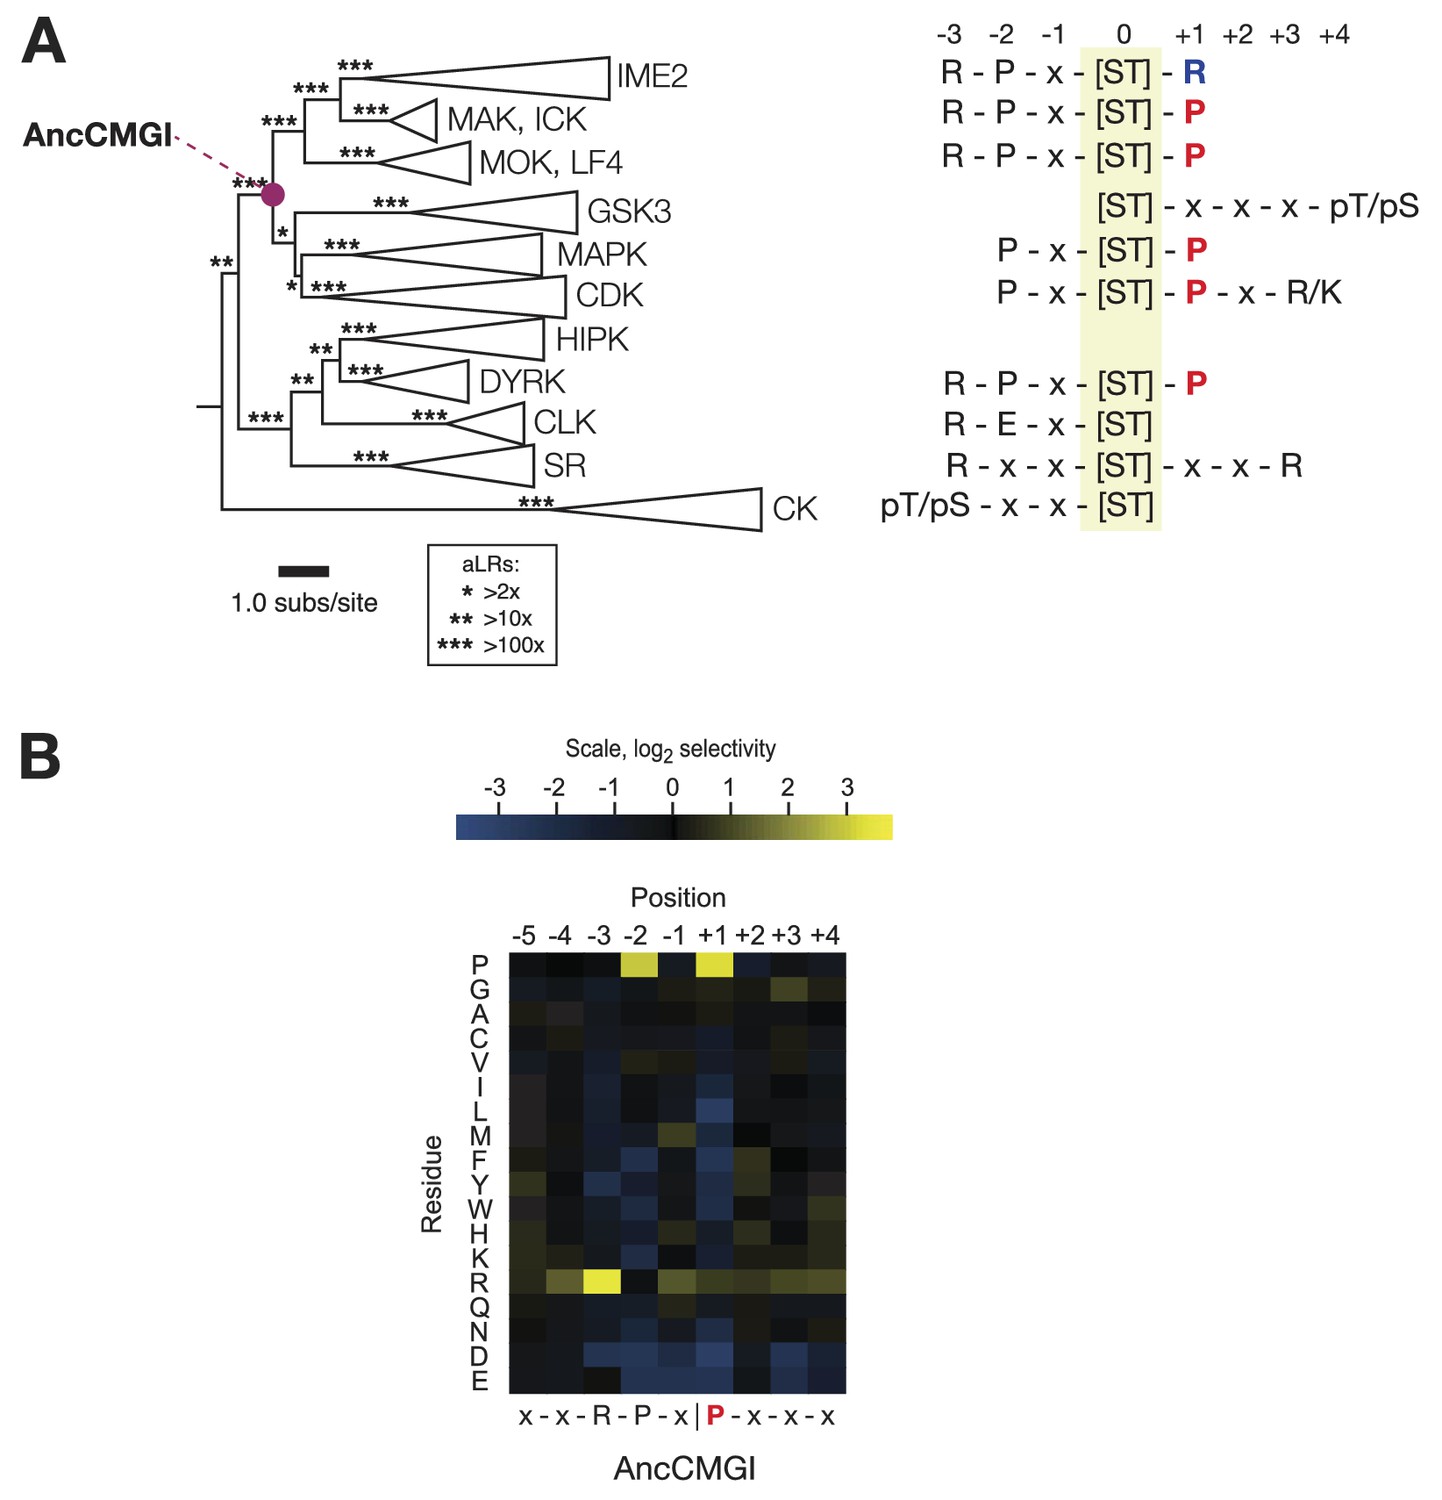
The common ancestor of CMGI kinases had a slight preference for proline at the +1 position of the substrate peptide.
(A) Summary of current knowledge about CMGC group kinase specificity in the context of the maximum likelihood phylogeny of protein sequences. Major groups, such as IME2, MAK, ICK, etc, have been collapsed for simplicity. Branch lengths express the number of amino acid substitutions per protein sequence site. Branch support values are approximate likelihood ratios (aLRs), expressing the ratio of the likelihood of the maximum likelihood phylogeny to the next-best phylogeny lacking the indicated branch. For example, an aLR value of 10 indicates that the branch is 10 times more likely than the next-best phylogenetic hypothesis. The position of the common ancestor of CDK, MAPK, CDKL, GSK, and the IME2/LF4/RCK superfamily (AncCMGI), is indicated by a purple circle. (B) Position scanning peptide libraries were used to determine the primary specificity of the maximum likelihood resurrected AncCMGI kinase. Raw peptide data are shown in Figure 2—figure supplement 1. A complete repeat of the PSPL for a Bayesian sampled alternative reconstruction of AncCMGI (AncCMGI-B2) is shown in Figure 2—figure supplement 2. A structural model of AncCMGI is shown in Figure 2—figure supplement 3 in phylogenetic context along with structures and models for extant kinases that were derived from this ancestor.
Figure 2—figure supplement 1
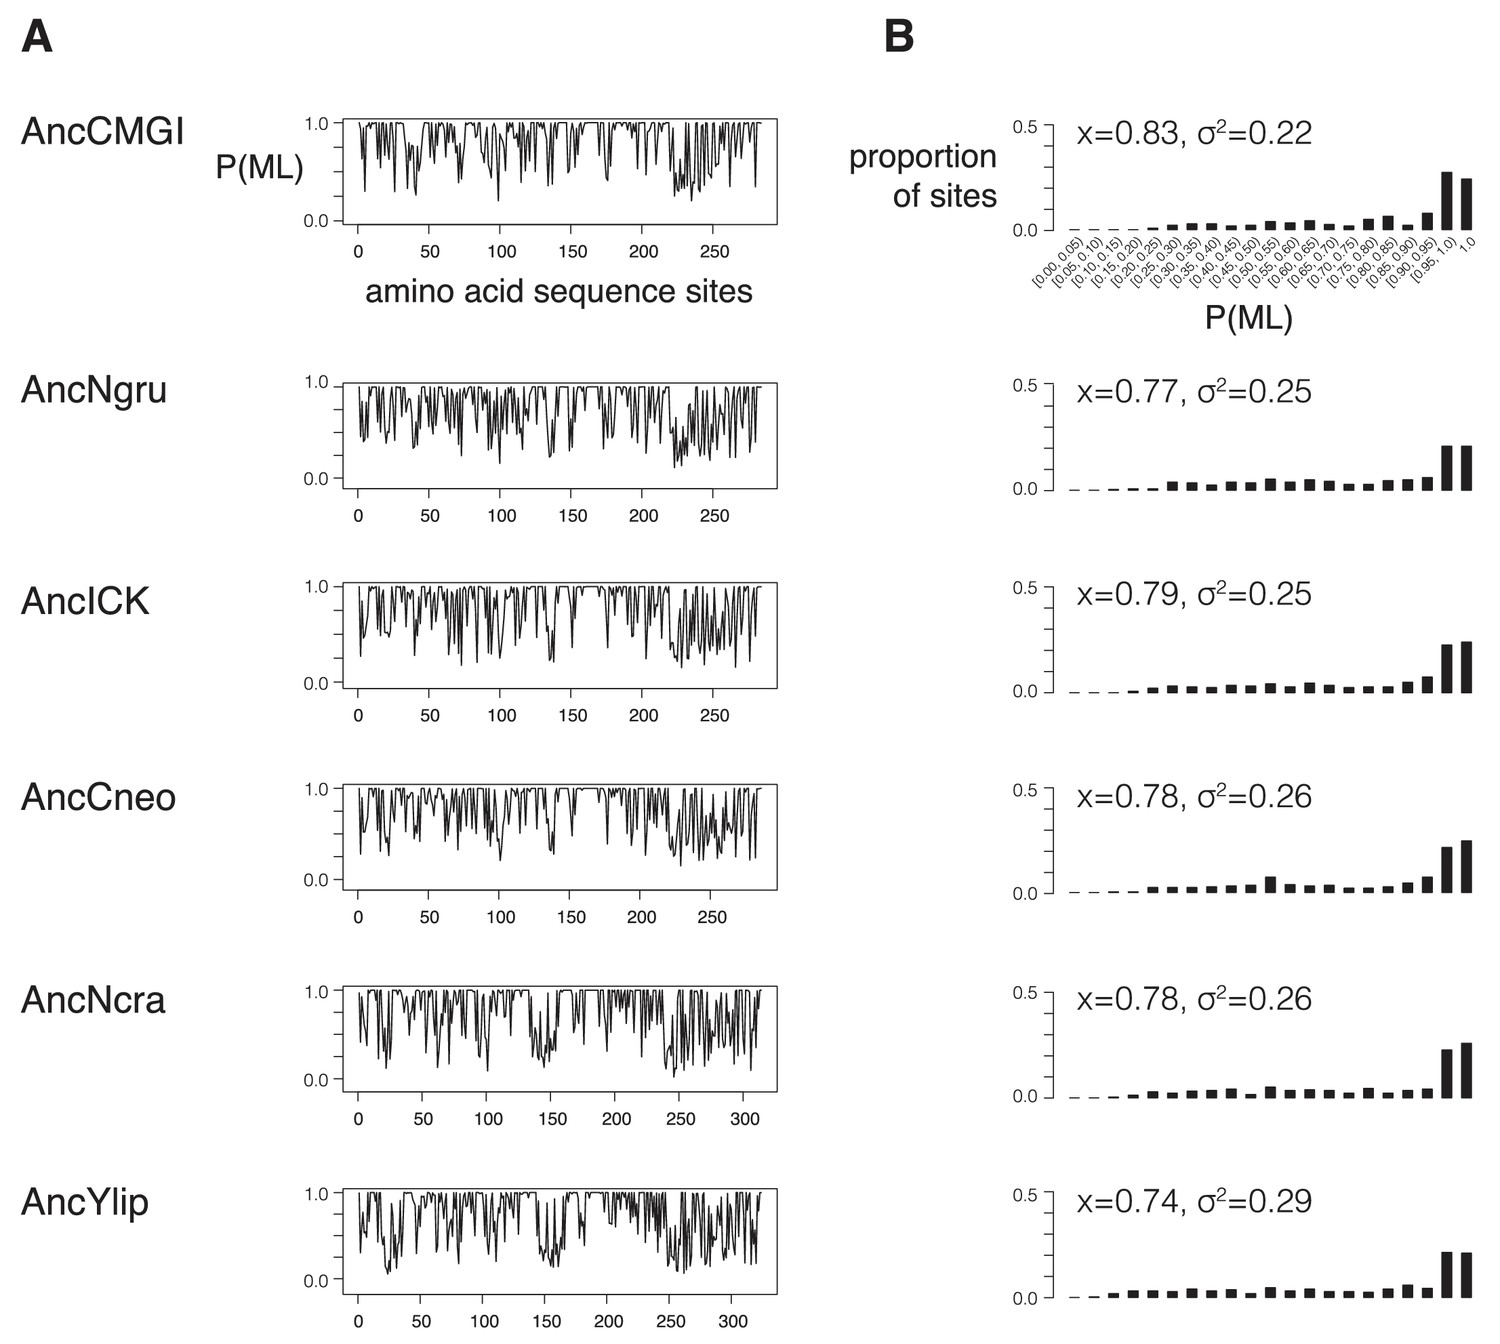
Support for reconstrutctions.
We characterized the support for each ancestor by binning their posterior probabilities of states into 5%-sized bins and counting the proportion of ancestral sites within each bin. (A) Posterior probability of each maximum likelihood amino acid (P(ML)) is shown as a function of position within the kinase primary sequence. Sites with lower support generally correspond to loop regions. (B) Histogram showing distribution of posterior probabilities of maximum likelihood amino acids. Mean (x) and standard deviation (σ2) values are indicated. Complete reconstruction data with complete probabilities at every position is available at http://www.phylobox.com/cmgc.10.2013/.
Figure 2—figure supplement 2
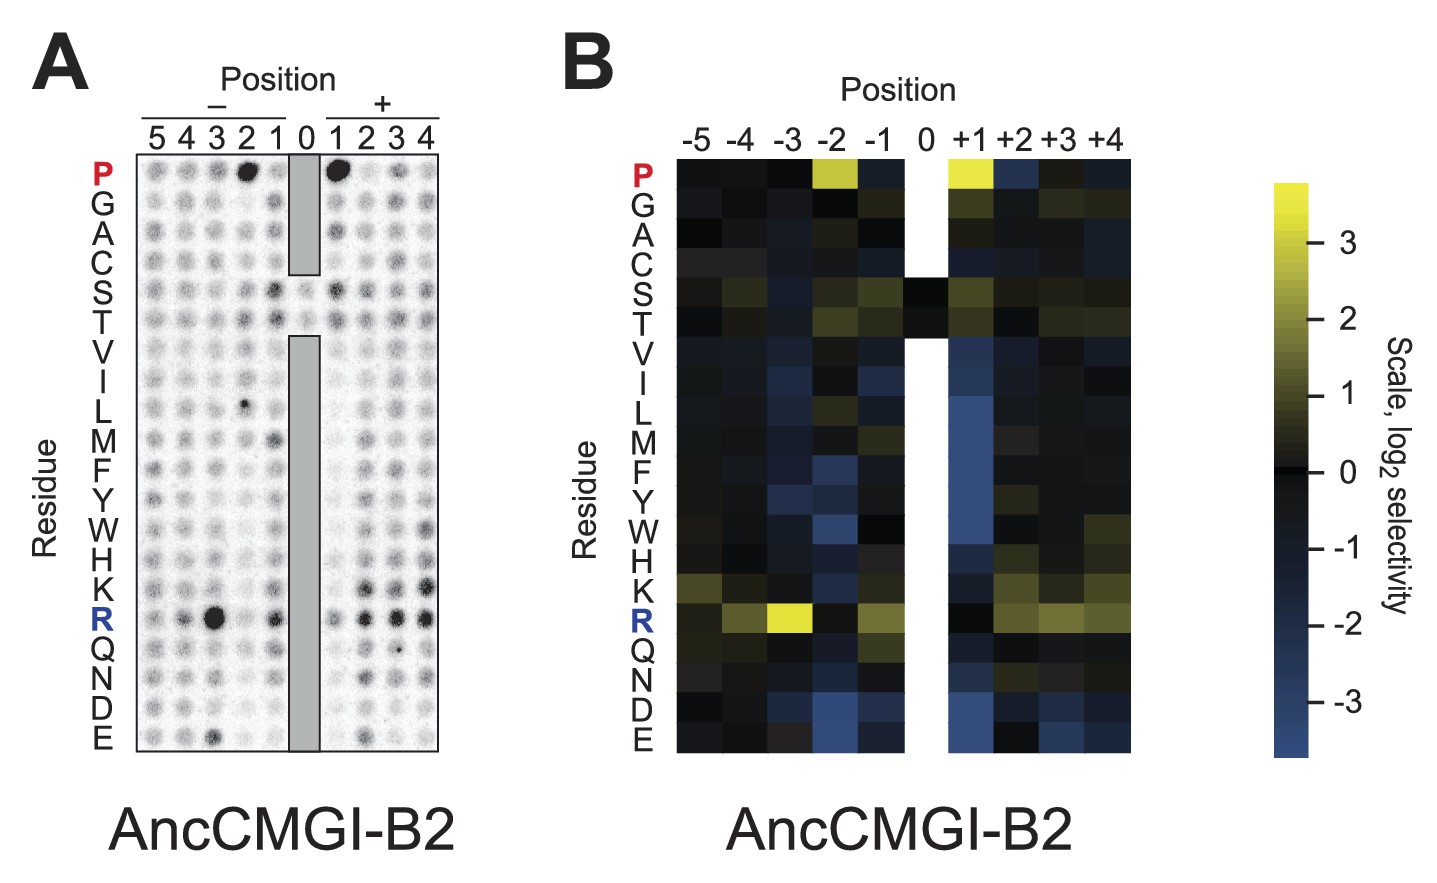
Raw data and selectivity values for a positional scanning peptide library array of an alternate reconstruction of AncCMGI.
(A) Raw PSPL result for an alternative reconstruction of AncCMGI. (B) Averaged quantified data from (A) and a replicate analysis with AncCMGI. Data were collected and quantified as in Figure 1—figure supplements 1 and 2.
Figure 2—figure supplement 3

Structural evolution in the CMGC kinase group.
A model of AncCMGI was generated from the CDK2 structure using Phyre2. This structure is compared to the structures of extant CMGC kinases in their phylogenetic context. The core structure present in AncCMGI is colored grey. Additional domains in modern kinases are indicated in various colors: e.g. C-terminal extension of CDKL (cyan); C-terminal extension of MAPK (red); Cyclin (beige).
Figure 3 with 2 supplements
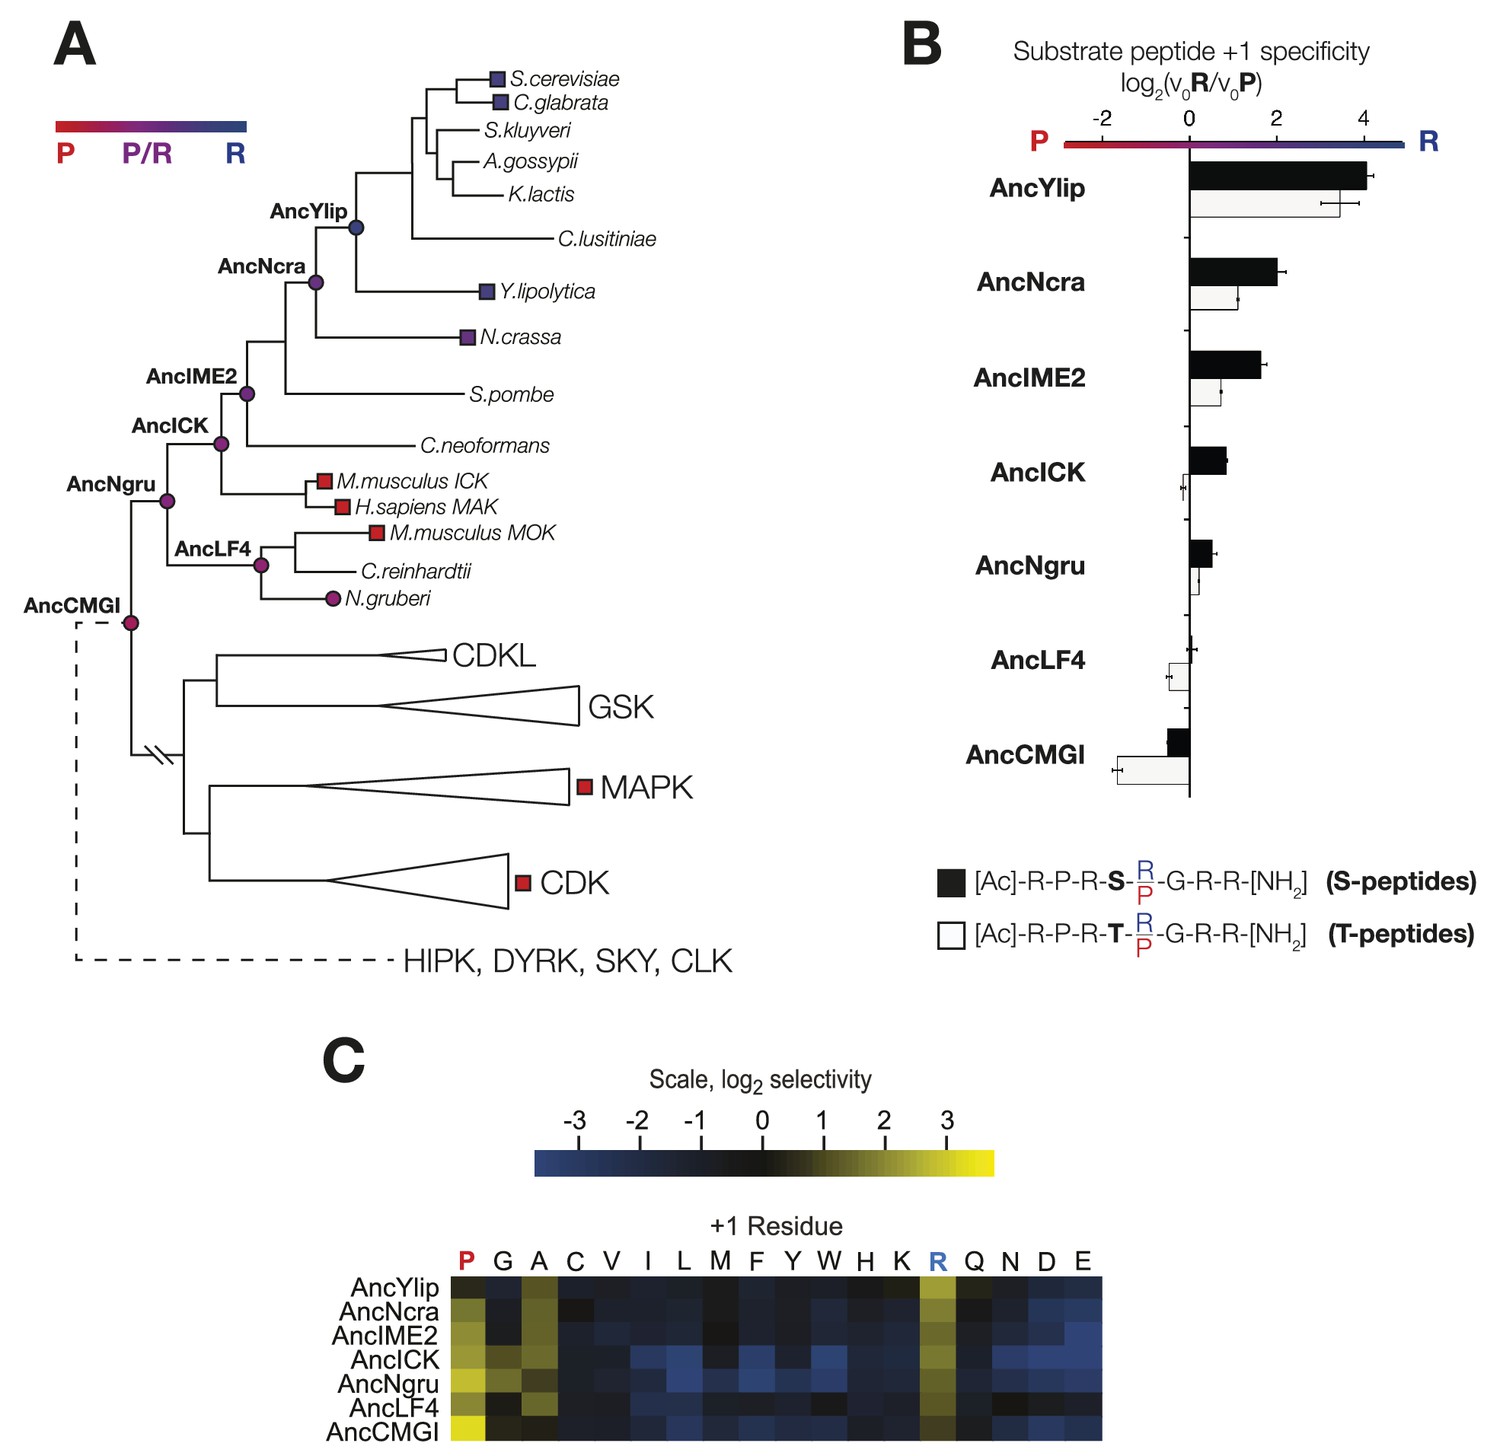
The substrate peptide +1 specificity evolved from proline in AncCMGI to arginine in S. cerevisiae Ime2 via an expanded specificity intermediate.
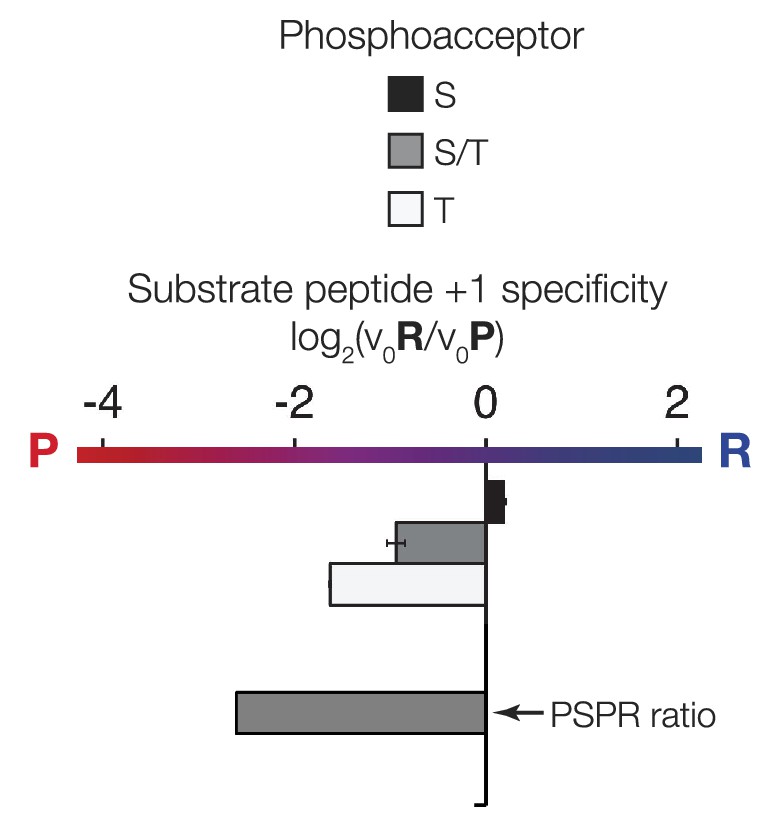
(A) Phylogenetic tree for the IME2/LF4/RCK superfamily, also showing the positions of other major CMGC group families. The positions of ancestral nodes resurrected in this study are indicated by circles. The tree is color-coded: red indicates +1 proline preference, blue indicates +1 arginine preference, and purple indicates equal tolerance of both Arg and Pro at the +1 position. (B) Seven resurrected kinases were incubated with 45 μM peptide (see schematic, below). Bars show the log2 ratio of +1R and +1P initial velocities (V0R/V0P). Black and white bars indicate Ser and Thr respectively as phosphoacceptor. Error bars are standard error of three assays. (C) Peptide phosphorylation rates for the same resurrected kinases shown in (B) using the peptides from the positional scanning peptide library having the indicated residue fixed at the +1 position. Data show the average of two replicates and are normalized and log2 transformed so that the average value for a given kinase is zero. The heat map follows the same color scheme as in Figure 1A.
Figure 3—figure supplement 1
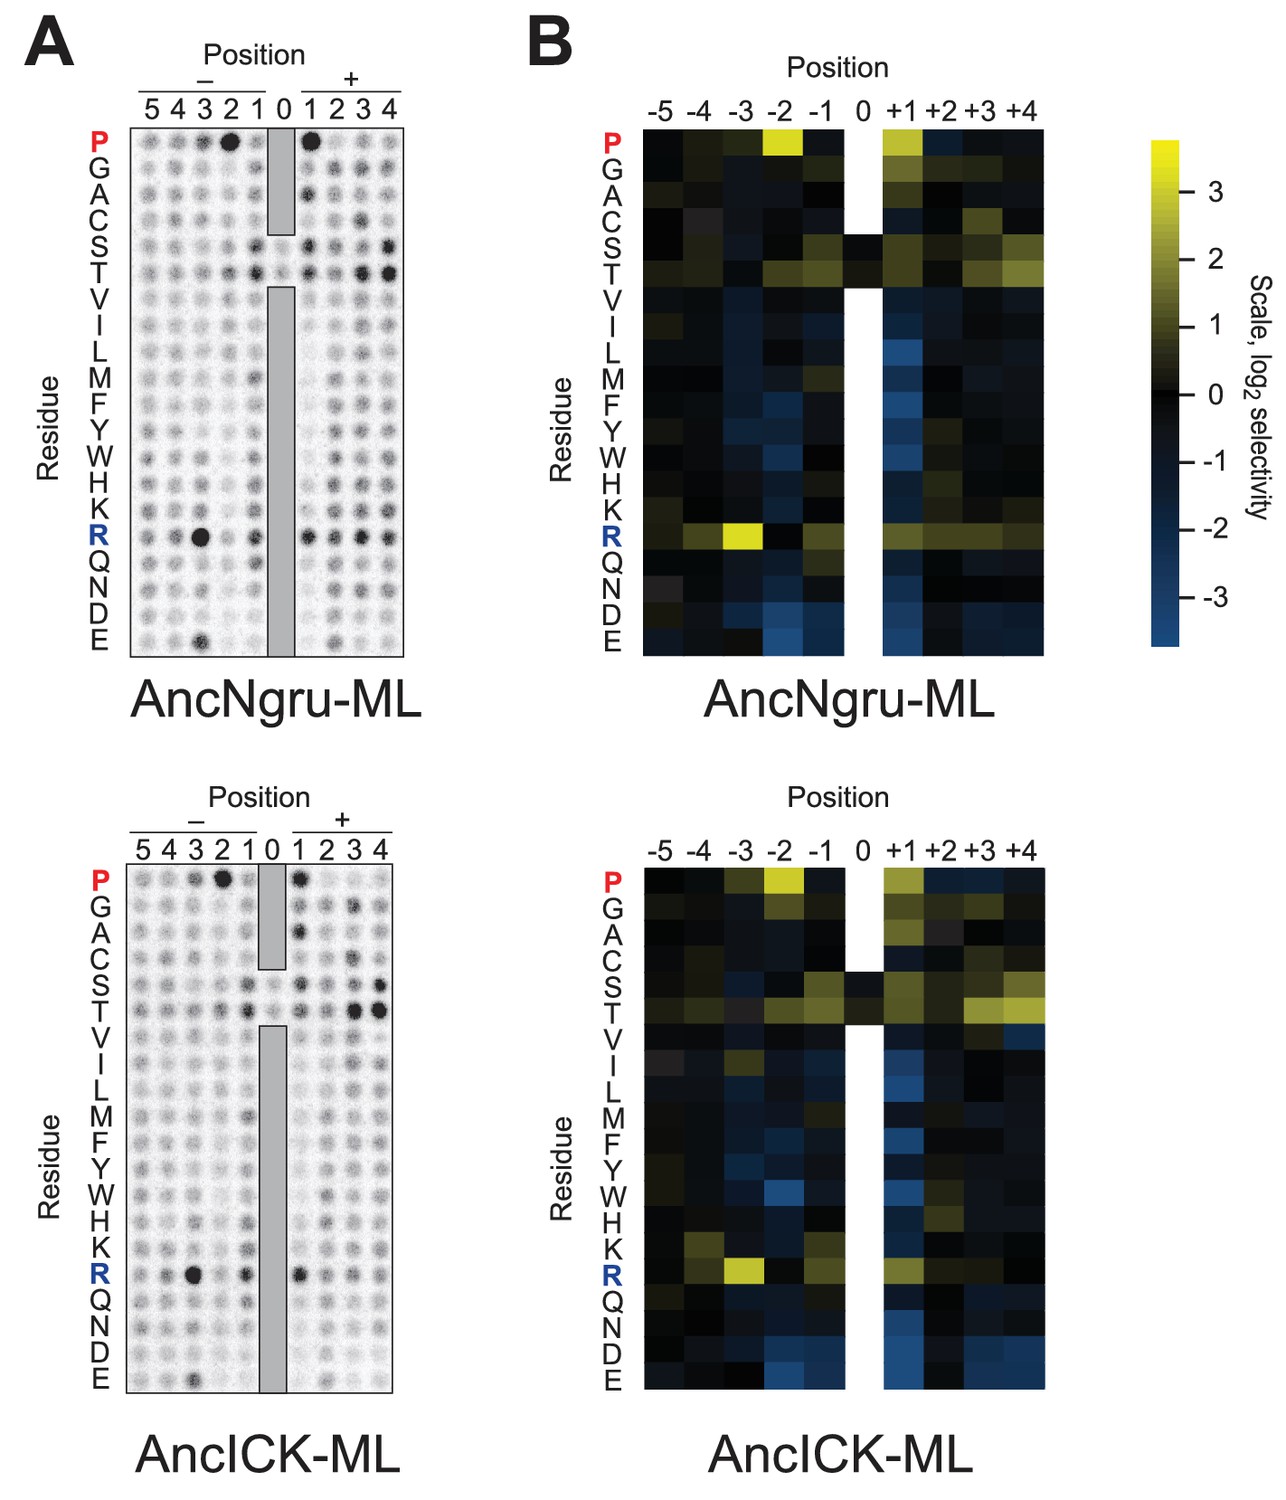
Raw data and selectivity values for full positional scanning peptide arrays of AncLF4 and AncICK.
(A) Raw PSPL result for maximum likelihood reconstructions of AncNgru and AncICK. (B) Averaged, quantified selectivity values for two replicate runs of the kinases shown in (A). Data were collected and processed as in Figure 1—figure supplements 1 and 2.
Figure 3—figure supplement 2

The substrate peptide +1 specificity evolved from proline in AncCMGI to arginine in S. cerevisiae Ime2 via an expanded specificity intermediate – robustness to uncertainty in reconstructions.
(A) Alternative reconstructions of each of the seven resurrected kinases (‘Materials and methods’) were incubated with 45 μM peptide (see schematic, bottom). Bars show the log2 ratio of +1R and +1P initial velocities (V0R/V0P). Black and white bars indicate Ser and Thr respectively as phosphoacceptor. Error bars are standard error of three assays. (B) Peptide phosphorylation rates for the same resurrected kinases shown in (A), using the peptides from the positional scanning peptide library having the indicated residue fixed at the +1 position. Data show the average of two to three replicates and are normalized and log2 transformed so that the average value for a given kinase is zero. The heat map follows the same color scheme as in Figure 1A.
Figure 4 with 4 supplements
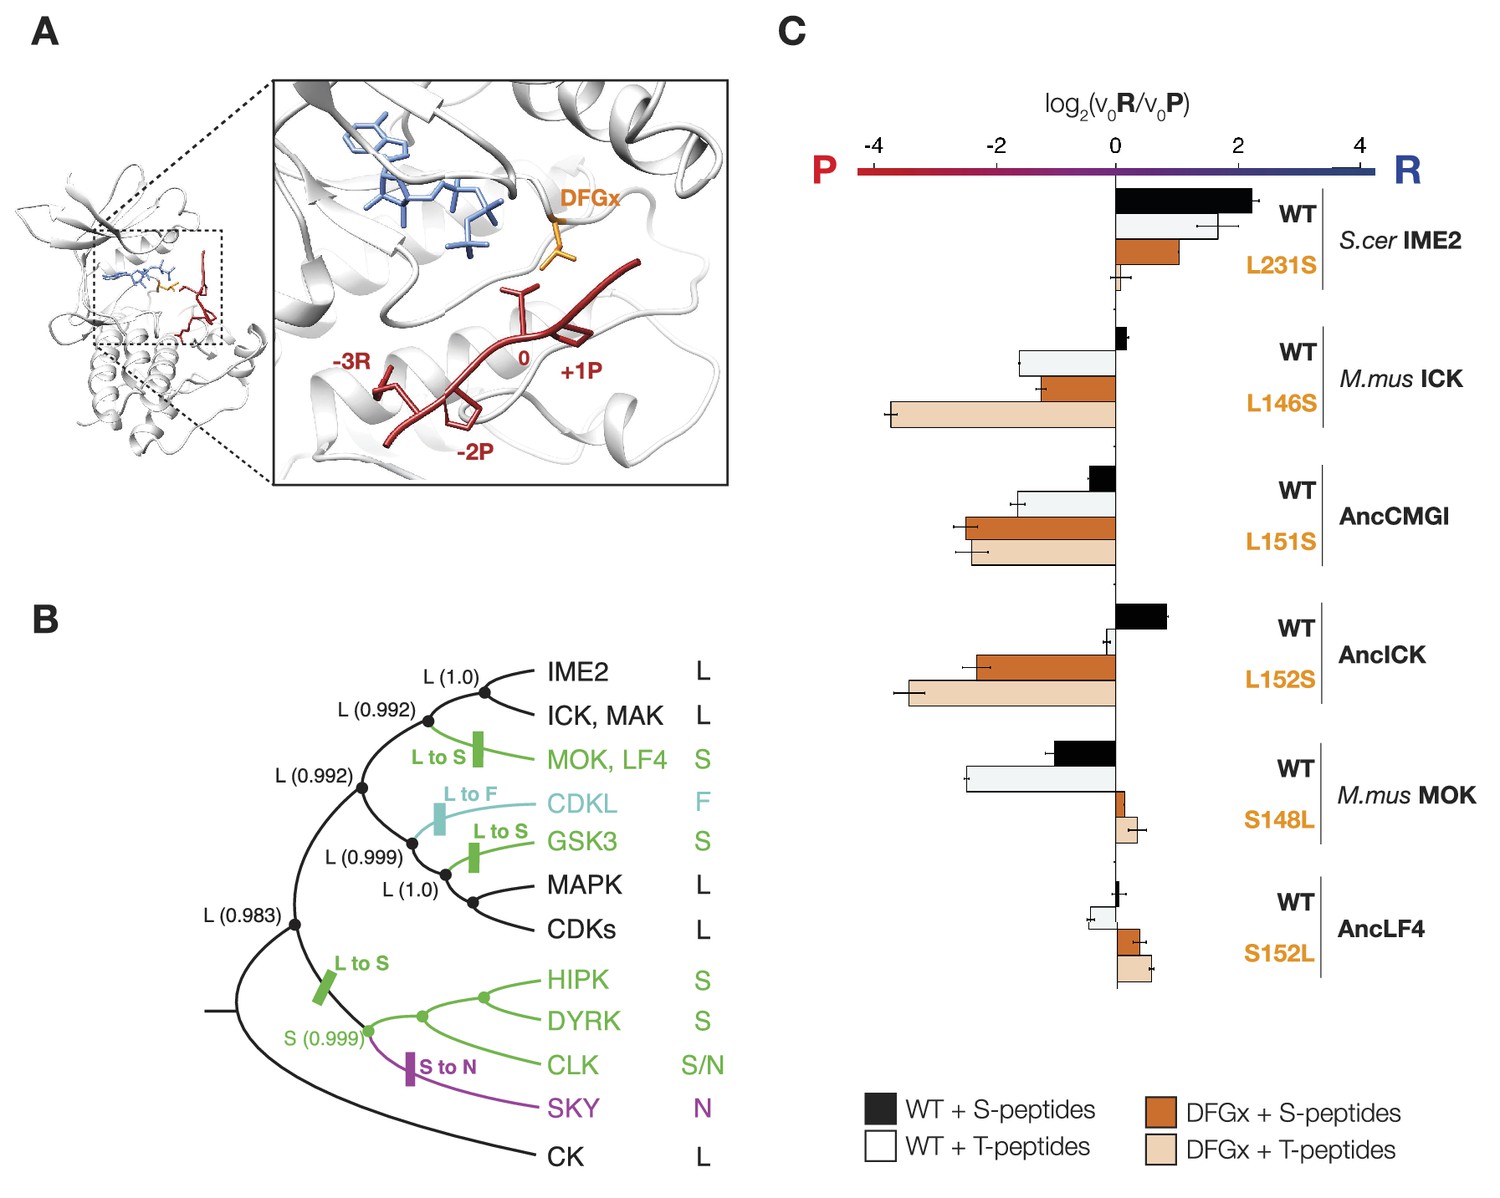
The DFGx amino acid and the phosphoacceptor influence the +1 specificity of extant and ancestral kinases.
(A) Structural model of AncCMGI in complex with a consensus peptide substrate. The box shows the active site with the position of the DFGx amino acid highlighted in orange. ATP is blue and the substrate peptide is red. For clarity, sidechains are only shown for residues discussed in the text. (B) Phylogenetic tree indicating the identity of the DFGx amino acid and the transitions that occurred in the evolution of the CMGC group. Numbers indicate support for ancestral reconstructions. (C) Kinases were incubated with 45 μM peptide and initial velocities measured. In general, L to S mutations shift substrate preference towards +1P while S to L mutations shift preference towards +1 R. Bars show the log2 ratio of +1R and +1P initial velocities (V0R/V0P). Black and white bars indicate wild type or maximum likelihood kinases incubated with peptides that contain serine and threonine respectively as phosphoacceptor. Dark and light orange indicate DFGx mutant kinases incubated with peptides that contain serine and threonine respectively as phosphoacceptor. Error bars are standard error of three assays. Figure 4—figure supplement 1 shows data for ICK compared to PSPL results. Figure 4—figure supplement 2 shows full Michaelis–Menten curves for selected kinases and DFGx mutants.
Figure 4—figure supplement 1
The phosphoacceptor affects the +1 specificity of ICK.
ICK kinase was incubated with 45 μM peptide and initial velocities measured. Bars show the log2 ratio of +1R/+1P initial velocities (V0R/V0P). Black and white bars indicate that ICK was incubated with peptides that contain serine and threonine respectively as phosphoacceptor. The gray bar indicates an equal mix of serine and threonine as phosphoacceptor. The lower gray bar is ratio data taken from the PSPL array in Figure 1—figure supplement 1 i.e. a ratio of phosphate incorporation into Y-A-X-X-X-X-X-S/T-R-X-X-X-A-G-K-K-biotin vs Y-A-X-X-X-X-X-S/T-P-X-X-X-A-G-K-K-biotin peptides, where S/T indicates an equal mixture of serine or threonine as phosphoacceptor and X indicates an equal mixture of all amino acids except C, S, or T at all other positions except +1 and the terminal linker amino acids.
Figure 4—figure supplement 2

Michaelis–Menten curves for selected kinases.
Saccharomyces cerevisiae Ime2, Saccharomyces cerevisiae Ime2-DFGx (L231S), Mus musculus ICK, and Mus musculus ICK-DFGx (L146S) were incubated with varying peptide concentrations (x-axis), and initial velocities for the reaction are plotted on the y-axis. The curves on the left contain serine as phosphoacceptor (S-peptides) while those on the right contain threonine (T-peptides). Peptides with Pro at the +1 position are colored red and marked with triangles, peptides with Arg at the +1 position are colored blue and marked with circles (see schematic, top).
Figure 4—figure supplement 3
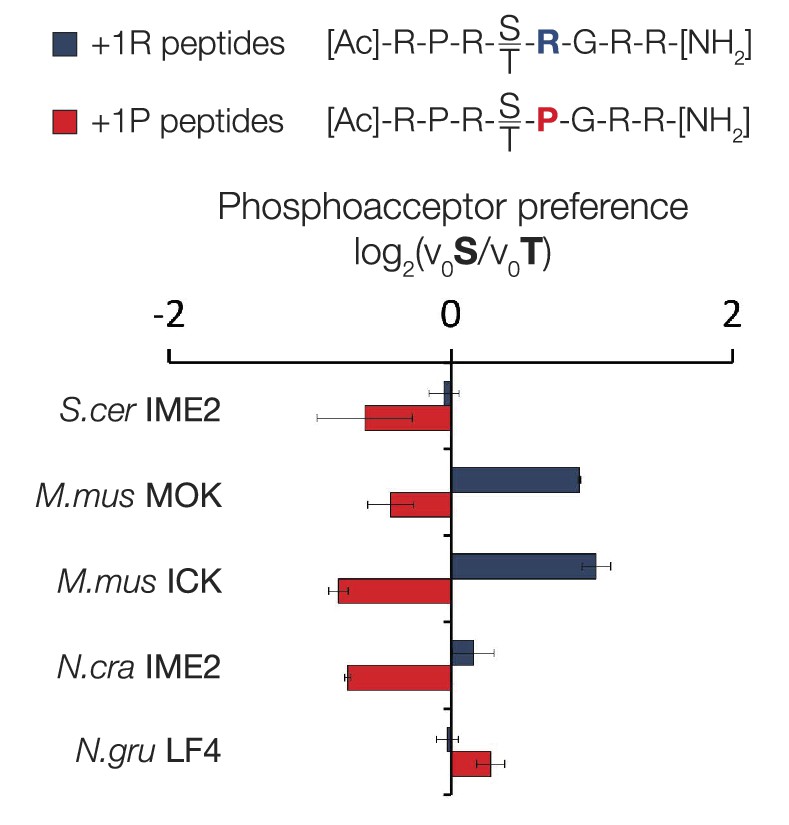
Variable phosphoacceptor preference for extant IME2/RCK/LF4 kinases.
Kinases were incubated with 45 μM peptide and initial velocities measured. Bars show the log2 ratio of initial velocities with serine or threonine as phosphoacceptor (V0S/V0T). Red and blue bars indicate the presence of arginine and proline, respectively, at the +1 substrate position. Error bars are standard deviations of three replicates.
Figure 4—figure supplement 4
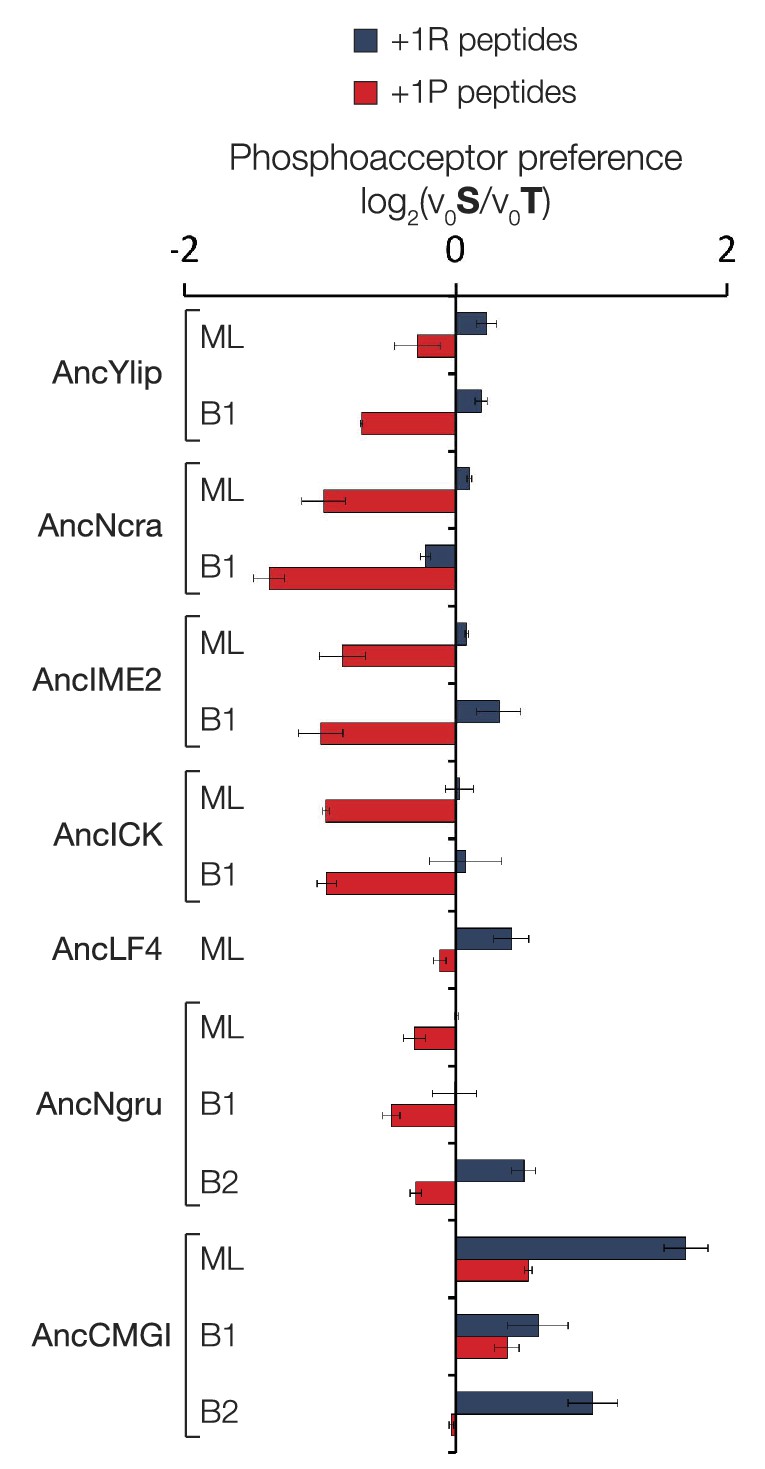
Phosphoacceptor preference shows a general shift from threonine towards threonine during evolution in the IME2/RCK/LF4 lineage.
Kinases were incubated with 45 μM peptide and initial velocities measured. Bars show the log2 ratio of initial velocities with serine or threonine as phosphoacceptor (V0S/V0T). Red and blue bars indicate the presence of arginine and proline, respectively, at the +1 substrate position. Error bars are standard deviations of three replicates.
Figure 5 with 2 supplements
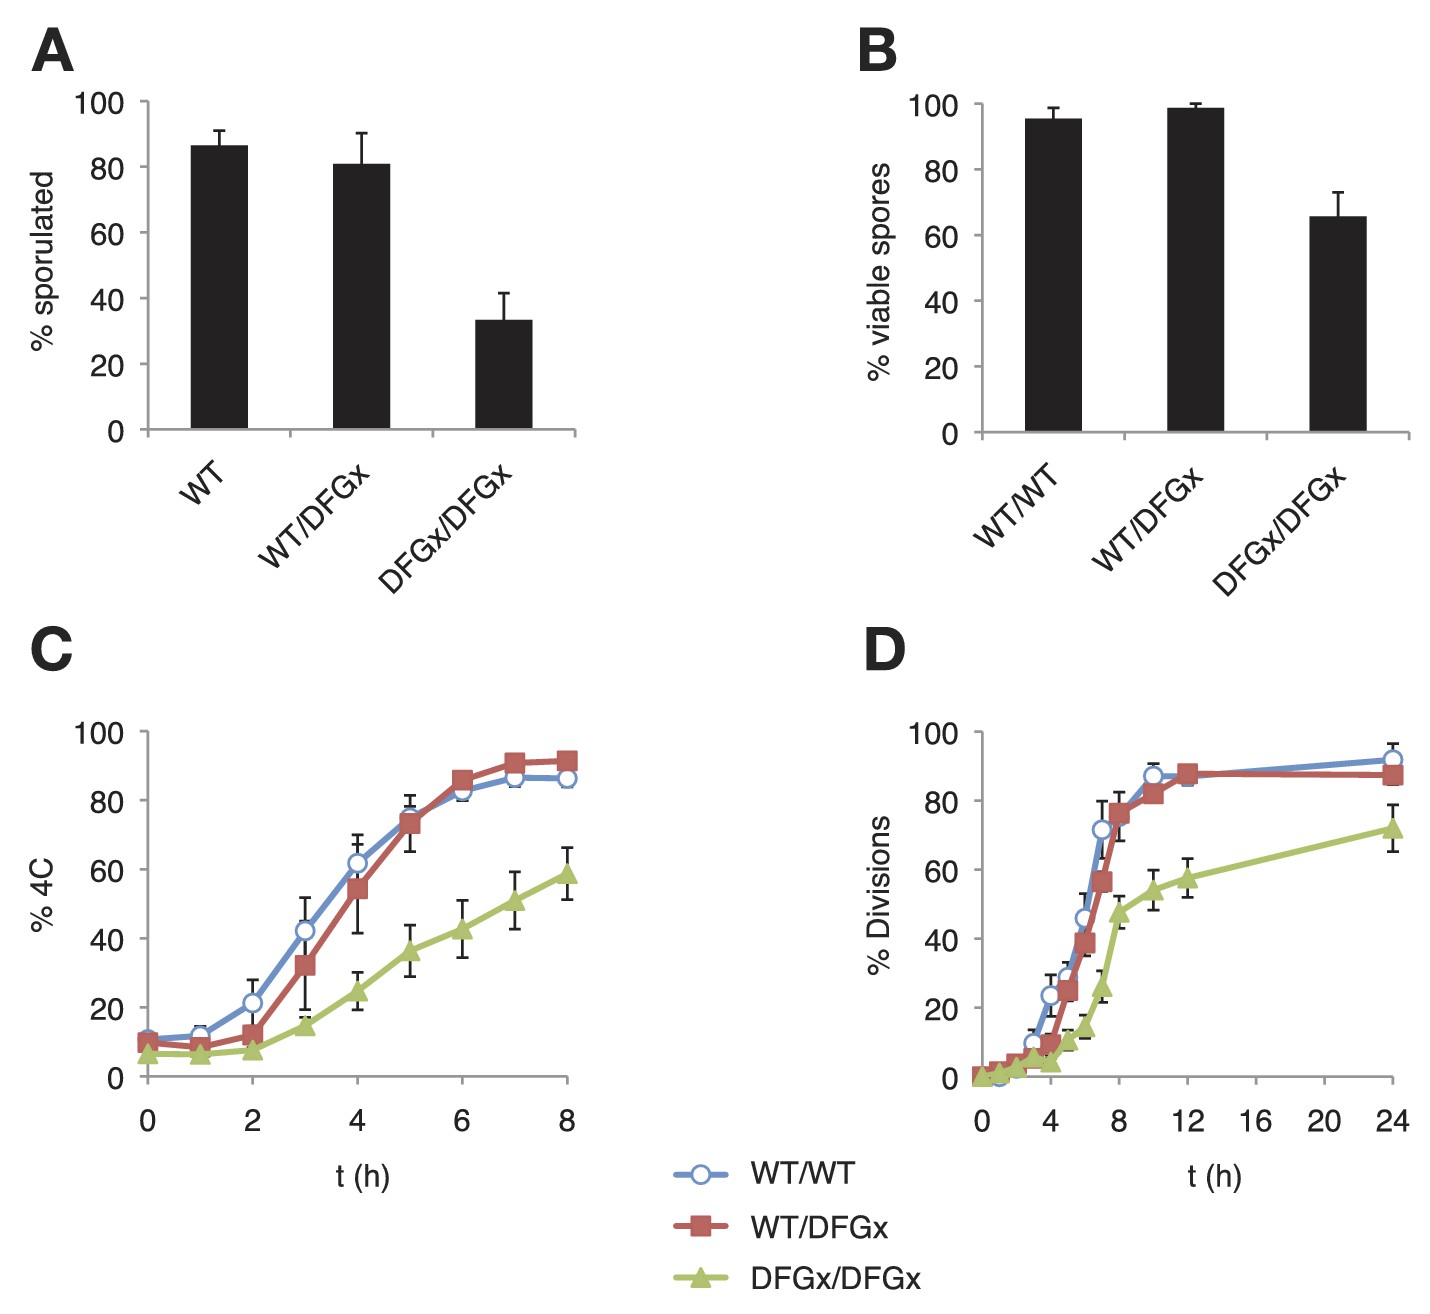
The S. cerevisiae meiotic phosphoregulatory network tolerates an expanded specificity DFGx mutant.
(A) Sporulation efficiency with various IME2 alleles: wild-type IME2 (WT), an ime2-(L231S) heterozygote (WT/DFGx), or an ime2-(L231S) homozygote (DFGx/DFGx). (B) Fraction of tetrad spores that, when dissected, gave rise to colonies (representative images shown in Figure 5—figure supplement 1). (C) Synchronous meiosis was induced and DNA content analyzed by SYTOX-Green staining and flow cytometry (representative raw data shown in Figure 5—figure supplement 2). (D) Synchronous meiosis was induced and DNA segregation events were scored by fluorescence microscopy. Error bars represent standard error of three or more biological replicates.
Figure 5—figure supplement 1
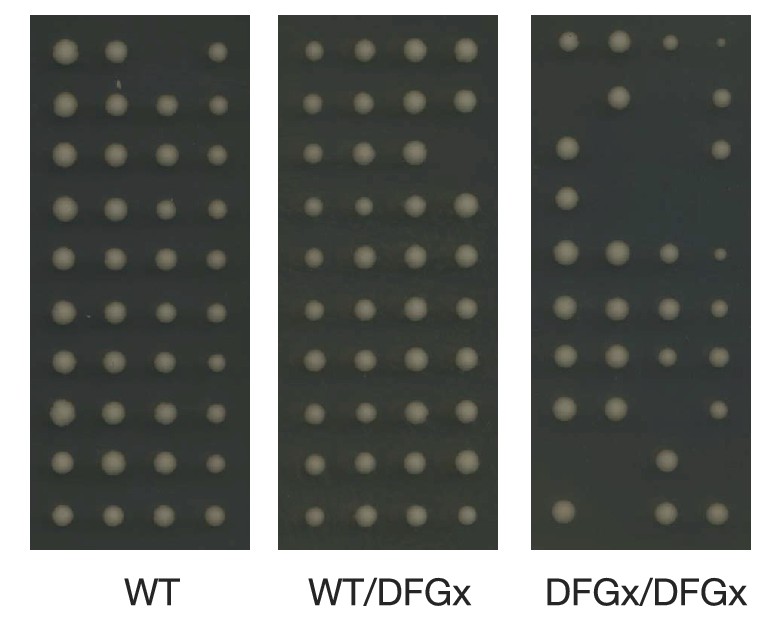
Representative tetrad dissections.
Synchronous meiosis was induced for wild-type IME2 (WT), an ime2-(L231S) heterozygote (WT/DFGx), or an ime2-(L231S) homozygote (DFGx/DFGx).
Figure 5—figure supplement 2
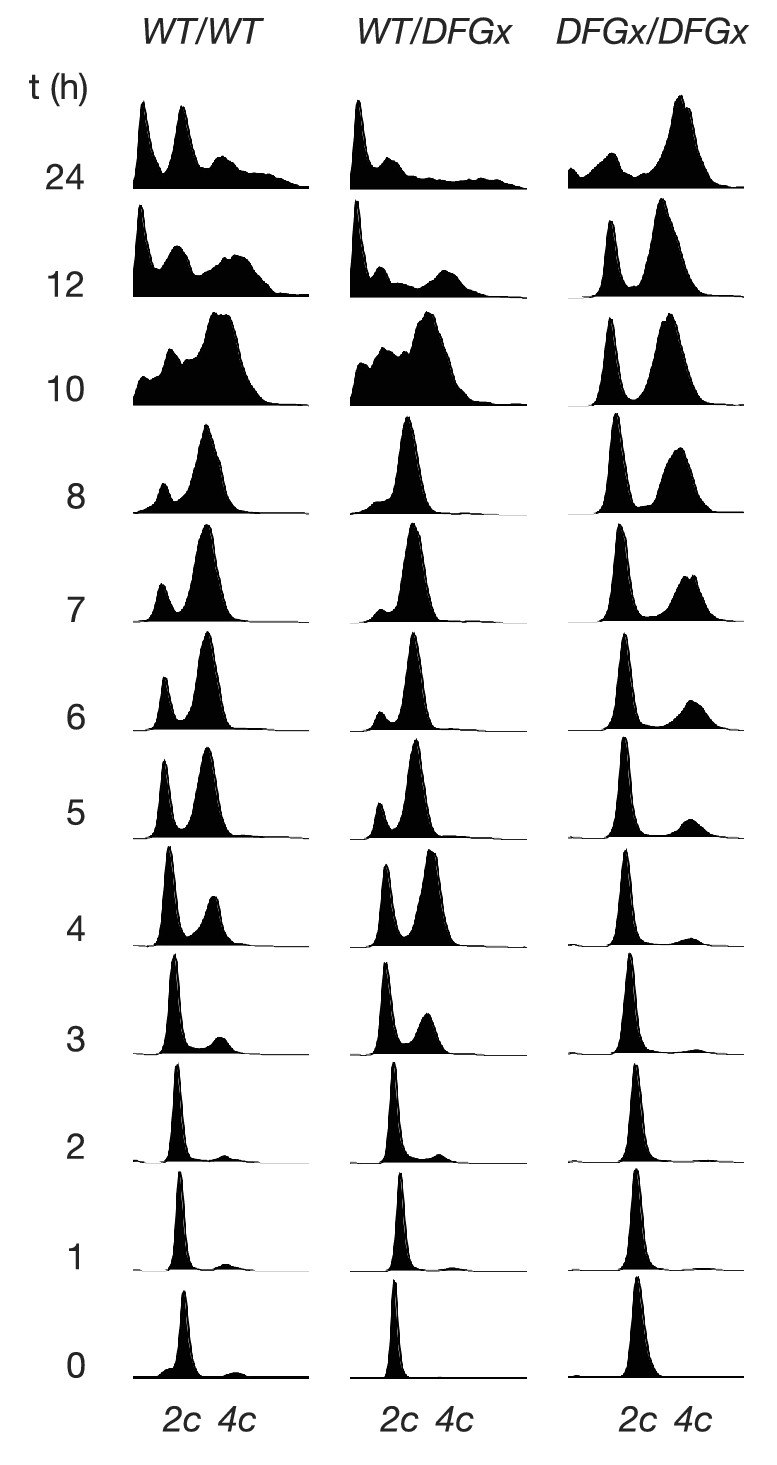
Representative cytometry data from meiosis experiments.
Synchronous meiosis was induced and DNA content analyzed by SYTOX-Green staining and flow cytometry. Approximate positions of 2c and 4c DNA content are indicated. Beyond 8 hr, gametogenesis occurs, leading to packaging of DNA into spores and resulting in additional peaks.
Figure 6
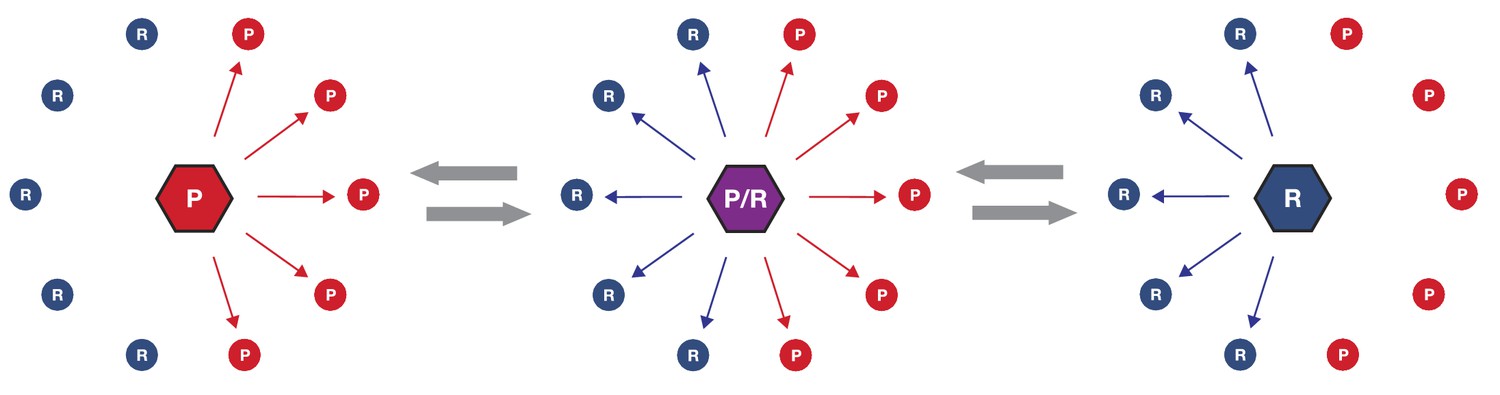
Simplified schematic of one possible path of kinase network evolution.
Hexagons represent kinases, circles represent substrates, lines connecting kinase to substrate indicate potential phosphoregulation.
Tables
Table 1
Michaelis-Menten kinetic parameters for three members of the IME2/RCK/LF4 subgroup of kinases
| Kinase | +1 residue | KM (μM) | kcat (min-1) | Kcat/KM (min-1μM-1) | |
|---|---|---|---|---|---|
| S. cerevisiae Ime2 | R | 2.2 ± 0.3 | 10.8 ± 0.4 | 4.84 ± 0.67 | n = 4 |
| P | 44.5 ± 12.2 | 3.3 ± 0.3 | 0.07 ± 0.02 | n = 4 | |
| N. gruberi LF4 | R | 1.2 ± 0.4 | 5.8 ± 0.5 | 4.76 ± 1.6 | n = 3 |
| P | 2.7 ± 0.6 | 7.8 ± 0.5 | 2.95 ± 0.69 | n = 3 | |
| M. musculus Mok | R | 41.9 ± 10.8 | 5.9 ± 0.5 | 0.14 ± 0.04 | n = 4 |
| P | 37 ± 2.7 | 11.7 ± 0.3 | 0.32 ± 0.03 | n = 4 |
Additional files
-
Supplementary file 1
List of plasmids generated in this study.
- https://doi.org/10.7554/eLife.04126.023
-
Supplementary file 2
List of yeast strains generated in this study.
- https://doi.org/10.7554/eLife.04126.024
Download links
A two-part list of links to download the article, or parts of the article, in various formats.
Downloads (link to download the article as PDF)
Open citations (links to open the citations from this article in various online reference manager services)
Cite this article (links to download the citations from this article in formats compatible with various reference manager tools)
Ancestral resurrection reveals evolutionary mechanisms of kinase plasticity
eLife 3:e04126.
https://doi.org/10.7554/eLife.04126


