The sheddase ADAM10 is a potent modulator of prion disease
- University Medical Center Hamburg-Eppendorf, Germany
- Christian Albrechts University, Germany
- Medical University Lodz, Poland
Figures
Figure 1
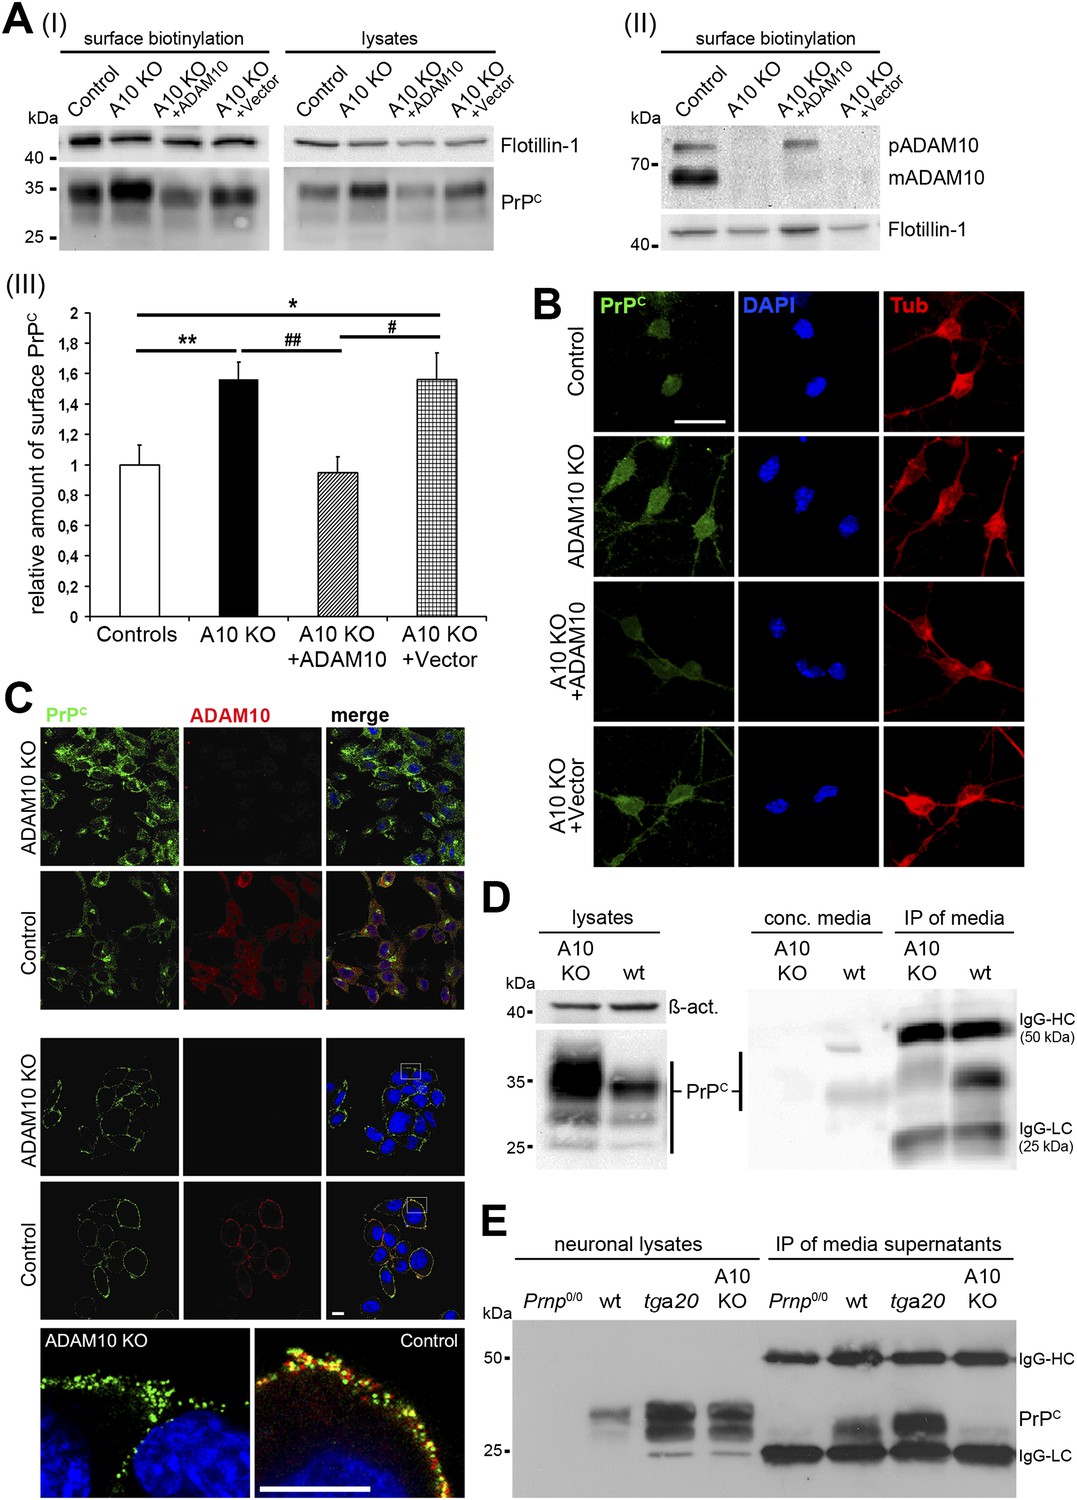
Characterization of PrPC levels in different cellular models of ADAM10 deficiency.
(A) Representative Western blots showing membrane levels of PrPC as revealed by surface biotinylation (I; on the left) and total PrPC levels in lysates (I; on the right) as well as ADAM10 surface expression (II) of neuronally differentiated neural stem cells (NSCs) from NestinA10 KO and littermate control mice and after genetic reintroduction of Adam10 (A10 KO + ADAM10) or nucleofection with control vector (A10 KO + Vector) into NSCs of NestinA10 KO mice. Flotillin served as loading control. (III) Quantification of densitometric analysis of PrPC membrane levels of experimental groups mentioned above (n = 9 independent samples for controls [set to 1]; n = 9 for NestinA10 KO; n = 8 for NestinA10 KO + ADAM10; n = 5 for NestinA10 KO + Vector; significance: **p = 0.0054; ##p = 0.0014; *p = 0.0336 ; #p = 0.0212). Error bars indicate SEM. (B) Representative immunofluorescent PrPC (green) surface staining of neuronally differentiated NSCs derived from NestinA10 KO (without [second row] or with genetic reintroduction of ADAM10 [third row] or vector only [fourth row]) and littermate control mice (first row), respectively. Tubulin (red) was stained after permeabilization of cells to confirm neuronal differentiation of NSCs. DAPI (blue) marks nuclei. (C) Representative immunostaining of PrPC (green) and ADAM10 (red) in permeabilized (upper two rows) and non-permeabilized (lower three rows) murine embryonic fibroblasts (MEFs) derived from mice with a complete knockout of ADAM10 (ADAM10 KO) or wild-type mice (control). Higher resolution of white boxes is shown in the bottom row and reveals colocalization of PrPC and ADAM10 at the plasma membrane of wild-type control MEFs. Scale bars in B and C represent 10 µm. (D) Western blot analysis of cell-associated PrPC levels in ADAM10 knockout (A10 KO) and wild-type (wt) MEF lysates (left part: actin served as loading control). Levels of shed PrPC were assessed in cell culture media supernatants of ADAM10 knockout and wild-type MEFs by filter column concentration (conc. media) and immunoprecipitation (IP) with a PrPC-specific antibody respectively (right part). (E) Levels of cell-associated (neuronal lysates) and shed PrPC (IP of media supernatants) in primary neuronal cultures of prion protein knockout (Prnp0/0), wild-type (wt; C57BL/6), prion protein overexpressing (tga20), and NestinA10 KO mice at embryonic day 14. IgG-HC and IgG-LC mark signals for heavy and light chain of the capturing antibody POM2.
Figure 2 with 1 supplement
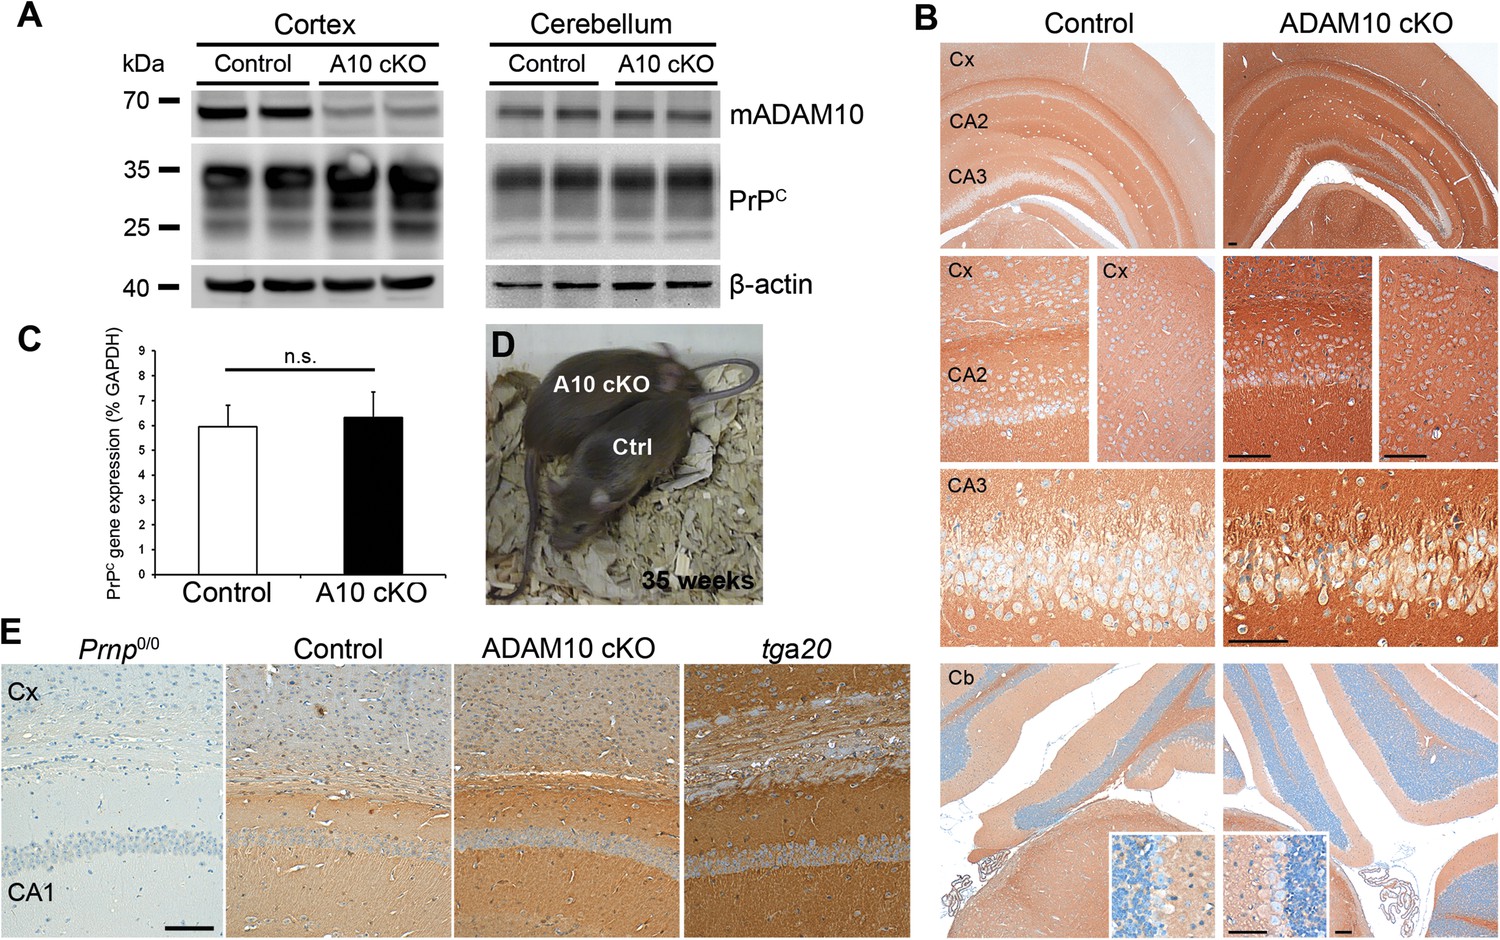
Characterization of PrPC expression in juvenile and adult Camk2a-Cre A10 cKO mice and littermate controls.
(A) Western blot analysis of mature ADAM10 (mADAM10) and PrPC expression in different brain homogenates from the cortex (left) and cerebellum (right) of A10 cKO and control mice at postnatal day (P) 19. Actin served as a loading control. (B) Immunohistochemical detection of PrPC in forebrain of P19 mice of both genotypes. Overview (top) and magnifications showing cortex (Cx) and hippocampal CA2 and CA3 regions. Overview and details of cerebellum (Cb) are shown below. Scale bars represent 100 µm (insets for Cb: 50 µm). (C) Quantitative RT-PCR analysis of PrPC mRNA levels in A10 cKO mice and controls at P19 (n = 5 for each genotype). GAPDH served as a control for normalization. Error bars indicate SD. (D) Adult age-matched A10 cKO and wild-type littermates had a comparable body size at 35 weeks of age. (E) Representative immunohistochemical staining of PrPC in cortex (Cx) and hippocampal CA1 region of adult (35 weeks) A10 cO and control mice. Prion protein knockout (Prnp0/0) and overexpressing mice (tga20) served as negative and positive controls, respectively (scale bar: 100 µm).
Figure 2—figure supplement 1
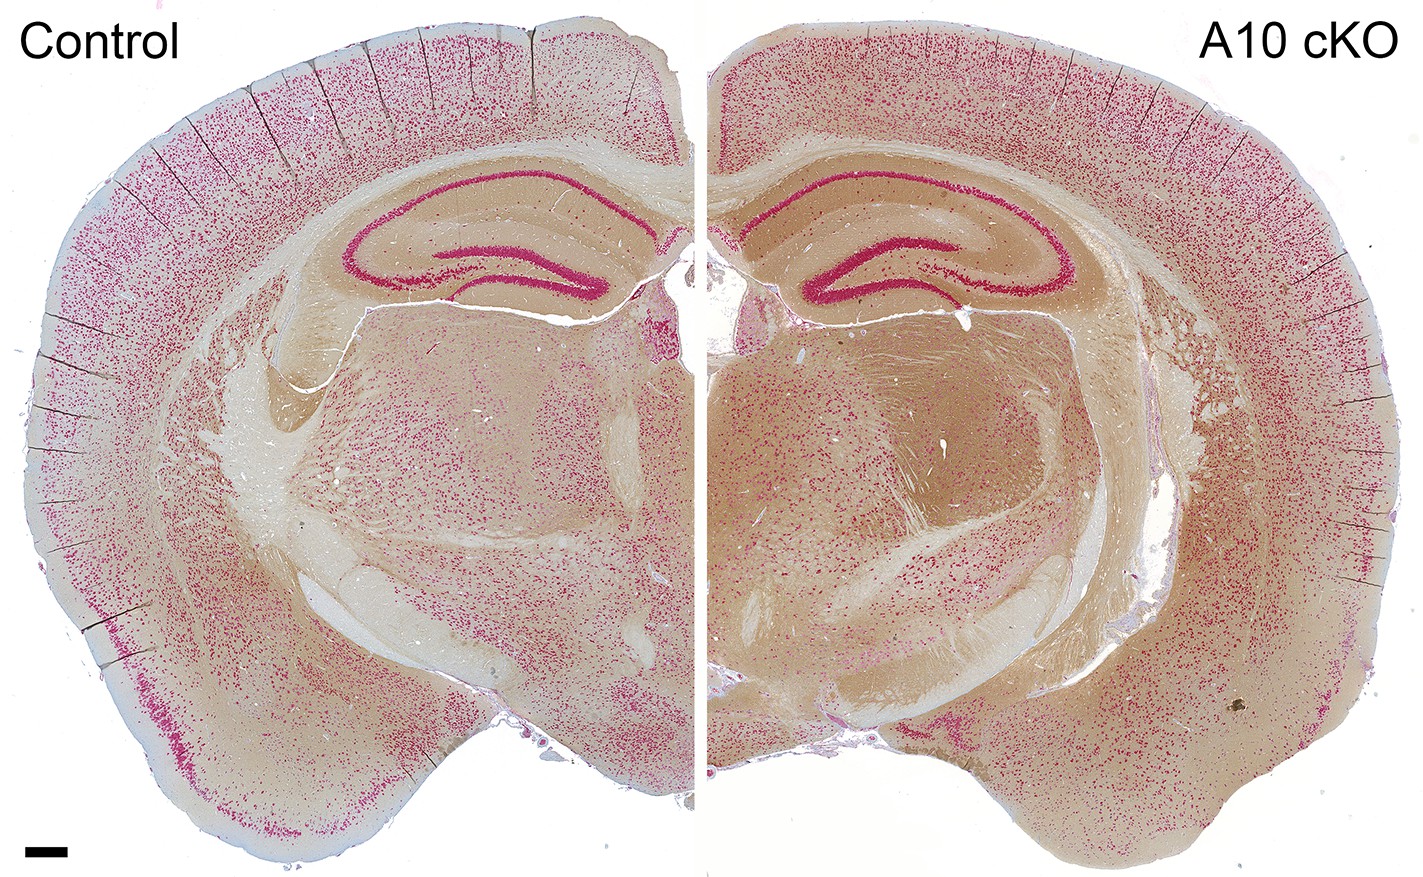
Regional distribution of increased PrPC levels in a coronal brain section of an ADAM10 cKO mouse compared with a wild-type littermate control.
Brain sections derived from postnatal day 19 mice of both genotypes co-stained for PrPC (brownish signal) and neuronal marker NeuN (red signal). Scale bar represents 200 µm.
Figure 3
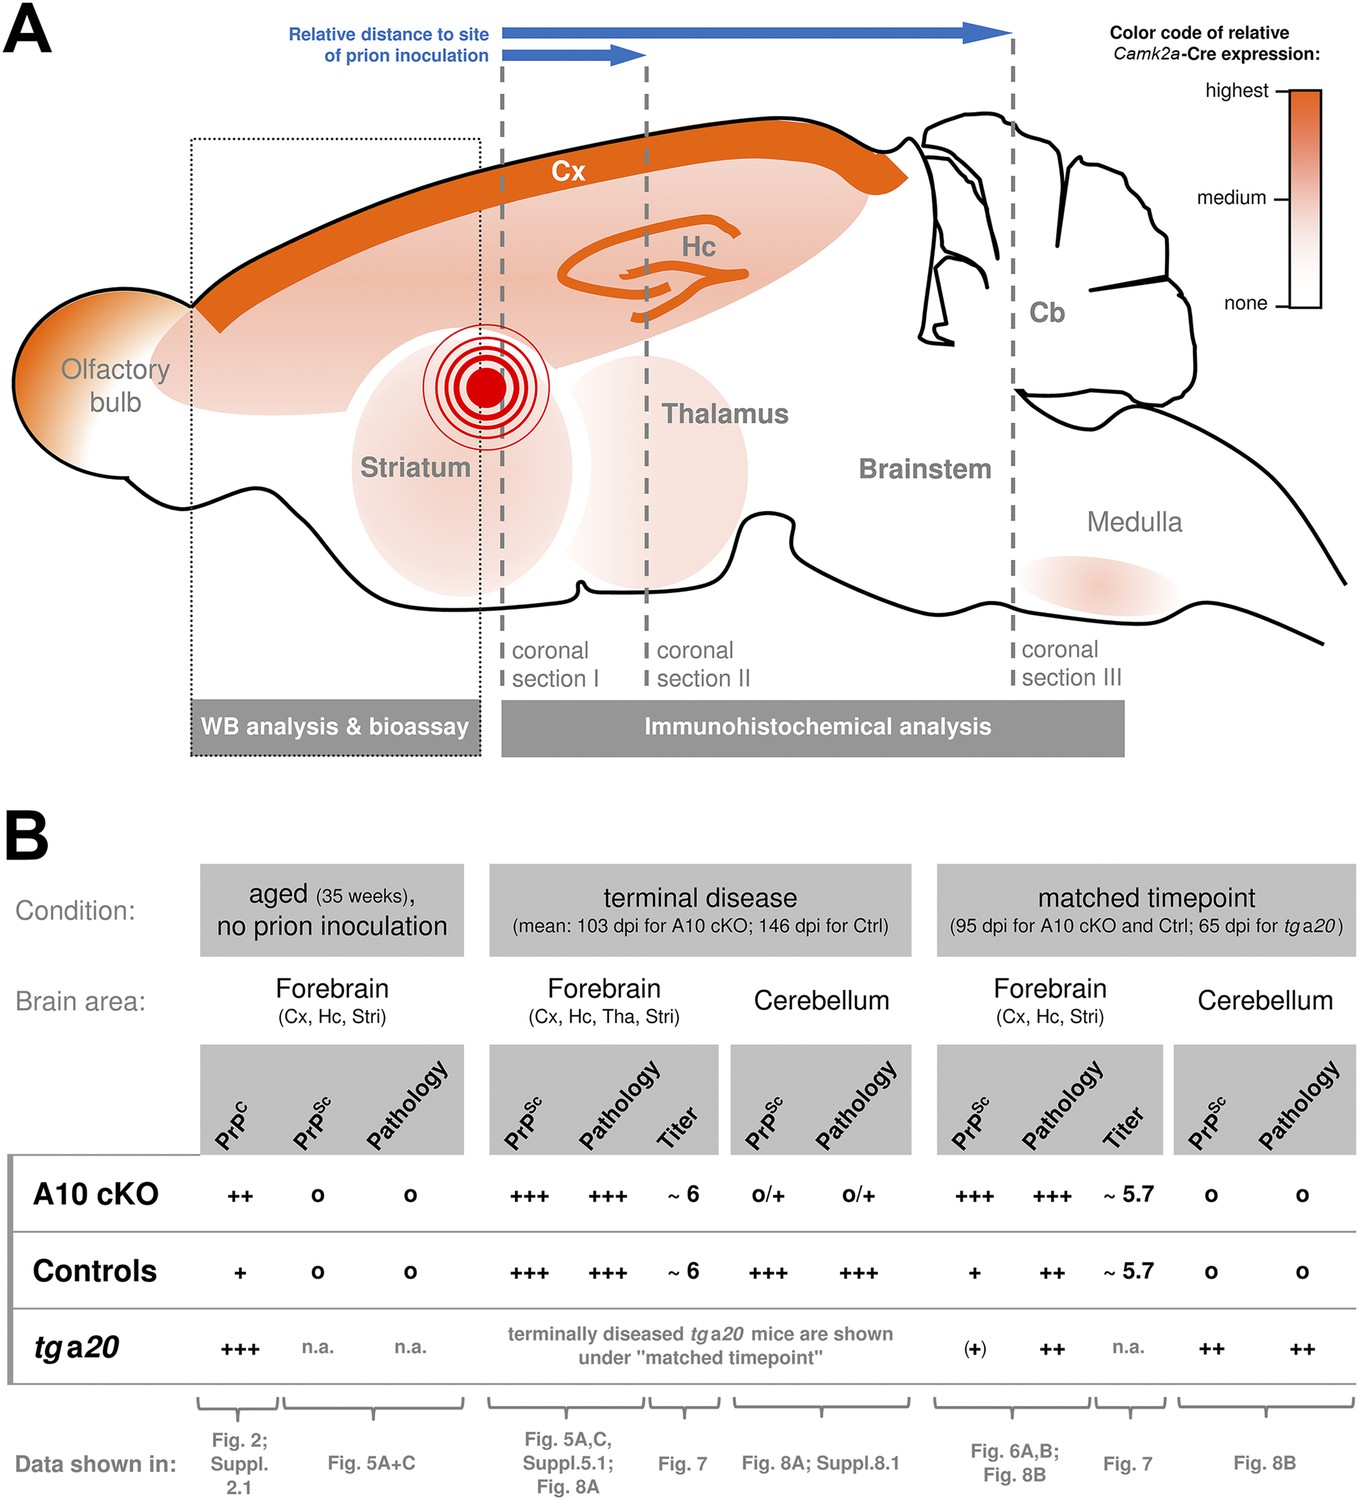
Overview of the experimental design and summary of most important findings.
(A) Scheme of a mouse brain combining a qualitative representation of the Camk2a driven ADAM10 knockout strategy and information on the sampling of specimen. The site of intracerebral inoculation of mice with RML prions is indicated by the red encircled dot. Samples of frontal brain (dotted box) were taken for biochemical analysis and determination of infectivity titers (bioassay). The rest of the brain was formalin-fixed and embedded in paraffin. Coronal sections were prepared from different layers (dashed lines) with varying distance to the site of prion inoculation (as indicated by blue arrows) and assessed by immunohistochemical analysis. (B) Qualitative comparison of mouse genotypes (A10 cKO, controls, tga20) with regard to PrPC or PrPSc levels, prion-associated neuropathology (including spongiosis, astrocytosis, and microglia activation) and prion infectivity titers according to brain region and time point. Reference to corresponding figures showing original data is provided. Cb = Cerebellum; Cx = Cortex; Hc = Hippocampus; Stri = Striatum; Tha = Thalamus; n.a. = not assessed; Qualities: +++ = high/strong; ++ = medium/moderate; + = low/basal; (+) = very low/weak; o = none.
Figure 4
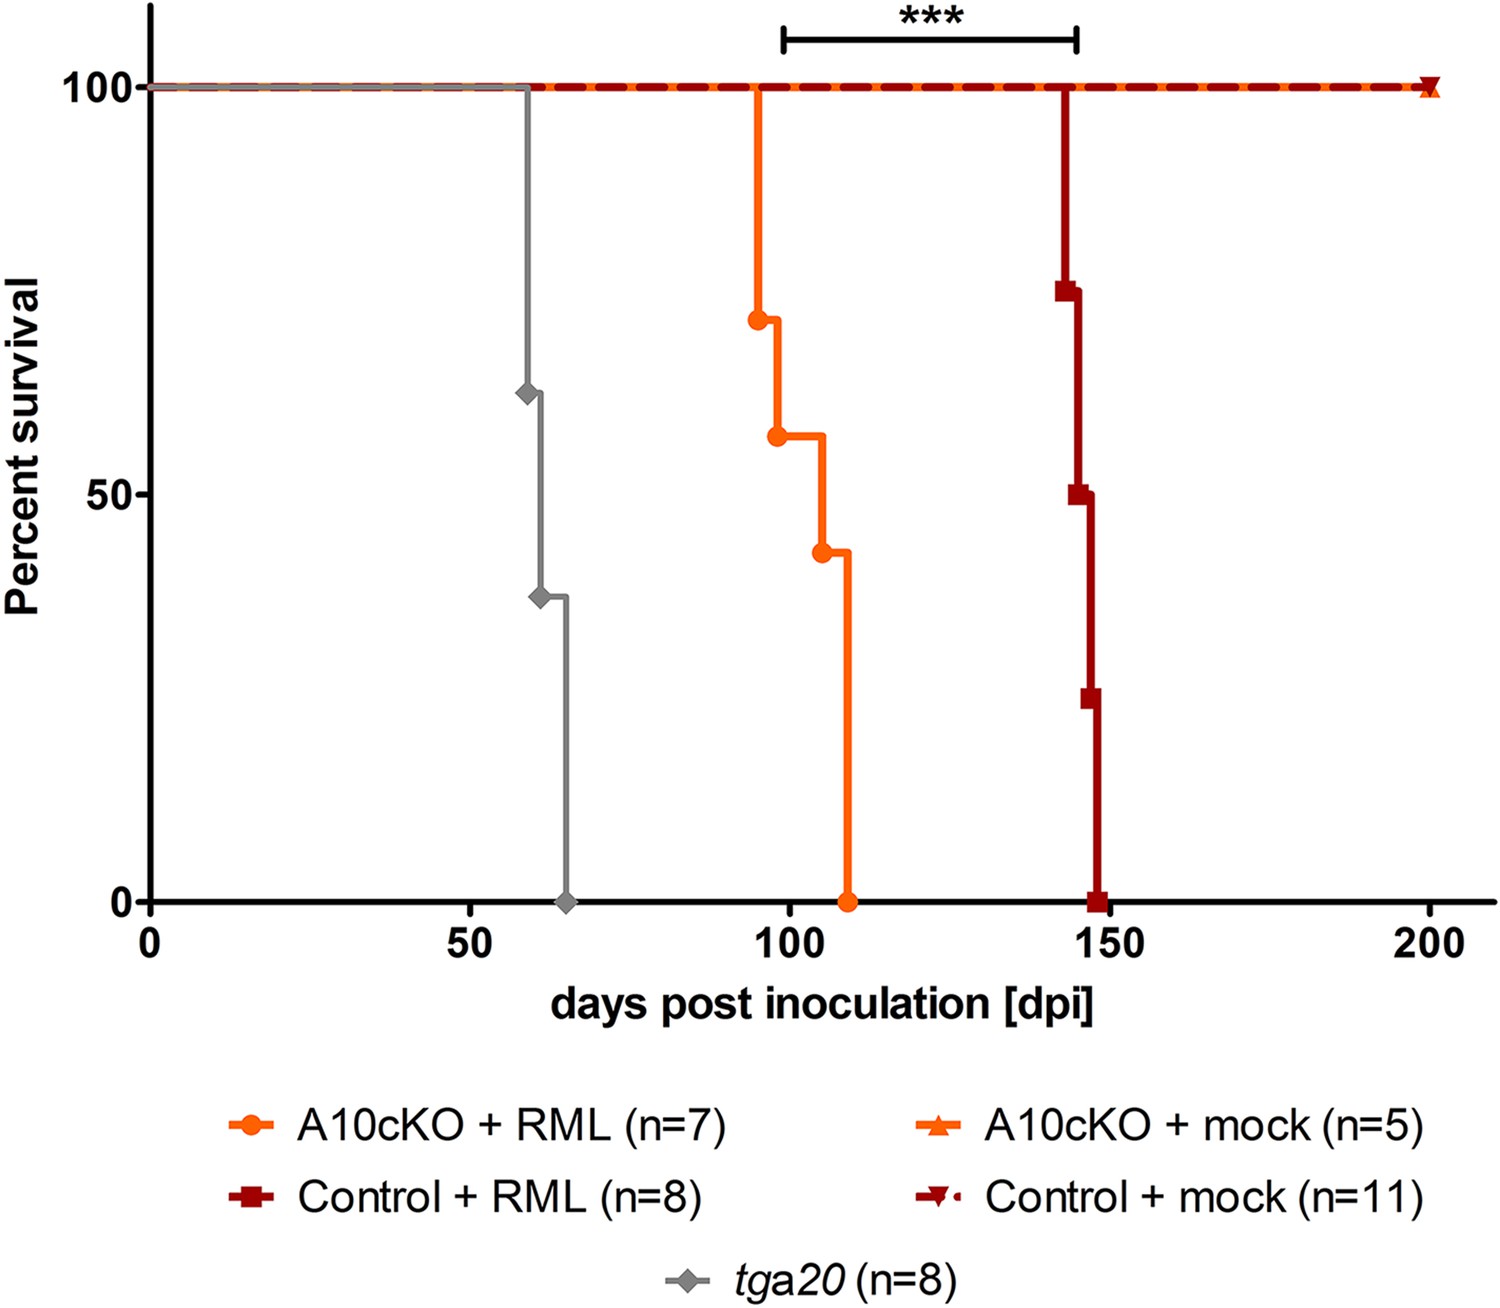
Survival curves of mice upon intracerebral inoculation with RML prions.
Age-matched juvenile (6-week-old) A10 cKO mice (n = 7), littermate control mice (n = 8), and tga20 mice (n = 8) were intracerebrally inoculated with RML prions (+RML) and time until development of terminal prion disease was measured as days post inoculation (dpi; ***p = 7.6 × 10⁻⁷). As a negative control (mock), 5 A10 cKO mice and 11 littermate controls were intracerebrally inoculated with brain homogenate of CD1 mice and sacrificed without clinical signs at 200 dpi.
Figure 5 with 2 supplements
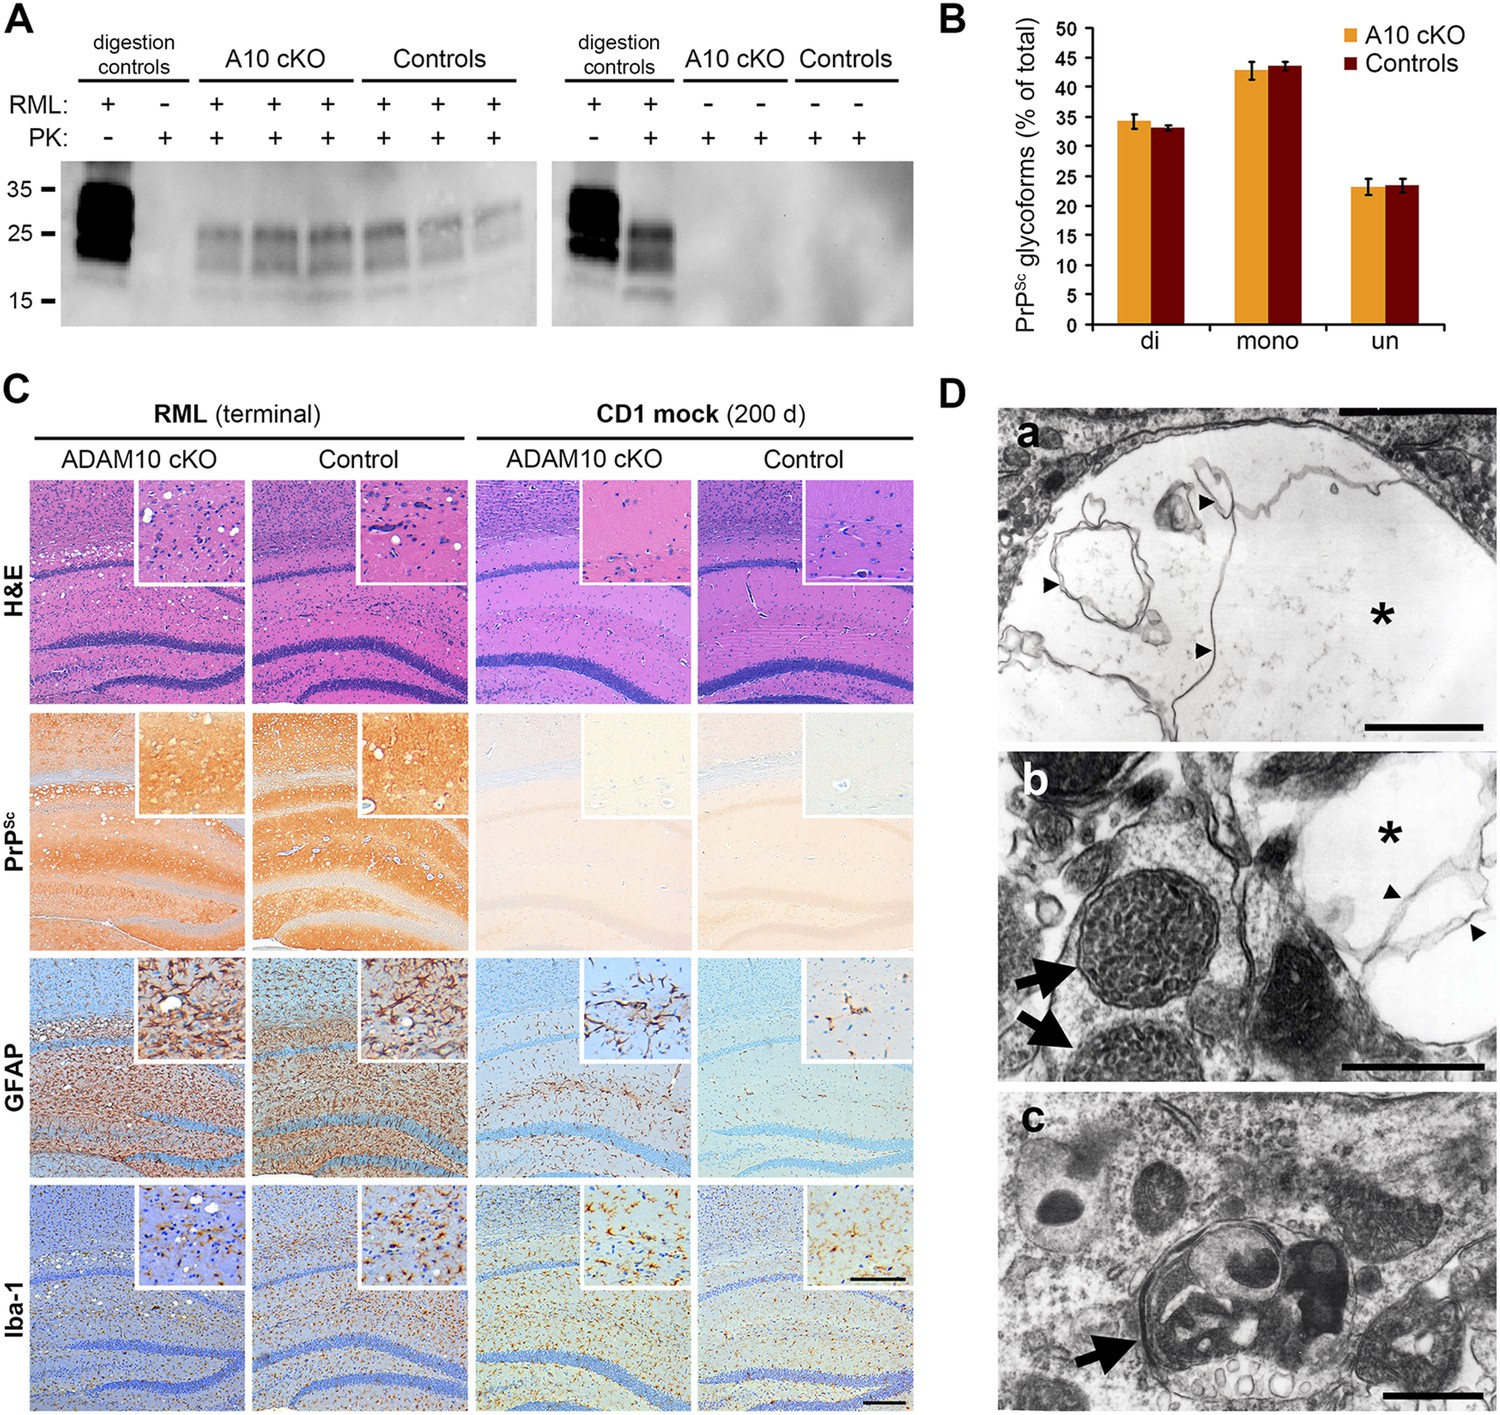
Analysis of terminally prion-diseased A10 cKO mice and littermate controls.
(A) Detection of PrPSc by Western blot analysis of proteinase K (PK)-digested (PK+) forebrain homogenates of prion-infected (RML+; blot on the left) and mock-inoculated (RML−; blot on the right) A10 cKO mice and controls at terminal stage of disease. Samples from three (RML+) or two (RML−) representative animals per genotype are shown. Digestion controls included prion-diseased/undigested (RML+/PK−), prion-negative/PK-digested (RML−/PK+), or prion-diseased/digested (RML+/PK+) brain homogenates. (B) Comparison of proportions of di-, mono, and unglycosylated PrPSc forms between A10 cKO (n = 4) and control mice (n = 4; error bars indicate SEM). (C) Representative histological analysis in the forebrain of terminally prion-diseased (RML terminal) and healthy mock-inoculated (CD1 mock) A10 cKO and control mice including H&E staining and immunostaining of PrPSc, GFAP (for detection of astrocytes), and Iba-1 (for detection of microglia). Scale bar in overviews: 200 µm; scale bar for inlays showing magnifications of representative areas: 100 µm. (D) Electron microscopy photographs showing intraneuronal vacuoles (asterisk in (a) and (b)) containing membranous structures (small arrowheads), enlarged and densely packed multivesicular bodies (arrows in (b)) as well as autophagic membranes (arrow in (c)) and autolysosomes that were found in terminally prion-infected forebrains of both genotypes (exemplified here for an A10 cKO brain). Scale bars represent 500 nm.
Figure 5—figure supplement 1
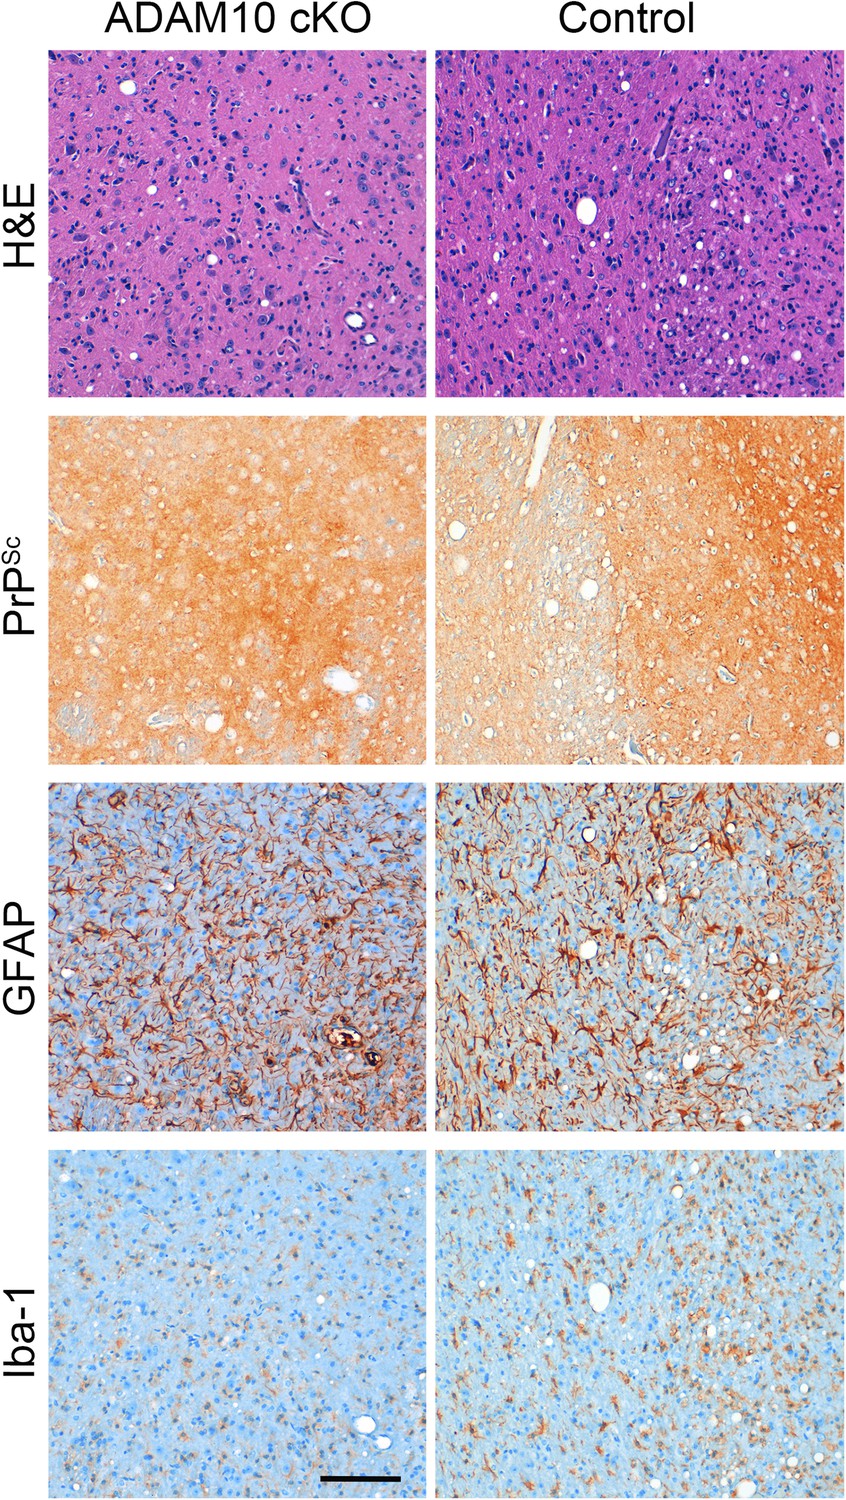
Neuropathological features in the thalamus of ADAM10 cKO and control mice.
Representative histological analysis in the thalamic brain region of terminally prion-diseased ADAM10 cKO and control mice including H&E staining and immunohistochemical detection of PrPSc, GFAP (for detection of astrocytes), and Iba-1 (for detection of microglia). Scale bar: 100 µm.
Figure 5—figure supplement 2
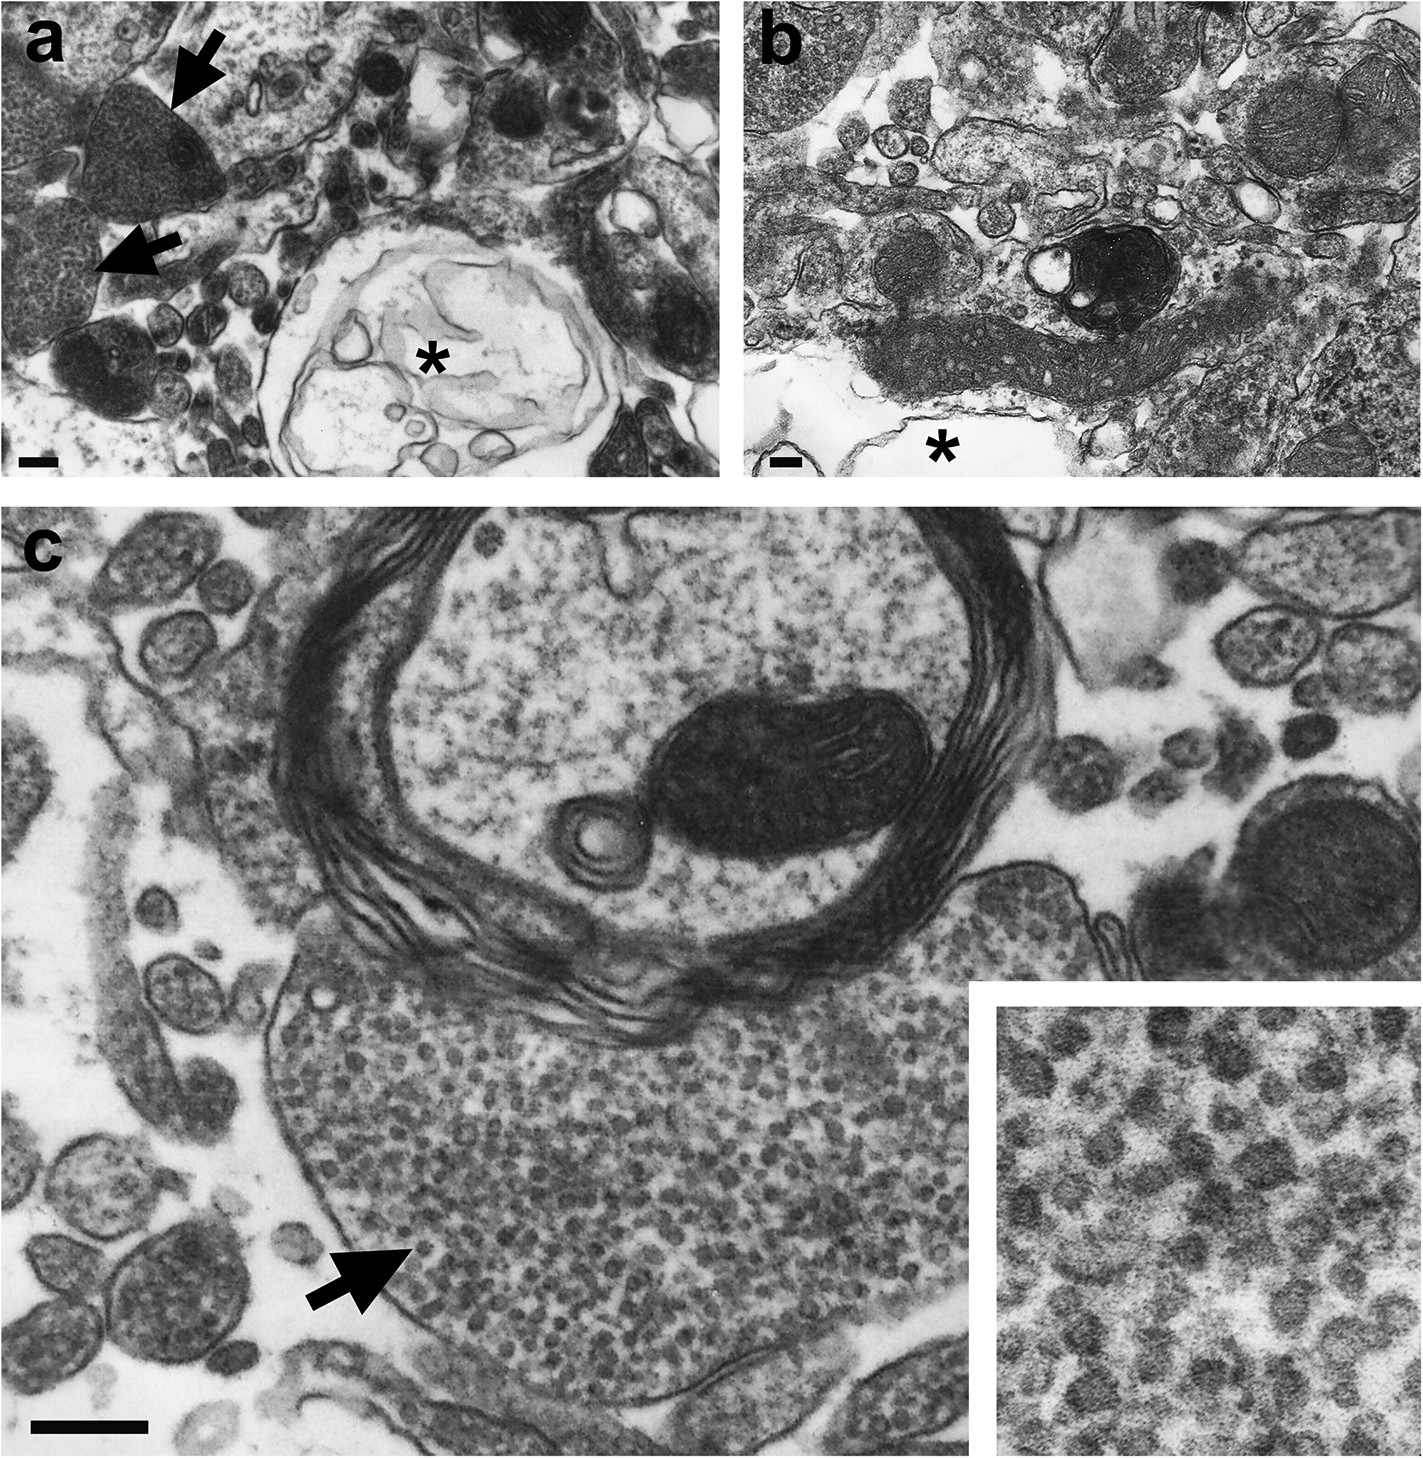
Electron microscopic analysis.
Overviews showing vacuolization (asterisks) in forebrain samples of ADAM10 cKO (A) and control mice (B) at a terminal stage of prion disease. High abundance of clusters containing tubulovesicular structures (TVS; arrows in (A) and (C)) was only found in terminal ADAM10 cKO brain (5 out of 13 square grids showed clusters of TVS whereas only 1 out of 15 square grids presented with TVS in terminal wild-type control mice). Scale bars represent 500 nm (A, B) or 200 nm (C). Inset in (C) shows magnification of TVS.
Figure 6 with 2 supplements
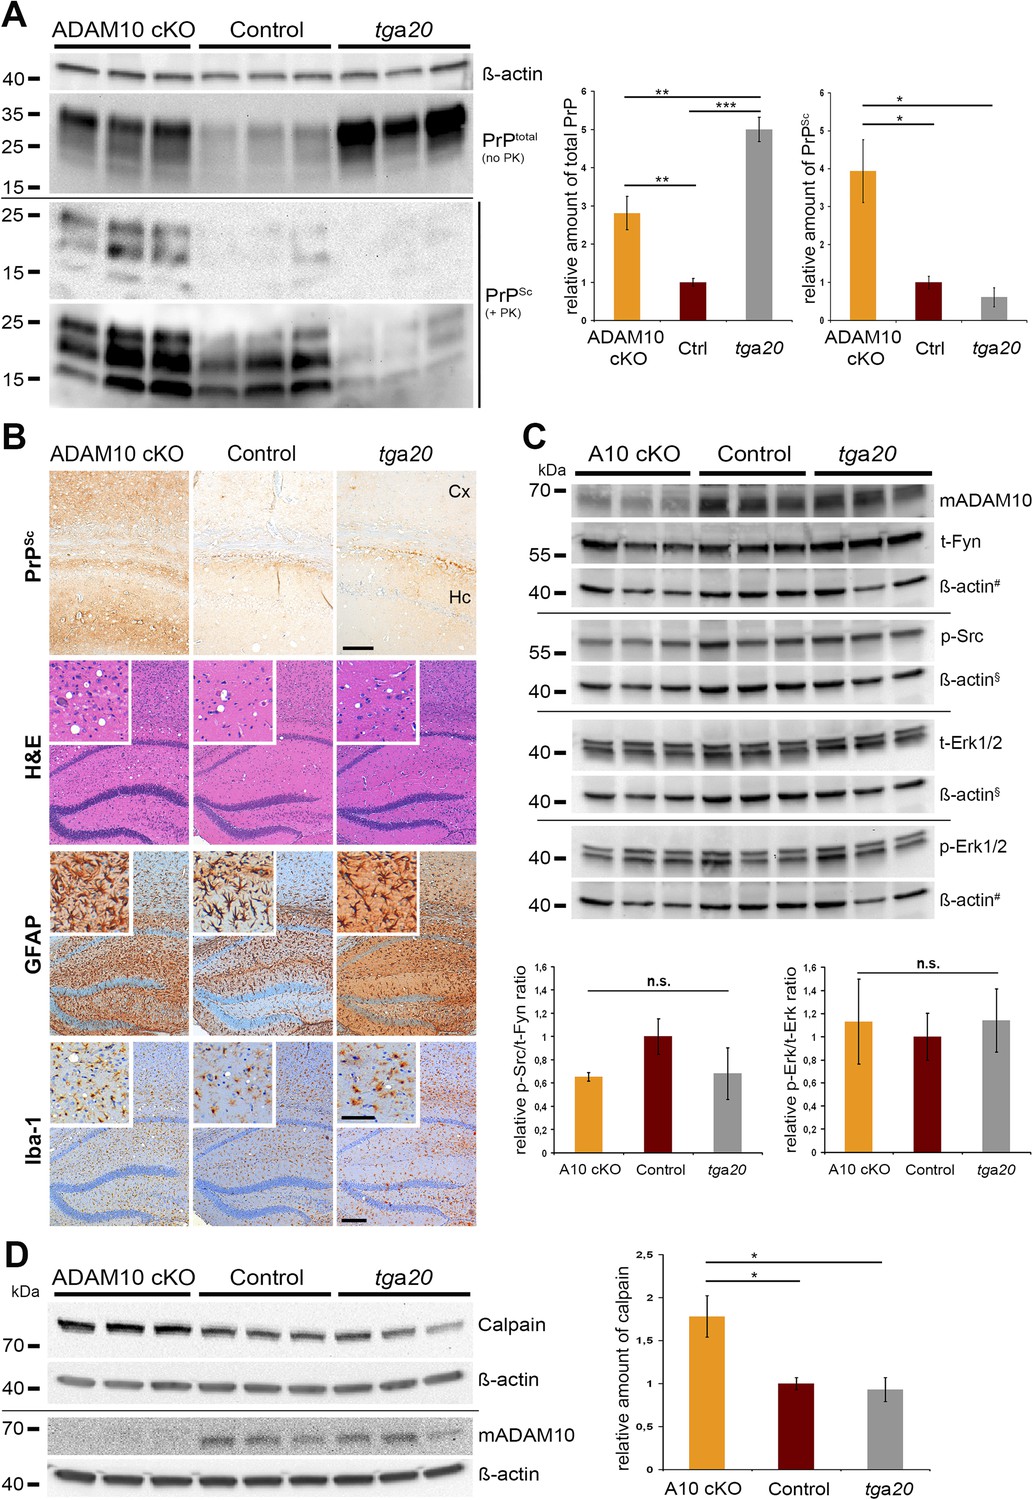
PrPSc formation, neuropathology, toxic signaling, and calpain levels at a matched time point.
(A) Assessment of total PrP (no proteinase K (PK)) and PrPSc amounts (+PK; blot is shown with short and longer exposition) by parallel replica Western blot analysis in forebrain homogenates of age-matched A10 cKO mice and littermate controls (both at 95 days post inoculation (dpi); n = 3 for each genotype) as well as terminally diseased tga20 mice (at 65 dpi; n = 3). Actin was detected in the undigested homogenates (no PK) and served as loading control. Densitometric quantification of relative protein amounts from two technical replicates is shown on the right. (B) Morphological analysis of neuropathological lesions in forebrains (showing hippocampal and cortical brain regions) of A10 cKO, littermate controls, and tga20 mice at the aforementioned time points (scale bars: 200 µm in overviews and 100 µm in insets and for PrPSc). (C) Biochemical assessment of candidate toxic signaling pathways showing protein levels of total Fyn (t-Fyn), phosphorylated (Tyr416) Src (p-Src) as well as total (t-Erk1/2) and phosporylated (Thr202/Tyr204) Erk1/2 (p-Erk1/2). Actin served as a loading control and for normalization (# and § indicate use of the same actins as corresponding signaling proteins were detected on the same Western blot). Quantitative densitometric analysis of relative p-Src/t-Fyn (left) and p-Erk/t-Erk ratio (right) (n.s. = not significant). (D) Representative Western blot analysis (left) and quantification of three technical replicates (right) of calpain levels in aforementioned samples. Levels of ADAM10 are shown in (C) and (D) to confirm the ADAM10 status. Error bars indicate SEM; *p <0.05; **p <0.01, ***p <0.001 (p values of Student's t-test are given in the main text).
Figure 6—figure supplement 1
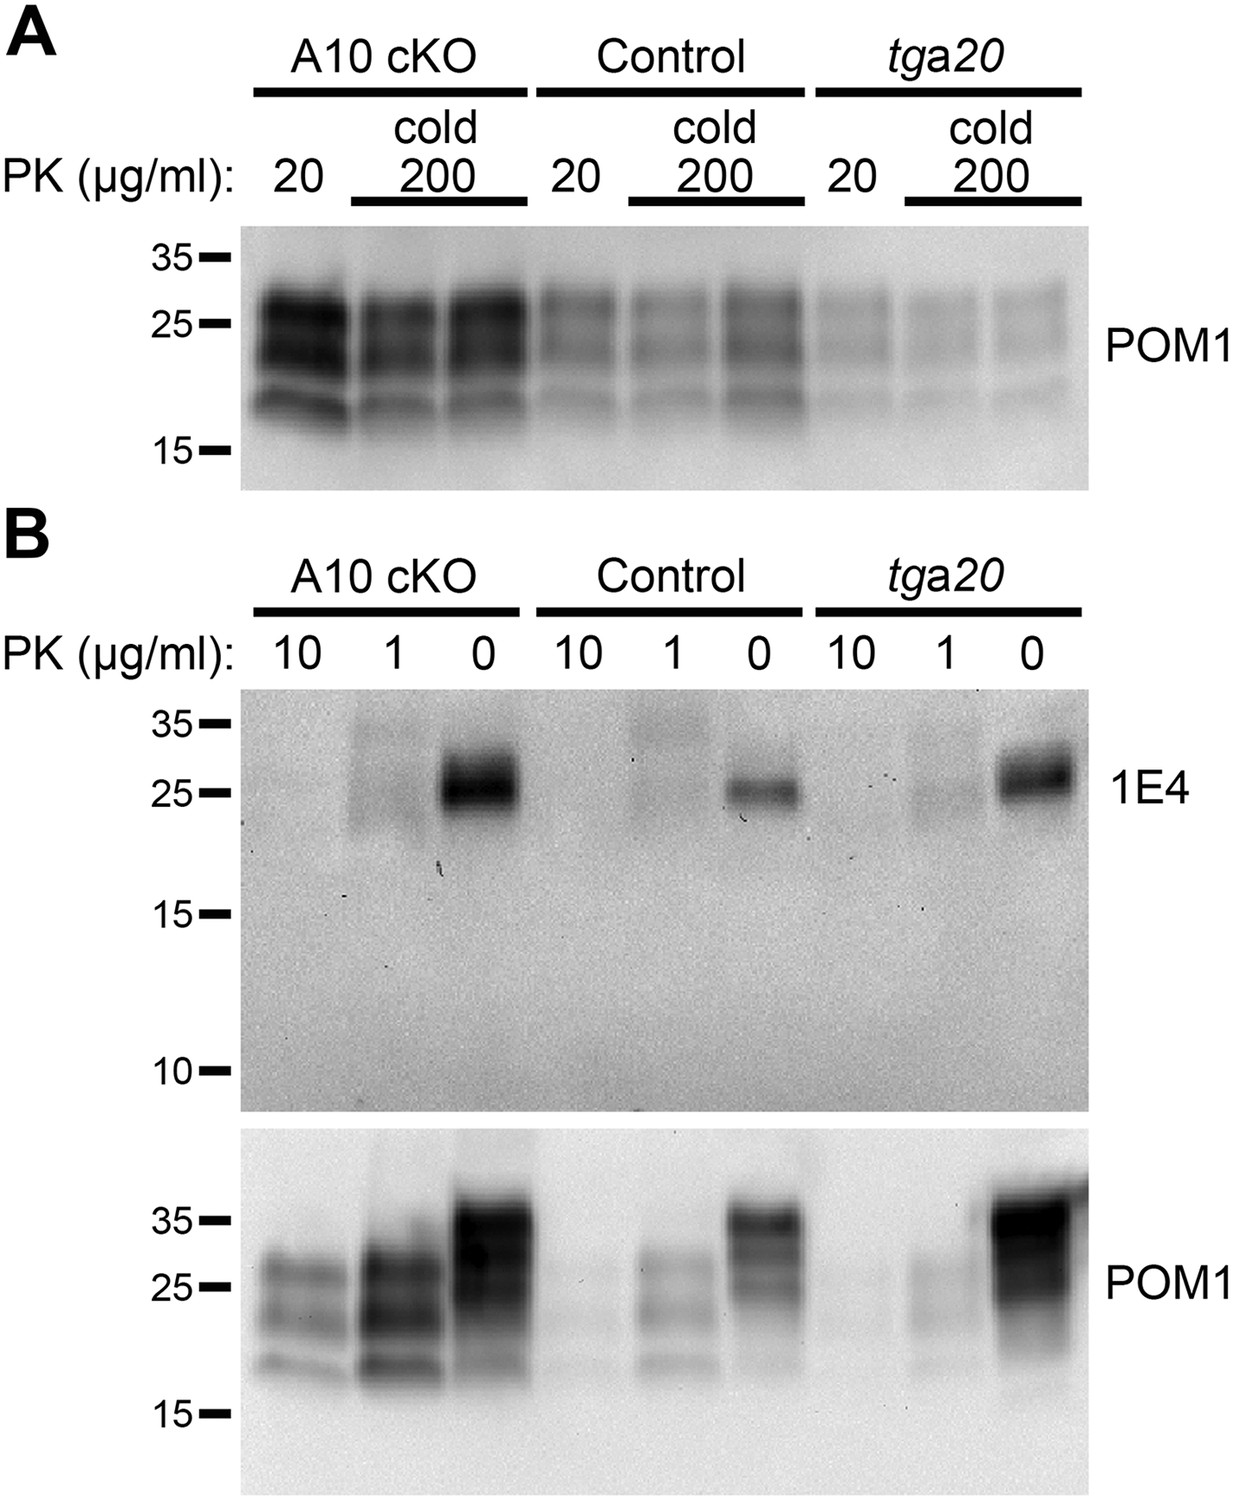
‘Cold proteinase K (PK)’ and partial PK digestion of forebrain samples from ADAM10 cKO, control and tga20 mice at 95 days post inoculation (dpi).
(A) Western blot analysis showing ‘cold PK’ digestions of forebrain homogenates from two animals per genotype with 200 µg/ml PK at 4°C for 1 hr compared with classical digestion with 20 µg/ml PK at 37°C. No atypical digestion pattern is detected. Antibody POM1 was used for detection. (B) Representative Western blot analysis of frontal brain homogenates incubated with decreasing amounts of PK or without PK. Blot was first incubated with 1E4 antibody and then re-probed with POM1. Apart from differences in total PrP and PrPSc amounts between the genotypes described in the main Figure 6, neither atypical bands nor low abundance or small PrP digestion fragments (∼10 kDa) are detected.
Figure 6—figure supplement 2
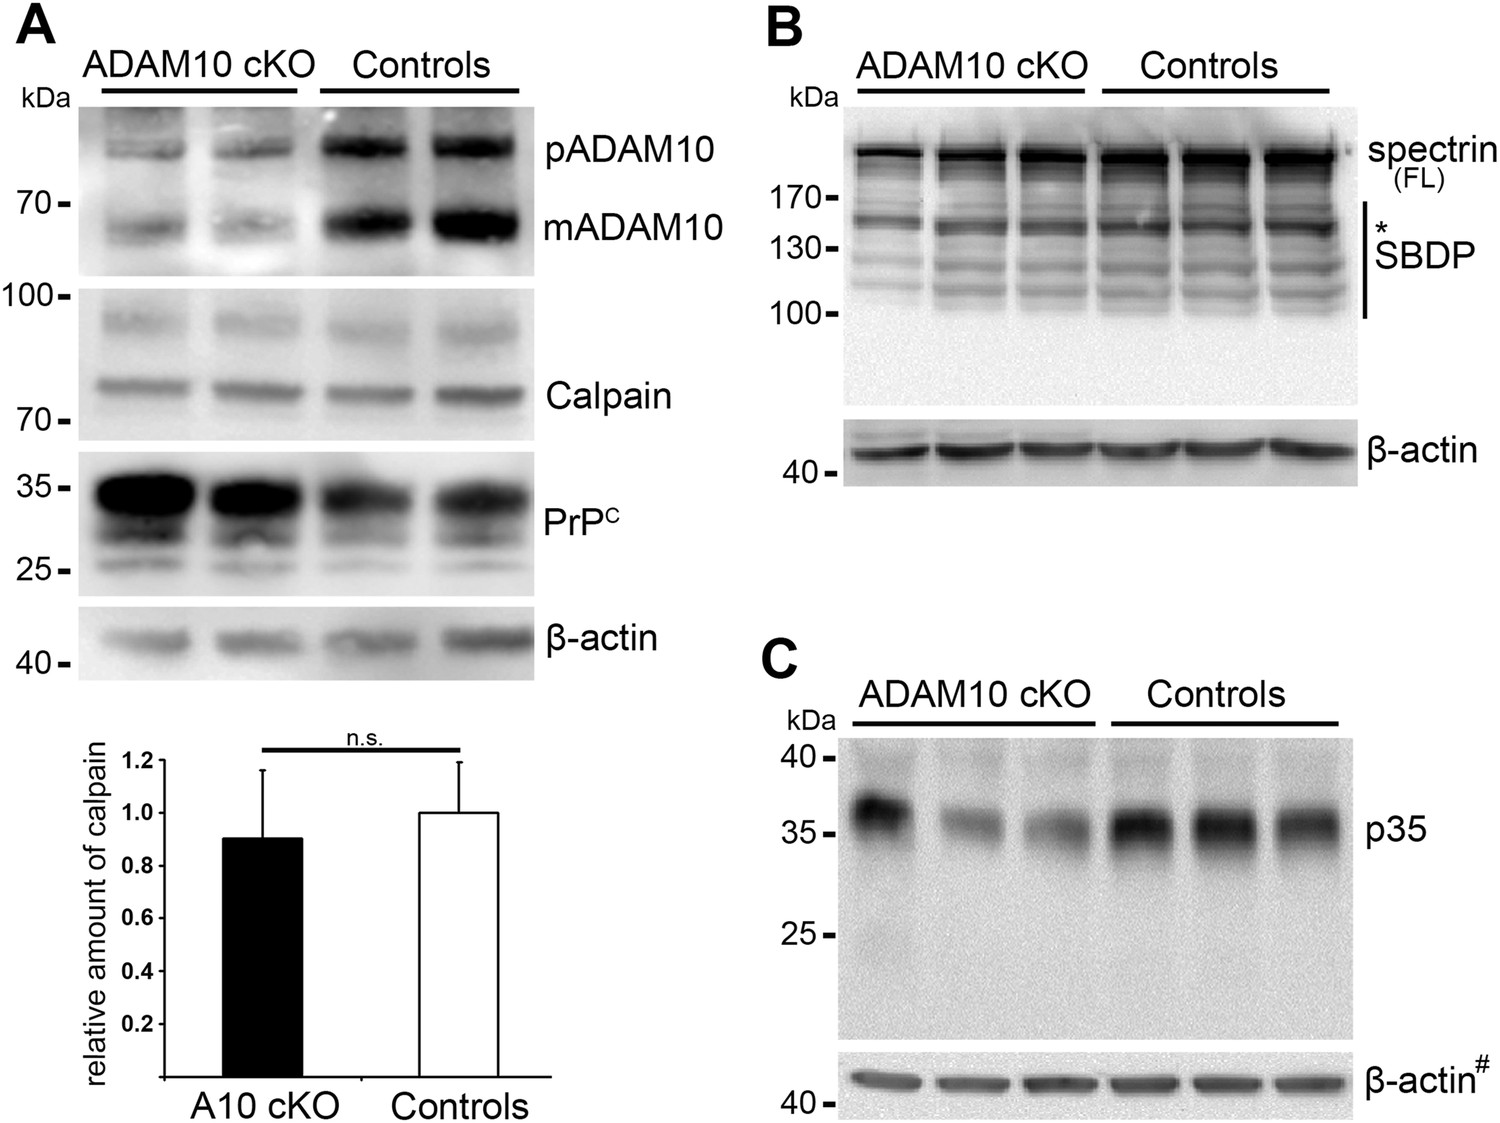
Calpain levels and calpain substrates in forebrain homogenates of ADAM10 cKO and control mice.
(A) Representative Western blot analysis of calpain expression in non-prion infected ADAM10 cKO and control mice. In addition, premature (pADAM10), mature ADAM10 (mADAM10) and PrPC were detected. Quantification of calpain levels by densitometric analysis of ADAM10 cKO (n = 4) and control mice (n = 5) is shown below. Actin served as loading control. (B) Western blot analysis of spectrin (FL = full length) and spectrin breakdown products (SBDP) in prion-infected ADAM10 cKO and control mice at 95 days post inoculation (dpi; n = 3 per genotype). FL spectrin was reduced in ADAM10 cKO mice whereas calpain-dependent SBDP (marked by asterisk at 150/145 kDa) were not increased. (C) Western blot analysis of p35 and p25 levels in prion-infected samples mentioned in (B). A reduction in p35 levels was found in two out of three ADAM10 cKO mice. A band corresponding to p25 was not detectable. # indicates that blots used for calpain detection (Figure 6D) were re-probed with an antibody against p35/p25 and thus the same actin signals were used as loading controls.
Figure 7
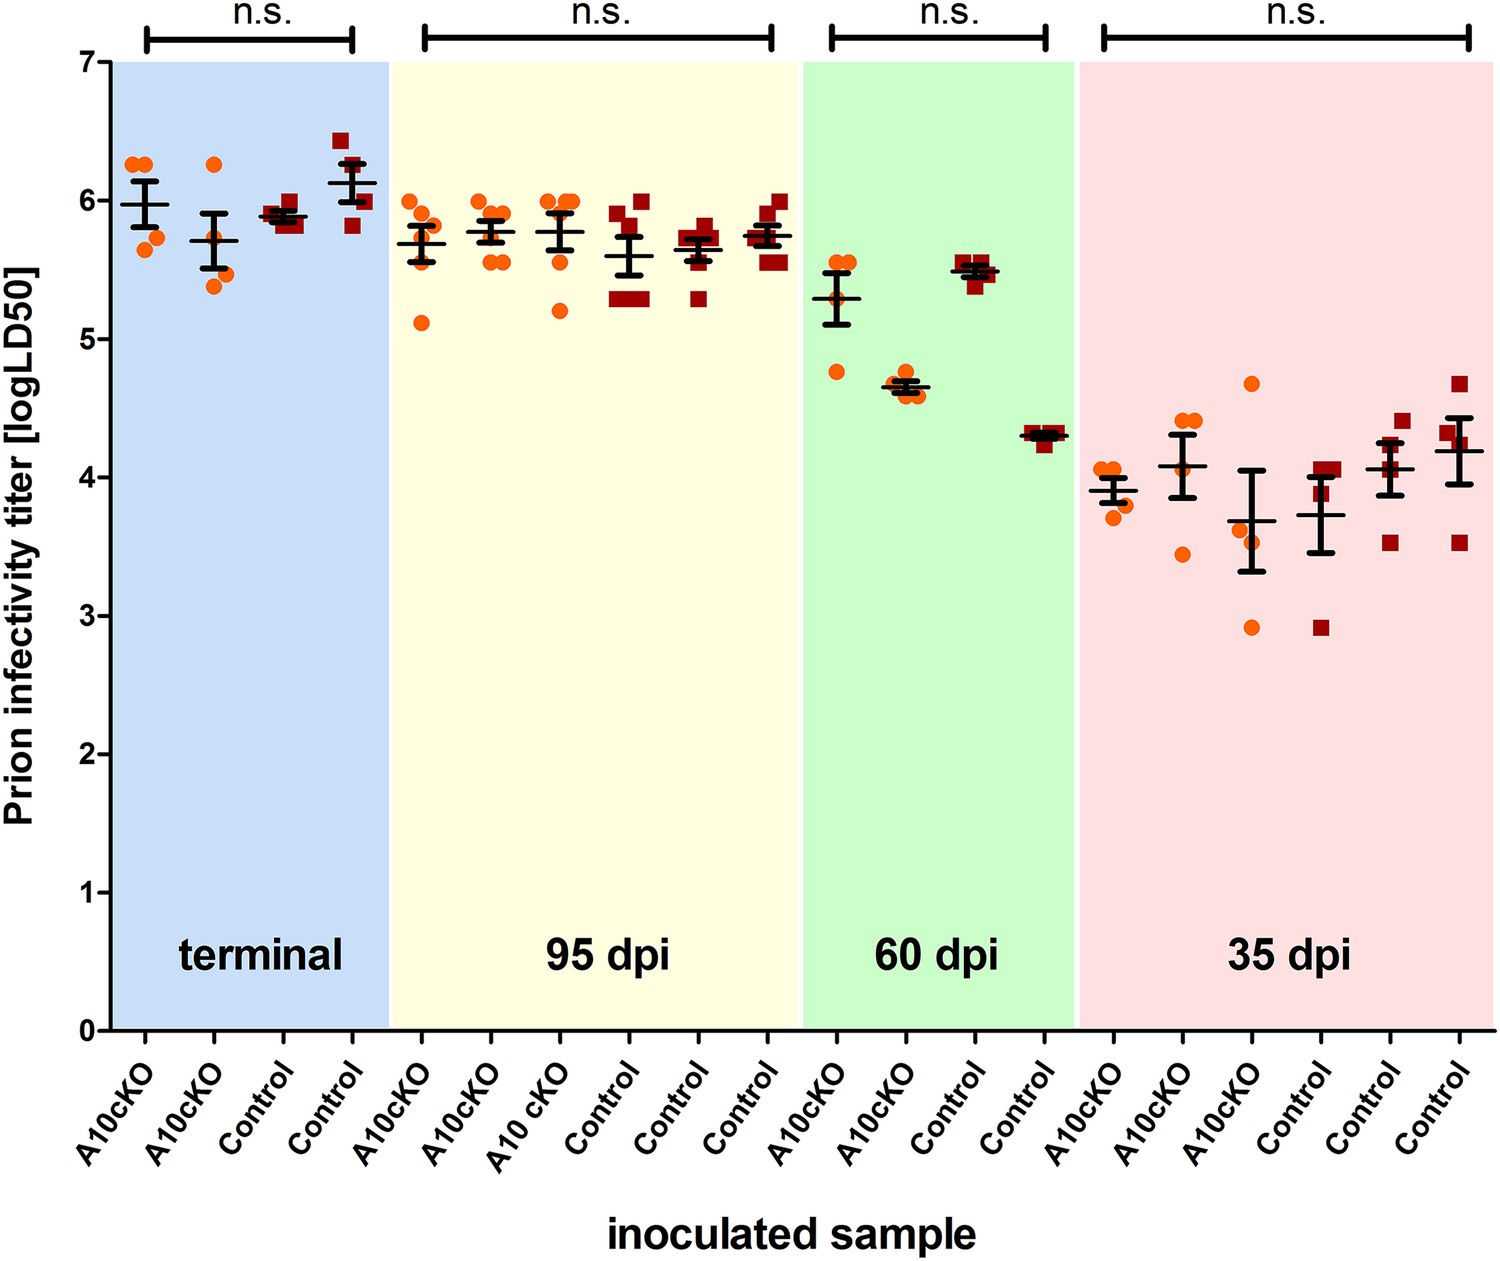
Titers of prion infectivity in terminally diseased and preclinical A10 cKO mice and controls.
Prion titers in forebrain homogenates of A10 cKO mice and littermate controls at terminal or matched (preclinical) time points (95 days post inoculation [dpi], 60 dpi, and 35 dpi) after prion inoculation as assessed by bioassays in tga20 reporter mice. Each dot indicates the titer (shown as logLD50) assessed in a single reporter mice. Bars indicate mean values from six (for the 95 dpi time point) or four (all other time points) tga20 mice. Error bars indicate SD.
Figure 8 with 1 supplement
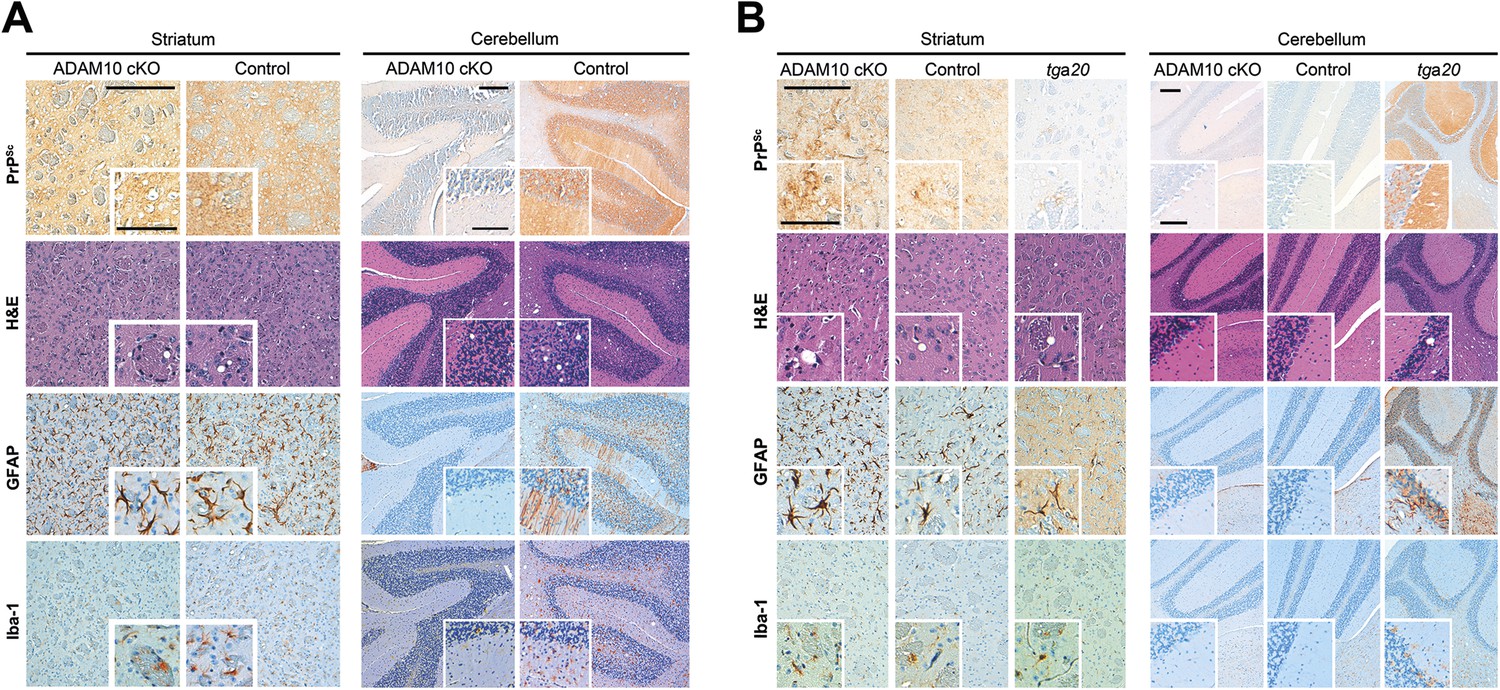
Spatiotemporal analysis of prion-associated pathology.
(A) Comparison of neuropathological features including PrPSc deposition, spongiotic changes (presented in H&E stainings), astrocyte (GFAP) and microglia (Iba-1) activation in striatum (as a site in close proximity to prion inoculation) and cerebellum (resembling a brain area distant to prion inoculation) in A10 cKO and littermate control mice at a terminal stage of prion disease (i.e., ∼103 days post inoculation [dpi] for A10 cKO and ∼146 dpi for controls). While similar pathological alterations were observed in the striatum of both genotypes, prion-associated lesions in the cerebellum were almost absent in A10 cKO mice. (B) At a matched time point (95 dpi for A10 cKO and littermate controls; 65 dpi [i.e., terminal disease] for tga20), prion-related pathology was found in the striatum of all genotypes analyzed. As described earlier for the cortex and hippocampus (Figure 6), differences in PrPSc amounts could also be observed in the striatum. In the cerebellum of both time-matched A10 cKO mice and littermate controls, prion-associated lesions were largely absent whereas tga20 mice showed all relevant neuropathological features already at 65 dpi. Representative pictures for at least three animals per genotype and time point are shown. Scale bars represent 200 µm (overviews) or 100 µm (insets).
Figure 8—figure supplement 1
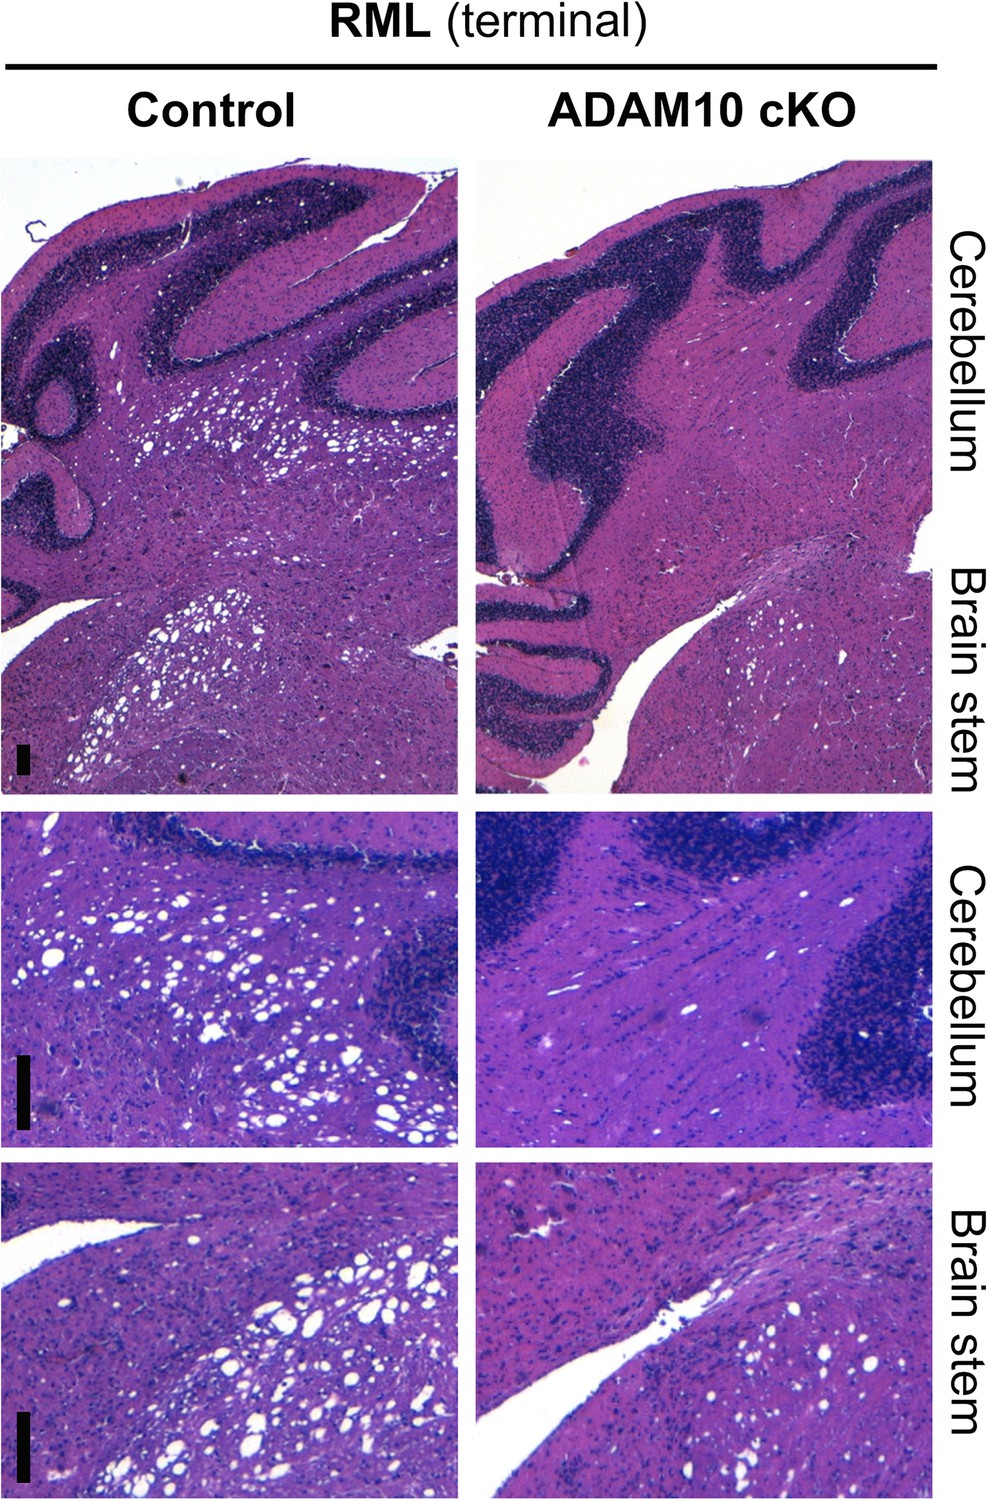
Spongiosis in brain stem and cerebellum of ADAM10 cKO and control mice.
Representative histological analysis of spongiotic vacuolization as revealed by H&E staining of the cerebellum and brain stem of terminally prion-diseased control and ADAM10 cKO mice. Upper row shows overview and lower two rows show higher magnifications of cerebellum and brain stem (scale bars represent 100 µm).
Figure 9

Model of the dual role of ADAM10-mediated shedding in prion disease.
ADAM10 regulates PrPC levels at the plasma membrane and releases almost full length PrP into the extracellular space. Thereby it affects (i) neurotoxicity, (ii) PrPSc formation, and (iii) spreading of prion pathology. (i) Lack of ADAM10 (as assessed here by use of A10 cKO mice) results in elevated PrPC membrane levels. Membrane levels of PrPC (as a receptor) likely determine PrPSc-associated neurotoxicity (as indicated by sizes of thunderbolts and skulls) and thereby incubation times with shortest survival in tga20 mice and reduced incubation times in A10 cKO mice compared with wild-type littermates with longest survival (order reflected by grey triangles on the left). (ii) Shed PrP, which is most efficiently produced in tga20 and absent in A10 cKO mice, might block formation of PrPSc. This is reflected by the different PrPSc amounts found in our different experimental groups (A10 cKO > wild-type littermates > tga20). The combination of increased PrPC membrane levels and PrPSc formation in A10 cKO mice might favor increased production of membrane pores (as indicated in the middle row on the left) and neurotoxic Ca2+ influx with possible (‘?’) involvement of calpain. (iii) Finally, spread of prion-associated pathology within the brain also seems to be affected by the levels of ADAM10 expression since tga20 mice showed enhanced whereas A10 cKO mice showed reduced dissemination of neuropathological features (as indicated by size of arrowheads on the right). Key references supporting this model are given in the text. Based on this model, stimulation of ADAM10 might therefore offer a treatment option. With regard to incubation times, protective effects by reducing local membrane bound PrPC amounts and by producing a protective soluble fragment able to block PrPSc formation seem to predominate the disadvantage of increased spread by production of anchorless prions.
Author response image 1

Increased PrPC surface levels in primary neurons of tga20 mice. Western blot analysis of lysates (on the left) and biotinylated surface proteins (on the right) of primary neurons from E14 embryos of tga20 and C57BL/6 wild-type mice. Flotillin served as a loading control. Quantification of densitometric analysis of surface PrPC is shown below. C57BL/6 set to 1 (+/-0.1 SEM); tga20: 3.1 +/-0.5; n=6 samples per genotype from 2 independent experiments; **p=0,007).
Videos
Video 1
Clinical presentation of a prion-infected ADAM10 cKO and littermate control mouse at 95 days post inoculation (dpi).
Terminally diseased ADAM10 cKO mouse (cage on the left) directly prior to termination of the experiment showing lack of nest-building behaviour and late hypoactivity whereas a wild-type littermate (cage on the right) matched for dpi presents with a regular nest and normal activity.
Tables
Table 1
Clinical presentation of A10 cKO, littermate control and tga20 mice inoculated with RML prions
| RML prions | CD1 mock | ||||
|---|---|---|---|---|---|
| Clinical manifestations | A10 cKO (n = 7) | Controls (n = 8) | tga20 (n = 8) | A10 cKO (n = 5) | Controls (n = 11) |
| First clinical signs (dpi) | 68 (±3.5) | 106 (±2.5) | n.a. | None | None |
| Duration of clinical signs (d) | 35 (±3.8) | 40 (±2.4) | n.a. | - | - |
| Time to terminal disease (dpi) | 103 (±6.6) | 146 (±2.1) | 62 (±2.8) | * | * |
| Progression of signs | Steady | Steady | Rapid | – | – |
| Quitting of nest-building | All | All | All | – | – |
| Ungroomed coat | Most (6/7) | Most (6/8) | Rare (2/8) | – | – |
| Stiff tail | All | Most (7/8) | Most (5/8) | – | – |
| Gait disturbance | All | All | All | – | – |
| Hind leg paresis | Rare (2/7) | Rare (3/8) | Most (7/8) | – | – |
| Kyphosis | Most (6/7) | Most (6/8) | Rare (3/8) | – | – |
| Weight loss | All | All | Most (6/8) | – | – |
| Late hypoactivity | All | All | Most (5/8) | – | – |
-
Negative controls included A10 cKO and littermate controls inoculated with CD1 brain homogenates (mock). Asterisks indicate that CD1 mock-inoculated animals were sacrificed at 200 days post inoculation (dpi) without any clinical signs.
Download links
A two-part list of links to download the article, or parts of the article, in various formats.
Downloads (link to download the article as PDF)
Open citations (links to open the citations from this article in various online reference manager services)
Cite this article (links to download the citations from this article in formats compatible with various reference manager tools)
The sheddase ADAM10 is a potent modulator of prion disease
eLife 4:e04260.
https://doi.org/10.7554/eLife.04260


