The sheddase ADAM10 is a potent modulator of prion disease
- University Medical Center Hamburg-Eppendorf, Germany
- Christian Albrechts University, Germany
- Medical University Lodz, Poland
Abstract
The prion protein (PrPC) is highly expressed in the nervous system and critically involved in prion diseases where it misfolds into pathogenic PrPSc. Moreover, it has been suggested as a receptor mediating neurotoxicity in common neurodegenerative proteinopathies such as Alzheimer's disease. PrPC is shed at the plasma membrane by the metalloprotease ADAM10, yet the impact of this on prion disease remains enigmatic. Employing conditional knockout mice, we show that depletion of ADAM10 in forebrain neurons leads to posttranslational increase of PrPC levels. Upon prion infection of these mice, clinical, biochemical, and morphological data reveal that lack of ADAM10 significantly reduces incubation times and increases PrPSc formation. In contrast, spatiotemporal analysis indicates that absence of shedding impairs spread of prion pathology. Our data support a dual role for ADAM10-mediated shedding and highlight the role of proteolytic processing in prion disease.
https://doi.org/10.7554/eLife.04260.001eLife digest
Prion proteins are anchored to the surface of brain cells called neurons. Normally, prion proteins are folded into a specific three-dimensional shape that enables them to carry out their normal roles in the brain. However, they can be misfolded into a different shape known as PrPSc, which can cause Creutzfeldt-Jakob disease and other serious conditions that affect brain function and ultimately lead to death.
The PrPSc proteins can force normal prion proteins to change into the PrPSc form, so that over time this form accumulates in the brain. They are essential components of infectious particles termed ‘prions’ and this is why prion diseases are infectious: if prions from one individual enter the brain of another individual they can cause disease in the recipient. The UK outbreak of variant Creutzfeldt-Jakob disease in humans in the 1990s is thought to be due to the consumption of meat from cattle with a prion disease known as mad cow disease.
An enzyme called ADAM10 can cut normal prion proteins from the surface of neurons. However, it is not clear whether ADAM10 can also target the PrPSc proteins and what impact this may have on the development of prion diseases.
Here, Altmeppen et al. studied mutant mice that were missing ADAM10 in neurons in the front portion of their brain. These mice had a higher number of normal prion proteins on the surface of their neurons than normal mice did. When mice missing ADAM10 were infected with prions, more PrPSc accumulated in their brain and disease symptoms developed sooner than when normal mice were infected. This supports the view that mice with higher numbers of prion proteins are more vulnerable to prion disease. However, disease symptoms did not spread as quickly to other parts of the brain in the mice missing ADAM10. This suggests that by releasing prion proteins from the surface of neurons, ADAM10 helps PrPSc proteins to spread around the brain.
Recently, it has been suggested that prion proteins may also play a role in Alzheimer's disease and other neurodegenerative conditions. Therefore, Altmeppen et al.'s findings may help to develop new therapies for other forms of dementia. The next challenge is to understand the precise details of how ADAM10 works.
https://doi.org/10.7554/eLife.04260.002Introduction
The cellular prion protein (PrPC) is a glycosylphosphatidylinositol (GPI)-anchored lipid raft constituent highly expressed in neurons of the central nervous system (CNS). Misfolding of PrPC into its pathogenic isoform, PrPSc, occurs by a self-perpetuating process of templated conformational conversion and causes transmissible and invariably fatal prion diseases (Prusiner, 1982). In these diseases, PrPC not only represents the substrate for conversion but also a prerequisite of prion-associated neurotoxicity (Büeler et al., 1993; Brandner et al., 1996; Mallucci et al., 2003). In contrast to PrPC, PrPSc is prone to aggregation and is characterized by a high β-sheet content and partial resistance to digestion with proteinase K (PK). Moreover, PrPSc constitutes an essential component of infectious prion particles or ‘prions’ (Prusiner, 1982; Silveira et al., 2005).
Recently, a central role in more common proteinopathies, such as Alzheimer's disease (AD), has been attributed to PrPC where it was shown to act as a neuronal receptor for neurotoxic amyloid-β (Aβ) oligomers (Lauren et al., 2009; Dohler et al., 2014) and a variety of other disease-associated β-sheet rich protein assemblies including PrPSc (Resenberger et al., 2011). Despite some degree of controversy regarding this receptor function and its relevance in AD (Balducci et al., 2010; Benilova and De Strooper, 2010; Calella et al., 2010; Kessels et al., 2010), binding of pathogenic oligomers to the flexible N-terminus of PrPC is thought to initiate a cascade of events that mediates their neurotoxicity and results in synaptic degeneration and neuronal loss (Resenberger et al., 2011; Larson et al., 2012; Um et al., 2012).
PrPC is subject to two conserved proteolytic cleavage events under physiological conditions, termed α-cleavage and shedding (Borchelt et al., 1993; Harris et al., 1993; Chen et al., 1995; Mange et al., 2004). These cleavages likely influence physiological functions of PrPC (Aguzzi et al., 2008; Linden et al., 2008) and, importantly, its role in neurodegenerative diseases (reviewed in Altmeppen et al., 2013). While α-cleavage, occurring in the middle of the PrPC sequence and producing a soluble N1 and a membrane-attached C1 fragment, confers neuroprotection with regard to prion diseases (Lewis et al., 2009; Westergard et al., 2011; Turnbaugh et al., 2012; Campbell et al., 2013) and Aβ-associated neurotoxicity (Guillot-Sestier et al., 2009; Resenberger et al., 2011; Beland et al., 2012; Guillot-Sestier et al., 2012; Fluharty et al., 2013), the role of an extreme C-terminal cleavage in close proximity to the plasma membrane, termed shedding, remains enigmatic. On the one hand, by reducing the substrate for prion conversion and the receptor for neurotoxicity, this proteolytic release of almost full length PrPC from the plasma membrane could be protective with regard to prion diseases (Marella et al., 2002; Heiseke et al., 2008; Altmeppen et al., 2012). Moreover, recombinant or transgenically expressed anchorless PrPC mimicking shed PrPC has been shown to antagonize both PrPSc propagation and Aβ neurotoxicity, respectively, thus indicating a protective activity by blocking toxic conformers and preventing their access to the cell (Meier et al., 2003; Calella et al., 2010; Nieznanski et al., 2012; Fluharty et al., 2013; Yuan et al., 2013). On the other hand, shedding could accelerate an ongoing prion disease by increasing production and subsequent spread of anchorless prions within the CNS. In fact, PrPSc can be shed from the cellular surface in vitro (Taylor et al., 2009) and anchorless PrPC can, in principle, be converted to PrPSc, resulting in an altered type of prion disease in transgenic mice (Chesebro et al., 2005, 2010). High expression of anchorless PrPC leads to formation of prions and a late onset neurological disease (Stöhr et al., 2011).
While the in vivo identity of the protease(s) responsible for the α-cleavage of PrPC remains a matter of controversy (Vincent et al., 2001; Tveit et al., 2005; Taylor et al., 2009; Oliveira-Martins et al., 2010; Altmeppen et al., 2011, 2012; Beland et al., 2012; Liang et al., 2012; Wik et al., 2012; Mays et al., 2014; McDonald et al., 2014), we recently showed that a disintegrin and metalloproteinase ADAM10 is the relevant sheddase of PrPC in vivo (Altmeppen et al., 2011), as previously suggested (Parkin et al., 2004; Taylor et al., 2009) and subsequently confirmed (Wik et al., 2012; Ostapchenko et al., 2013; McDonald et al., 2014) by in vitro experiments of others. Using conditional NestinADAM10 knockout mice (Jorissen et al., 2010), we recently showed that depletion of the protease in neural precursors abolishes shedding and leads to posttranslational accumulation of PrPC in the early secretory pathway indicative of a regulatory role of ADAM10 in PrPC membrane homeostasis (Altmeppen et al., 2011). However, due to the perinatal lethality of these mice, the influence of ADAM10 on the course of prion disease remained unsolved. In this study we used novel viable ADAM10 conditional knockout (ADAM10 cKO or A10 cKO) mice with specific postnatal deletion of the protease in forebrain neurons (Prox et al., 2013). We show that lack of ADAM10 leads to (i) elevated (membrane) levels of PrPC, (ii) drastically shortened incubation times of prion disease, (iii) increased prion conversion, and (iv) upregulation of calpain levels. In contrast, spread of prion-associated pathology within the brain was reduced. It is intriguing that the absence of a protease involved in the constitutive processing of PrPC significantly impacts the course of prion disease, thus enforcing the relevance of proteolytic processing events in neurodegeneration.
Results
Increased (membrane) levels and lack of shedding of PrPC in different cellular models of ADAM10 depletion
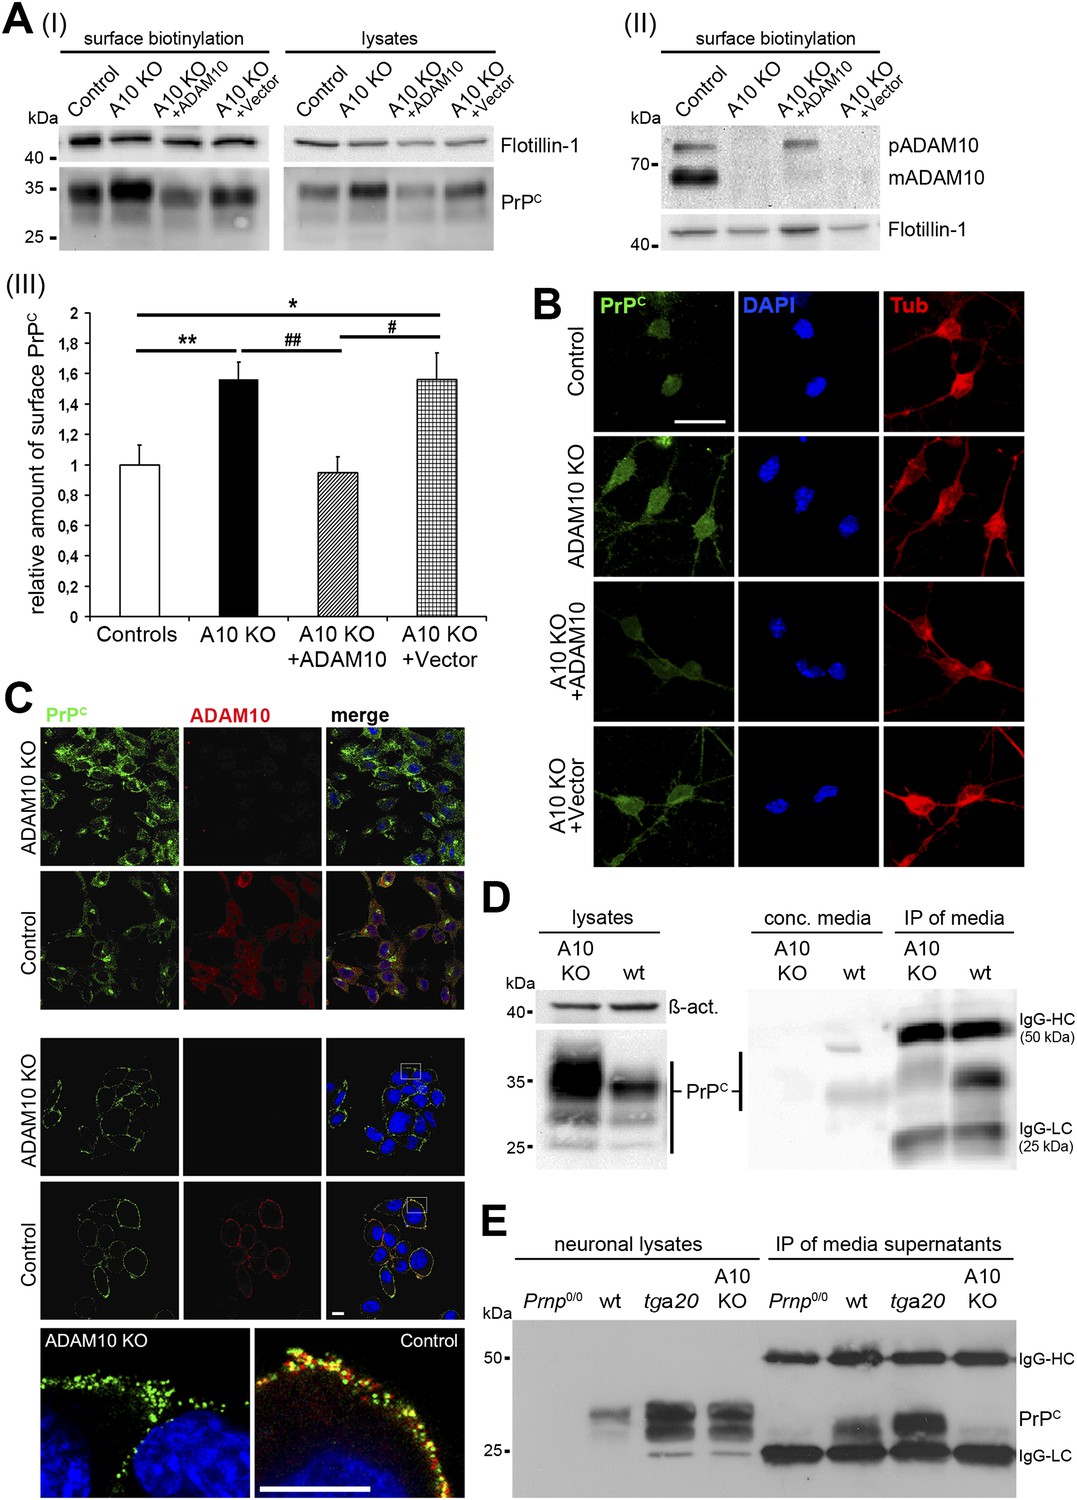
Maintenance of plasma membrane levels of PrPC by ADAM10-mediated shedding may represent a conserved mechanism in different cellular lineages. To further investigate this we generated neural stem cells (NSCs) from embryonic day (E) 14 wild-type and A10 cKO mice with inactivation of the Adam10 gene in neuroectodermal progenitor cells (NestinA10 KO mice) (Jorissen et al., 2010). As shown in Figure 1A, surface biotinylation experiments on neuronally differentiated NSCs revealed that membrane levels of PrPC were increased 1.56-fold (±0.12; SEM) in the absence of ADAM10 (n = 9 independent samples) compared with wild-type controls (set to 1 ± 0.13; n = 9). Moreover, genetic reintroduction of Adam10 into NSC cultures of NestinA10 KO mice was sufficient to reduce membrane levels of PrPC (0.95 ± 0.11; n = 8) and thus to restore physiological wild-type conditions. Nucleofection of NestinA10 KO cells with a vector lacking the Adam10 cDNA did not show any effect on PrPC membrane levels (1.55 ± 0.18; n = 5). Indirect immunofluorescence analyses of non-permeabilized neuronally differentiated NSCs confirmed the biochemical results by showing increased intensity of PrPC surface immunostaining in NestinA10 KO cells and NestinA10 KO cells nucleofected with a control vector compared with wild-type control cells, and a similar intensity of PrPC surface immunostaining in A10-nucleofected NestinA10 KO and control cells (Figure 1B).
Figure 1
Characterization of PrPC levels in different cellular models of ADAM10 deficiency.
(A) Representative Western blots showing membrane levels of PrPC as revealed by surface biotinylation (I; on the left) and total PrPC levels in lysates (I; on the right) as well as ADAM10 surface expression (II) of neuronally differentiated neural stem cells (NSCs) from NestinA10 KO and littermate control mice and after genetic reintroduction of Adam10 (A10 KO + ADAM10) or nucleofection with control vector (A10 KO + Vector) into NSCs of NestinA10 KO mice. Flotillin served as loading control. (III) Quantification of densitometric analysis of PrPC membrane levels of experimental groups mentioned above (n = 9 independent samples for controls [set to 1]; n = 9 for NestinA10 KO; n = 8 for NestinA10 KO + ADAM10; n = 5 for NestinA10 KO + Vector; significance: **p = 0.0054; ##p = 0.0014; *p = 0.0336 ; #p = 0.0212). Error bars indicate SEM. (B) Representative immunofluorescent PrPC (green) surface staining of neuronally differentiated NSCs derived from NestinA10 KO (without [second row] or with genetic reintroduction of ADAM10 [third row] or vector only [fourth row]) and littermate control mice (first row), respectively. Tubulin (red) was stained after permeabilization of cells to confirm neuronal differentiation of NSCs. DAPI (blue) marks nuclei. (C) Representative immunostaining of PrPC (green) and ADAM10 (red) in permeabilized (upper two rows) and non-permeabilized (lower three rows) murine embryonic fibroblasts (MEFs) derived from mice with a complete knockout of ADAM10 (ADAM10 KO) or wild-type mice (control). Higher resolution of white boxes is shown in the bottom row and reveals colocalization of PrPC and ADAM10 at the plasma membrane of wild-type control MEFs. Scale bars in B and C represent 10 µm. (D) Western blot analysis of cell-associated PrPC levels in ADAM10 knockout (A10 KO) and wild-type (wt) MEF lysates (left part: actin served as loading control). Levels of shed PrPC were assessed in cell culture media supernatants of ADAM10 knockout and wild-type MEFs by filter column concentration (conc. media) and immunoprecipitation (IP) with a PrPC-specific antibody respectively (right part). (E) Levels of cell-associated (neuronal lysates) and shed PrPC (IP of media supernatants) in primary neuronal cultures of prion protein knockout (Prnp0/0), wild-type (wt; C57BL/6), prion protein overexpressing (tga20), and NestinA10 KO mice at embryonic day 14. IgG-HC and IgG-LC mark signals for heavy and light chain of the capturing antibody POM2.
In addition, we analyzed murine embryonic fibroblasts (MEFs) derived from mice with a complete knockout of ADAM10 (Hartmann et al., 2002) with regard to PrPC levels (Figure 1C and D). As expected, we found increased total PrPC levels in ADAM10 knockout MEFs by (i) immunofluorescence analysis of permeabilized cells (Figure 1C, upper part) and (ii) Western blot assessment of MEF lysates (Figure 1D, left part). In non-permeabilized wild-type MEFs, colocalization could be observed between the protease ADAM10 and its substrate PrPC at the plasma membrane (Figure 1C, bottom row). Next, we directly investigated the shedding of PrPC in ADAM10 knockout and wild-type MEFs by biochemical analysis of culture supernatants. Results obtained with concentrated media and with immunoprecipitation of shed PrPC from media showed that shedding is impaired in ADAM10 knockout MEFs compared with wild-type MEFs (Figure 1D, right part).
Finally, we assessed PrPC levels and the shedding of PrPC in primary neurons of NestinA10 KO and wild-type control mice as well as in mice deficient for PrPC (Prnp0/0) and in PrPC overexpressing Tg(Prnp)a20 mice (known and hereafter referred to as tga20) (Figure 1E). Confirming our previous study (Altmeppen et al., 2011), shedding of PrPC was absent in NestinA10 KO neurons while tga20 neurons showed increased levels of shed PrPC compared with wild-type controls.
Taken together, data obtained from different murine cellular models having a deletion of Adam10 confirmed the role of this protease as the functionally relevant sheddase of PrPC and, thus, as a regulator of PrPC membrane homeostasis.
Lack of ADAM10 in neurons of the forebrain results in increased levels of PrPC
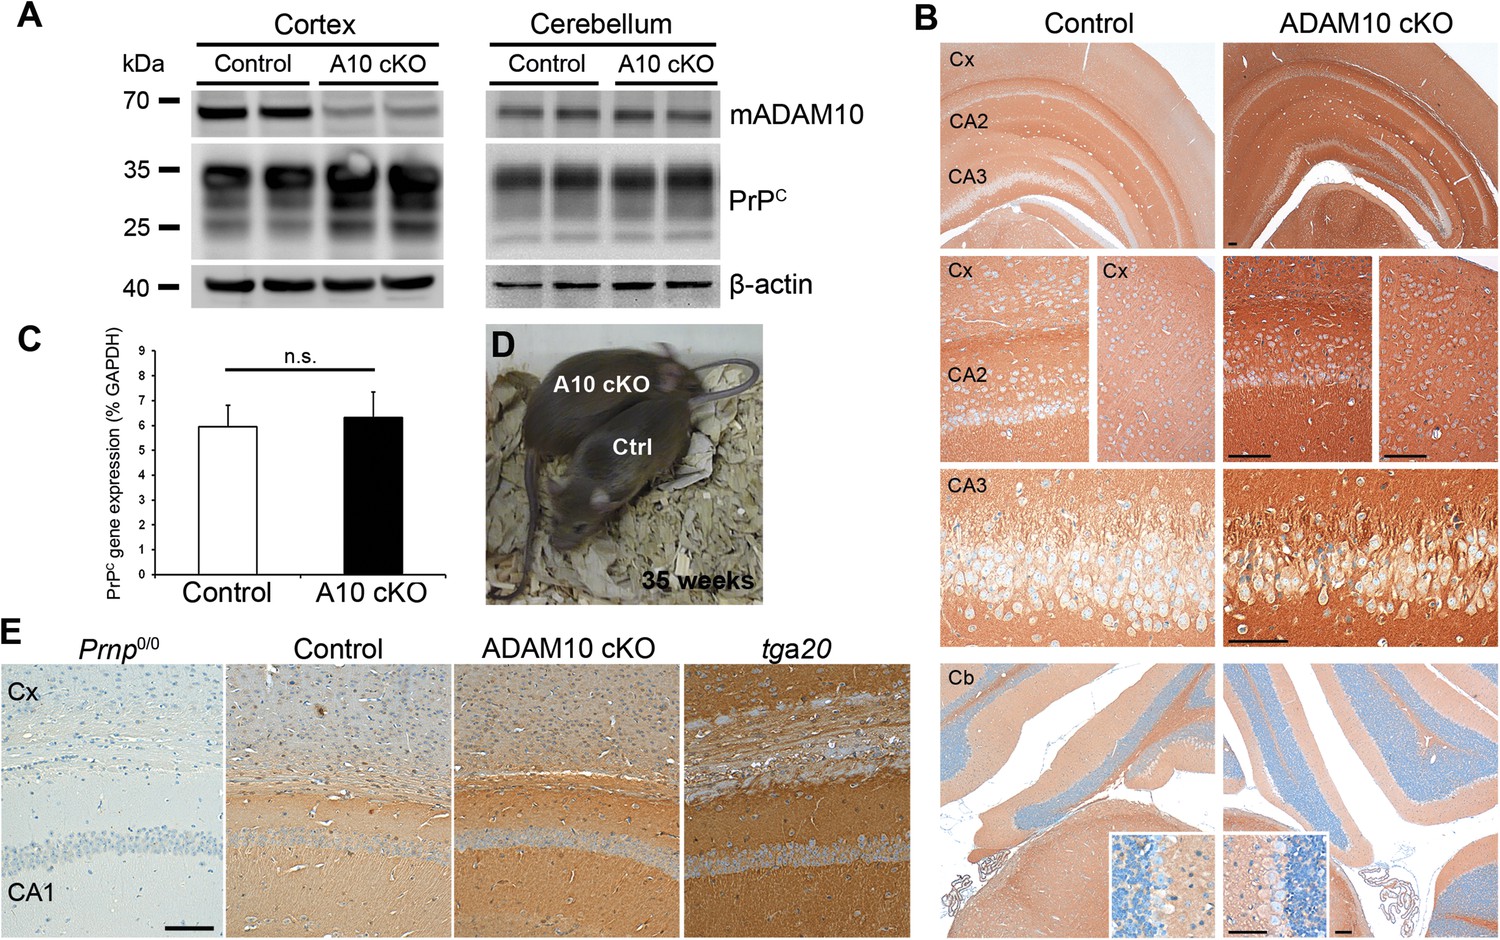
Using conditional NestinA10 knockout mice, we previously showed that lack of ADAM10-mediated shedding leads to increased neuronal levels of PrPC (Altmeppen et al., 2011). However, due to the perinatal lethality of these mice we were unable to investigate the impact of ADAM10 deficiency on the course of prion disease. Therefore, new conditional Camk2aADAM10 knockout mice (ADAM10 cKO or A10 cKO) lacking Adam10 in neurons of the forebrain were produced and characterized (Prox et al., 2013). These mice were viable and used for prion inoculations performed in this study. First, we analyzed PrPC levels in A10 cKO and littermate controls at postnatal day (P) 19. Reduction of ADAM10 expression was accompanied by increased PrPC amounts as revealed by Western blot analysis of cortical homogenates (Figure 2A). Residual ADAM10 most likely resulted from glial cells not depleted of ADAM10. In contrast to the cortex, differences in ADAM10 expression and PrPC levels between A10 cKO and littermate controls were not seen in the cerebellum, a brain region not affected by our knockout strategy (Casanova et al., 2001; Prox et al., 2013) (Figure 2A). Immunohistochemical analysis in P19 mouse brains confirmed the Western blot data by showing increased immunostaining for PrPC in A10 cKO mice in several regions of the forebrain, as exemplified by the hippocampus and cortex, whereas no such increase was observed in the cerebellum (Figure 2B). In addition, a coronal brain section showing costaining of PrPC with the neuronal marker NeuN correlates with the Camk2a driven ADAM10 knockout strategy (Casanova et al., 2001) by showing increased PrPC expression in hippocampal and cortical areas as well as in the striatum (Figure 2—figure supplement 1). Increased PrPC levels in A10 cKO mice did not result from transcriptional upregulation as there were no significant differences in PrPC mRNA levels in the forebrain at P19 as assessed by quantitative RT-PCR (mean ± SD: controls: 5.96 ± 0.86; A10 cKO: 6.32 ± 1.04; p = 0.23; n = 5) (Figure 2C). We also analyzed PrPC levels in 35-week-old A10 cKO and littermate control mice. In contrast to newborn A10 cKO mice (Prox et al., 2013), adult A10 cKO mice did not show differences regarding weight and body size (Figure 2D and Video 1). Again, as shown at P19, adult A10 cKO mice also showed increased levels of PrPC in the cortex and hippocampus compared with their littermate controls, as assessed by immunohistochemistry at 35 weeks of age (Figure 2E). Taking these observations together, A10 cKO mice are viable and show a temporally unrestricted posttranslational increase of PrPC in neurons.
Figure 2 with 1 supplement see all
Characterization of PrPC expression in juvenile and adult Camk2a-Cre A10 cKO mice and littermate controls.
(A) Western blot analysis of mature ADAM10 (mADAM10) and PrPC expression in different brain homogenates from the cortex (left) and cerebellum (right) of A10 cKO and control mice at postnatal day (P) 19. Actin served as a loading control. (B) Immunohistochemical detection of PrPC in forebrain of P19 mice of both genotypes. Overview (top) and magnifications showing cortex (Cx) and hippocampal CA2 and CA3 regions. Overview and details of cerebellum (Cb) are shown below. Scale bars represent 100 µm (insets for Cb: 50 µm). (C) Quantitative RT-PCR analysis of PrPC mRNA levels in A10 cKO mice and controls at P19 (n = 5 for each genotype). GAPDH served as a control for normalization. Error bars indicate SD. (D) Adult age-matched A10 cKO and wild-type littermates had a comparable body size at 35 weeks of age. (E) Representative immunohistochemical staining of PrPC in cortex (Cx) and hippocampal CA1 region of adult (35 weeks) A10 cO and control mice. Prion protein knockout (Prnp0/0) and overexpressing mice (tga20) served as negative and positive controls, respectively (scale bar: 100 µm).
Video 1
Clinical presentation of a prion-infected ADAM10 cKO and littermate control mouse at 95 days post inoculation (dpi).
Terminally diseased ADAM10 cKO mouse (cage on the left) directly prior to termination of the experiment showing lack of nest-building behaviour and late hypoactivity whereas a wild-type littermate (cage on the right) matched for dpi presents with a regular nest and normal activity.
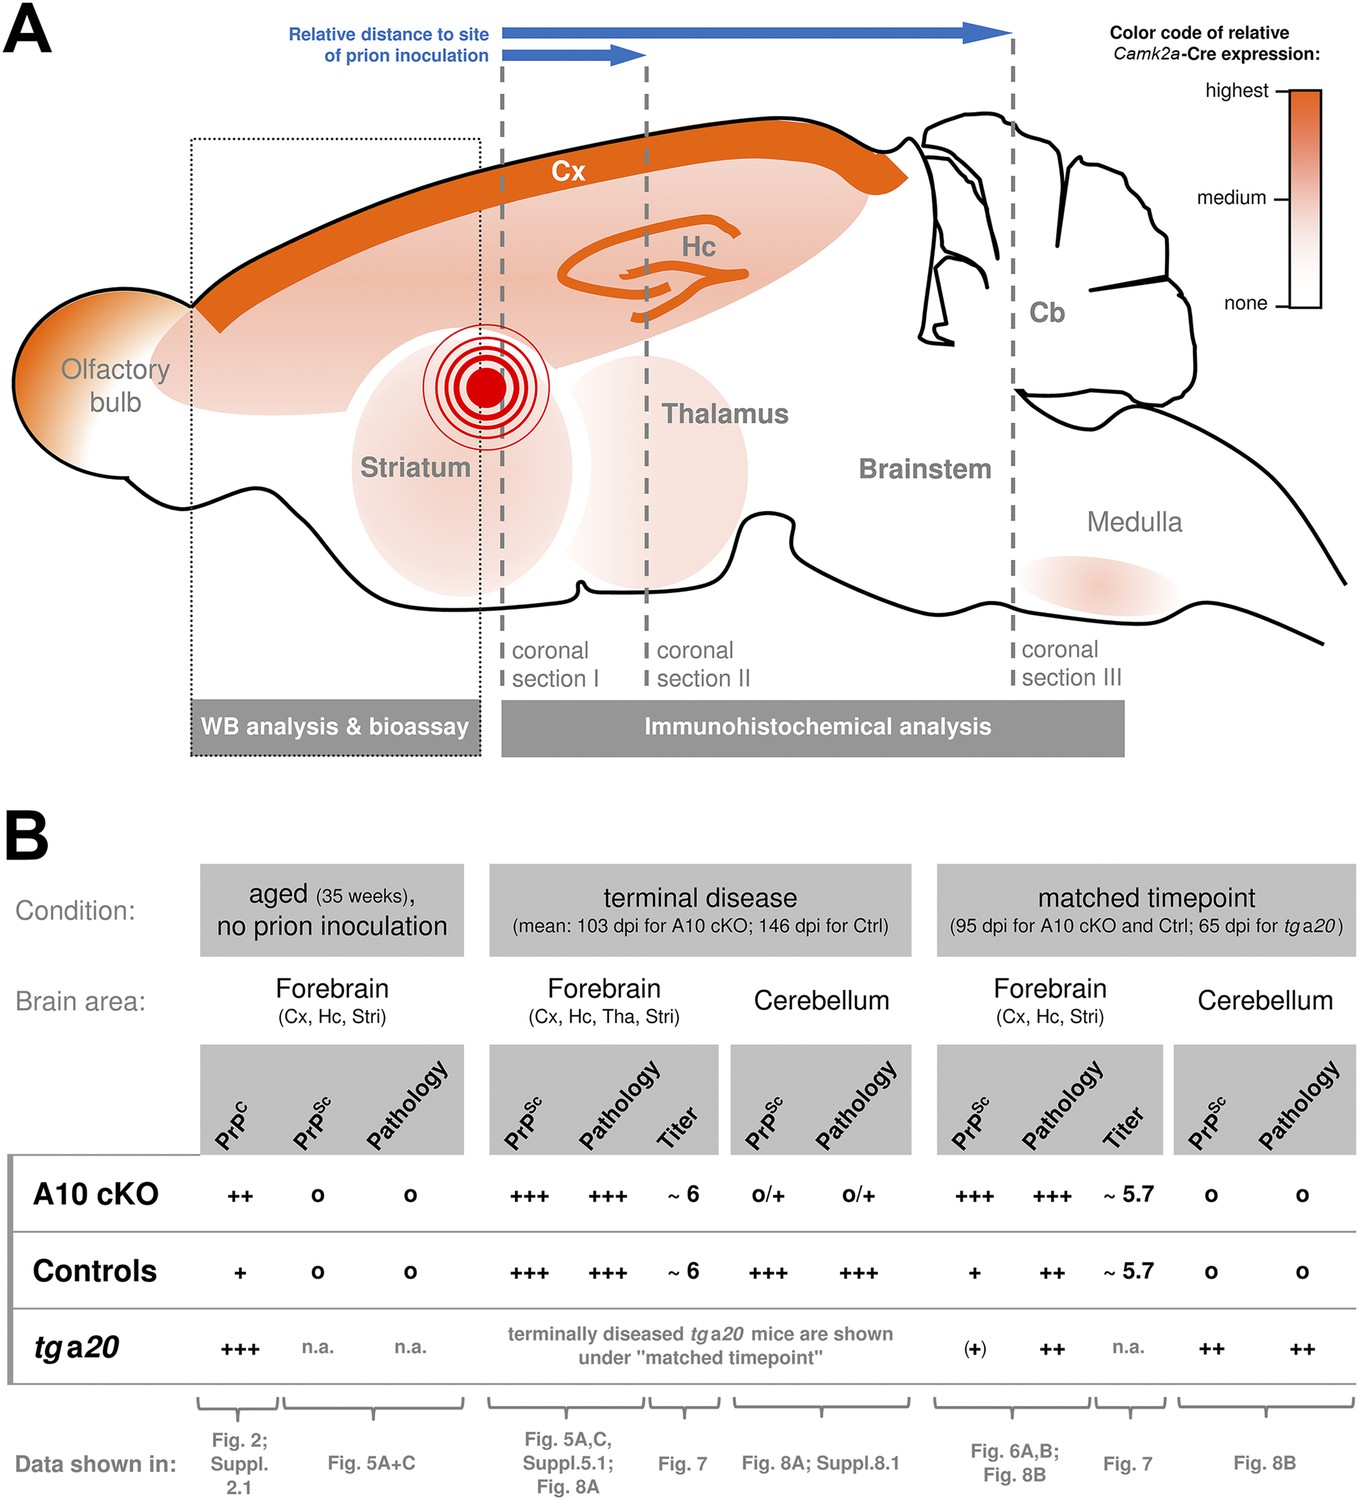
Based on previous reports (Casanova et al., 2001; Prox et al., 2013) and on our findings presented here (Figure 2), a qualitative representation showing the regional distribution of the neuronal Camk2a-Cre expression (and thus of the ADAM10 knockout and increased PrPC expression) is provided in Figure 3A. In addition, this scheme depicts information on our experimental design described in detail below, including the site of prion inoculation and brain regions chosen for immunohistochemical or biochemical analyses.
Figure 3
Overview of the experimental design and summary of most important findings.
(A) Scheme of a mouse brain combining a qualitative representation of the Camk2a driven ADAM10 knockout strategy and information on the sampling of specimen. The site of intracerebral inoculation of mice with RML prions is indicated by the red encircled dot. Samples of frontal brain (dotted box) were taken for biochemical analysis and determination of infectivity titers (bioassay). The rest of the brain was formalin-fixed and embedded in paraffin. Coronal sections were prepared from different layers (dashed lines) with varying distance to the site of prion inoculation (as indicated by blue arrows) and assessed by immunohistochemical analysis. (B) Qualitative comparison of mouse genotypes (A10 cKO, controls, tga20) with regard to PrPC or PrPSc levels, prion-associated neuropathology (including spongiosis, astrocytosis, and microglia activation) and prion infectivity titers according to brain region and time point. Reference to corresponding figures showing original data is provided. Cb = Cerebellum; Cx = Cortex; Hc = Hippocampus; Stri = Striatum; Tha = Thalamus; n.a. = not assessed; Qualities: +++ = high/strong; ++ = medium/moderate; + = low/basal; (+) = very low/weak; o = none.
Drastically reduced incubation time to terminal prion disease in A10 cKO mice
Next, we studied how the absence of the PrPC sheddase impacts on the course of prion disease. For better orientation, Figure 3B summarizes the most important findings presented in the following paragraphs including comparisons of PrPSc levels, prion-associated neuropathology, and infectivity titers for the different genotypes, brain regions, and time points investigated in this study. Moreover, this overview provides reference to the corresponding figures showing the original data described below.
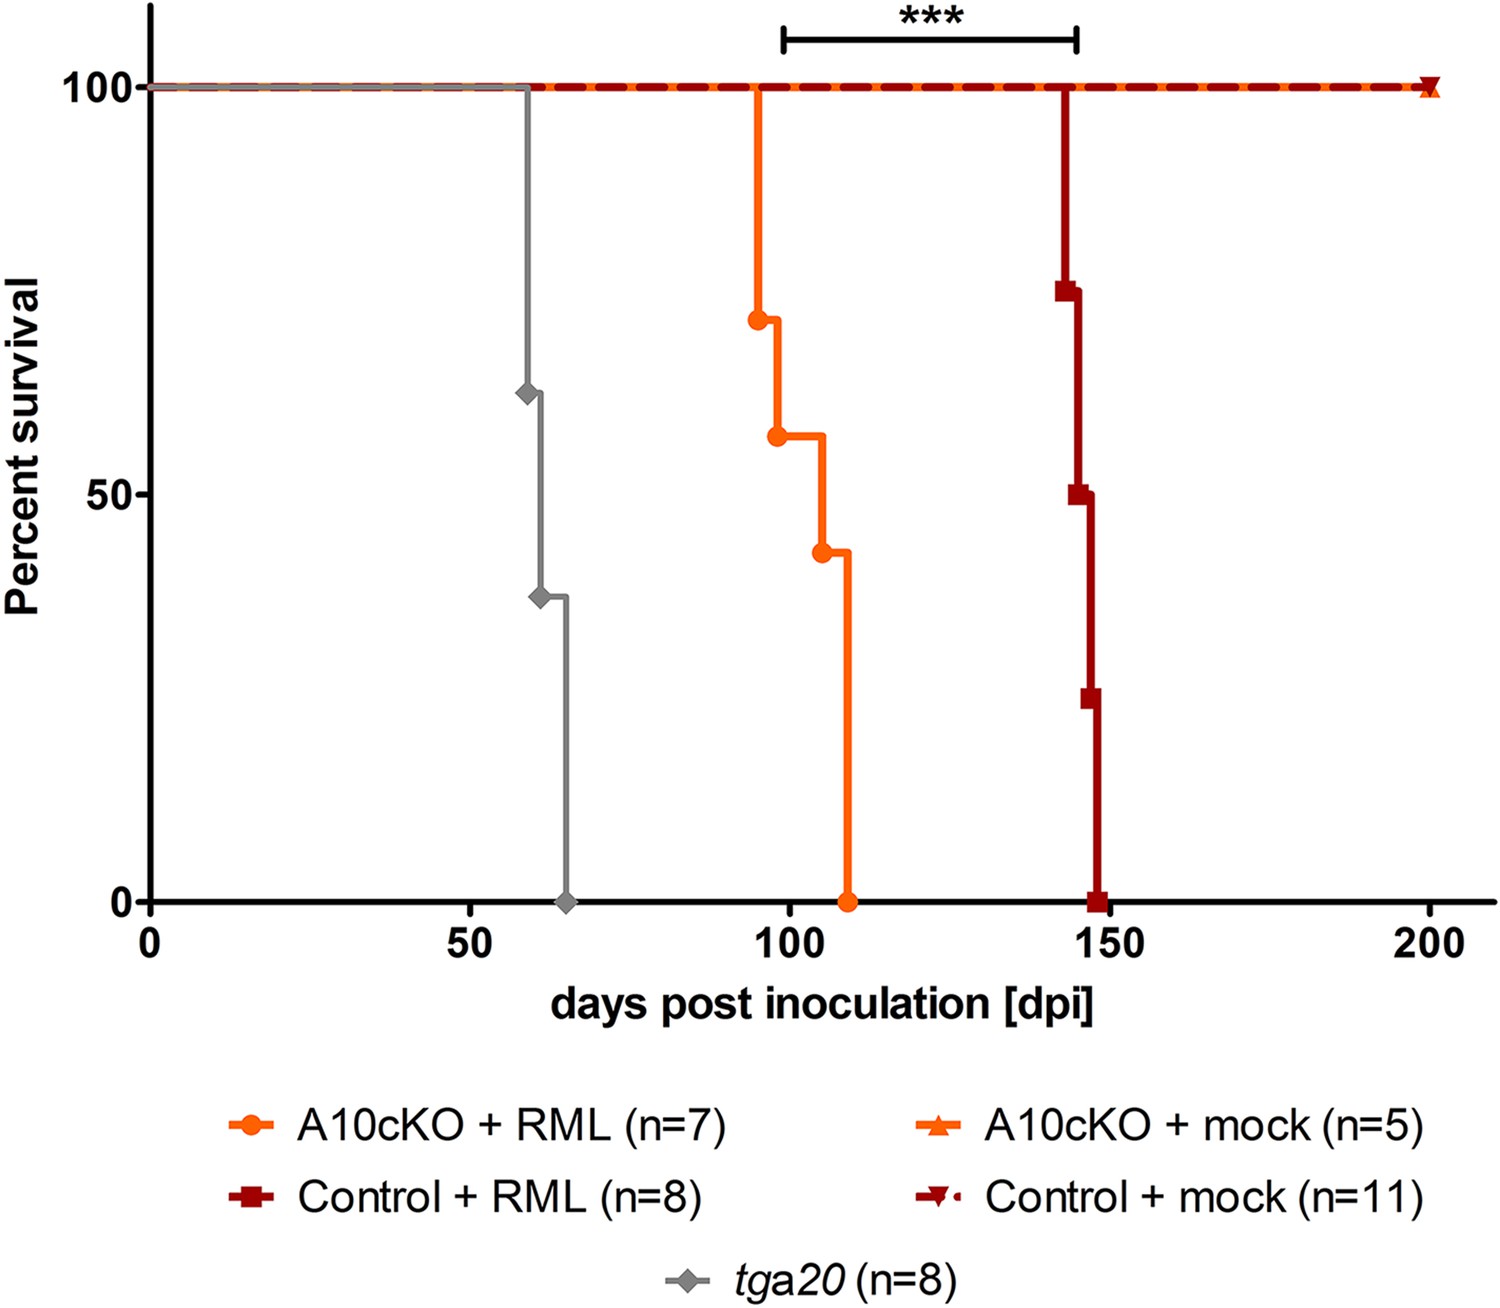
We inoculated A10 cKO (n = 7) and littermate control mice (n = 8) at 6 weeks of age intracerebrally with the Rocky Mountain laboratory (RML) strain of prions. Mock (CD1)-inoculated A10 cKO mice (n = 5) or wild-type littermates (n = 11) and prion inoculated, prion hypersensitive, PrPC overexpressing tga20 mice (n = 8) served as negative and positive controls, respectively. Interestingly, we found significantly reduced incubation times until onset of terminal prion disease in the A10 cKO mice (103 ± 7 days post inoculation (dpi); SD) compared with littermate controls (146 ± 2 dpi) (Figure 4 and Table 1). Clinical manifestations (starting with a neglect of nest formation and fur cleaning, followed by presentation of a stiff tail and gait abnormalities, and terminating with kyphosis, weight loss, and hypoactivity) and disease duration (35 ± 4 days for A10 cKO mice and 40 ± 2.4 days for controls) were comparable between A10 cKO and littermate control mice (Figure 4, Table 1, Video 1). In line with other studies (Fischer et al., 1996; Sandberg et al., 2011), tga20 mice showed fastest disease development and had to be sacrificed between 59 and 65 dpi (Figure 3) whereas mock-infected A10 cKO and control mice were taken out of the experiment at 200 dpi without any signs of prion disease (Figure 4 and Table 1).
Figure 4
Survival curves of mice upon intracerebral inoculation with RML prions.
Age-matched juvenile (6-week-old) A10 cKO mice (n = 7), littermate control mice (n = 8), and tga20 mice (n = 8) were intracerebrally inoculated with RML prions (+RML) and time until development of terminal prion disease was measured as days post inoculation (dpi; ***p = 7.6 × 10⁻⁷). As a negative control (mock), 5 A10 cKO mice and 11 littermate controls were intracerebrally inoculated with brain homogenate of CD1 mice and sacrificed without clinical signs at 200 dpi.
Table 1
Clinical presentation of A10 cKO, littermate control and tga20 mice inoculated with RML prions
| RML prions | CD1 mock | ||||
|---|---|---|---|---|---|
| Clinical manifestations | A10 cKO (n = 7) | Controls (n = 8) | tga20 (n = 8) | A10 cKO (n = 5) | Controls (n = 11) |
| First clinical signs (dpi) | 68 (±3.5) | 106 (±2.5) | n.a. | None | None |
| Duration of clinical signs (d) | 35 (±3.8) | 40 (±2.4) | n.a. | - | - |
| Time to terminal disease (dpi) | 103 (±6.6) | 146 (±2.1) | 62 (±2.8) | * | * |
| Progression of signs | Steady | Steady | Rapid | – | – |
| Quitting of nest-building | All | All | All | – | – |
| Ungroomed coat | Most (6/7) | Most (6/8) | Rare (2/8) | – | – |
| Stiff tail | All | Most (7/8) | Most (5/8) | – | – |
| Gait disturbance | All | All | All | – | – |
| Hind leg paresis | Rare (2/7) | Rare (3/8) | Most (7/8) | – | – |
| Kyphosis | Most (6/7) | Most (6/8) | Rare (3/8) | – | – |
| Weight loss | All | All | Most (6/8) | – | – |
| Late hypoactivity | All | All | Most (5/8) | – | – |
-
Negative controls included A10 cKO and littermate controls inoculated with CD1 brain homogenates (mock). Asterisks indicate that CD1 mock-inoculated animals were sacrificed at 200 days post inoculation (dpi) without any clinical signs.
In summary, depletion of the PrPC sheddase ADAM10 in neurons of the forebrain led to a significant reduction in incubation times of more than 40 days until onset of terminal prion disease without affecting overall clinical presentation.
Lack of ADAM10 does not influence PrPSc loads and neuropathological features of prion disease at terminal disease state
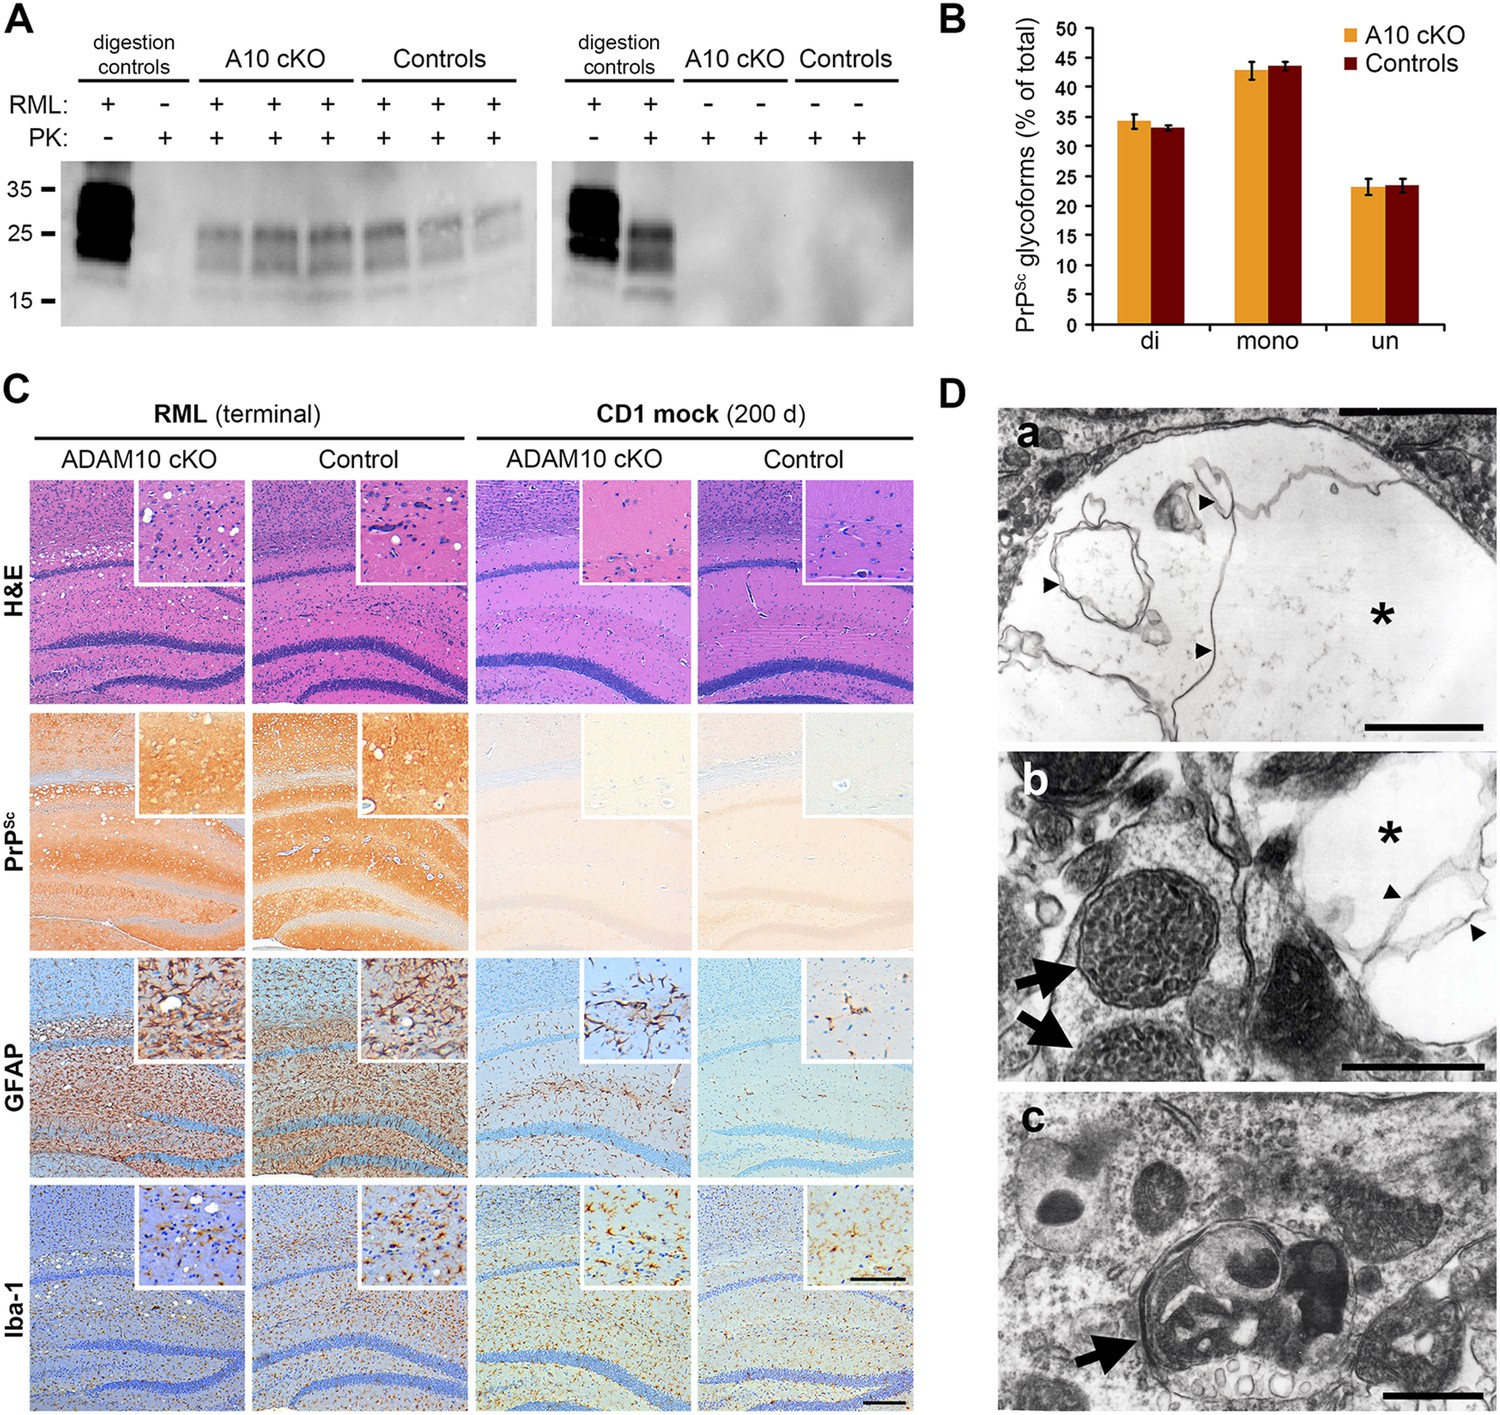
We performed biochemical and neuropathological analyses of terminally prion-diseased A10 cKO and control mice in order to elucidate the reasons for reduced incubation times in the A10 cKO mice. In terminally diseased mice, comparable levels of PrPSc were found in frontal brain homogenates of both genotypes as assessed by Western blot analysis after digestion of samples with PK (Figure 5A). As expected, no PrPSc was found in mock-inoculated controls of each genotype (Figure 5A on the right). Since alterations in incubation times may indicate generation of different prion strains (Barron et al., 2003) with altered PrPSc glycosylation pattern and altered sizes of core fragments of PrPSc, we investigated whether lack of ADAM10-mediated shedding resulted in an altered PrPSc banding pattern. To this end, we measured the relative proportion of di-, mono-, and unglycosylated forms of PrPSc and sizes of PrPSc core fragments. No differences in the PrPSc glycopattern (Figure 5B) or sizes of PrPSc core fragments (Figure 5A) between terminally diseased A10 cKO and control mice were detected, which argues against the generation of a modified prion strain.
Figure 5 with 2 supplements see all
Analysis of terminally prion-diseased A10 cKO mice and littermate controls.
(A) Detection of PrPSc by Western blot analysis of proteinase K (PK)-digested (PK+) forebrain homogenates of prion-infected (RML+; blot on the left) and mock-inoculated (RML−; blot on the right) A10 cKO mice and controls at terminal stage of disease. Samples from three (RML+) or two (RML−) representative animals per genotype are shown. Digestion controls included prion-diseased/undigested (RML+/PK−), prion-negative/PK-digested (RML−/PK+), or prion-diseased/digested (RML+/PK+) brain homogenates. (B) Comparison of proportions of di-, mono, and unglycosylated PrPSc forms between A10 cKO (n = 4) and control mice (n = 4; error bars indicate SEM). (C) Representative histological analysis in the forebrain of terminally prion-diseased (RML terminal) and healthy mock-inoculated (CD1 mock) A10 cKO and control mice including H&E staining and immunostaining of PrPSc, GFAP (for detection of astrocytes), and Iba-1 (for detection of microglia). Scale bar in overviews: 200 µm; scale bar for inlays showing magnifications of representative areas: 100 µm. (D) Electron microscopy photographs showing intraneuronal vacuoles (asterisk in (a) and (b)) containing membranous structures (small arrowheads), enlarged and densely packed multivesicular bodies (arrows in (b)) as well as autophagic membranes (arrow in (c)) and autolysosomes that were found in terminally prion-infected forebrains of both genotypes (exemplified here for an A10 cKO brain). Scale bars represent 500 nm.
Prion infection caused spongiform lesions, massive astrocytosis, and microgliosis in both genotypes (Figure 5C on the left). Similar levels of PrPSc immunopositivity were found at this terminal stage of prion disease (Figure 5C), thus confirming our biochemical data (Figure 5A). Comparable morphological findings were observed in the thalamic brain region (Figure 5—figure supplement 1).
Electron microscopic analysis revealed the presence of typical spongiform changes, dystrophic neurites, and abundant autophagy including enlarged multivesicular bodies and autolysosomes in both genotypes (Figure 5D). Remarkably, prion-diseased A10 cKO mice presented with an extraordinarily high abundance of tubulovesicular structures (TVS) (Figure 5—figure supplement 2) (Jeffrey and Fraser, 2000; Liberski et al., 2010). These are spherical structures of 25–37 nm diameter that are specific for prion diseases though devoid of PrP (Jeffrey and Fraser, 2000; Liberski et al., 2008, 2010). Thus, our model may allow purification of these structures and could contribute to unraveling the nature and relevance of TVS in prion diseases.
Taken together, these data indicate that, at terminal prion disease, the lack of PrPC shedding does not influence local PrPSc distribution while it does affect the appearance of TVS.
Enhanced PrPSc formation and calpain levels in A10 cKO mice
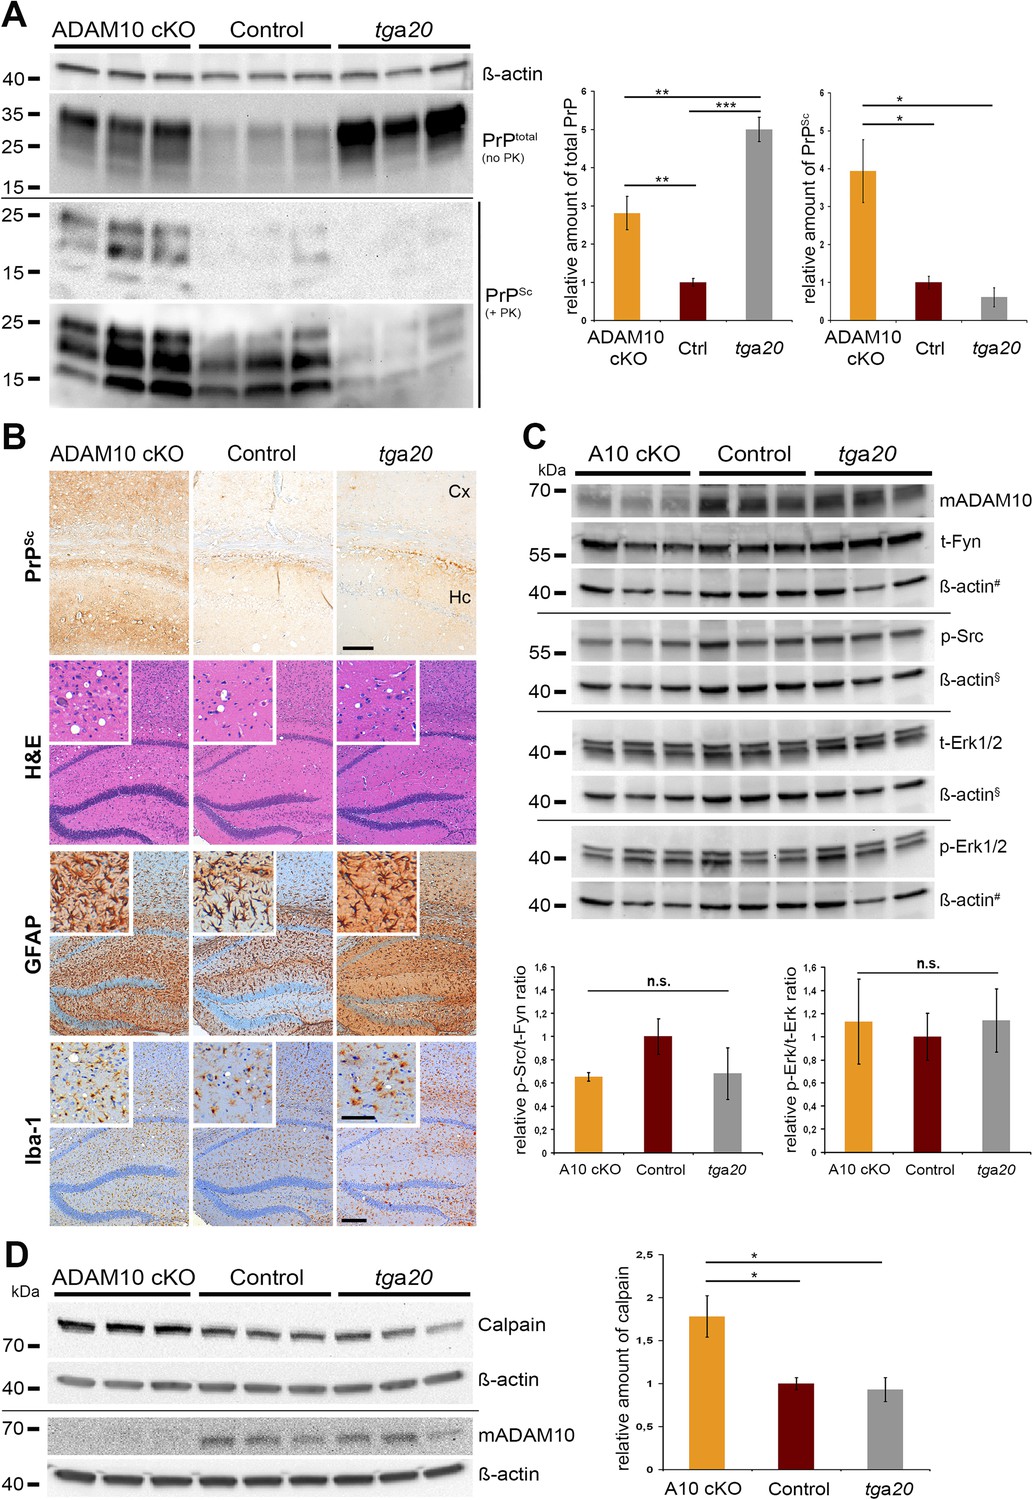
To elucidate the order of events underlying changed disease kinetics, we measured PrPSc production in A10 cKO mice and littermate controls. Since in A10 cKO mice levels of PrPC are posttranslationally increased, we also investigated this issue in tga20 mice with genetically increased Prnp expression. To this aim, we performed Western blot analysis of total PrP (i.e., PrPC plus PrPSc) and PK-resistant PrPSc in A10 cKO and littermate control mice matched for days post prion inoculation (95 dpi) as well as in terminally prion-diseased tga20 mice (65 dpi). Relative levels of total PrP were highest in tga20 mice (5.0 ± 0.3; SEM), with increased levels in A10 cKO mice (2.8 ± 0.4) compared with controls (set to 1 ± 0.1) (A10 cKO vs control: **p = 0.0022; tga20 vs control: ***p = 0.0005; A10 cKO vs tga20: **p = 0.0015) (Figure 6A). Surprisingly, relative levels of PrPSc were significantly elevated in A10 cKO mice (3.9 ± 0.8), with moderate levels in littermate controls (set to 1 ± 0.2) and reduced levels in tga20 mice (0.6 ± 0.3) (A10 cKO vs control: *p = 0.049; A10 cKO vs tga20: *p = 0.032). There were no atypical PrP patterns as assessed by PK digestion at 4°C (‘cold PK’) or with lower dilutions of PK (Figure 6—figure supplement 1). In summary, A10 cKO mice showed significantly increased PrPSc formation compared with littermate controls and tga20 mice, which cannot solely be explained by increased neuronal PrPC levels.
Figure 6 with 2 supplements see all
PrPSc formation, neuropathology, toxic signaling, and calpain levels at a matched time point.
(A) Assessment of total PrP (no proteinase K (PK)) and PrPSc amounts (+PK; blot is shown with short and longer exposition) by parallel replica Western blot analysis in forebrain homogenates of age-matched A10 cKO mice and littermate controls (both at 95 days post inoculation (dpi); n = 3 for each genotype) as well as terminally diseased tga20 mice (at 65 dpi; n = 3). Actin was detected in the undigested homogenates (no PK) and served as loading control. Densitometric quantification of relative protein amounts from two technical replicates is shown on the right. (B) Morphological analysis of neuropathological lesions in forebrains (showing hippocampal and cortical brain regions) of A10 cKO, littermate controls, and tga20 mice at the aforementioned time points (scale bars: 200 µm in overviews and 100 µm in insets and for PrPSc). (C) Biochemical assessment of candidate toxic signaling pathways showing protein levels of total Fyn (t-Fyn), phosphorylated (Tyr416) Src (p-Src) as well as total (t-Erk1/2) and phosporylated (Thr202/Tyr204) Erk1/2 (p-Erk1/2). Actin served as a loading control and for normalization (# and § indicate use of the same actins as corresponding signaling proteins were detected on the same Western blot). Quantitative densitometric analysis of relative p-Src/t-Fyn (left) and p-Erk/t-Erk ratio (right) (n.s. = not significant). (D) Representative Western blot analysis (left) and quantification of three technical replicates (right) of calpain levels in aforementioned samples. Levels of ADAM10 are shown in (C) and (D) to confirm the ADAM10 status. Error bars indicate SEM; *p <0.05; **p <0.01, ***p <0.001 (p values of Student's t-test are given in the main text).
Neuropathological changes in the forebrain, including spongiosis, astrocytosis and microgliosis, were more prominent in A10 cKO mice (Figure 6B). Remarkably, severe differences could be observed for PrPSc immunopositivity, with A10 cKO mice showing prominent PrPSc deposits in cortical and hippocampal regions while controls and tga20 mice showed only moderate levels, thus confirming the biochemical data (Figure 6A).
Next, we addressed the question whether elevated (membrane) levels of PrPC in A10 cKO and tga20 mice caused an increase in PrPC-mediated neurotoxic signaling events. Therefore, we biochemically assessed two candidate signaling pathways, via the Src kinase Fyn and the MAP kinases Erk1/2, that have previously been reported to be activated upon binding of toxic oligomers to PrPC (Mouillet-Richard et al., 2000; Schneider et al., 2003; Larson et al., 2012; Um et al., 2012; Pradines et al., 2013). However, we did not observe any significant differences in the activation state of these kinases in forebrain homogenates between tga20, A10 cKO, and littermate control mice at the chosen time point (Figure 6C).
A10 cKO mice showed significantly increased PrPSc production (Figure 6A,B) compared with controls (at 95 dpi) and tga20 mice (at 65 dpi). Since PrPSc-associated neurotoxicity and cell death have been linked to formation of membrane pores by binding and clustering of PrPSc to PrPC at the plasma membrane resulting in calpain upregulation (Falsig et al., 2012; Sonati et al., 2013), we investigated this in our mice. Specifically, we biochemically analyzed calpain expression in the frontal brain of all experimental groups at the aforementioned time points. Interestingly, we found significant upregulation of calpain expression in A10 cKO mice (1.78 ± 0.24; SEM) compared with littermate controls (set to 1 ± 0.07; *p = 0.034) and tga20 mice (0.93 ± 0.14; *p = 0.022) (Figure 6D), thus correlating with PrPSc levels (Figure 6A,B). This seemed to be specific for prion disease as no differences were detected in non-prion infected A10 cKO mice (mean: 0.90 ± 0.26 SEM; n = 4) when compared with age-matched wild-type controls (set to 1 ± 0.19; n = 5; p = 0.7) (Figure 6—figure supplement 2A). In prion disease we observed a reduction of the described calpain substrates spectrin (Falsig et al., 2012) and neuron-specific activator p35 (Lee et al., 2000), suggesting that increased expression in A10 cKO mice correlated with the activity of calpain (Figure 6—figure supplement 2B,C). However, it should be noted that we failed to detect differences in specific cleavage products of spectrin and p35.
Our data suggest that lack of ADAM10-mediated PrPC shedding leads to increased production of PrPSc and upregulation of calpain expression, whereas activation of proposed toxic PrPC-dependent signaling pathways was not observed.
Similar titers of prion infectivity in brain samples of A10 cKO and control mice at terminal and preclinical phases of prion disease
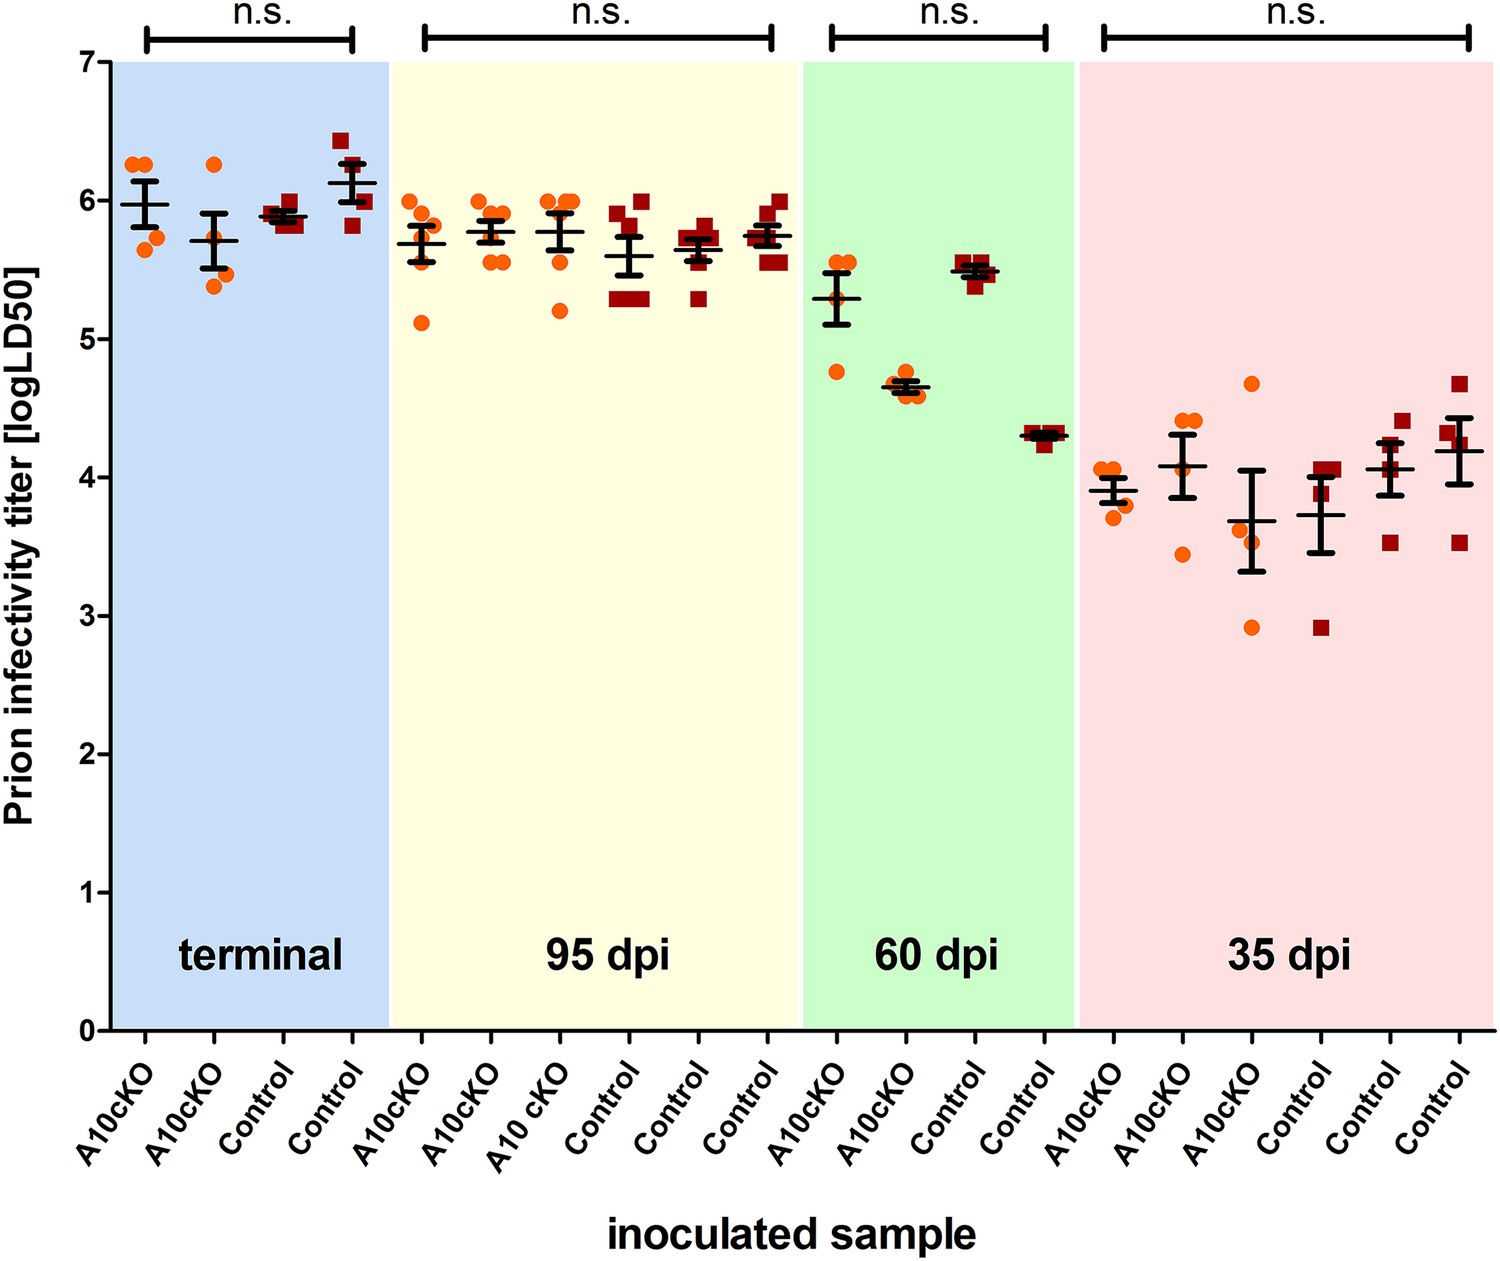
We next investigated whether reduced incubation times and increased PrPSc conversion rates in A10 cKO mice were accompanied by elevated prion infectivity titers and therefore performed bioassays (Figure 7). We intracerebrally inoculated forebrain homogenates of A10 cKO and littermate control mice at terminal (∼103 dpi for A10 cKO and ∼146 dpi for controls; see Table 1) and preclinical (60 dpi, 35 dpi) prion disease into tga20 (n = 4 for each sample) reporter mice. In addition, we assessed the 95 dpi time point (n = 6 tga20 mice per sample) at which A10 cKO mice were clinically affected while controls were still asymptomatic and where we observed significant differences in PrPSc loads (Figure 6A,B). Titers of infectious prions increased with progression of disease, showed only some inter-individual variation, and reached a plateau phase towards the terminal stage of disease. However, they were independent of ADAM10 expression since we did not find differences between the two genotypes. At early time points (35 dpi) prion titers were low (mean: A10 cKO: 3.9 ± 0.2 logLD50; control: 4.0 ± 0.2), intermediate titers were seen at 60 dpi (A10 cKO: 5.0 ± 0.5; control: 4.9 ± 0.8), and highest titers were observed in terminally ill mice (A10 cKO: 5.8 ± 0.2; control: 6.0 ± 0.2) (Figure 7). Interestingly, significantly increased PrPSc amounts in A10 cKO mice at 95 dpi (Figure 6A,B) did not result in elevated prion infectivity titers (A10 cKO: 5.74 ± 0.05; control: 5.66 ± 0.08; p = 0.2).
Figure 7
Titers of prion infectivity in terminally diseased and preclinical A10 cKO mice and controls.
Prion titers in forebrain homogenates of A10 cKO mice and littermate controls at terminal or matched (preclinical) time points (95 days post inoculation [dpi], 60 dpi, and 35 dpi) after prion inoculation as assessed by bioassays in tga20 reporter mice. Each dot indicates the titer (shown as logLD50) assessed in a single reporter mice. Bars indicate mean values from six (for the 95 dpi time point) or four (all other time points) tga20 mice. Error bars indicate SD.
ADAM10-mediated shedding might contribute to spreading of prion pathology
Since PrPSc is shed from the plasma membrane in vitro (Taylor et al., 2009) and anchorless PrPC can convert into PrPSc (Chesebro et al., 2005, 2010; Stöhr et al., 2011), we were interested to investigate if lack of PrP shedding affects the spread of prion pathology within the brain. Therefore, we performed a morphology-based spatiotemporal analysis in prion-infected A10 cKO and littermate control mice.
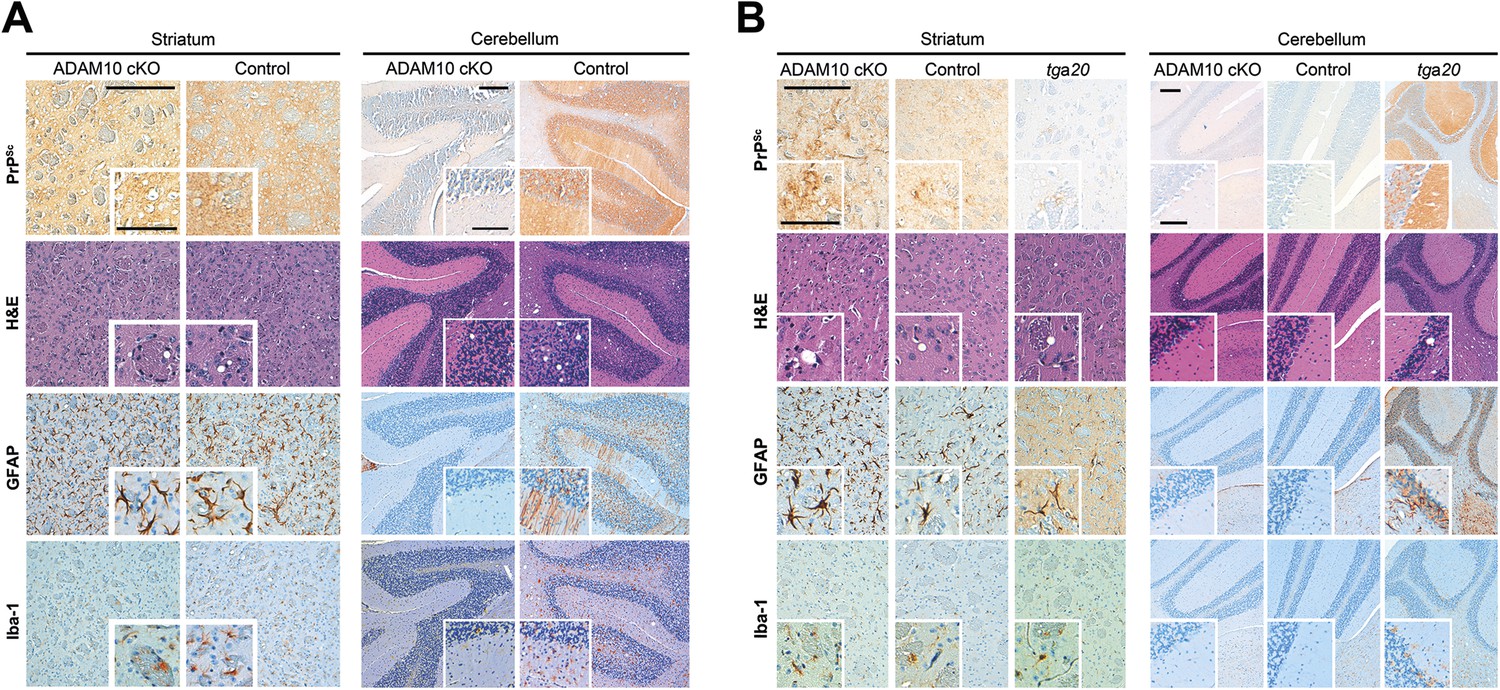
We assessed a brain region in direct proximity to the site of prion administration (striatum) and brain regions (cerebellum and brain stem) distant from the inoculation site and not directly affected by the depletion of ADAM10 (Figure 2; see Figure 3 for overview) (Casanova et al., 2001; Prox et al., 2013). Whereas for striatum we observed neuropathological changes typically found in terminal prion disease irrespective of the ADAM10 status, we found an apparently reduced degree of spongiosis in the cerebellum and brain stem of A10 cKO mice compared with terminally diseased littermate controls (Figure 8A and Figure 8—figure supplement 1). In line with this, other prion-associated pathological hallmarks, including PrPSc immunopositivity, astrocytosis involving Bergmann glia, and microglia activation, were observed in the cerebellum of controls, but were virtually lacking in this brain region in A10 cKO mice (Figure 8A).
Figure 8 with 1 supplement see all
Spatiotemporal analysis of prion-associated pathology.
(A) Comparison of neuropathological features including PrPSc deposition, spongiotic changes (presented in H&E stainings), astrocyte (GFAP) and microglia (Iba-1) activation in striatum (as a site in close proximity to prion inoculation) and cerebellum (resembling a brain area distant to prion inoculation) in A10 cKO and littermate control mice at a terminal stage of prion disease (i.e., ∼103 days post inoculation [dpi] for A10 cKO and ∼146 dpi for controls). While similar pathological alterations were observed in the striatum of both genotypes, prion-associated lesions in the cerebellum were almost absent in A10 cKO mice. (B) At a matched time point (95 dpi for A10 cKO and littermate controls; 65 dpi [i.e., terminal disease] for tga20), prion-related pathology was found in the striatum of all genotypes analyzed. As described earlier for the cortex and hippocampus (Figure 6), differences in PrPSc amounts could also be observed in the striatum. In the cerebellum of both time-matched A10 cKO mice and littermate controls, prion-associated lesions were largely absent whereas tga20 mice showed all relevant neuropathological features already at 65 dpi. Representative pictures for at least three animals per genotype and time point are shown. Scale bars represent 200 µm (overviews) or 100 µm (insets).
Reduced disease duration in A10 cKO mice leading to diminished dissemination of prion-associated pathology may represent a possible explanation for these findings. In order to control for this, we assessed neuropathological alterations at a matched time point (95 dpi) in both A10 cKO mice and littermate controls. Additionally, we included terminally prion-diseased tga20 mice (65 dpi). In the striatum, typical neuropathological changes were seen in all groups of mice. Similar to hippocampus and cortex (Figure 6B), increased PrPSc immunopositivity and astrogliosis were seen in A10 cKO mice (Figure 8B). In line with our biochemical findings (Figure 6A), tga20 mice showed lowest PrPSc amounts in the forebrain. Interestingly, in the cerebellum and brain stem, relevant prion-typical neuropathological changes were observed in tga20 mice at 65 dpi but were almost absent in both A10 cKO and littermate controls at 95 dpi (Figure 8B). This argues against a temporal cause for the observed differences and rather supports an accelerating role of shedding in the spread of prion disease within the CNS. Since tga20 mice show enhanced rates of PrPC shedding (Figure 1E) (Altmeppen et al., 2011), our spatiotemporal data may indicate a correlation between PrPC shedding and the efficiency of prion spread within the brain, with tga20 mice having the highest efficiency whereas A10 cKO mice show the least efficient dissemination of prion pathology (see model in Figure 9).
Figure 9

Model of the dual role of ADAM10-mediated shedding in prion disease.
ADAM10 regulates PrPC levels at the plasma membrane and releases almost full length PrP into the extracellular space. Thereby it affects (i) neurotoxicity, (ii) PrPSc formation, and (iii) spreading of prion pathology. (i) Lack of ADAM10 (as assessed here by use of A10 cKO mice) results in elevated PrPC membrane levels. Membrane levels of PrPC (as a receptor) likely determine PrPSc-associated neurotoxicity (as indicated by sizes of thunderbolts and skulls) and thereby incubation times with shortest survival in tga20 mice and reduced incubation times in A10 cKO mice compared with wild-type littermates with longest survival (order reflected by grey triangles on the left). (ii) Shed PrP, which is most efficiently produced in tga20 and absent in A10 cKO mice, might block formation of PrPSc. This is reflected by the different PrPSc amounts found in our different experimental groups (A10 cKO > wild-type littermates > tga20). The combination of increased PrPC membrane levels and PrPSc formation in A10 cKO mice might favor increased production of membrane pores (as indicated in the middle row on the left) and neurotoxic Ca2+ influx with possible (‘?’) involvement of calpain. (iii) Finally, spread of prion-associated pathology within the brain also seems to be affected by the levels of ADAM10 expression since tga20 mice showed enhanced whereas A10 cKO mice showed reduced dissemination of neuropathological features (as indicated by size of arrowheads on the right). Key references supporting this model are given in the text. Based on this model, stimulation of ADAM10 might therefore offer a treatment option. With regard to incubation times, protective effects by reducing local membrane bound PrPC amounts and by producing a protective soluble fragment able to block PrPSc formation seem to predominate the disadvantage of increased spread by production of anchorless prions.
Discussion
Proteolytic processing of the prion protein is critically involved in controlling its physiological functions. For α-cleavage, a protective role for both prion and AD is postulated and attributed to destruction of the neurotoxic domain and production of the neuroprotective N1 fragment respectively (Guillot-Sestier et al., 2009; Resenberger et al., 2011; Westergard et al., 2011; Beland et al., 2012; Guillot-Sestier et al., 2012; Fluharty et al., 2013). Moreover, the C1 fragment of PrPC is involved in myelination (Bremer et al., 2010). The protective role of α-cleavage is also supported by the fact that α-cleavage-resistant PrPC deletion mutants are intrinsically neurotoxic upon expression in mice (Shmerling et al., 1998; Baumann et al., 2007) (reviewed in Yusa et al., 2012). In contrast, our knowledge of the consequences of PrPC shedding, though being evolutionary conserved and constitutively occurring under physiological conditions, is limited. In a previous study we have shown that ADAM10 represents the principal PrPC sheddase in vivo with lack of ADAM10 resulting in a posttranslational increase of PrPC levels (Altmeppen et al., 2011). This pointed to a key role for this protease in the regulation of PrPC levels at the neuronal surface, yet its impact on prion diseases remained unknown. We recently generated A10 cKO mice, a viable model with selective postnatal ablation of ADAM10 in neurons of the forebrain (Prox et al., 2013). In the present study we demonstrate that prion-inoculated A10 cKO mice show considerably reduced incubation times and increased conversion of PrPC to PrPSc. In contrast, spread of prion pathology within the brain is reduced, thus indicating a dual role for ADAM10 in the pathophysiology of prion disease (Figure 9).
ADAM10 acts as a sheddase for a number of neuronally expressed proteins with important functions in the development and homeostasis of the brain (Yang et al., 2006; Weber and Saftig, 2012). For PrPC it is now widely accepted that ADAM10 is the PrPC sheddase (Parkin et al., 2004; Taylor et al., 2009; Altmeppen et al., 2011; Wik et al., 2012; Ostapchenko et al., 2013; McDonald et al., 2014). Here we extend our previous findings on increased levels of PrPC in the absence of ADAM10 (Altmeppen et al., 2011) in different cellular models and observe colocalization between PrPC and ADAM10 at the plasma membrane, which is regarded as the primary site of ADAM10-mediated shedding events (Lammich et al., 1999; Chen et al., 2014). In addition to accumulation of PrPC in the early secretory pathway (Altmeppen et al., 2011), we here show that lack of ADAM10 also results in elevated membrane levels of PrPC. This supports a model where ADAM10-mediated shedding controls PrPC membrane homeostasis (Altmeppen et al., 2013).
However, cell culture models as well as mice with pan-neuronal depletion of ADAM10 did not allow investigation of the role of PrP shedding in prion diseases (Altmeppen et al., 2011). Therefore, we used A10 cKO mice (Prox et al., 2013) in which we observed increased PrPC levels that were not caused by elevated PrPC mRNA levels.
Onset of terminal prion disease in mice upon intracerebral inoculation with defined prion strains occurs after defined incubation times. Once clinical symptoms appear, individual mice reliably succumb to disease within days. In contrast to peripheral prion inoculation where the integrity of the lymphoreticular or autonomous nervous system plays a decisive role in neuroinvasion of prions, incubation time after intracerebral inoculation is mainly influenced by PrPC levels (Mabbott et al., 2000; Glatzel et al., 2001; Prinz et al., 2003). This is nicely exemplified by tga20 mice constitutively overexpressing PrPC (Fischer et al., 1996; Sandberg et al., 2011). Our intracerebrally inoculated A10 cKO mice developed prion disease >40 days earlier than controls, corresponding to a shortening of incubation times of ∼30%. Such dramatic reductions upon intracerebral inoculation with high-dose RML prions have so far only been achieved when PrPC is massively overexpressed (Fischer et al., 1996). Less dramatic reductions were, for instance, described in mice lacking superoxide dismutase 1 (Akhtar et al., 2013) or overexpressing the heat shock protein Hspa13 (Grizenkova et al., 2012). The only other study investigating the role of ADAM10 in prion disease showed that transgenic overexpression of bovine ADAM10 in mice led to prolongation of prion disease (Endres et al., 2009), a finding which is complementary to our data on the effect of ADAM10 deficiency. However, these authors linked this effect to transcriptional downregulation of PrPC and not to proteolytic processing events. In contrast, data from the present and previous studies show that transcriptional regulation of PrPC is not affected by ADAM10 whereas proteolytic processing clearly is (Parkin et al., 2004; Taylor et al., 2009; Altmeppen et al., 2011; Wik et al., 2012; Ostapchenko et al., 2013; McDonald et al., 2014). We considered the possibility that non-PrP dependent effects resulting from ADAM10 deficiency may have contributed to disease acceleration. Indeed, ADAM10 is involved in a number of developmental and immunological processes and A10 cKO mice show learning deficits (Weber and Saftig, 2012; Prox et al., 2013). It is virtually impossible to dissect out the individual contribution of the multitude of ADAM10 targets to the pathophysiology of prion disease. For instance, microglia contribute to prion pathophysiology and express CD40L, a known ADAM10 substrate. Prion-inoculated CD40L-deficient mice show decreased incubation times (Burwinkel et al., 2004). As CD40L is not expressed on neurons and its receptor (CD40) is not processed by ADAM10, we do not expect that this dyad is altered by our neuron-specific knockout strategy (Schönbeck and Libby, 2001; Burwinkel et al., 2004). Another microglia-related mechanism relevant to prion disease and influenced by ADAM10 is the Cx3cl1/Cx3cr1 signaling complex. The receptor (Cx3cr1) is expressed on microglia whereas its ligand Cx3cl1 (Fractalkine) is an ADAM10 substrate expressed on neurons. Cx3cl1-deficient mice inoculated with prions show slightly decreased incubation times to disease (Grizenkova et al., 2014). Therefore, we do not assume that these events explain the strong effect observed in our study. Most other immune system-mediated effects on prion pathogenesis are only relevant for peripheral prion inoculation and neuroinvasion and do not play major roles in intracerebral prion administration (Aguzzi et al., 2003). Furthermore, A10 cKO mice do not show any gross morphological abnormalities in the CNS, have a normal life span once they have survived a critical weaning period, and mock inoculated mice behave normally (Prox et al., 2013). Finally, we consider that increased PrPSc levels found in A10 cKO mice strongly argue in favor of PrP-dependent effects of ADAM10 depletion.
Analysis of A10 cKO mice and littermate controls at 95 dpi as well as tga20 mice at 65 dpi (which represents terminal disease for these mice) revealed a significant difference in PrPSc formation between A10 cKO and the other two experimental groups. This cannot be explained by the increased presence of PrPC, since PrPC overexpressing tga20 mice showed low levels of PrPSc even at the terminal stage of the disease. How can this be explained? The molecular basis underlying neurodegeneration in prion diseases is under debate and different mechanisms of neurotoxicity have been proposed. In the receptor model, PrPC binds oligomeric β-sheet rich protein species, such as PrPSc, and mediates neurotoxic signaling (Mouillet-Richard et al., 2000; Lauren et al., 2009; Resenberger et al., 2011; Larson et al., 2012; Um et al., 2012). In the pore formation model, PrPSc oligomers, either directly or upon binding to PrPC, form a membrane channel leading to exaggerated Ca2+ influx and calpain activation (Falsig et al., 2012; Sonati et al., 2013). In our study we found evidence for the link between excessive generation of PrPSc and increased calpain levels in A10 cKO mice, whereas basal (in littermate controls) and low (in tga20 mice) PrPSc levels were not associated with calpain upregulation.
Tga20 mice are hypersensitive to prion disease yet do not show significant levels of PrPSc even though PrPC is strongly overexpressed. In a previous study we have shown and re-evaluated here that ADAM10-mediated shedding of PrPC in neurons of tga20 mice is increased approximately threefold (Altmeppen et al., 2011). Of note, soluble GPI-anchorless forms of PrPC, which may be regarded as correlates of shed PrPC, and experimentally-induced release of PrPC in vitro impair PrPSc formation (Marella et al., 2002; Meier et al., 2003; Kim et al., 2009; Yuan et al., 2013). Thus, high levels of shed PrPC in tga20 mice may impair PrPSc formation whereas lack of shed PrPC in A10 cKO mice may favor PrPSc formation (Figure 9). In line with this concept, PrPSc production was decreased in mice moderately overexpressing ADAM10 (Endres et al., 2009). In both tga20 and A10 cKO mice, increased levels of PrPC at the plasma membrane should facilitate PrPC-mediated neurotoxicity and thereby determine incubation times. Interestingly, these data provide a potential explanation for the tga20 paradox of low PrPSc formation despite high PrPC levels and short incubation times (Fischer et al., 1996).
A10 cKO mice and controls showed identical prion titers. On the other hand levels of PrPSc were elevated and no atypical protease-sensitive forms of PrPSc were found. It is becoming increasingly evident that titers of prion infectivity, PrPSc, and the presence of potentially neurotoxic PrP conformers are not congruent (Lasmezas et al., 1997; Barron et al., 2007; Piccardo et al., 2007; Krasemann et al., 2013). In fact, the exact composition of infectious ‘prions’ (i.e., the entity determined by bioassay) is not fully understood and it may be that ADAM10-mediated shedding affects formation of PrPSc while it does not influence production of ‘prions’.
We did not observe induction of proposed neurotoxic signaling pathways (Mouillet-Richard et al., 2000; Schneider et al., 2003; Larson et al., 2012; Um et al., 2012; Pradines et al., 2013). It may be that these pathways occur spatially and temporally restricted and future studies will have to address this question using refined methods of analysis. Alternatively, other yet to be discovered pathways may be involved. In A10 cKO mice, the combination of elevated PrPC membrane levels and increased PrPSc amounts may favor increased pore formation and Ca2+ influx as indicated by elevated calpain levels. However, since we did not detect unequivocal evidence for calpain activation, further studies are required to substantiate this model.
In view of the fact that prion-infected mice expressing anchorless PrPC show PrPSc formation and deposition in ectopic sites (Lee et al., 2011) and prion propagation in the CNS (Chesebro et al., 2005), we investigated whether shedding contributes to the spread of prion pathology. In fact, A10 cKO mice show prion-related pathology and PrPSc deposition at the site of (striatum) and adjacent to prion administration (hippocampus, frontal cortex, thalamus), whereas brain regions distant from the inoculation site (cerebellum, brain stem) were unaffected, even at terminal stages of disease. In contrast, in tga20 mice, dissemination of prion-related pathology occurred efficiently at a much earlier time point. Non-PrP-dependent effects resulting from ADAM10 deficiency, such as altered microglial activity or reduced processing of proinflammatory molecules, may have contributed to impaired spreading (Weber et al., 2013; Prox et al., 2013). However, the influence of the immune system, including microglial activation on intracerebral spread of prions, is limited, therefore a correlation between PrP shedding and the efficiency of prion spread is possible (Glatzel et al., 2004; Grizenkova et al., 2014). In line with our findings, it has been shown that, upon prion infection of mice, heterozygous expression of normal and anchorless PrP results in earlier death compared with wild-type mice (Chesebro et al., 2005). Thus, shedding of either PrPC (followed by cell-free conversion [Kocisko et al., 1994]) or PrPSc, both of which have been shown to occur (Taylor et al., 2009; Altmeppen et al., 2011), should be considered as an alternative mechanism of prion spread (Figure 9) aside from direct transsynaptic cell-to-cell transfer (Glatzel et al., 2001; Shearin and Bessen, 2014), exosomal (Alais et al., 2008) and viral transfer (Leblanc et al., 2006), or tunneling nanotubes (Gousset et al., 2009). It remains to be investigated whether ADAM10-mediated shedding is also involved in the release of bona fide prions into body fluids such as cerebrospinal fluid, blood, or nasal secretions, which may potentially increase the risk of transmission (Tagliavini et al., 1992; Perini et al., 1996; Parizek et al., 2001; Bessen et al., 2010).
In conclusion, our data indicate that proteolytic processing, as described here for the shedding of the prion protein, represents a master switch in the pathophysiology of prion diseases by drastically affecting PrPSc formation and incubation times. Interestingly, protective effects of ADAM10 might be hijacked in prion diseases since a reduction of the protease in prion disease has recently been reported in vitro and in vivo (Chen et al., 2014). By contrast, shedding also seems to affect the spread of prion pathology within the CNS. Understanding this dual role of ADAM10 in prion disease brings together current concepts of prion biology and might reveal a mechanistic insight into important pathophysiological processes. Apart from prion disease, in other neurodegenerative proteinopathies, where PrPC-PrPSc conversion does not play a role, ADAM10-mediated shedding of PrPC might solely be protective due to reduction of the receptor as well as the production of a soluble blocker of toxic oligomers. In view of a potential role of PrPC in AD, further research on proteolysis as a regulatory event in prion biology will likely impact on more common neurodegenerative conditions.
Materials and methods
Description of mice and ethics statement
Request a detailed protocolIn this study we took advantage of the recently generated Camk2a-Cre Adam10 conditional knockout (A10 cKO) mouse model with a depletion of Adam10 in neurons of the forebrain. Generation as well as a detailed description of these mice can be found elsewhere (Prox et al., 2013). Assessment of floxed alleles (Jorissen et al., 2010) and the Camk2a-Cre status (Casanova et al., 2001; Prox et al., 2013) in transgenic mice was performed by PCR. Our breeding strategy of crossing Adam10F/F with Camk2a-Cre:Adam10F/+ yielded approximately 15% viable Cre-positive Adam10F/F offsprings (A10 cKO) (Prox et al., 2013). Cre-negative Adam10F/F or Adam10F/+ littermates were used as wild-type controls. In addition, we used prion protein overexpressing Tg(Prnp)a20 mice (herein referred to as tga20) (Fischer et al., 1996) as controls for our biochemical and immunohistochemical analysis and as reporter mice in our bioassays for determination of prion infectivity titers as described below. Finally, brain sections of prion protein knockout (Prnp0/0) mice (Büeler et al., 1992) were used as an internal negative control for our immunohistochemical staining procedure.
Our study was carried out in accordance with the principles of laboratory animal care (NIH publication No. 86-23, revised 1985) as well as the recommendations in the Guide for the Care and Use of Laboratory Animals of the German Animal Welfare Act on protection of animals. The protocol was approved by the Committee on Ethics of the Freie und Hansestadt Hamburg—Amt für Gesundheit und Verbraucherschutz (permit number 48/09, 81/07 and 84/13).
Prion inoculations
Request a detailed protocolInoculations of mice were performed under deep ketamine and xylazine hydrochloride anesthesia. All efforts were made to minimize suffering of the animals including careful observation and special treatment (i.e., administration of wet food and incubation on a warming plate) of mice immediately after inoculations until recovery. In brief, 6−9-week-old A10 cKO mice (n = 12), littermate controls (n = 17), and tga20 mice (n = 11) were inoculated with 30 µl of 1% homogenate of Rocky Mountain Laboratory (RML) prions (RML 5.0 inoculum, corresponding to 3 × 10⁵ LD50) into the forebrain. Mice were checked on a weekly basis and observation was intensified to a two-day schedule following the appearance of first clinical signs. To assess disease characteristics in preclinical mice, A10 cKO, wild-type littermates, and tga20 mice (n = 3 for each genotype) were sacrificed at 35 dpi. Moreover, two A10 cKO mice and two wild-type control mice were taken at 60 days for determination of preclinical prion titers. For matched comparison with terminal A10 cKO mice, preclinical littermate controls (n = 4) were sacrificed at day 95 after inoculation. All other mice (A10 cKO: n = 7; controls: n = 8; tga20: n = 8) were sacrificed and analyzed when they reached terminal prion disease (Table 1). Additionally, we performed mock inoculations with 30 µl of 1% brain homogenate from uninfected CD-1 mice into age-matched A10 cKO (n = 5) and littermate controls (n = 11). These animals were sacrificed at 200 dpi lacking any signs of prion disease (see Table 1).
For the assessment of titers of prion infectivity in our preclinical and terminally diseased A10 cKO and control mice, we performed bioassays in tga20 reporter mice. To this end, 20 µl of a 1% homogenate of frontal brain derived from an animal to be investigated were intracerebrally inoculated into four or six tga20 mice. Prion titers (y; shown as logLD50) in the original sample were then calculated according to the equation y = 11.45 − 0.088 × x, with x being the time to terminal disease of tga20 reporter mice (in dpi).
Primary neurons, cell culture, and analysis of media supernatants
Request a detailed protocolGeneration of primary neurons of E14 embryos of NestinA10 KO, wild-type C57BL/6, Prnp0/0 and tga20 mice as well as immunoprecipitation of shed PrPC from conditioned media was described (Altmeppen et al., 2011).
MEFs of A10 KO and control mice were initially described in (Hartmann et al., 2002) and maintained under standard cell culture conditions. Conditioned media were collected after 18–24 hr and prepared for immunoprecipitation of PrPC (Altmeppen et al., 2011). Alternatively, media supernatants were concentrated 10× using ultrafiltration spin columns (Vivaspin 500, Sartorius Stedim Biotech, Goettingen, Germany).
Western blot analysis
Request a detailed protocolSamples of frontal brain were processed as 10% (wt/vol) homogenates in RIPA buffer (50 mM Tris–HCl pH 8, 150 mM NaCl, 1% NP40, 0.5% Na-Deoxycholat, 0.1% SDS) supplemented with Complete Mini protease inhibitor cocktail (PI; Roche Diagnostics, Mannheim, Germany). Samples were smashed 30× on ice using a Dounce homogenizer and subsequently incubated on ice for 15 min before resuspending by 15× pipetting up and down. Homogenates were centrifuged at 12,000×g for 6 min at 4°C and total protein content in supernatants was determined by colorimetric analysis (QuickStart Bradford 1× Dye, Biorad, Hercules, CA) following the manufacturer's instructions. Samples were then normalized to yield equal protein amounts and boiled in 4× loading buffer (250 mM Tris–HCl, 8% SDS, 40% glycerol, 20% β-mercaptoethanol, 0.008% Bromophenol Blue, pH 6.8) for 6 min at 96°C. Gel electrophoresis was performed using 20–50 µg of total protein per lane and 8%, 10%, or 12% SDS-PAGE gels. Proteins were subsequently wet-blotted onto nitrocellulose membranes (Biorad) and membranes were blocked for 1 hr using 5% non-fat dry milk in TBS-T. Immunoblot analysis was performed using the following primary antibodies: rabbit anti-ADAM10 (1:1000; polyclonal antiserum, B42.1), mouse monoclonal antibodies against PrPC (POM1 [for most of the experiments] or POM2 [for detection of shed PrP (Figure 1E)] (Polymenidou et al., 2008), 1:2500; A Aguzzi, Zurich, Switzerland), mouse monoclonal 1E4 (1:500; Sanquin, Amsterdam, The Netherlands), rabbit against p35/p25 (1:1000; mAB #2680; Cell Signaling), mouse Anti-Spectrin (1:500; MAB1622; Millipore, Bedford, MA), rabbit polyclonal antibody against calpain (H-240, 1:200; Santa Cruz Biotechnology, Santa Cruz, CA), and mouse monoclonal antibody against β-actin (1:2000; Millipore) or rabbit anti-Actin (1:2000; A5060; Sigma). Incubation with primary antibodies (diluted in 5% non-fat dry milk) was carried out overnight at 4°C on a shaking platform. Membranes were then washed 3× for 5 min with TBS-T, incubated for 45 min at room temperature with HRP-conjugated anti-mouse or anti-rabbit secondary antibodies (Promega, Madison, WI) diluted in 5% non-fat dry milk in TBS-T, and washed 6× for 5 min with TBS-T. The signal was detected after incubation of membranes with Pierce ECL or SuperSignal West Femto substrate (Thermo Scientific, Waltham, MA) using a CD camera imaging system (Biorad). If necessary, quantification of signal strengths was performed using QuantityOne software (Biorad) to measure the ratio of protein bands (glycotyping of PrPC) or to determine relative protein expression against β-actin.
For assessment of PrPSc levels and for use in inoculation experiments (Bioassay), 20% (wt/vol) homogenates of frontal brain were prepared in sterile phosphate buffer saline (PBS) without protease inhibitors. Again, samples were smashed 30× on ice using a Dounce homogenizer and subsequently spun down at 1000 rpm for 2 min. The resulting supernatant was either further diluted in PBS to yield a 1% homogenate used for inoculation of tga20 reporter mice (see above) or 2–5 µl were digested with 20 µg/ml PK (Roche) in a total volume of 22 µl RIPA buffer for 1 hr at 37°C to assess the PrPSc content. For detection of atypical prion fragments, selected samples were digested with 1 or 10 µg/ml or without PK for 1 hr at 37°C. ‘Cold PK’ treatment was performed with 200 µg/ml PK for 1 hr at 4°C. Digestion was stopped by adding 10× loading buffer and boiling for 6 min at 96°C. Subsequent SDS-PAGE and Western blot analysis was performed as described above with the exception that commercial Mini-PROTEAN TGX Any kD gels (Biorad) were used.
Histological and immunohistochemical analysis
Request a detailed protocolMorphological analysis was performed as described previously (Altmeppen et al., 2011; Prox et al., 2013). In brief, brains were dissected and fixed by immersion in 4% buffered formalin overnight. In the case of prion- or mock-inoculated animals, samples were inactivated for 1 hr in 98–100% formic acid before export from the facility. These samples were then incubated overnight with an excess of 4% buffered formalin. Samples were dehydrated and embedded in low melting point paraffin following standard laboratory procedures. Sections of 4 μm were prepared and either stained with hematoxylin and eosin (HE) following standard laboratory procedures or submitted to immunostaining following standard immunohistochemistry procedures using the Ventana Benchmark XT machine (Ventana, Tucson, AZ). Briefly, deparaffinated sections were boiled for 30–60 min in 10 mM citrate buffer (pH 6.0) for antigen retrieval. All solutions were from Ventana. Sections were incubated with primary antibody in 5% goat serum (Dianova, Hamburg, Germany), 45% Tris buffered saline (TBS) pH 7.6, 0.1% Triton X-100 in antibody diluent solution (Zytomed, Berlin, Germany) for 1 hr. The following primary antibodies were used: monoclonal POM1 (Polymenidou et al., 2008) (1:100; Prof Dr Aguzzi, Zürich, Switzerland), SAF84 antibody against PrPC and PrPSc (1:100; Cayman Chemicals, Ann Arbor, MI), anti-GFAP (1:200; M0761, DAKO, Hamburg, Germany), anti-Iba-1 (1:500; 019-19741, Wako Chemicals, Neuss, Germany), anti-NeuN (1:50; MAB377, Millipore). Detection was with anti-rabbit or anti-goat histofine Simple Stain MAX PO Universal immunoperoxidase polymer or Mouse Stain Kit (for detection of mouse antibodies on mouse sections). All secondary antibody polymers were purchased from Nichirei Biosciences (Tokyo, Japan). Detection of antibodies was performed with Ultra View Universal DAB Detection Kit or Ultra View Universal Alkaline Phosphatase Red Detection Kit from Ventana according to standard settings of the machine. Experimental groups were stained in one run, thereby providing identical conditions. The counterstaining was also performed by the machine according to common protocols. Additional negative controls included sections treated with secondary antibody only. For PrPSc detection, mounted tissue sections (4 µm) were pretreated with 98% formic acid for 5 min. Further processing was performed on an automated staining machine (Benchmark XT, Ventana). Briefly, sections were pretreated with 1.1 mM sodium citrate buffer (2.1 mM Tris–HCl, 1.3 mM EDTA, pH 7.8) at 95°C for 30 min, digested with low concentration of PK for 16 min, incubated in Superblock for 10 min and then incubated with the PrP-specific antibody SAF 84 (see above), followed by secondary antibody treatment and detection.
Electron microscopy
Request a detailed protocolSmall pieces of forebrain (2–3 mm3) of terminally prion-diseased A10 cKO mice and littermate controls were fixed in glutaraldehyde, postfixed in osmium tetroxide for 1−2 hr, dehydrated through a series of graded ethanols and propylene oxide, and embedded in Epon. Semi-thin sections were stained with toluidine blue. Ultrathin sections were stained with lead citrate and uranyl acetate, and specimens were examined using a JEM 100 C transmission electron microscope (JEOL, Tokyo, Japan). For the assessment of TVS, sample grids were divided into grid squares of equal size and the number of grid squares presenting TVS clusters was determined as published previously (Falsig et al., 2012).
Isolation, cultivation, modification, and in vitro differentiation of NSCs
Request a detailed protocolAdherently growing NSC cultures were established from the ganglionic eminence of 14-day-old wild-type and NestinA10 KO mice as described elsewhere (Jorissen et al., 2010; Altmeppen et al., 2011). In brief, we first established neurosphere cultures according to standard protocols (Ader et al., 2001; Pressmar et al., 2001). After two passages, neurospheres were enzymatically dissociated using Accutase (PAA Laboratories, Pasching, Austria) and cells were further cultivated in tissue culture flasks coated with 0.1% Matrigel (BD Biosciences, Franklin Lakes, NJ) in DMEM/F12 (Life Technologies, Carlsbad, CA) supplemented with 2 mM glutamine, 5 mM HEPES, 3 mM sodium bicarbonate, 0.3% glucose (all from Sigma–Aldrich, St Louis, MO; in the following termed NS medium) and 10 ng/ml epidermal growth factor (EGF), 10 ng/ml fibroblast growth factor-2 (FGF-2) (both from Tebu-Bio, Le-Perray-en-Yvelines, France), 1% N2 and 1% B27 (both from Life Technologies) to establish adherently growing NSC cultures (Conti et al., 2005; Jung et al., 2013). To express ADAM10 in NestinA10 cKO NSCs, the mouse Adam10 cDNA was cloned into pcDNA3.1/Zeo(−) (Life Technologies), and the linearized plasmid was used to transfect NestinA10 KO NSC using the Nucleofector technology (Lonza, Basel, Switzerland) as described previously (Richard et al., 2005; Altmeppen et al., 2011). As control, NestinA10 KO NSCs were nucleofected with pcDNA3.1/Zeo(−) lacking the Adam10 cDNA. To select for positive cells, cells were further cultivated in NS medium supplemented with 10 ng/ml EGF, 10 ng/ml FGF-2, 1% N2, 1% B27, and 200 µg/ml zeocin.
To induce neuronal differentiation of wild-type, NestinA10 KO and A10-nucleofected NestinA10 KO NSCs, cells were plated onto coverslips coated with 1% Matrigel and maintained for 4 days in NS medium supplemented with 5 ng/ml FGF-2, 1% N2, and 2% B27. Subsequently, cells were cultivated for another 4 days in a 1:1 mixture of NS medium and Neurobasal medium (Life Technologies) containing 0.25% N2 and 2% B27.
Surface biotinylation assay in neuronally differentiated NSCs
Request a detailed protocolAfter neuronal differentiation of NSCs in six-well plates, cells were washed 2× with cold PBS and incubated for 30 min with 0.5 mg EZ-Link Sulfo-NHS-SS-Biotin (Thermo Scientific) in PBS at 4°C under gentle agitation on a rocking platform. Cells were then washed 3× for 5 min at 4°C with 0.1% BSA in PBS and lysed with 500 µl RIPA buffer as described above. After centrifugation, supernatants were diluted 1:1 with Triton dilution buffer (100 mM TEA, 100 mM NaCl, 5 mM EDTA, 0.02% NaN3, 2.5% Triton X-100, pH 8.6, +PI) and incubated for 1 hr with 200 µl pre-washed NeutrAvidin agarose beads (Thermo Scientific) at room temperature on a rotary wheel. Centrifugation was performed at 1000×g for 1 min and supernatant was taken as ‘lysate control’. Beads were washed 3× with wash buffer (20 mM TEA, 150 mM NaCl, 5 mM EDTA, 1% Triton X-100, 0.2% SDS, 0.02% NaN3, pH 8.6, +PI) and spun down. Two more washing steps were performed with final wash buffer (20 mM TEA, 150 mM NaCl, 5 mM EDTA, pH 8.6, +PI) before adding 50 µl of 4× loading buffer including DTT and boiling for 6 min at 96°C to release biotinylated proteins from the beads. Supernatants were taken and loaded onto gels for SDS-PAGE as described above. ‘Lysate controls’ and biotinylated samples were detected via immunblotting using POM1 antibody. As reference and specificity control for surface biotinylated samples, membrane marker Flotillin-1 (murine purified anti-Flot-1; 1:1.000; BD Bioscience) was used.
Immunofluorescence analysis
Request a detailed protocolFor surface staining of PrPC in neuronally differentiated NSCs, live cells were incubated with primary antibody against PrPC (POM1) for 1 hr at 4°C. Cells were then fixed in 4% paraformaldehyde in PBS (pH 7.4), blocked in PBS containing 0.1% bovine serum albumin and 0.3% Triton X-100 (both from Sigma), and incubated with polyclonal rabbit anti-β-tubulin III antibodies (Sigma) overnight at room temperature to identify nerve cells. Primary anti-PrPC and anti-β-tubulin III antibodies were detected with anti-mouse Cy2- and anti-rabbit Cy3-conjugated secondary antibodies (Jackson Immunoresearch Laboratories, West Grove, PA), respectively, and cell nuclei were stained with 4′,6-diamidino-2-phenylindole (DAPI; Sigma).
For MEF cells, surface staining of PrPC and ADAM10 was achieved by incubating live cells for 1 hr at 4°C with primary antibodies POM1 and monoclonal rat anti-mouse ADAM10 ectodomain antibody (1:100, R&D Systems, Minneapolis, MN), respectively. These antibodies were also applied after permeabilization of cells with 0.2% Triton X-100 in PBS. Goat anti-mouse IgG Alexa Fluor 488 and goat anti-rat IgG Alexa Fluor 568 (both from Life Technologies) were used as secondary antibodies prior to mounting the coverslips with DAPI Fluoromount-G (SouthernBiotech, Birmingham, AL) onto object slides.
Quantitative RT-PCR
Request a detailed protocolCortical regions from A10 cKO mice (n = 5) and littermate controls (n = 5) were prepared and total RNA was isolated using the NucleoSpin RNAII kit (Macherey Nagel, Dueren, Germany) according to the manufacturer's instructions. 2 µg of DNAse-treated RNA was used for cDNA synthesis using the RevertAid cDNA Synthesis Kit (Thermo Fisher Scientific). Gene expression analysis for mouse PrPC and GAPDH were performed using the mouse Universal ProbeLibrary System (Roche Applied Science) for qRT-PCR experiments (PrPC: 5′-GCCGACATCAGTCCACATAG, 5′-GGAGAGCCAAGCAGACTATCA, Probe: #71) on a LightCycler480 (Roche Diagnostics). PrPC gene expression levels were depicted as percentage of GAPDH expression using the ΔCT method for calculation. PCR efficiency of each assay was determined by serial dilutions of standards and these values were used for calculation.
Statistical analysis
Request a detailed protocolStatistical comparison of incubation times, Western blot quantifications, and qRT-PCR results between experimental groups was performed using Student's t-test for two-group comparisons with consideration of statistical significance at p values <0.05(*), <0.01(**), and <0.001 (***).
References
-
The prion's elusive reason for beingAnnual Review of Neuroscience 31:439–477.https://doi.org/10.1146/annurev.neuro.31.060407.125620
-
Immune system and peripheral nerves in propagation of prions to CNSBritish Medical Bulletin 66:141–159.https://doi.org/10.1093/bmb/66.1.141
-
Mouse neuroblastoma cells release prion infectivity associated with exosomal vesiclesBiology of the Cell 100:603–615.https://doi.org/10.1042/BC20080025
-
Proteolytic processing of the prion protein in health and diseaseAmerican Journal of Neurodegenerative Disease 1:15–31.
-
Synthetic amyloid-beta oligomers impair long-term memory independently of cellular prion proteinProceedings of the National Academy of Sciences of USA 107:2295–2300.https://doi.org/10.1073/pnas.0911829107
-
High titers of transmissible spongiform encephalopathy infectivity associated with extremely low levels of PrPSc in vivoThe Journal of Biological Chemistry 282:35878–35886.https://doi.org/10.1074/jbc.M704329200
-
Transmission of murine scrapie to P101L transgenic miceThe Journal of General Virology 84:3165–3172.https://doi.org/10.1099/vir.0.19147-0
-
PrP(C) homodimerization stimulates the production of PrPC cleaved fragments PrPN1 and PrPC1The Journal of Neuroscience 32:13255–13263.https://doi.org/10.1523/JNEUROSCI.2236-12.2012
-
Prion protein in Alzheimer's pathogenesis: a hot and controversial issueEMBO Molecular Medicine 2:289–290.https://doi.org/10.1002/emmm.201000088
-
Axonal prion protein is required for peripheral myelin maintenanceNature Neuroscience 13:310–318.https://doi.org/10.1038/nn.2483
-
Prion protein and Abeta-related synaptic toxicity impairmentEMBO Molecular Medicine 2:306–314.https://doi.org/10.1002/emmm.201000082
-
Truncated forms of the human prion protein in normal brain and in prion diseasesThe Journal of Biological Chemistry 270:19173–19180.https://doi.org/10.1074/jbc.270.32.19173
-
Influence of ADAM10 on prion protein processing and scrapie infectiosity in vivoNeurobiology of Disease 36:233–241.https://doi.org/10.1016/j.nbd.2009.07.015
-
Prion protein (PrP) with amino-proximal deletions restoring susceptibility of PrP knockout mice to scrapieThe EMBO Journal 15:1255–1264.
-
An N-terminal fragment of the prion protein binds to amyloid-beta oligomers and inhibits their neurotoxicity in vivoThe Journal of Biological Chemistry 288:7857–7866.https://doi.org/10.1074/jbc.M112.423954
-
Variant Creutzfeldt-Jakob disease: between lymphoid organs and brainTrends in Microbiology 12:51–53.https://doi.org/10.1016/j.tim.2003.12.001
-
Prions hijack tunnelling nanotubes for intercellular spreadNature Cell Biology 11:328–336.https://doi.org/10.1038/ncb1841
-
Overexpression of the Hspa13 (Stch) gene reduces prion disease incubation time in miceProceedings of the National Academy of Sciences of USA 109:13722–13727.https://doi.org/10.1073/pnas.1208917109
-
The alpha-secretase-derived N-terminal product of cellular prion, N1, displays neuroprotective function in vitro and in vivoThe Journal of Biological Chemistry 284:35973–35986.https://doi.org/10.1074/jbc.M109.051086
-
Alpha-Secretase-derived fragment of cellular prion, N1, protects against monomeric and oligomeric amyloid beta (Abeta)-associated cell deathThe Journal of Biological Chemistry 287:5021–5032.https://doi.org/10.1074/jbc.M111.323626
-
Tubulovesicular particles occur early in the incubation period of murine scrapieActa Neuropathologica 99:525–528.https://doi.org/10.1007/s004010051155
-
The disintegrin/metalloproteinase ADAM10 is essential for the establishment of the brain cortexThe Journal of Neuroscience 30:4833–4844.https://doi.org/10.1523/JNEUROSCI.5221-09.2010
-
Genetically modified neural stem cells for a local and sustained delivery of neuroprotective factors to the dystrophic mouse retinaStem Cells Translational Medicine 2:1001–1010.https://doi.org/10.5966/sctm.2013-0013
-
Protease-sensitive prion species in neoplastic spleens of prion-infected mice with uncoupling of PrP(Sc) and prion infectivityThe Journal of General Virology 94:453–463.https://doi.org/10.1099/vir.0.045922-0
-
Constitutive and regulated alpha-secretase cleavage of Alzheimer's amyloid precursor protein by a disintegrin metalloproteaseProceedings of the National Academy of Sciences of USA 96:3922–3927.https://doi.org/10.1073/pnas.96.7.3922
-
The complex PrP(c)-Fyn couples human oligomeric Abeta with pathological tau changes in Alzheimer's diseaseThe Journal of Neuroscience 32:16857–16871a.https://doi.org/10.1523/JNEUROSCI.1858-12.2012
-
Increased proportions of C1 truncated prion protein protect against cellular M1000 prion infectionJournal of Neuropathology and Experimental Neurology 68:1125–1135.https://doi.org/10.1097/NEN.0b013e3181b96981
-
Cellular prion protein regulates its own alpha-cleavage through ADAM8 in skeletal muscleThe Journal of Biological Chemistry 287:16510–16520.https://doi.org/10.1074/jbc.M112.360891
-
Physiology of the prion proteinPhysiological Reviews 88:673–728.https://doi.org/10.1152/physrev.00007.2007
-
Filipin prevents pathological prion protein accumulation by reducing endocytosis and inducing cellular PrP releaseThe Journal of Biological Chemistry 277:25457–25464.https://doi.org/10.1074/jbc.M203248200
-
Endoproteolytic processing of the mammalian prion glycoprotein familyThe FEBS Journal 281:862–876.https://doi.org/10.1111/febs.12654
-
A new paradigm for enzymatic control of alpha-cleavage and beta-cleavage of the prion proteinThe Journal of Biological Chemistry 289:803–813.https://doi.org/10.1074/jbc.M113.502351
-
Signal transduction through prion proteinScience 289:1925–1928.https://doi.org/10.1126/science.289.5486.1925
-
Soluble prion protein inhibits amyloid-beta (Abeta) Fibrillization and toxicityThe Journal of Biological Chemistry 287:33104–33108.https://doi.org/10.1074/jbc.C112.400614
-
Similar turnover and shedding of the cellular prion protein in primary lymphoid and neuronal cellsThe Journal of Biological Chemistry 276:44627–44632.https://doi.org/10.1074/jbc.M107458200
-
Dual mechanisms for shedding of the cellular prion proteinThe Journal of Biological Chemistry 279:11170–11178.https://doi.org/10.1074/jbc.M312105200
-
PrP27-30 is a normal soluble prion protein fragment released by human plateletsBiochemical and Biophysical Research Communications 223:572–577.https://doi.org/10.1006/bbrc.1996.0936
-
Accumulation of prion protein in the brain that is not associated with transmissible diseaseProceedings of the National Academy of Sciences of USA 104:4712–4717.https://doi.org/10.1073/pnas.0609241104
-
The fate of heterotopically grafted neural precursor cells in the normal and dystrophic adult mouse retinaInvestigative Ophthalmology & Visual Science 42:3311–3319.
-
Electroporation-based gene transfer for efficient transfection of neural precursor cellsBrain Research Molecular Brain Research 138:182–190.https://doi.org/10.1016/j.molbrainres.2005.04.010
-
NADPH oxidase and extracellular regulated kinases 1/2 are targets of prion protein signaling in neuronal and nonneuronal cellsProceedings of the National Academy of Sciences of USA 100:13326–13331.https://doi.org/10.1073/pnas.2235648100
-
The CD40/CD154 receptor/ligand dyadCellular and Molecular Life Sciences 58:4–43.https://doi.org/10.1007/PL00000776
-
Axonal and transynaptic spread of prionsJournal of Virology 88:8640–8655.https://doi.org/10.1128/JVI.00378-14
-
Spontaneous generation of anchorless prions in transgenic miceProceedings of the National Academy of Sciences of USA 108:21223–21228.https://doi.org/10.1073/pnas.1117827108
-
A soluble form of prion protein in human cerebrospinal fluid: implications for prion-related encephalopathiesBiochemical and Biophysical Research Communications 184:1398–1404.https://doi.org/10.1016/S0006-291X(05)80038-5
-
Role of ADAMs in the ectodomain shedding and conformational conversion of the prion proteinThe Journal of Biological Chemistry 284:22590–22600.https://doi.org/10.1074/jbc.M109.032599
-
The N-terminal, polybasic region of PrP(C) dictates the efficiency of prion propagation by binding to PrP(Sc)The Journal of Neuroscience 32:8817–8830.https://doi.org/10.1523/JNEUROSCI.1103-12.2012
-
Proteolytic processing of the ovine prion protein in cell culturesBiochemical and Biophysical Research Communications 337:232–240.https://doi.org/10.1016/j.bbrc.2005.09.031
-
Alzheimer amyloid-beta oligomer bound to postsynaptic prion protein activates Fyn to impair neuronsNature Neuroscience 15:1227–1235.https://doi.org/10.1038/nn.3178
-
The disintegrins ADAM10 and TACE contribute to the constitutive and phorbol ester-regulated normal cleavage of the cellular prion proteinThe Journal of Biological Chemistry 276:37743–37746.https://doi.org/10.1074/jbc.M003965200
-
Ectodomain shedding and ADAMs in developmentDevelopment 139:3693–3709.https://doi.org/10.1242/dev.076398
-
Regulation of adult hematopoiesis by the a disintegrin and metalloproteinase 10 (ADAM10)Biochemical and Biophysical Research Communications 442:234–241.https://doi.org/10.1016/j.bbrc.2013.11.020
-
A naturally occurring C-terminal fragment of the prion protein (PrP) delays disease and acts as a dominant-negative inhibitor of PrPSc formationThe Journal of Biological Chemistry 286:44234–44242.https://doi.org/10.1074/jbc.M111.286195
-
The ADAMs family: coordinators of nervous system development, plasticity and repairProgress in Neurobiology 79:73–94.https://doi.org/10.1016/j.pneurobio.2006.05.001
-
Recombinant human prion protein inhibits prion propagation in vitroScientific Reports 3:2911.https://doi.org/10.1038/srep02911
Article and author information
Author details
Funding
Deutsche Forschungsgemeinschaft (SFB877)
- Hermann C Altmeppen
- Johannes Prox
- Luise Linsenmeier
- Paul Saftig
- Markus Glatzel
Leibniz Association (Leibniz Graduate School)
- Hermann C Altmeppen
European Commission Directorate-General for Research and Innovation (REGPOT-2012-2013-1,7FP)
- Beata Sikorska
- Pawel P Liberski
Werner Otto Stiftung
- Hermann C Altmeppen
- Luise Linsenmeier
Hans & Ilse Breuer Stiftung
- Paul Saftig
Deutsche Forschungsgemeinschaft (GRK1459)
- Paul Saftig
- Markus Glatzel
Deutsche Forschungsgemeinschaft (FOR885 (GL 589/5))
- Markus Glatzel
University of Hamburg (Young investigator research grant of the Medical Faculty)
- Hermann C Altmeppen
The funders had no role in study design, data collection and interpretation, or the decision to submit the work for publication.
Acknowledgements
We thank Dr Melanie Neumann and Kristin Hartmann from the Mouse Pathology Facility, University Medical Center Hamburg-Eppendorf (UKE), for their valuable support in the immunohistochemical stainings. Moreover, we thank Dr Bernd Zobiak and Dr Virgilio Failla from the UKE Microscopy and Imaging Facility (UMIF) for technical support. We thank Prof Dr Adriano Aguzzi (Zurich, Switzerland) for providing us with the POM antibodies.
Ethics
Animal experimentation: Our study was carried out in accordance with the principles of laboratory animal care (NIH publication No. 86-23, revised 1985) as well as the recommendations in the Guide for the Care and Use of Laboratory Animals of the German Animal Welfare Act on protection of animals. The protocol was approved by the Committee on the Ethics of the Freie und Hansestadt Hamburg—Amt für Gesundheit und Verbraucherschutz (permit number 48/09, 81/07 and 84/13). Every effort was made to minimize suffering.
Copyright
© 2015, Altmeppen et al.
This article is distributed under the terms of the Creative Commons Attribution License, which permits unrestricted use and redistribution provided that the original author and source are credited.
Metrics
-
- 3,564
- views
-
- 560
- downloads
-
- 83
- citations
Views, downloads and citations are aggregated across all versions of this paper published by eLife.
Citations by DOI
-
- 83
- citations for umbrella DOI https://doi.org/10.7554/eLife.04260
Download links
A two-part list of links to download the article, or parts of the article, in various formats.
Downloads (link to download the article as PDF)
Open citations (links to open the citations from this article in various online reference manager services)
Cite this article (links to download the citations from this article in formats compatible with various reference manager tools)
The sheddase ADAM10 is a potent modulator of prion disease
eLife 4:e04260.
https://doi.org/10.7554/eLife.04260


