Side-binding proteins modulate actin filament dynamics
- Ludwig-Maximilians-Universität München, Germany
- Max Planck Institute of Biochemistry, Germany
- Technische Universität München, Germany
- Helmholtz Zentrum München, Germany
- Cells-in-Motion Cluster of Excellence (EXC 1003 – CiM), University of Münster, Germany
Figures
Figure 1 with 1 supplement
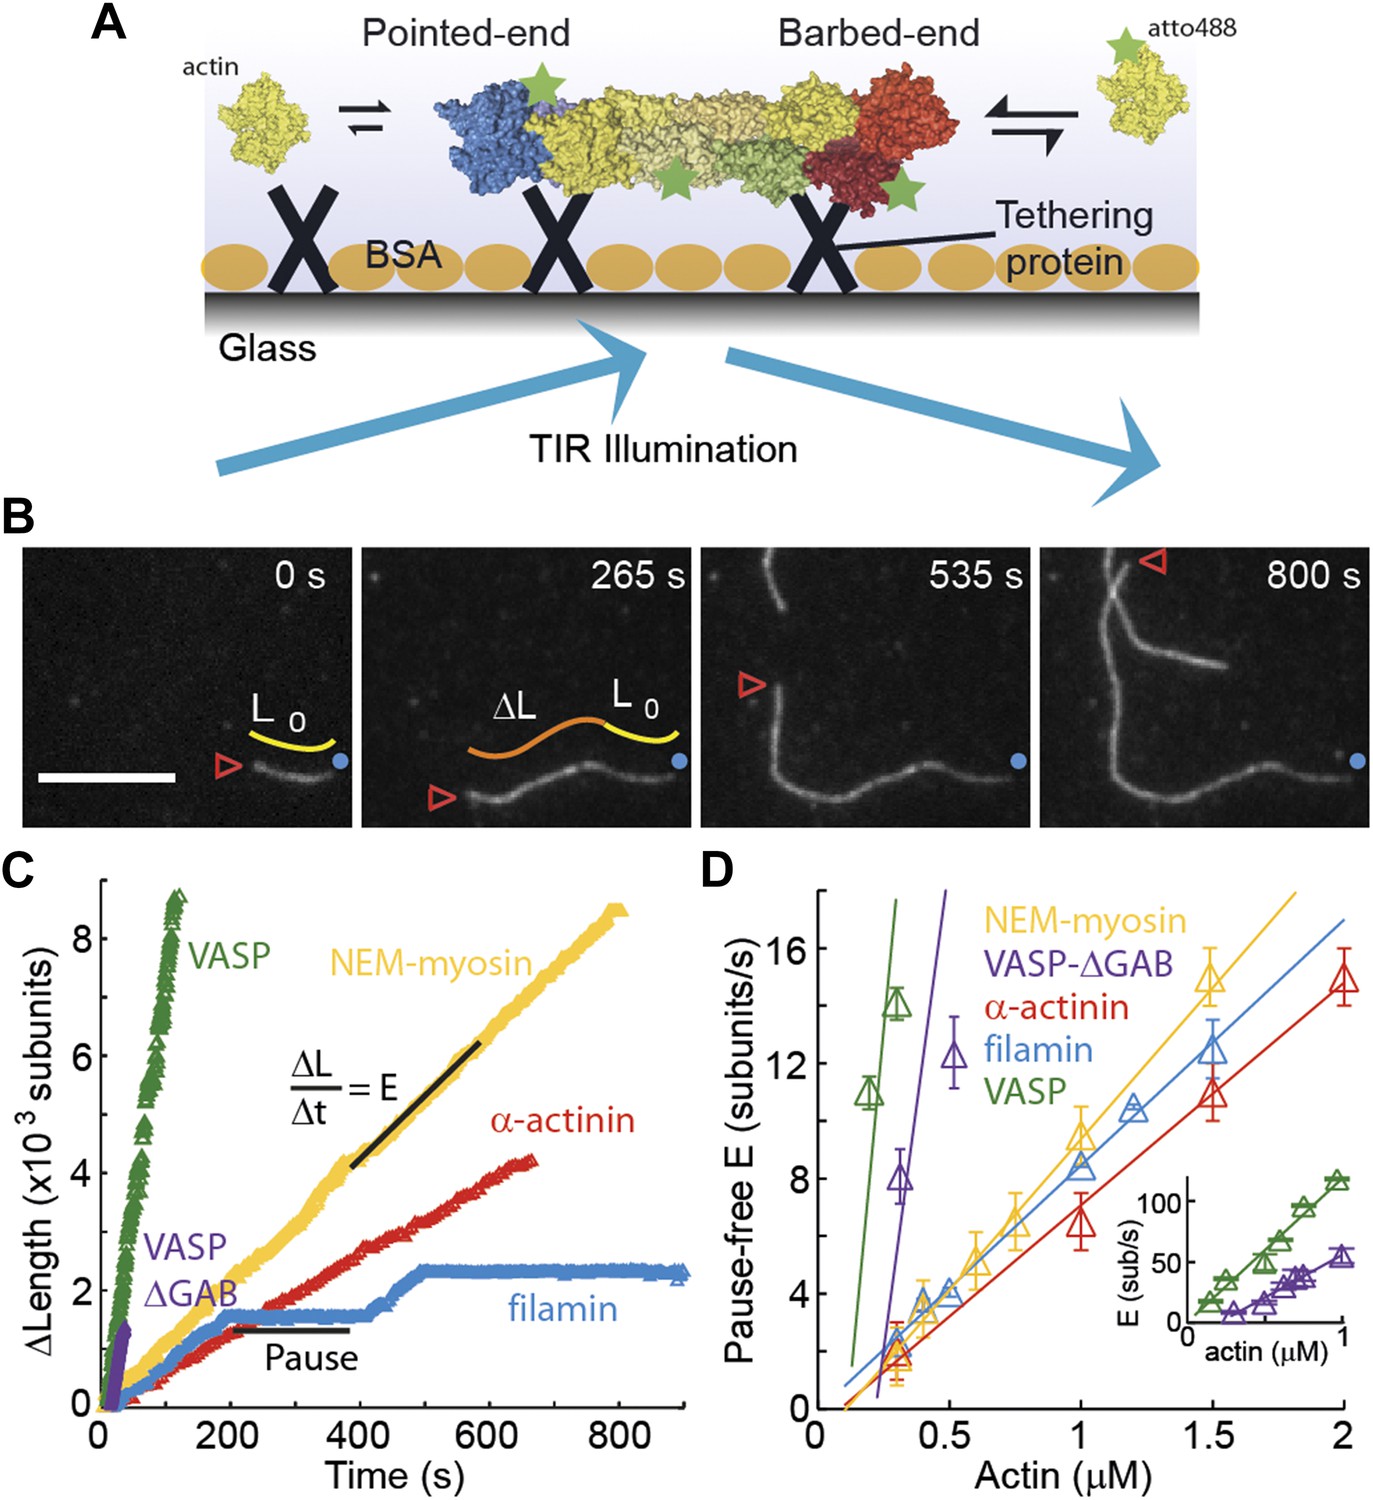
The dependence of the barbed-end kinetics on the side-binding protein.
(A) A schematic of total internal reflection illumination and single actin filament imaging of filaments tethered to a glass surface. Filaments grow from the addition of subunits at either the barbed- or the pointed-end. (B) Selected frames from a movie showing the growth of a single actin filament that is tethered to the surface via α-actinin. The barbed-end is marked by a red arrowhead and the pointed-end by a blue dot. The elapsed time interval is given in seconds. Scale bar: 5 μm. L0 and ΔL are the initial filament length and the change in length, respectively. (C) ΔL as a function of time for single filaments grown on surfaces with different tethering proteins. (D) Elongation velocity (E) as a function of actin concentration in solution for different tethering proteins (inset, zoom out of the VASP and VASP ΔGAB values). The elongation velocity was determined from the slope of the graphs of ΔL vs time in regions where no pauses were observable. Error bars represent s.e.m. (n > 20). Tether density here is ∼2000 molecules/μm2.
Figure 1—figure supplement 1
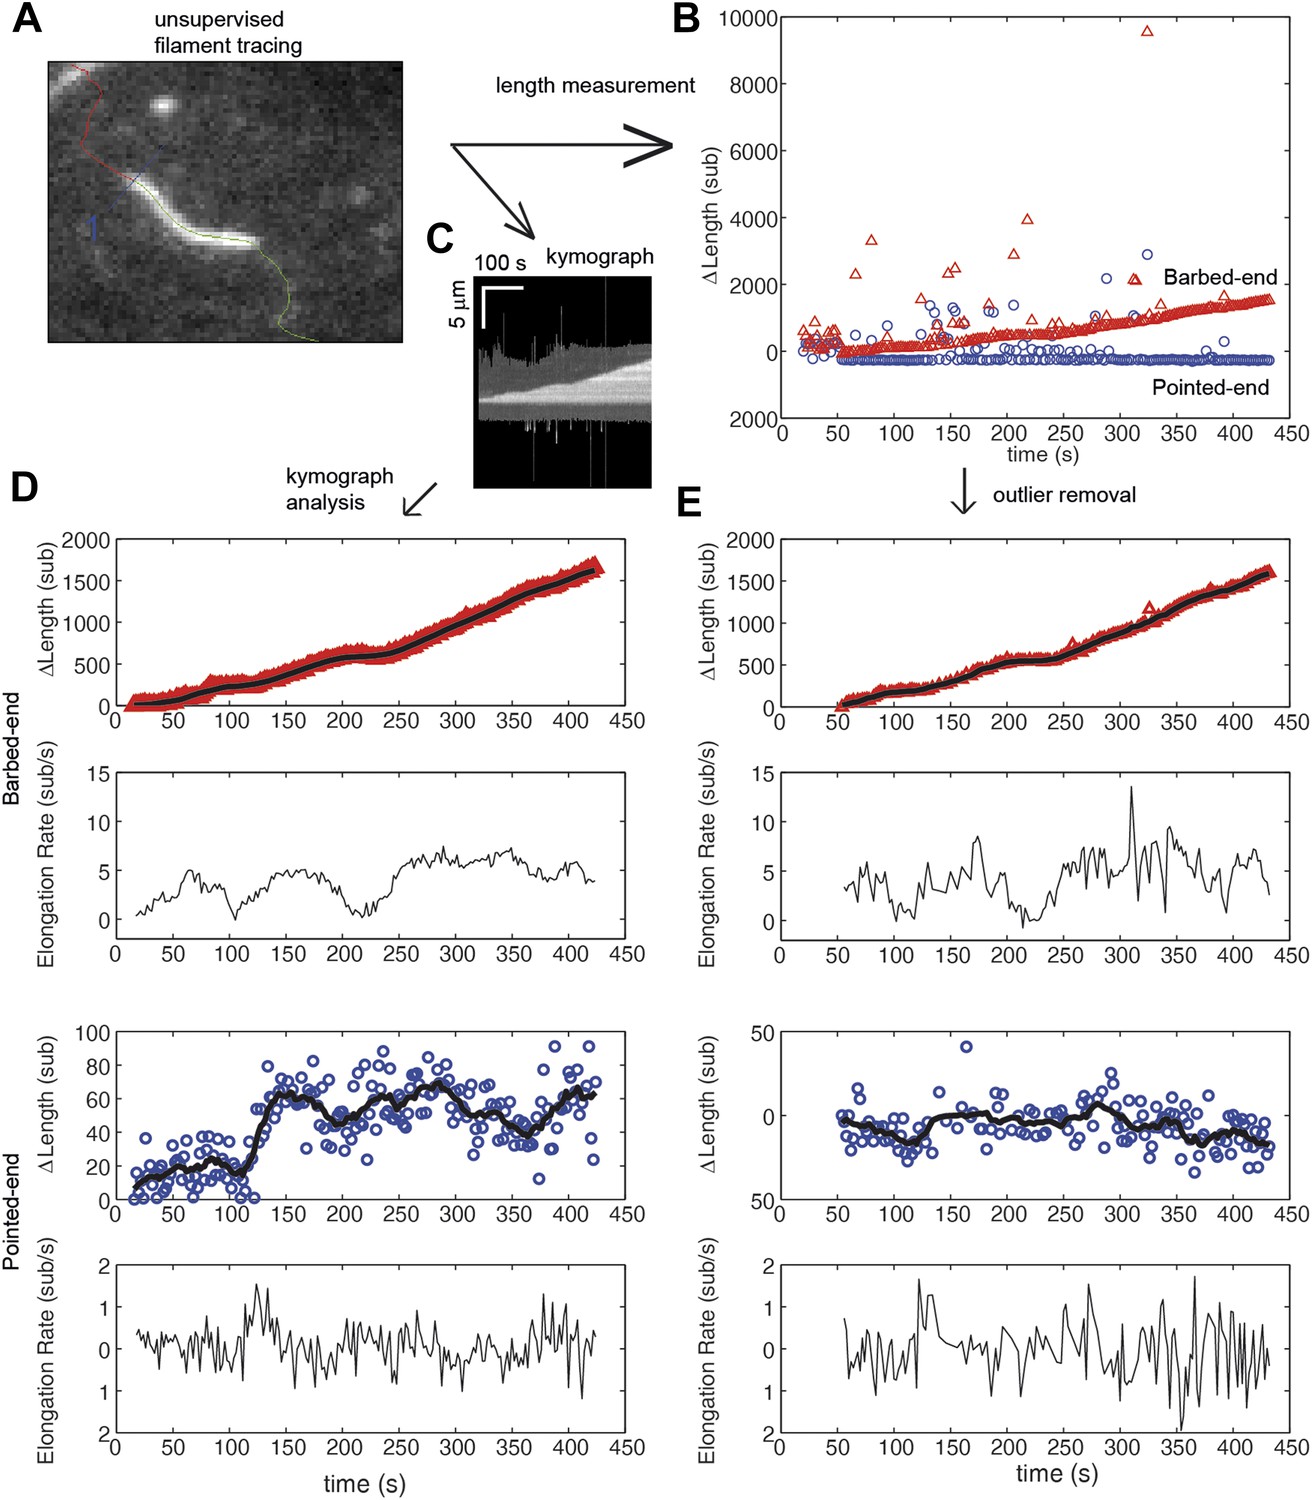
Comparison of algorithms for end-detection and filament growth.
(A) An image from a TIRF measurement of the elongation of an actin filament tethered to the surface using filamin. From the movie, an automated filament tracing analysis, developed by Kuhn and Pollard (2005), provides: (B) an estimate of the length of the filament based upon a polynomial fitting algorithm (Kuhn and Pollard, 2005); and (C) a kymograph of filament growth is produced. (D) From the kymograph, we determined the position of the ends of the filament using an error function fit as implemented by Demchouk et al. (2011). The growth of the ends and the elongation rate, determined from the consecutive differences in the position, are shown for the pointed and barbed-ends. Points represent raw data of the change in length, ΔL, as a function of time while the black solid lines correspond to the data using a running mean with a window of 10 s. (E) For comparison, a simple procedure to obtain estimates of elongation velocity is shown. First, ΔL outliers resulting from the algorithm (e.g., shown in green in panel A) were removed. Second, instantaneous elongation velocity was calculated from the trace of ΔL as a function of time. As can be observed, the error function fit to the kymograph provides better estimates of the position of the ends and displays less noise. Additionally, subtle changes in length at the pointed-end are detected that were not observed when using the length estimate from the automated filament tracing.
Figure 2
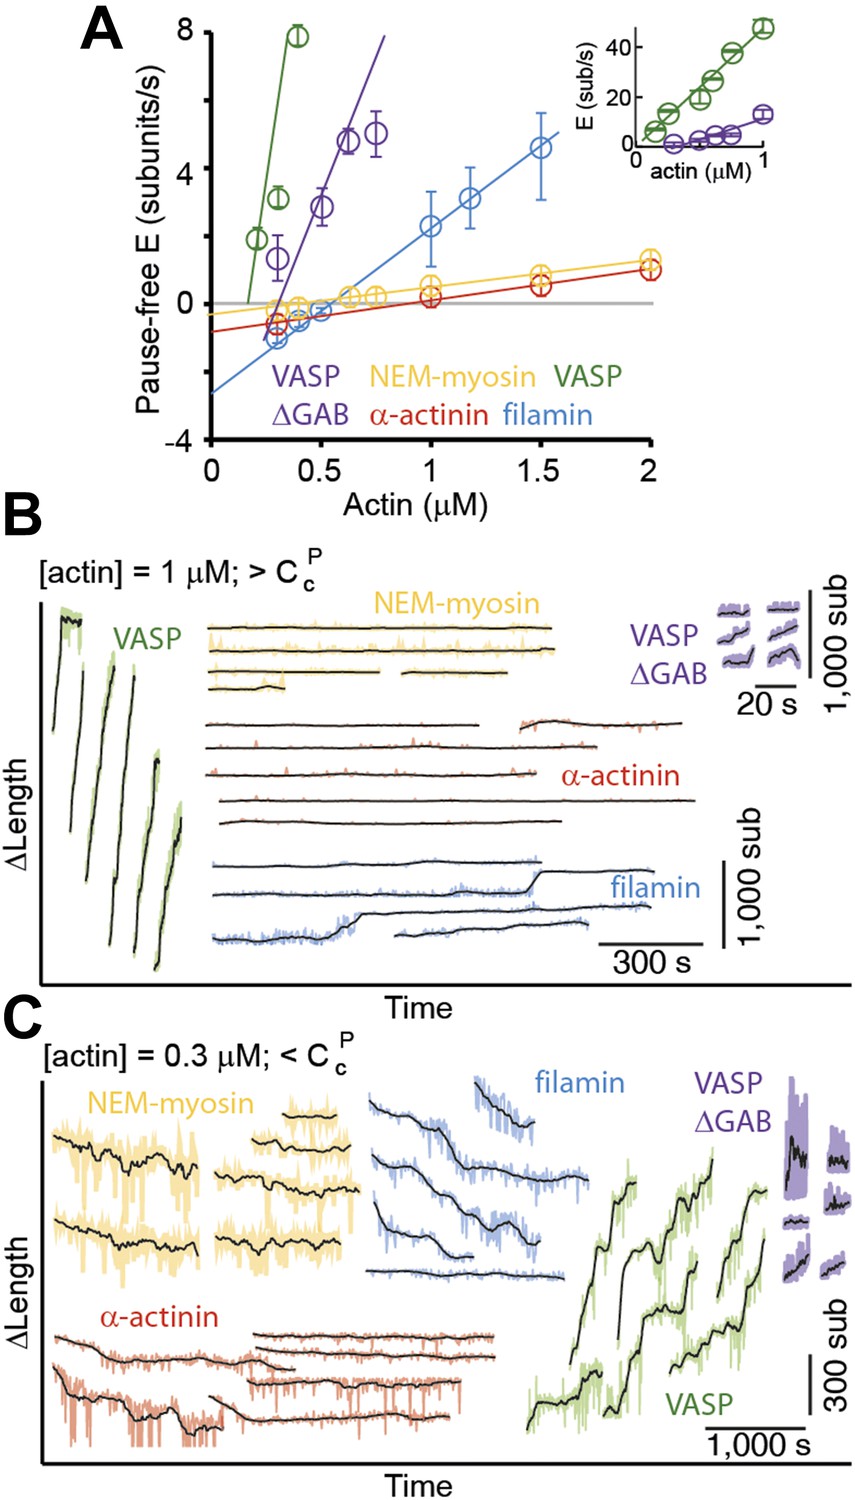
Pointed-end elongation and depolymerization kinetics as a function of the associated side-binding protein.
(A) The elongation velocity (E) is plotted as a function of free actin concentration. Error bars are s.e.m. (n > 20). (B–C) A gallery of traces of ΔL as a function of time for pointed-ends observed at (B) 1 μM or (C) 0.3 μM free actin monomer concentration for the different tethering proteins studied. The raw data are shown in color, and the black solid lines are a running average of 10 data points.
Figure 3 with 5 supplements
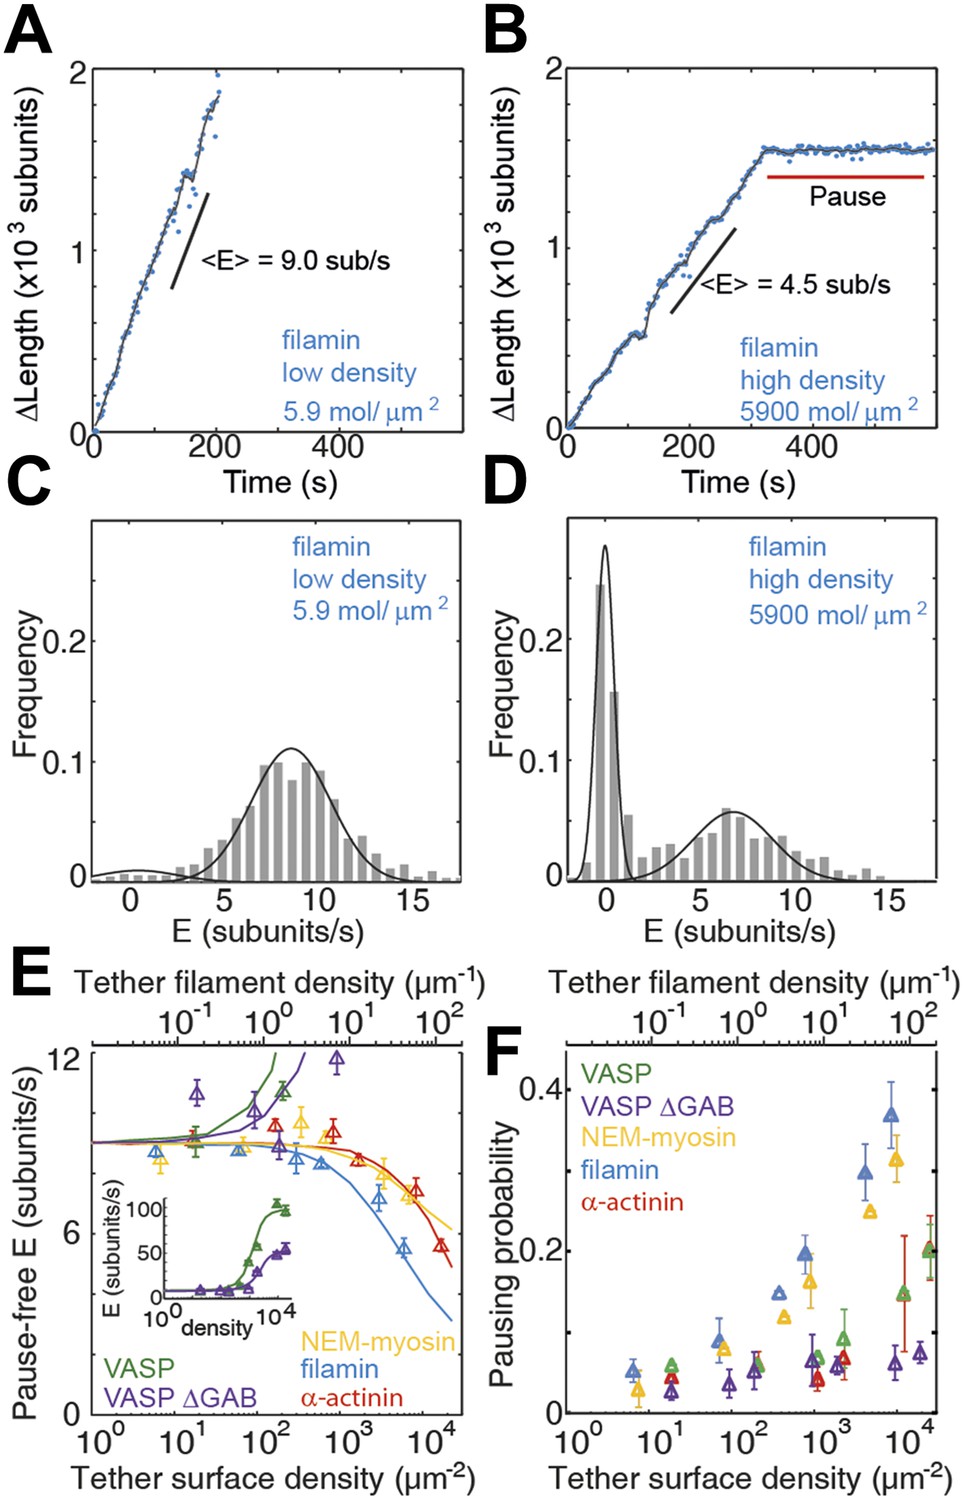
Barbed-end actin filament elongation as a function of the surface density of side-binding proteins.
(A–B) The change in length, ΔL, of actin filaments as a function of time when using filamin as the surface tethering protein at the (A) lowest (5.9 molecules/μm2 or 0.03 molecules per micron of filament) or (B) the highest (5900 molecules/μm2 or 35 molecules per micron of filament) density. (C–D) Distribution of elongation velocities for filaments using a filamin-coated surface at the (C) lowest or (D) highest density. Solid lines are fits to Gaussian distributions. The distribution is calculated by binning the instantaneous elongation velocity of more than 20 filaments into 0.75 subunits/s bin size. (E) Elongation velocity as a function of tether surface density estimated from the kinetically active phases. The surface density is plotted as number of tethering proteins per unit surface area on the lower axis and the equivalent number of tethering proteins per μm of filament on the upper axis. Solid lines are fits to a model where protein binding induces an allosteric effect that persists along the filament over a certain length scale (see ‘Materials and methods’ for details). (F) Pausing probability as a function of surface tether density. Error bars represent s.e.m. (n > 20).
Figure 3—figure supplement 1
Actin filament elongation as a function of the surface density of side-binding proteins.
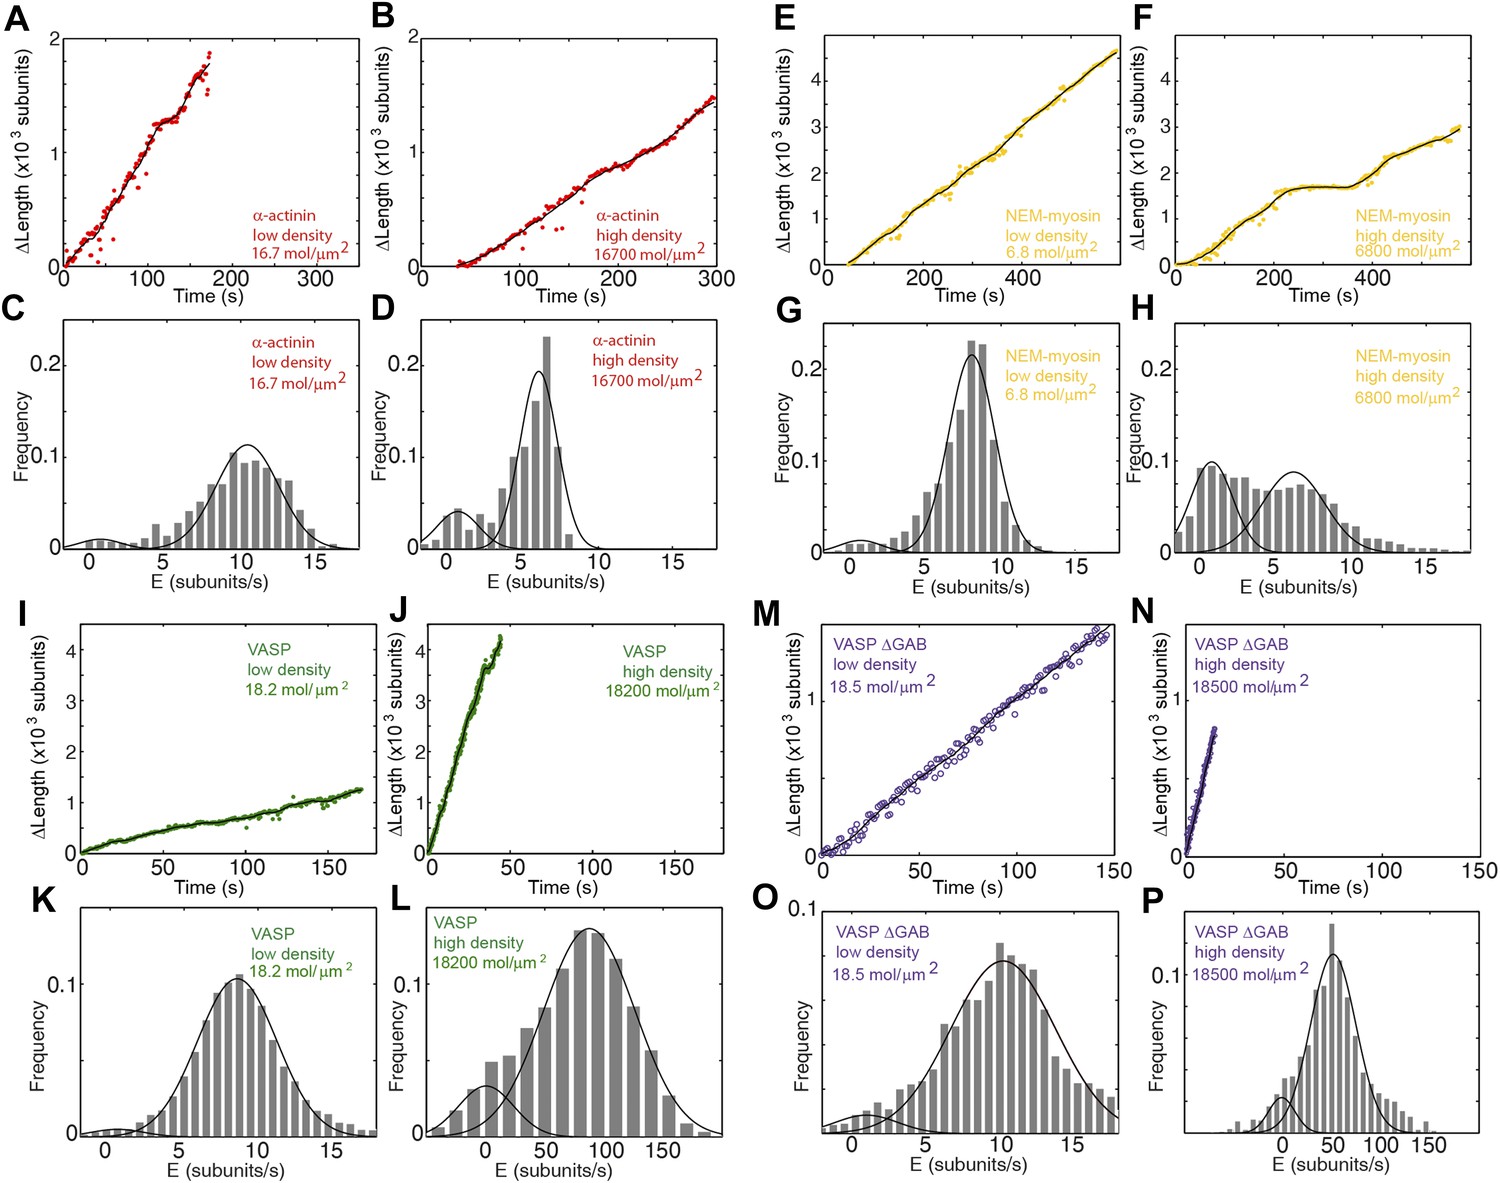
(A–B) The change in length, ΔL, as a function of time for a filament tether to the surface using α-actinin at (A) low (16.7 molecules/μm2 or 0.1 molecules per micron of filament) or (B) high (16,700 molecules/μm2 or 100 molecules per micron of filament) surface densities. (C–D) The distribution of elongation velocities measured at (C) low or (D) high density. The distribution is calculated by binning the instantaneous elongation velocity of more than 20 filaments into bins of 0.75 subunits/s. Solid lines are fits to Gaussian distributions. (E–F) The change in length, ΔL, as a function of time for a filament tether to the surface using NEM-myosin at (E) low (6.8 molecules/μm2 or 0.04 molecules per micron of filament) or (F) high (6800 molecules/μm2 or 40 molecules per micron of filament) surface densities. (G–H) Elongation velocity distribution of filaments using a NEM-myosin-coated surface at low (G) or high (H) density. The distribution is calculated by binning the instantaneous elongation velocity of more than 20 filaments into bins of 0.75 subunits/s. Solid lines are fits to Gaussian distributions. (I–J) The change in length, ΔL, as a function of time for a filament tether to the surface using VASP at (I) low (18.2 molecules/μm2 or 0.1 molecules per micron of filament) or (J) high (18,200 molecules/μm2 or 100 molecules per micron of filament) surface density. (K–L) Elongation velocity distribution of filaments using a VASP-coated surface at low (K) or high (L) density. The distribution is calculated by binning the instantaneous elongation velocity of more than 20 filaments into bins of 0.75 subunits/s and 10 subunits/s for the low- and high-density experiments, respectively. Solid lines are fits to Gaussian distributions. (M–N) The change in length, ΔL, as a function of time for a filament tether to the surface using VASP ΔGAB at (M) low (18.5 molecules/μm2 or 0.1 molecules per micron of filament) or (N) high (18,500 molecules/μm2 or 100 molecules per micron of filament) surface density. (O–P) Elongation velocity distribution of filaments using a VASP ΔGAB-coated surface at low (O) or high (P) density. The distribution is calculated by binning (0.75 sub/s and 10 sub/s bin size for low and high density, respectively) the instantaneous elongation velocity of more than 20 filaments. Solid lines are fits to Gaussian distributions.
Figure 3—figure supplement 2
Barbed- and pointed-end actin filament elongation kinetics.
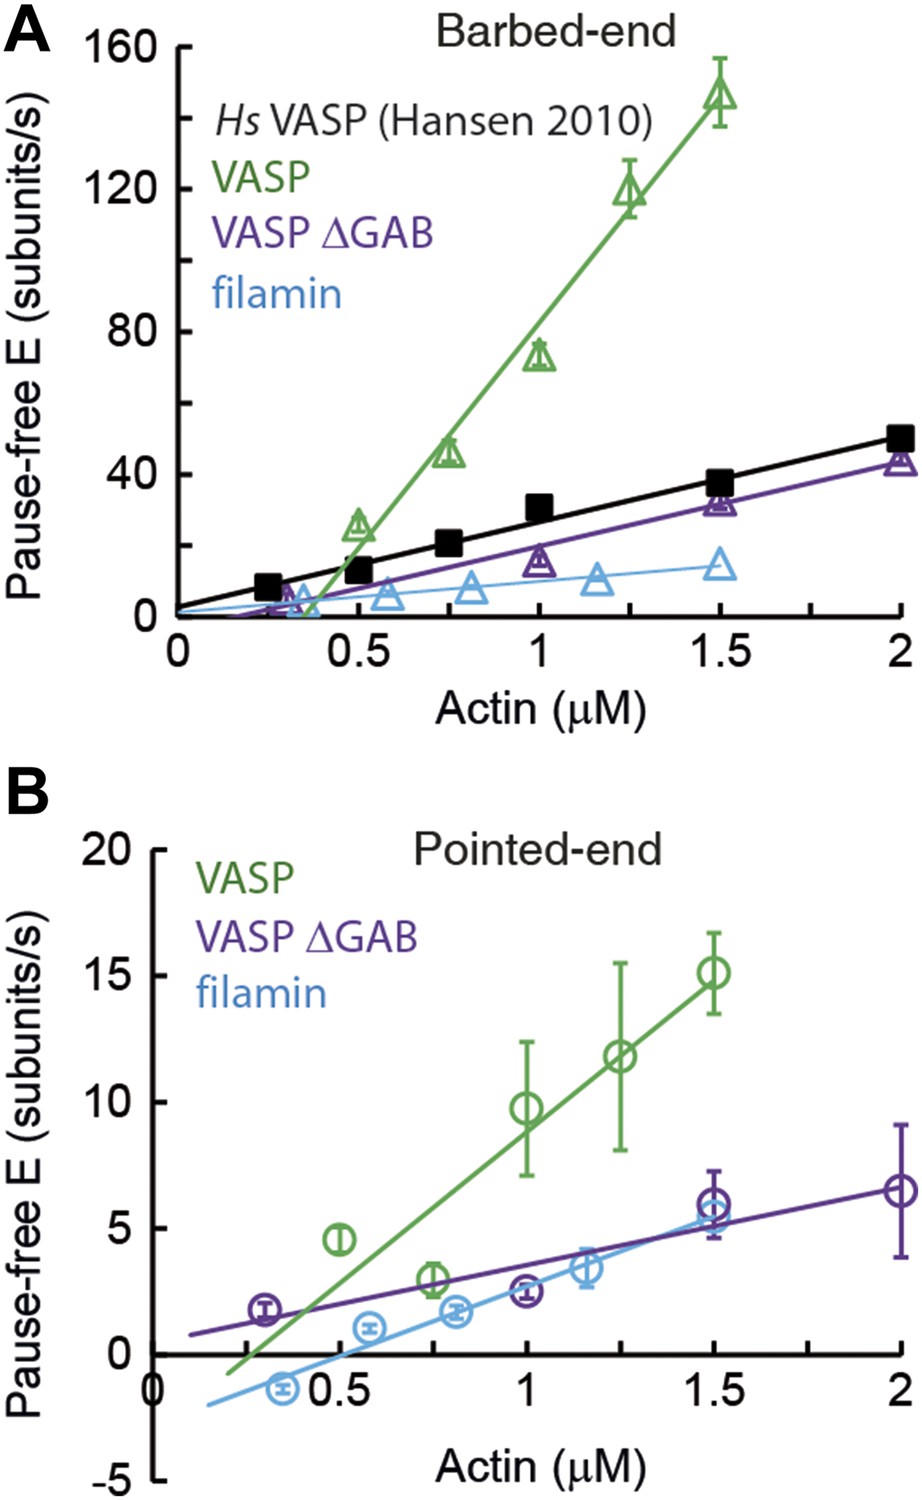
Barbed-end (A) and pointed-end (B) pause-free elongation velocities (E) as a function of free actin concentration in solution in the presence, also in solution, of different tethering proteins. Solid lines are linear fits to the data. Solid lines are linear fits to the data. Error bars in (A–B) represent s.e.m. (n > 20). The side-binding protein concentrations in solution used here corresponded to 64 nM, 17 nM, 67 nM, and 100 nM for VASP, filamin, VASP ΔGAB and Hs VASP respectively. Data for Hs VASP were taken from Hansen and Mullins (2010).
Figure 3—figure supplement 3
Barbed-end actin filament elongation as a function of side-binding proteins concentration.
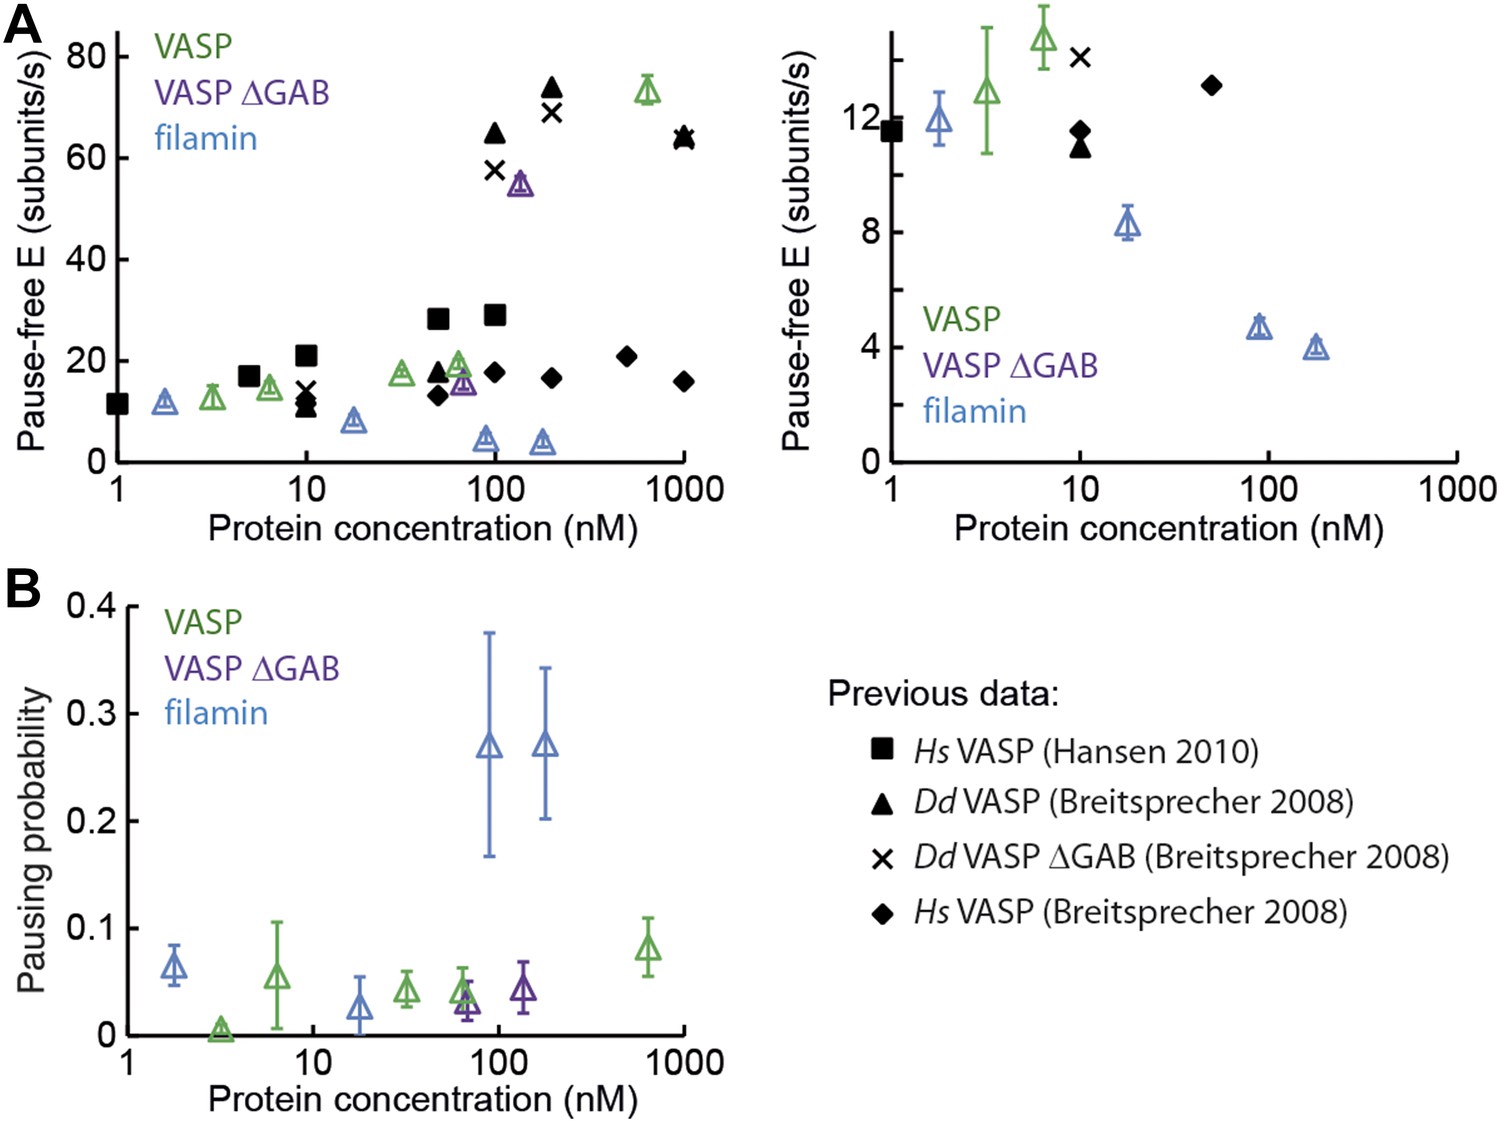
(A) Elongation velocity of 1 μM actin (30% atto488 labeled) as a function of side-binding protein concentration in solution from kinetically active phases. A surface density of <100 molecules/μm2 of NEM-myosin was used to attach the filaments to the surface and thereby aid in imaging and analysis. (B) Pausing probability as a function of side-binding protein concentration. Error bars represent s.e.m. (n > 20).
Figure 3—figure supplement 4
Schematic of the proposed model.
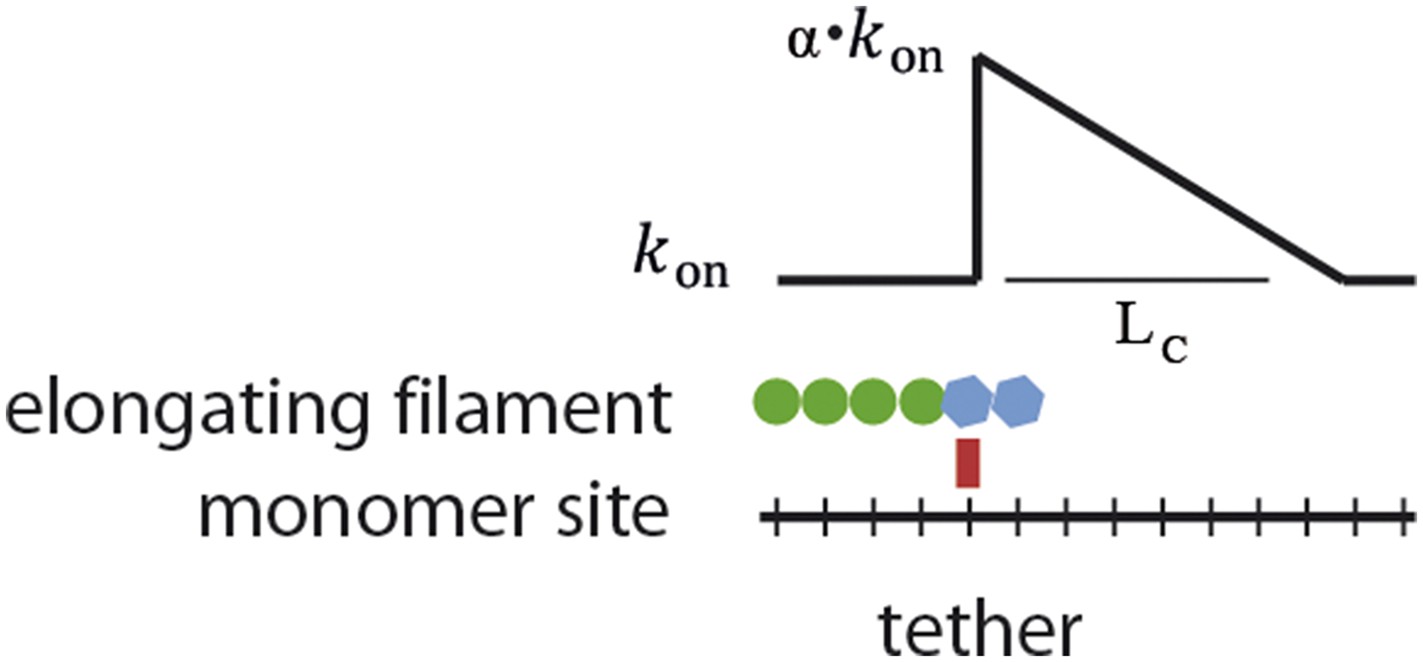
Interaction of a lattice-binding protein (red square) with the actin filament (blue) alters the basal elongation rate (kon0) of successive association events by a factor α over a characteristic length LC.
Figure 3—figure supplement 5
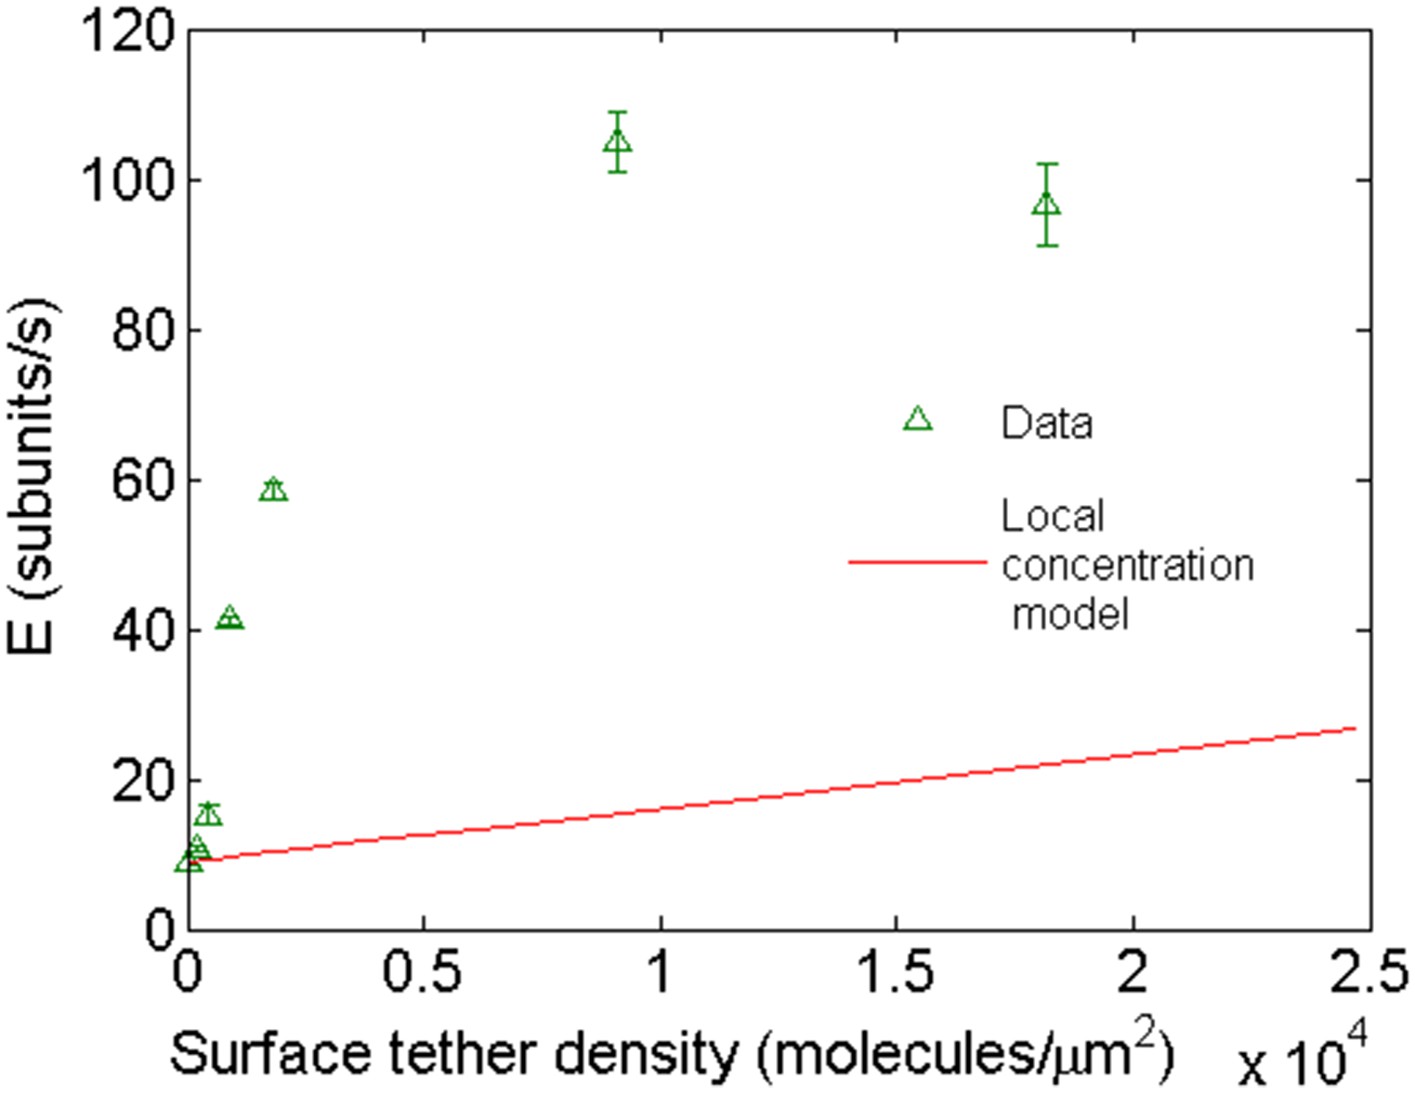
Comparison of the expected behavior using a higher local concentration mechanism with experimental results.
Open green triangles are experimental data of barbed-end elongation as a function of VASP surface density in the presence of 1 μM-free actin in solution. The solid line is the expected average E calculated with Equation 3 assuming a local increase in actin concentration due to the capacity of VASP to simultaneously bind four actin monomers.
Figure 4 with 3 supplements
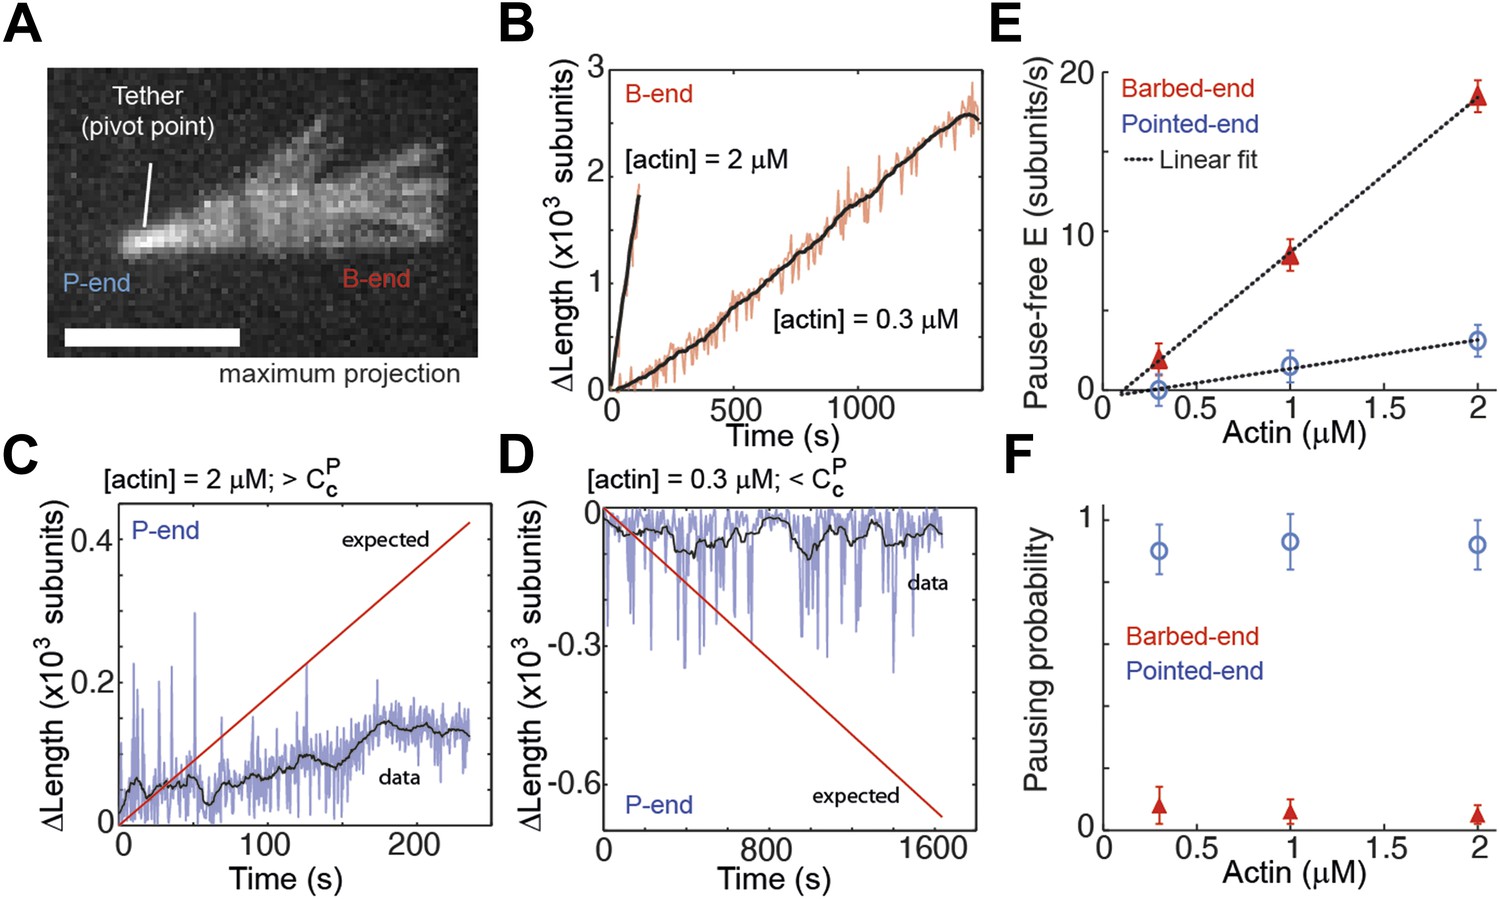
Intrinsic filament dynamics.
(A) A maximum projection image from a movie of an actin filament tethered to a glass surface via a single α-actinin molecule where the tethering position about which the filament swivels is visible as a constriction point. Scale bar: 3 μm. (B) Change in length of the barbed-end vs time for individual actin filaments attached to the surface using the lowest tethering protein surface densities at 300 nM and 2 μM concentrations of free actin monomers. (C–D) Change in length vs time of the pointed-ends of single, elongating actin filaments using the lowest tethering protein surface densities and either 2 μM (C) or 300 nM (D) of actin monomers free in solution. The red lines represent the expected elongation behavior based on previously reported rates using NEM-myosin as a tether (Kuhn and Pollard, 2005; Fujiwara et al., 2007). (E) The pause-free elongation velocity (E) plotted as a function of free actin concentration. The lines represent linear fits. Estimated rates are reported in Table 1. Error bars are s.e.m. (n > 20). (F) Pausing probability as a function of free actin concentration. Error bars represent s.e.m. (n > 20).
Figure 4—figure supplement 1
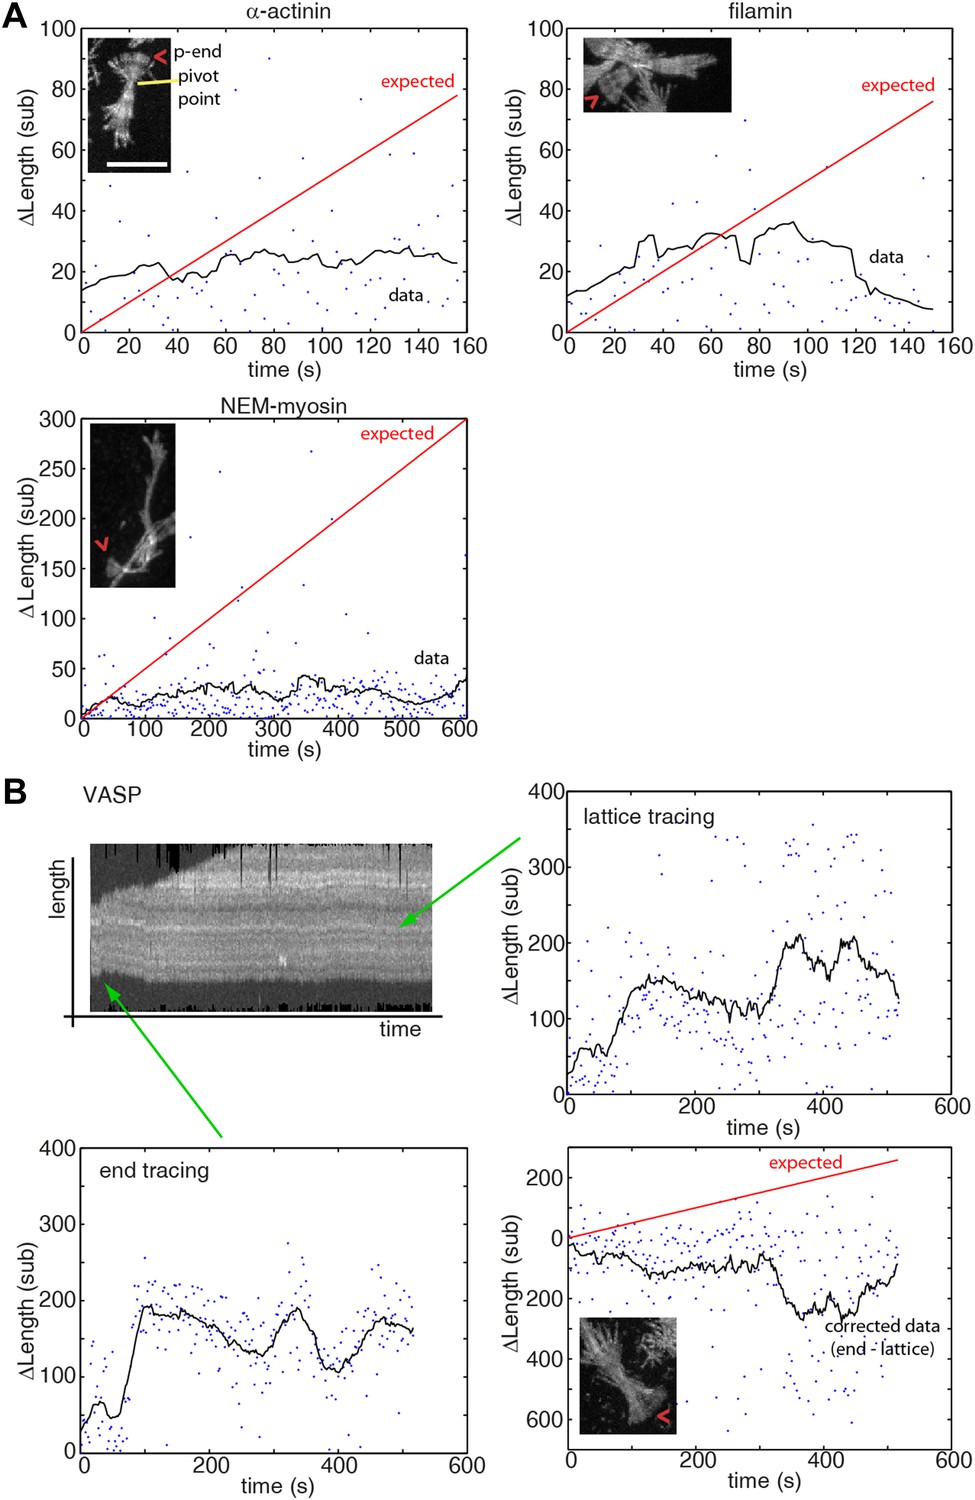
Pointed-end pausing on freely swiveling ends for various tethering proteins.
(A–B) The change in length of the pointed-end of actin filaments as a function of time at 1 μM-free actin concentration are shown when using (A) α-actinin, NEM-myosin, filamin, and (B) VASP as tethering proteins. Points represent raw data while black solid lines correspond to a running mean with a window of 20 s. The solid red line is the elongation rate expected based on reported values. A maximum projection image from the respective movie is shown as inset. (B) (upper left panel) Kymograph of a growing filament showing lateral fluctuations due to weak binding of the filament to the tether. For accurate length determination with filament sliding, both the pointed-end (lower left panel) and a fiduciary marker (upper right panel) were tracked. The corrected data (lower right panel) shows mostly a paused state. Scale bar: 5 μm.
Figure 4—figure supplement 2
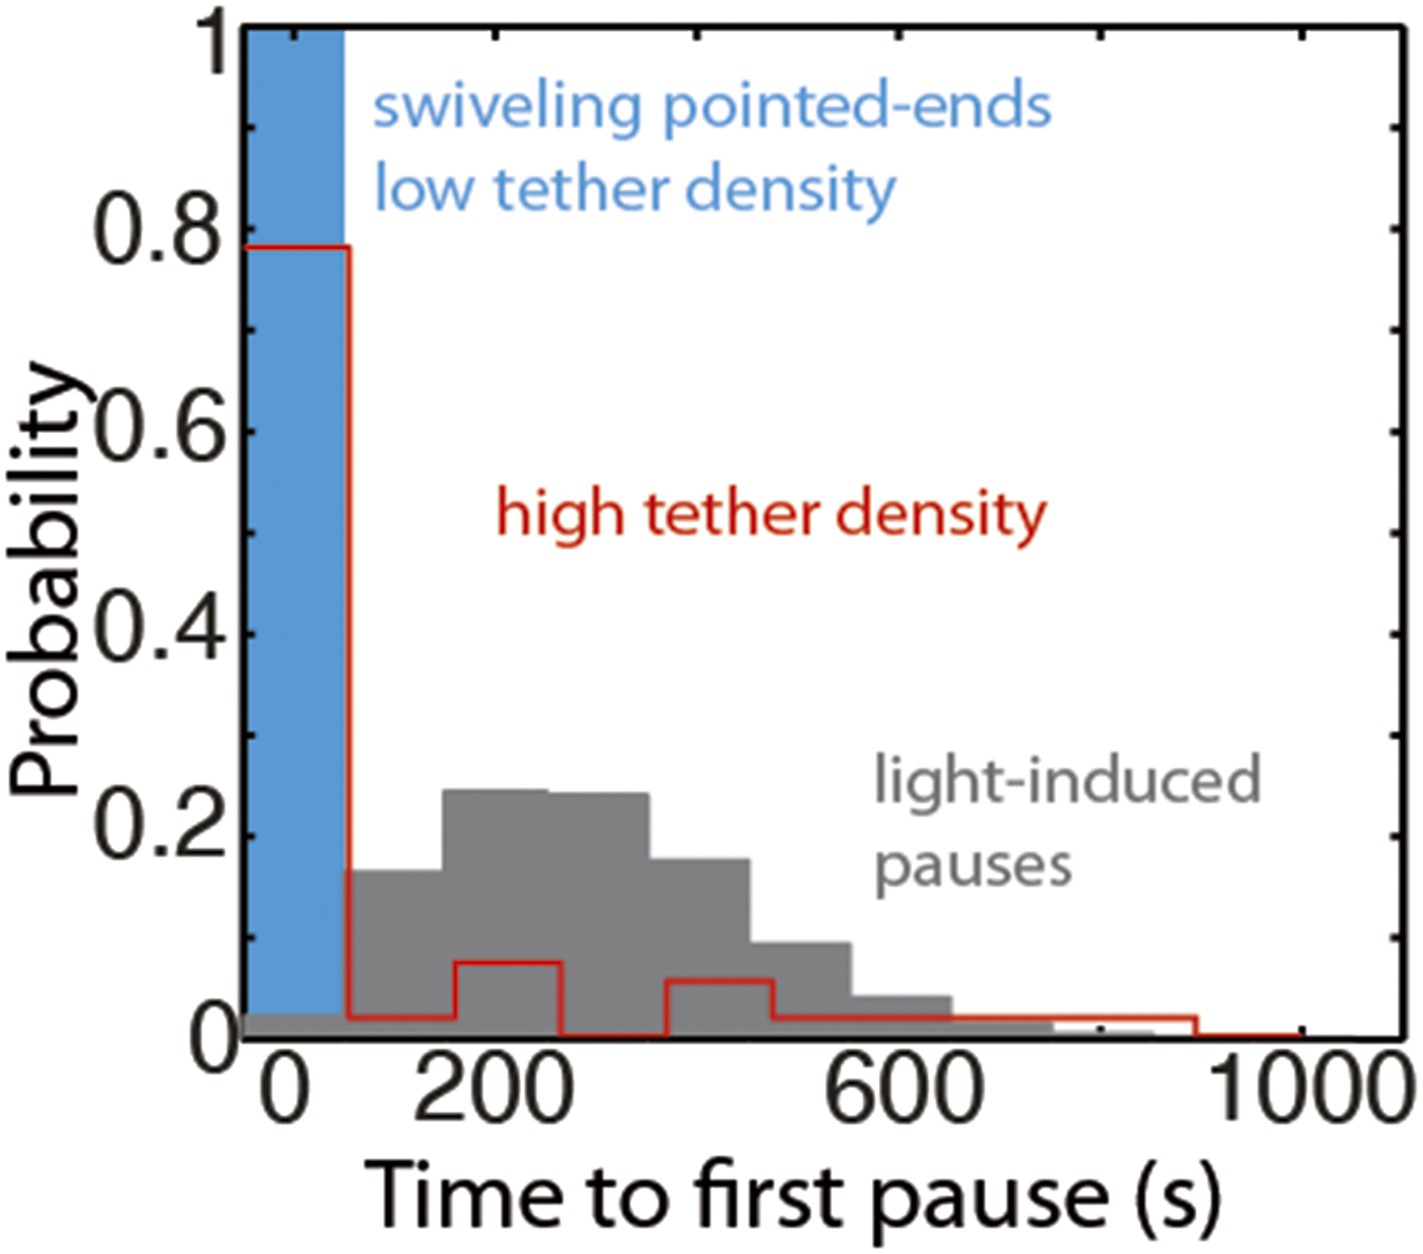
The distribution of the time to the first elongation pause at 300 nM free actin concentration.
The distribution of the observed time to the first pause for depolymerizing pointed-ends at the lowest tether density (blue bar), at medium to high tether density (pooled data, red bars), or predicted using a model for light-induced dimerization (gray bars, see ‘Materials and methods’).
Figure 4—figure supplement 3
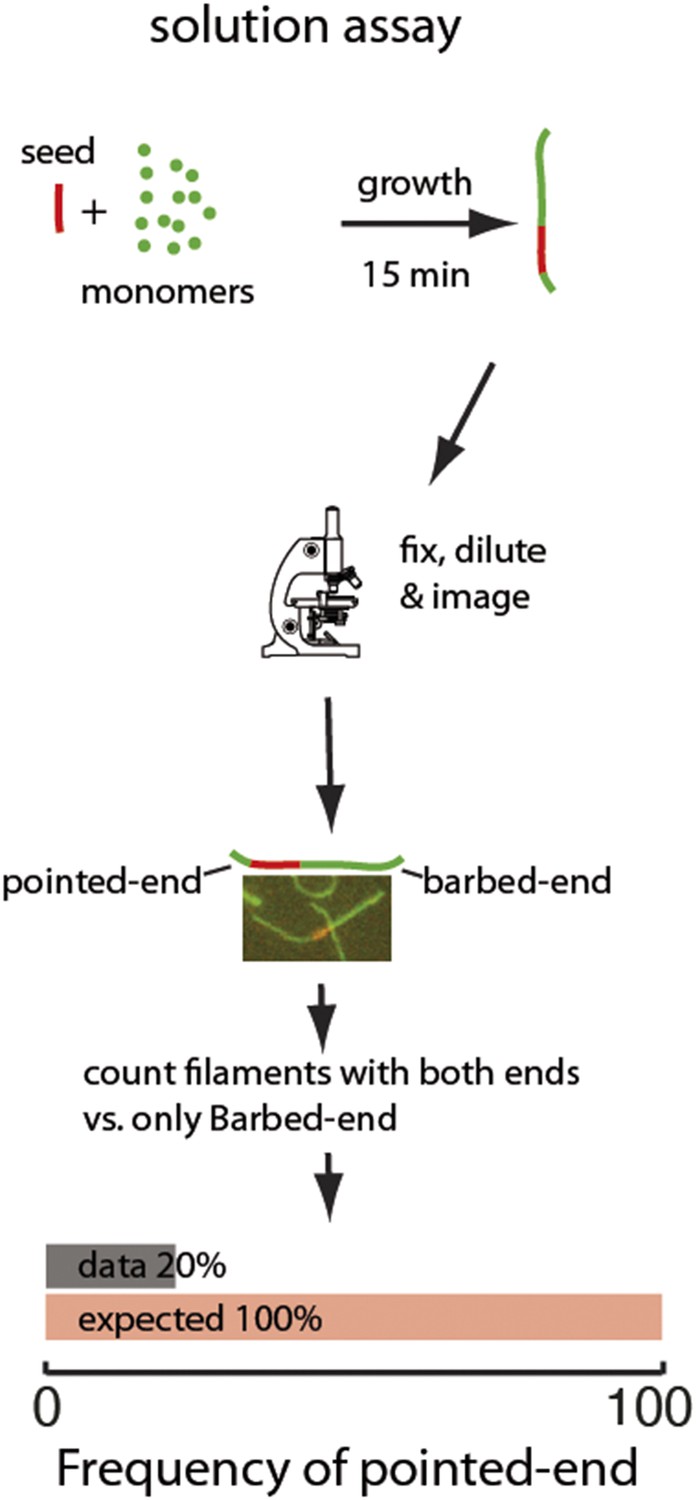
Two-color seeded assay for visualizing pointed-end growth from an actin filament seed.
A schematic of the assay is shown. Actin filament fragments labeled in red with atto565 were used as seeds for filament growth in a solution of atto488-labeled (green) actin monomers. After 15 min, the reaction was stopped by addition of phalloidin and dilution to a final concentration below 200 nM of free monomers. Filaments formed during this time are therefore diluted and individual filaments can easily be visualized. The filaments exhibiting growth at the barbed-end or at both ends were counted. The last figure shows the results of the analysis: the observed (gray) frequency of filaments that exhibited pointed-end growth, 20% was significantly smaller than the predicted value (red) of 100% (n = 1000).
Figure 5
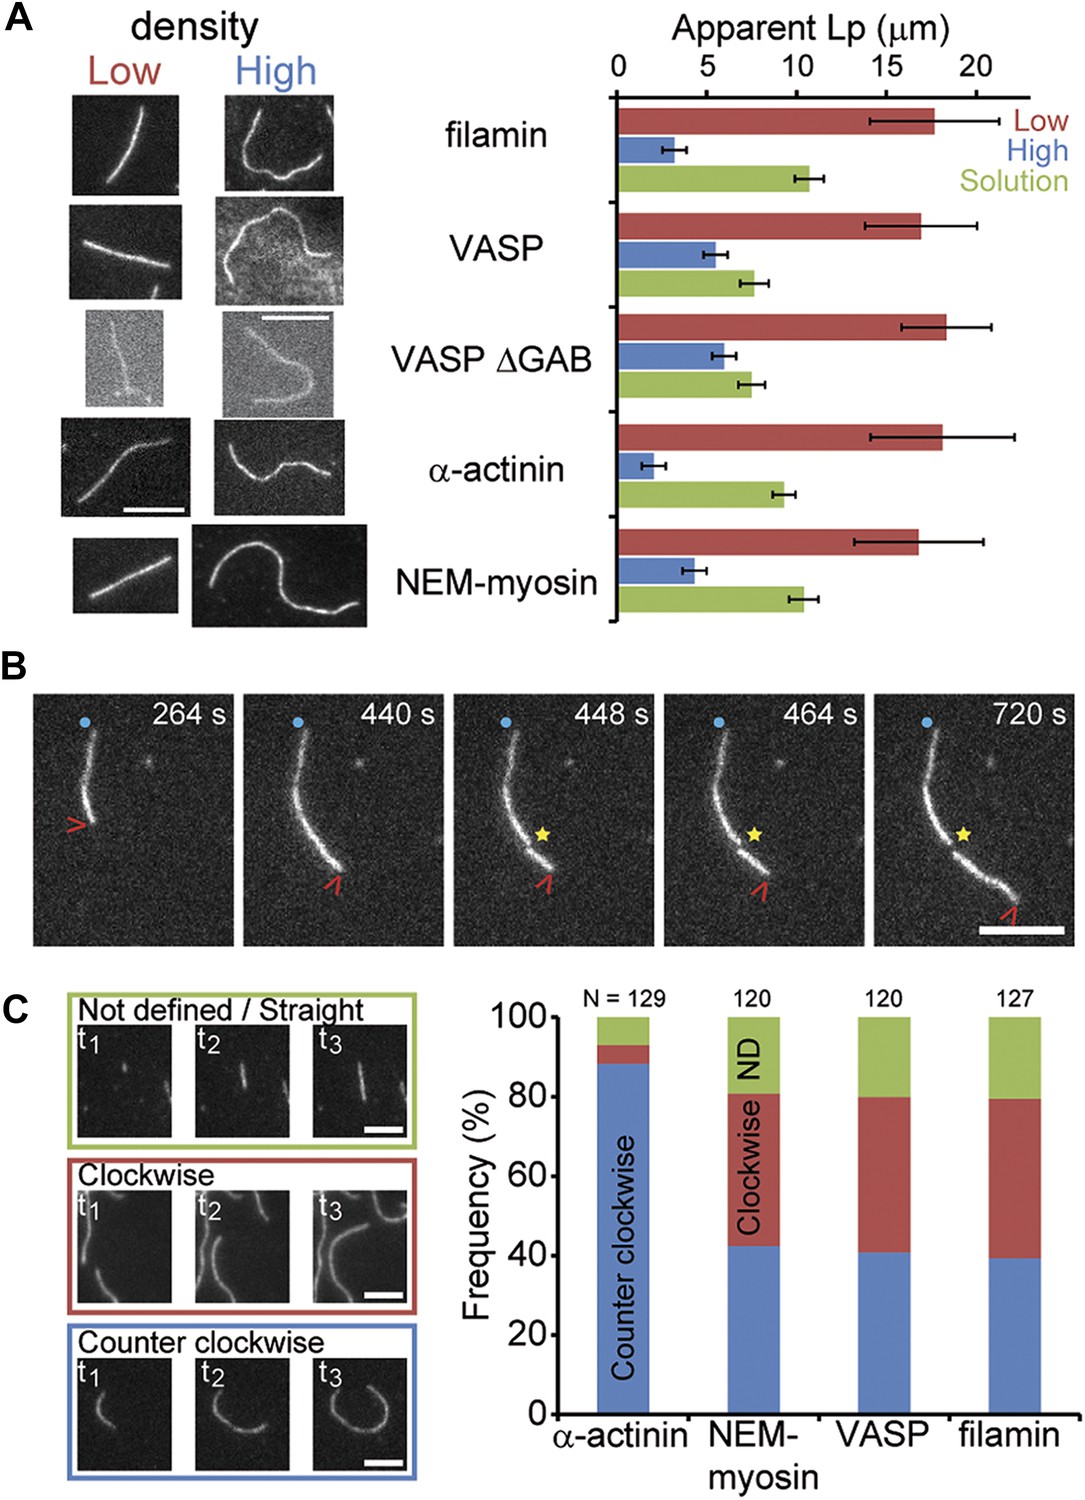
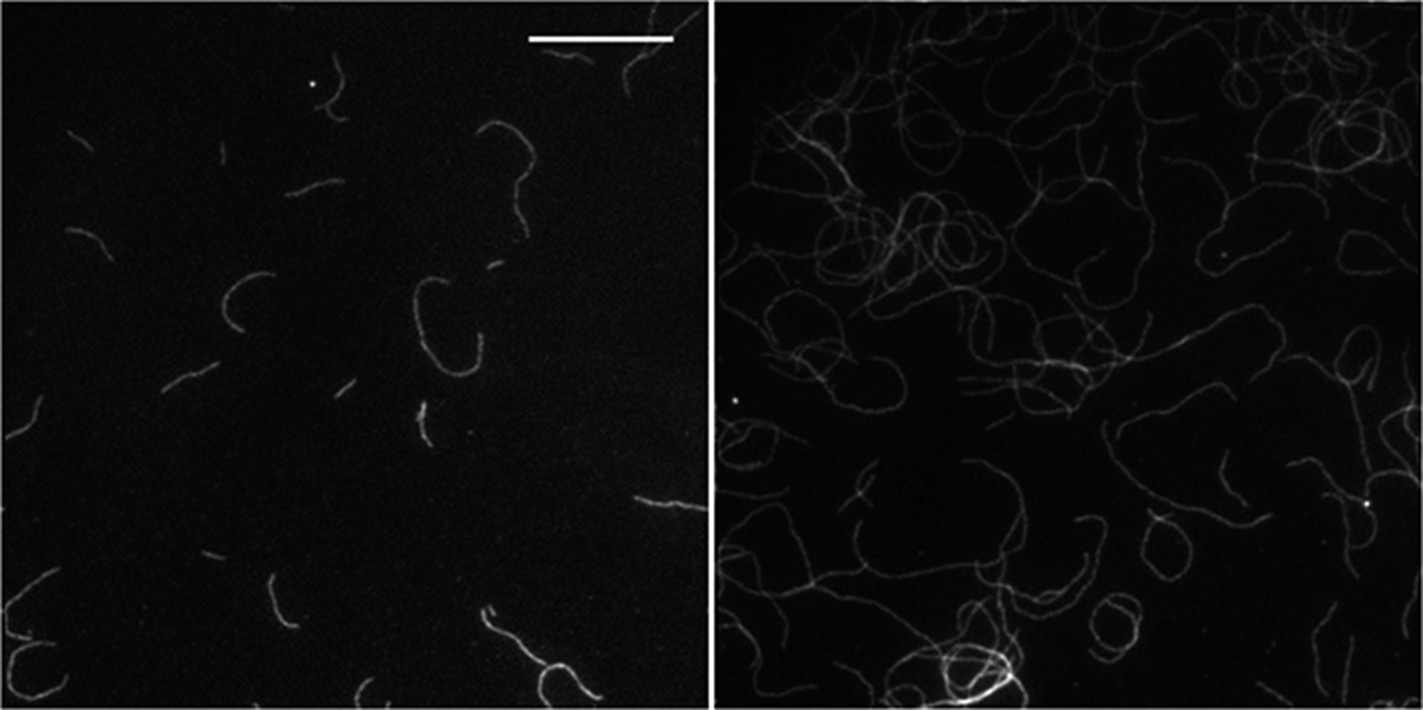
Side-binding proteins alter filament structure.
(A) (left panels) Images of individual filaments attached to the surface using different side-binding proteins at the lowest or highest surface density of tethering protein. Scale bar: 5 μm. (right panels) Estimated apparent persistence length from the angular correlation along the filament contour length at the lowest (red) and the highest (blue) lattice-binding protein densities, and when the protein is present in solution (green). Error bars represent s.e.m. of more than 50 filaments measured per experimental condition. (B) Images from a movie of an individual growing actin filament under treadmilling conditions. The barbed-end is marked with a red arrowhead and pointed-end with a blue dot. The filament undergoes a fragmentation event (yellow star) at 488 s and afterwards depolymerizes from its new pointed-end while the newly created barbed-end does not elongate. The free-actin concentration was 400 nM. Time is given in seconds. Scale bar: 5 μm. (C) Characterization of the direction of barbed-end filament growth as a function of the tethering protein used (see ‘Materials and methods’ for details). Examples of each class are shown in the left panels. Scale bars: 3 μm. α-actinin was observed to grow almost exclusively in the counterclockwise direction. No preferred direction of growth is observed for the other side-binding proteins measured.
Author response image 1
Tables
Table 1
Rate constants of Mg-ATP-actin monomer association and dissociation at both ends of the actin filament in the absence and presence of side-binding proteins
| End | kon (sub·μM−1·s−1) | koff (sub·s−1)† | koff/kon (μM) | Reference | |
|---|---|---|---|---|---|
| actin alone | Barbed | 11.6 ± 1.2 | 1.4 ± 0.8 | 0.12 ± 0.07 | (Pollard, 1986) |
| Pointed | 1.3 ± 0.2 | 0.8 ± 0.3 | 0.6 ± 0.17 | (Pollard, 1986) | |
| Barbed | 9.7 ± 2* | 1 ± 0.3 | 0.1 ± 0.04 | this work | |
| Pointed | 2.1 ± 0.8 | 0.8 ± 0.4 | 0.4 ± 0.35 | this work | |
| Surface adsorbed | |||||
| NEM-myosin | Barbed | 11 ± 1 | 1.6 ± 0.7 | 0.15 ± 0.03 | this work |
| Pointed | 0.8 ± 0.1 | 0.4 ± 0.1 | 0.5 ± 0.2 | this work | |
| Dd VASP | Barbed | 120 ± 30 | 1 ± 3 | 0.01 ± 0.03 | this work |
| Pointed | 48 ± 10 | 0.5 ± 2 | 0.01 ± 0.05 | this work | |
| filamin | Barbed | 8.5 ± 1.3 | 0.1 ± 0.4 | 0.012 ± 0.002 | this work |
| Pointed | 5.3 ± 0.1 | 2.6 ± 0.2 | 0.5 ± 0.04 | this work | |
| α-actinin | Barbed | 7.7 ± 1.5 | 0.7 ± 1 | 0.1 ± 0.2 | this work |
| Pointed | 0.9 ± 0.3 | 0.9 ± 0.3 | 1 ± 1 | this work | |
| Dd VASP ΔGAB | Barbed | 70 ± 13 | 14 ± 9 | 0.2 ± 0.2 | this work |
| Pointed | 16 ± 12 | 5 ± 8 | 0.3 ± 0.2 | this work | |
| In solution | |||||
| Dd VASP | Barbed | 126 ± 30 | 43 ± 33 | 0.3 ± 0.2 | this work |
| Pointed | 12 ± 8 | 3 ± 8 | 0.3 ± 2 | this work | |
| filamin | Barbed | 8.6 ± 1.1 | −1.3 ± 2 | 0.0 ± 0.1 | this work |
| Pointed | 5.5 ± 1.5 | 2.8 ± 1.6 | 0.5 ± 0.4 | this work | |
| Dd VASP ΔGAB | Barbed | 24 ± 11 | 4 ± 15 | 0.2 ± 1 | this work |
| Pointed | 3 ± 2.5 | 0.5 ± 4.5 | 0.2 ± 7 | this work | |
| Hs VASP | Barbed | 24 ± 4 | −3 ± 5 | 0 ± 0.1 | (Hansen and Mullins, 2010) |
| Pointed | Not reported | Not reported | Not reported | (Hansen and Mullins, 2010) |
-
*
All reported errors from this work are 95% confidence intervals whereas those of (Pollard, 1986) represent SD.
-
†
All reported dissociation constants from this work are inferred from extrapolation of the elongation velocity as a function of actin concentration to zero concentration, data from Figures 1, 2 and 4.
Table 2
Results of a Monte Carlo simulation describing the affect of lattice protein binding to the association rate of actin monomer binding to filaments
| α | LC (monomers) | |
|---|---|---|
| VASP | 9* (7–10)† | 160* (145–175)† |
| VASP ΔGAB | 5.1 (5.0–5.1) | 76 (74–76) |
| α-actinin | 0.4 (0.4–0.7) | 1 (1–11) |
| Filamin | 0.4 (0.2–0.8) | 11 (1–101) |
| NEM-myosin | 0.7 (0.3–0.9) | 11 (1–201) |
-
The binding of an actin-binding protein onto the lattice of a filament leads to changes (with magnitude α) in association kinetics that are propagated over a certain characteristic length LC, as a number of monomers.
-
*
The value obtained by minimizing the χ2.
-
†
The values in parenthesis represent the 68% confidence interval.
Download links
A two-part list of links to download the article, or parts of the article, in various formats.
Downloads (link to download the article as PDF)
Open citations (links to open the citations from this article in various online reference manager services)
Cite this article (links to download the citations from this article in formats compatible with various reference manager tools)
Side-binding proteins modulate actin filament dynamics
eLife 4:e04599.
https://doi.org/10.7554/eLife.04599


