Actin dynamics tune the integrated stress response by regulating eukaryotic initiation factor 2α dephosphorylation
- University of Cambridge, United Kingdom
- University of Calgary, Canada
Figures
Figure 1 with 2 supplements
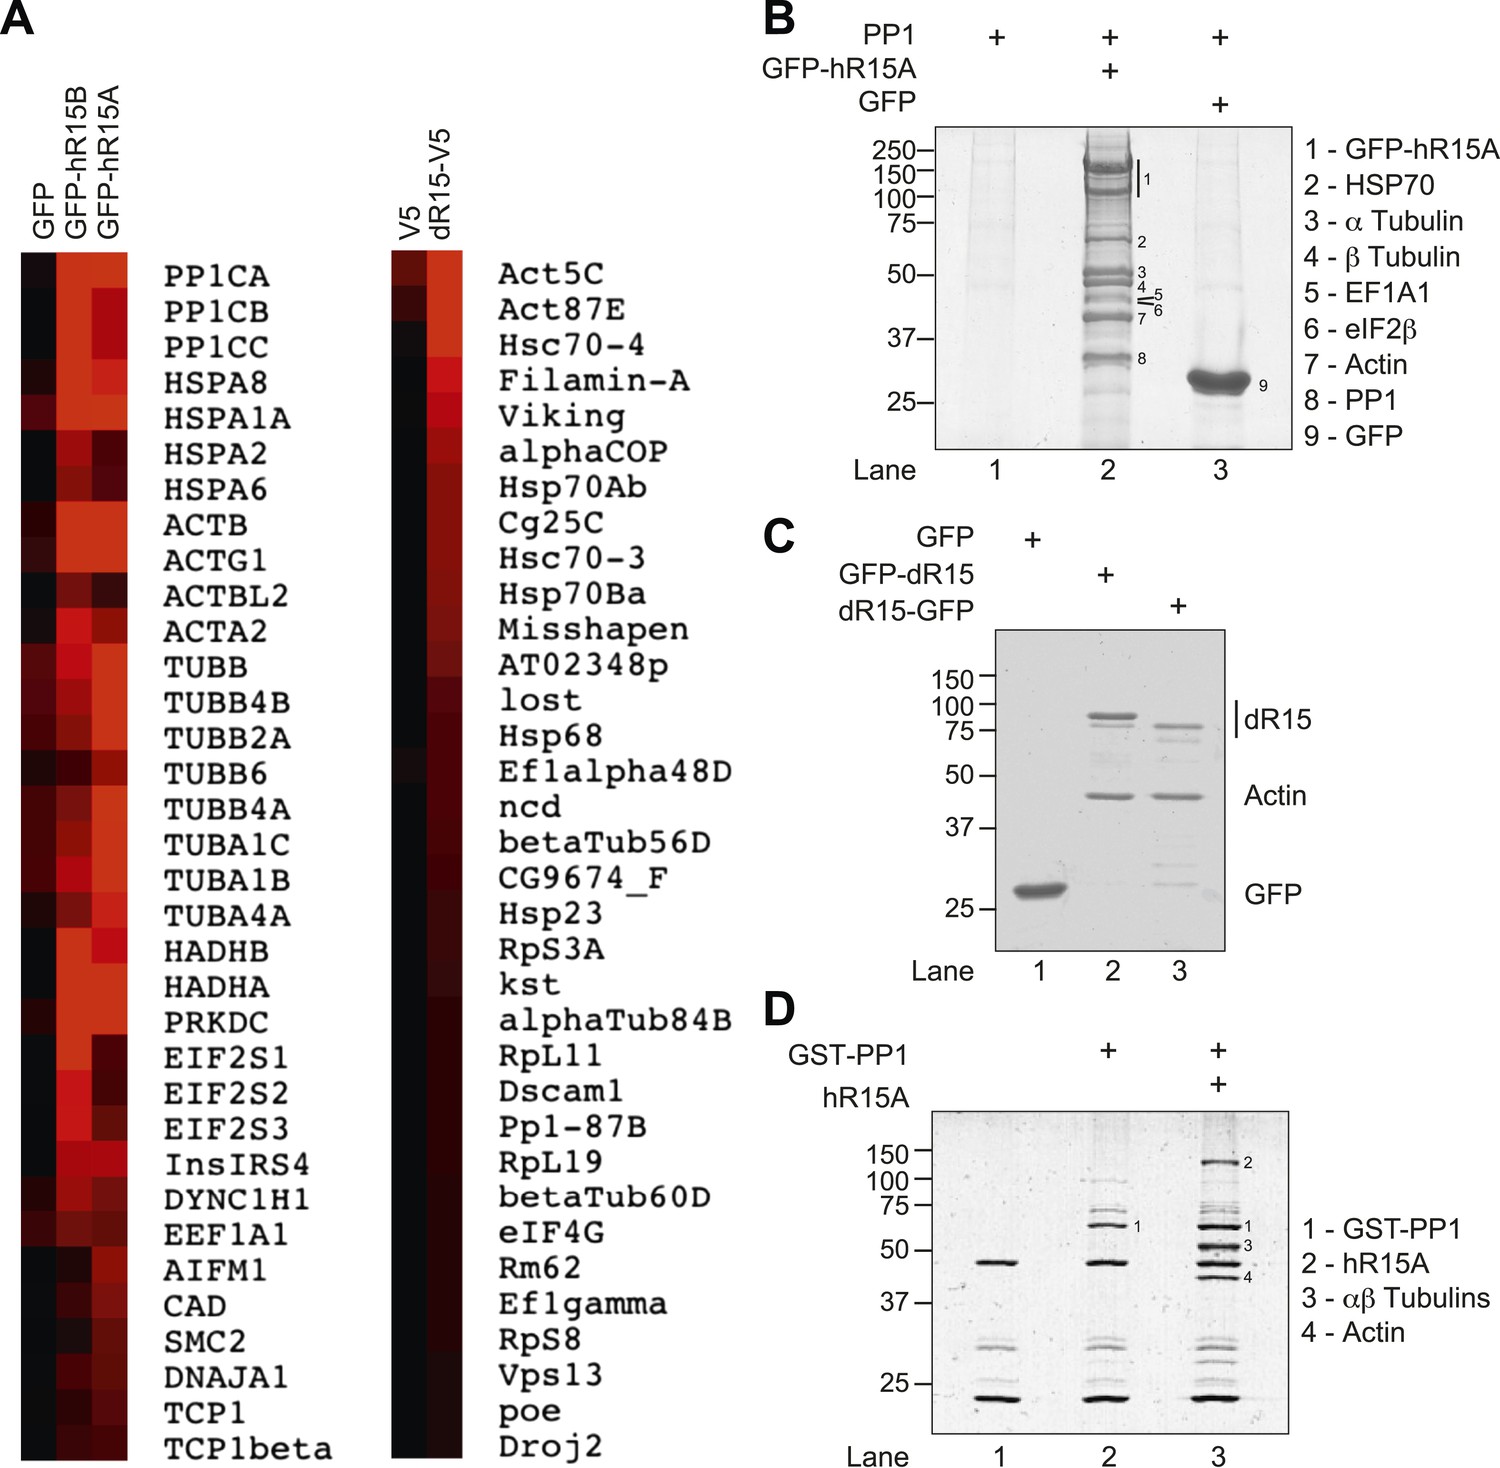
PPP1R15 associates with actin in mammalian and insect cells.
(A) Heat map of proteins associated with GFP, GFP-tagged human PPP1R15B (GFP-hR15B) and GFP-tagged human PPP1R15A (GFP-hR15A) affinity-purified from transiently transfected HEK293T cells (left panels); heat map of proteins associated with V5 and V5-tagged Drosophila PPP1R15 (dR15-V5) affinity purified from transiently transfected S2 cells (right panels). Samples were analysed by Orbitrap mass spectrometer. Intensity reflects total spectrum count of identified peptides. Proteins identified by at least five spectra and showing at least twofold enrichment over control are shown. (B) Coomassie-stained SDS-PAGE of GFP-affinity purified proteins from HEK293T cells expressing indicated proteins. Indicated bands were individually excised and identified by mass spectrometry. (C) Coomassie-stained SDS-PAGE of GFP-affinity purified proteins from HEK293T cells expressing indicated proteins. Bands were individually excised and identified by mass spectrometry. (D) Coomassie-stained SDS-PAGE of glutathione-affinity purified proteins from HEK293T cells. Indicated bands were individually excised and identified by mass spectrometry.
Figure 1—figure supplement 1
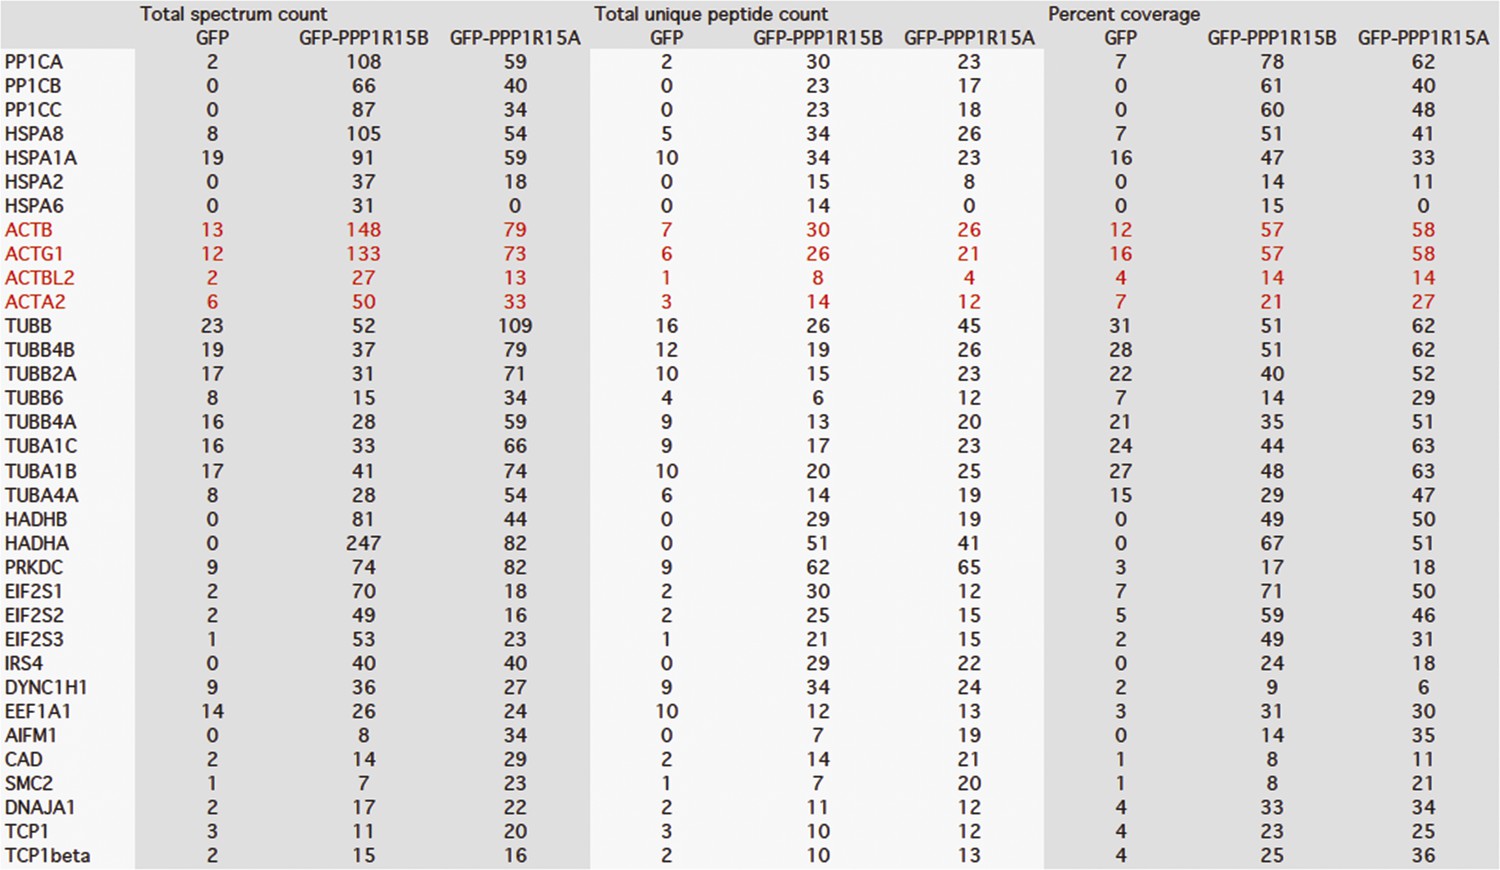
Mass spectrometry results of GFP, GFP-PPP1R15B, and GFP-PPP1R15A expressed in HEK293T cells and purified using GFP-Trap beads.
Actin peptides are highlighted in red. Proteins with >twofold enrichment over control and the detection of ≥5 identifiable peptides in the mass spectra are shown.
Figure 1—figure supplement 2
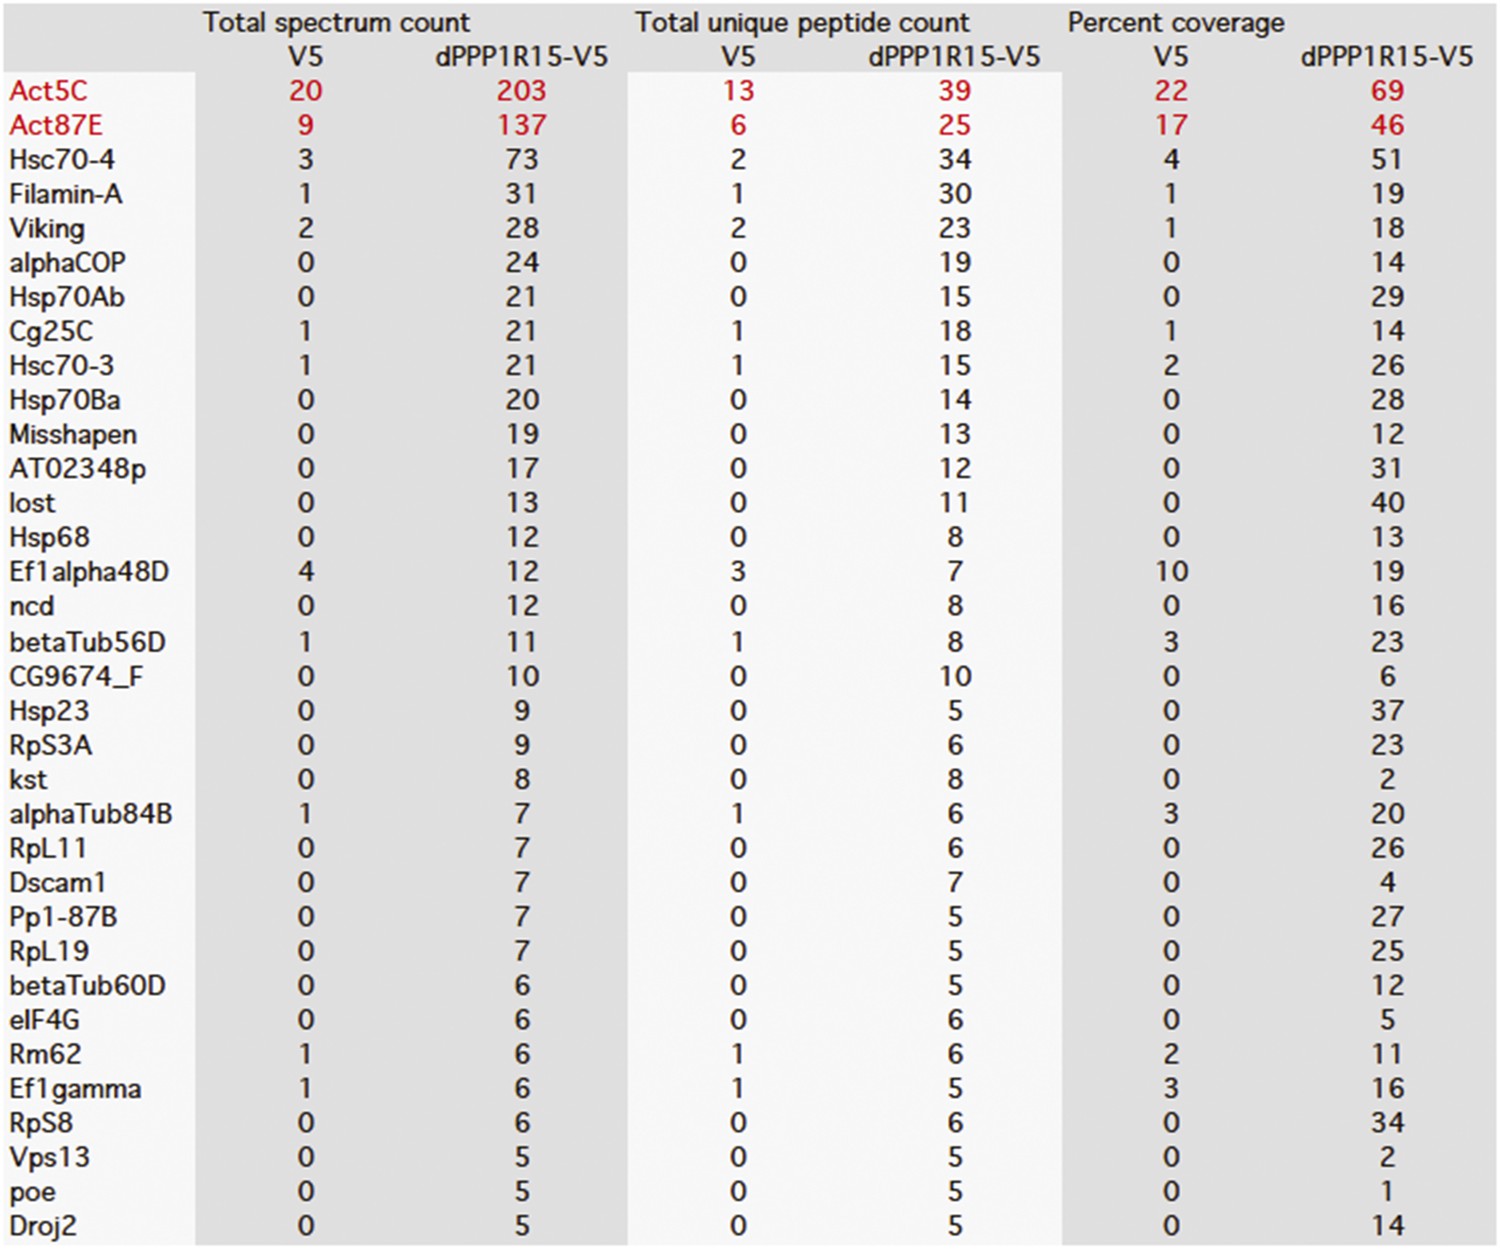
Mass spectrometry results of V5 and dPPP1R15A-V5 expressed in S2 cells and purified using anti-V5 immunoprecipitation.
Actin peptides are highlighted in red. Proteins with >twofold enrichment over control and the detection of ≥5 identifiable peptides in the mass spectra are shown.
Figure 2

PPP1R15 selectively associates with monomeric G-actin in cells.
(A) Immunoblot (upper panel) and Coomassie-stained gel (lower panel) of affinity-purified GFP-tagged PPP1R15A and purified actin. Samples were incubated and centrifuged to pellet F-actin (lane 1), leaving G-actin in the supernatant (lane 2); pellet P, supernatant S. (B) Immunoblot for GFP and actin of GFP-affinity purified proteins (upper two panels) from HEK293T cells expressing GFP-tagged PPP1R15A (hR15A-GFP) treated with 2 µM of each indicated compound. Immunoblot for actin of 2% of input. (C) Fluorescence microscopy image of NIH-3T3 cell F-actin arrangement. NIH-3T3 cells were left untreated (control), cultured in serum-free medium for 24 hr (serum starved), cultured in serum-free medium for 18 hr, followed by addition of medium containing 10% vol/vol FBS for 6 hr (serum refed), then fixed and stained with Alexa-Fluor 568 phalloidin and imaged by confocal microscopy. (D) Immunoblot for GFP and actin of NIH-3T3 lysates from cells treated as in ‘C’ then subjected to GFP affinity purification (upper two panels). Immunoblot for actin of 2% of input.
Figure 3 with 2 supplements
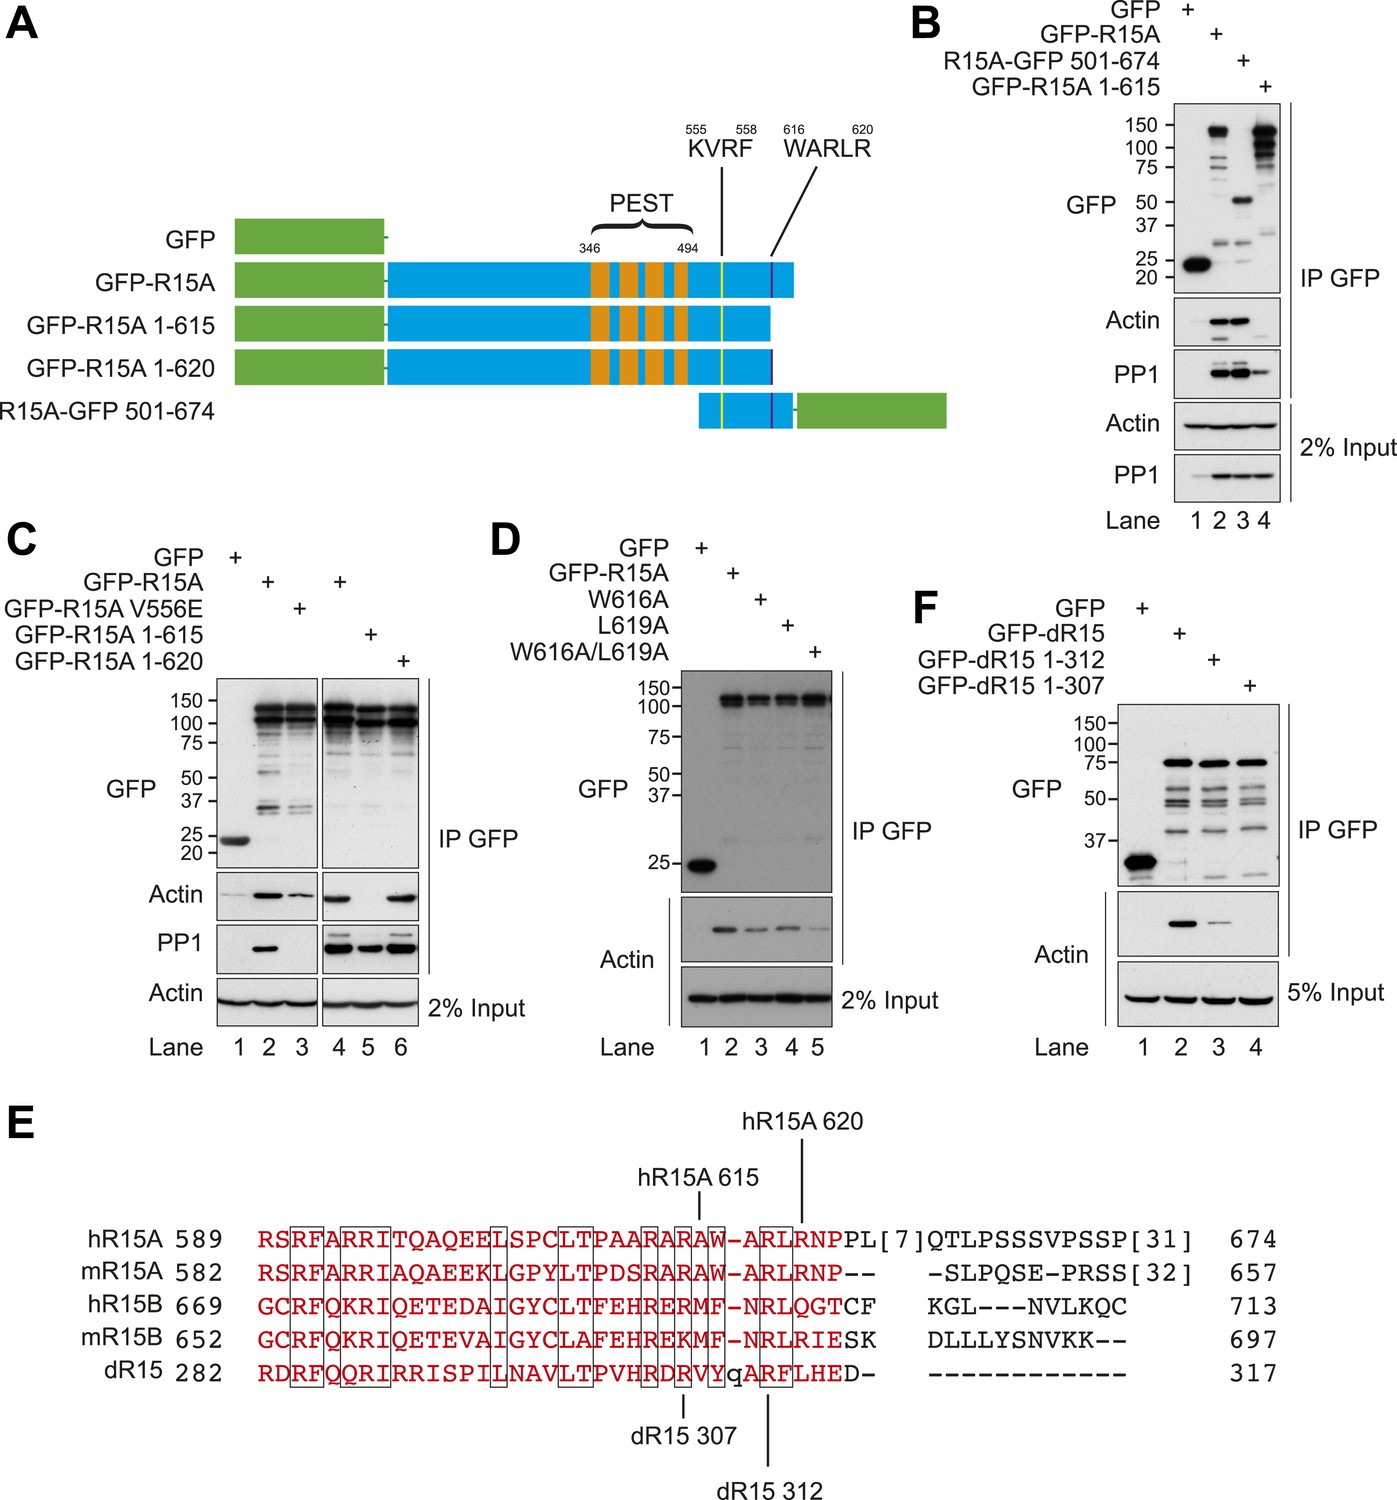
Actin associates with the conserved C-terminal portion of PPP1R15.
(A) Schematic diagram of human PPP1R15A (R15A) constructs used. Green indicates GFP. PEST repeats (between residues 346 and 494, orange), K555VRF558 (yellow), and W616ARLR620 (purple) sequences are identified. (B) Immunoblot for GFP, actin, and PP1 of HEK293T lysates from cells expressing indicated constructs and PP1, and subjected to GFP affinity purification (upper three panels). Immunoblot for actin and PP1 of 2% of input. (C) Immunoblot for GFP, actin, and PP1 of HEK293T lysates from cells expressing indicated constructs and PP1, and subjected to GFP affinity purification (upper three panels). Immunoblot for actin of 2% of input. (D) Immunoblot for GFP and actin of HEK293T lysates from cells expressing indicated constructs and subjected to GFP affinity purification (upper two panels). Immunoblot for actin of 5% of input (lower panel). (E) Sequence alignment of C-terminal portions of human (h) and murine PPP1R15A (mR15A) and PPP1R15B (mR15B) and Drosophila dPPP1R15 (dR15) with regions of homology boxed. Specific truncations are indicated. (F) Immunoblot for GFP and actin of HEK293T lysates from cells expressing indicated constructs and subjected to GFP affinity purification (upper two panels). Immunoblot for actin and PP1 of 2% of input.
Figure 3—figure supplement 1
Immunoblot for GFP, actin, and PP1 of GFP-Trap pull-downs and 2% of input.
HEK293T cells were transiently transfected with plasmids encoding the indicated constructs. After 36 hr, cells were lysed in GFP-Trap lysis buffer (150 mM NaCl, 10 mM Tris/Cl pH 7.5, 0.5 mM EDTA, 1 mM PMSF, and Protease Inhibitor Cocktail [Roche]) and post-nuclear supernatants were incubated with GFP-Trap beads at 4°C for 2 hr then washed four times in the same buffer. Next, samples were washed thrice in GFP-Trap lysis buffer supplemented with additional NaCl as indicated.
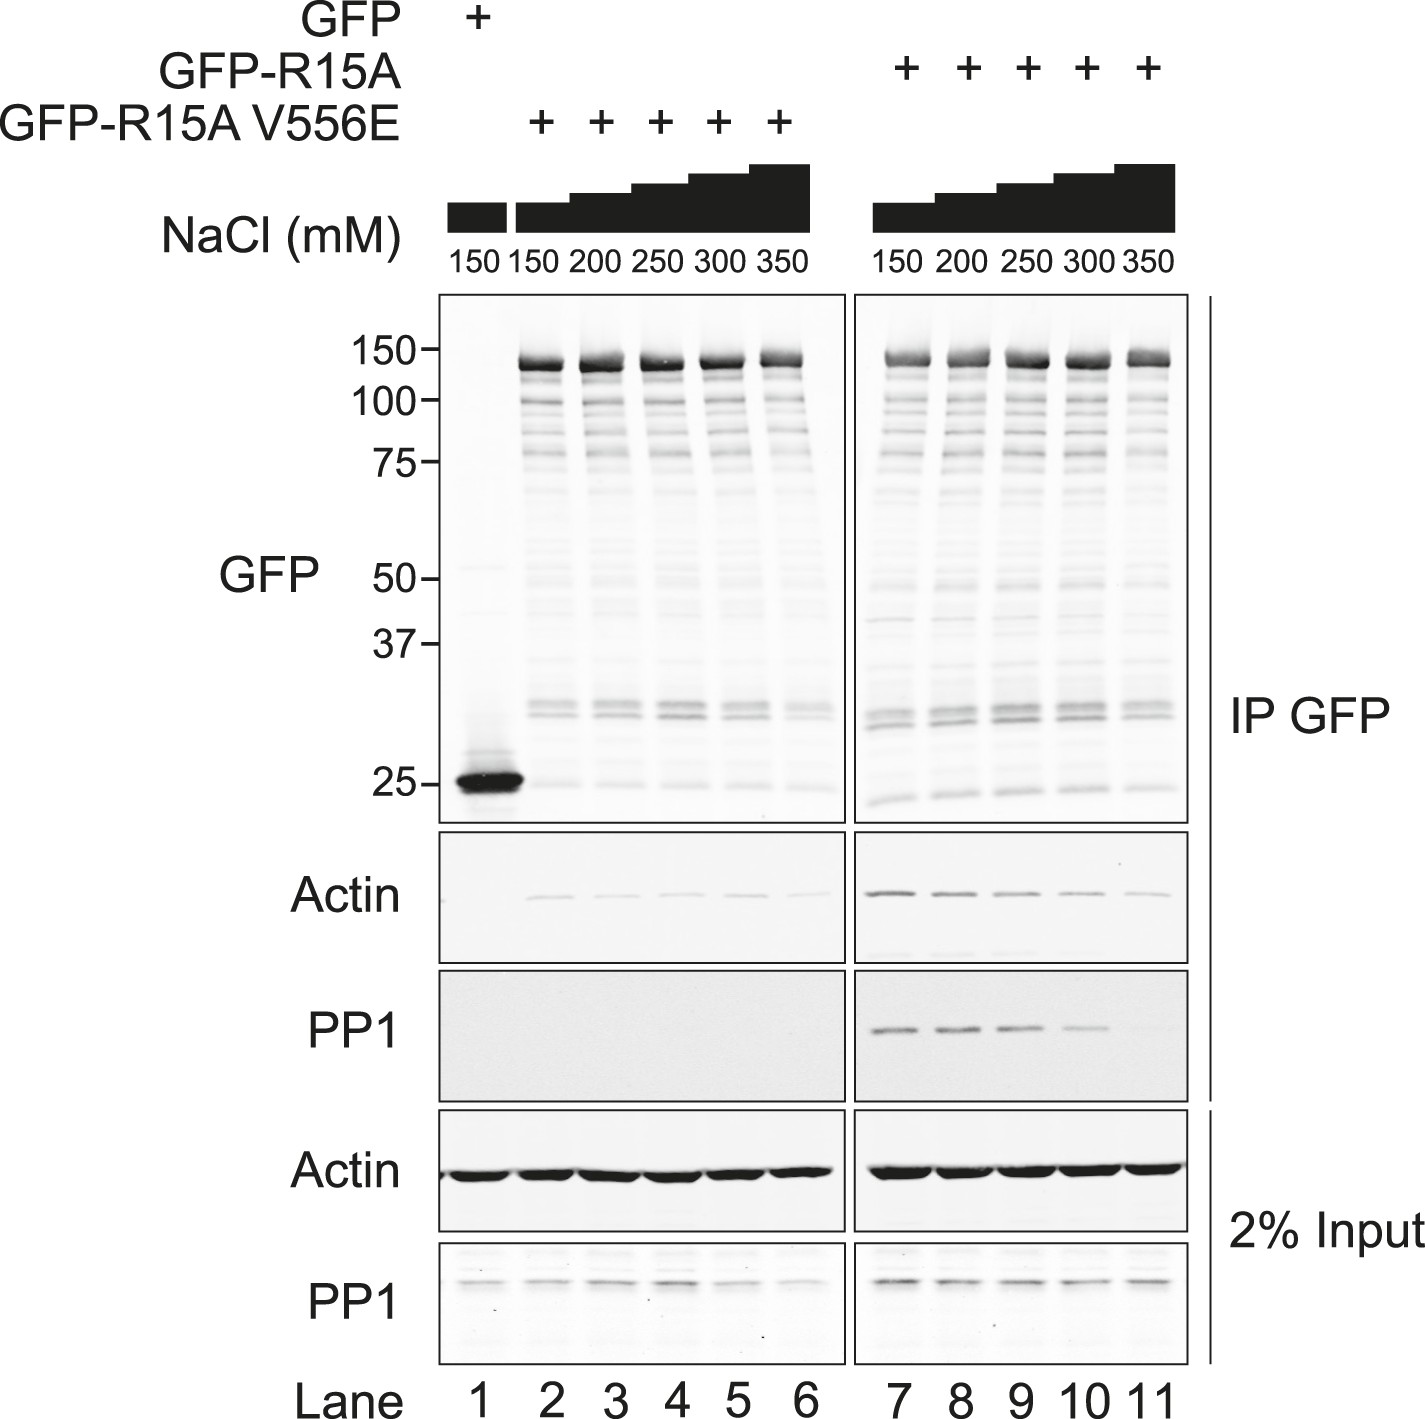
Figure 3—figure supplement 2
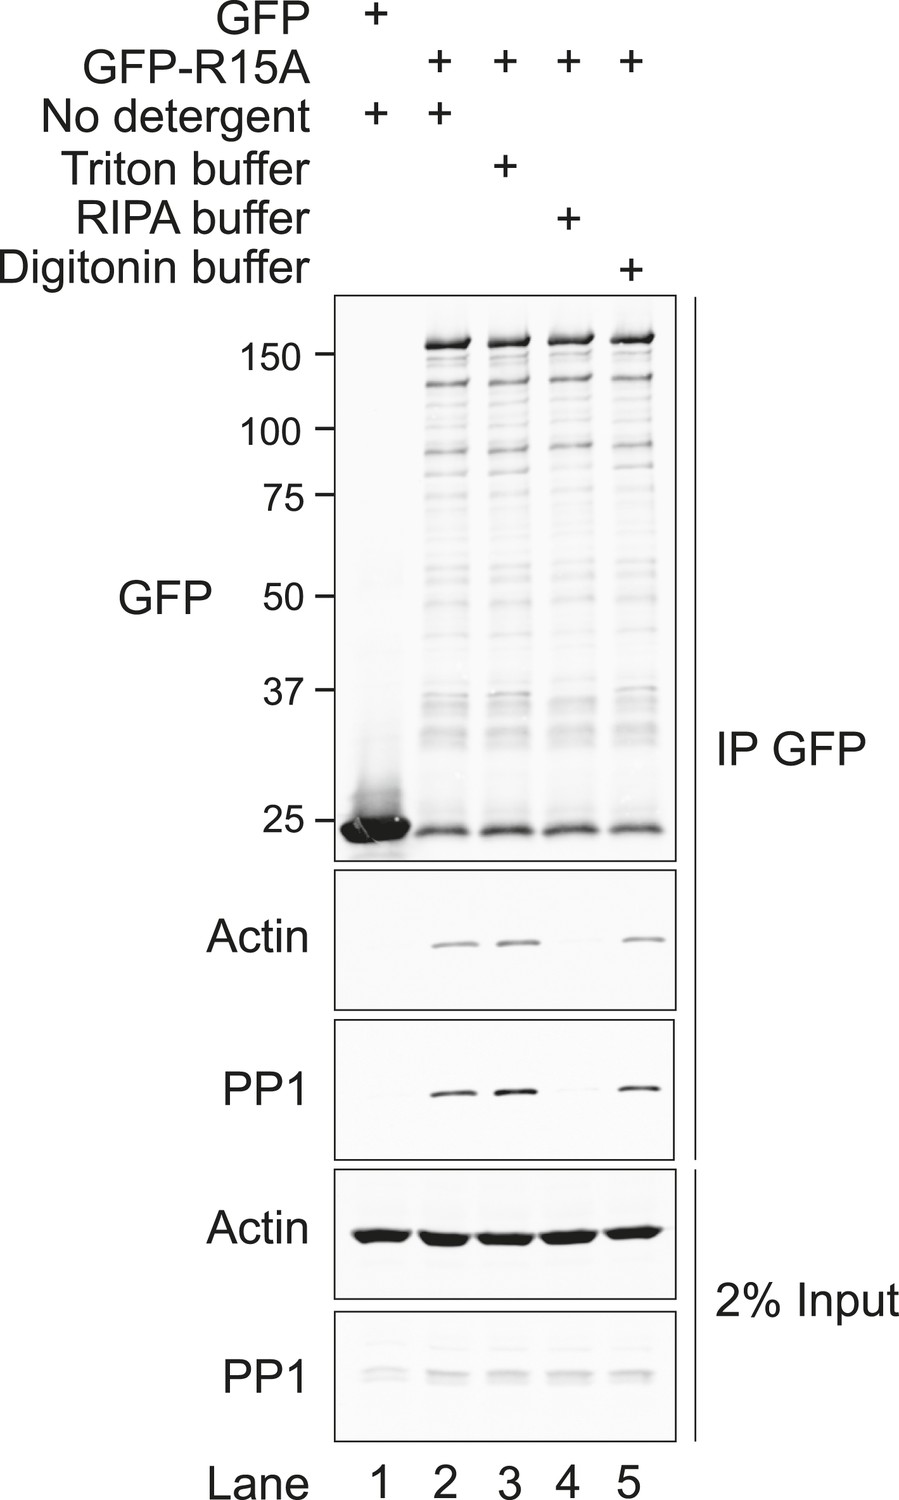
Immunoblot for GFP, actin, and PP1 of GFP-Trap pull-downs and 2% of input.
HEK293T cells were transiently transfected with plasmids encoding the indicated constructs. After 36 hr, cells were lysed in GFP-Trap lysis buffer (150 mM NaCl, 10 mM Tris/Cl pH 7.5, 0.5 mM EDTA, 1 mM PMSF, and Protease Inhibitor Cocktail [Roche]) and post-nuclear supernatants were incubated with GFP-Trap beads at 4°C for 2 hr then washed once in the same buffer. Next, samples were washed thrice with no detergent (GFP-Trap lysis buffer), triton buffer (150 mM NaCl, 10 nM HEPES pH 7.4, 0.5% vol/vol triton X-100), RIPA buffer (150 mM NaCl, 50 mM Tris HCl pH 7.4, 1% vol/vol NP40, 0.5% vol/vol sodium deoxycholate, 0.1% vol/vol SDS) or digitonin buffer (150 mM NaCl, 50 mM Tris HCl pH 7.4, 0.1% vol/vol digitonin).
Figure 4
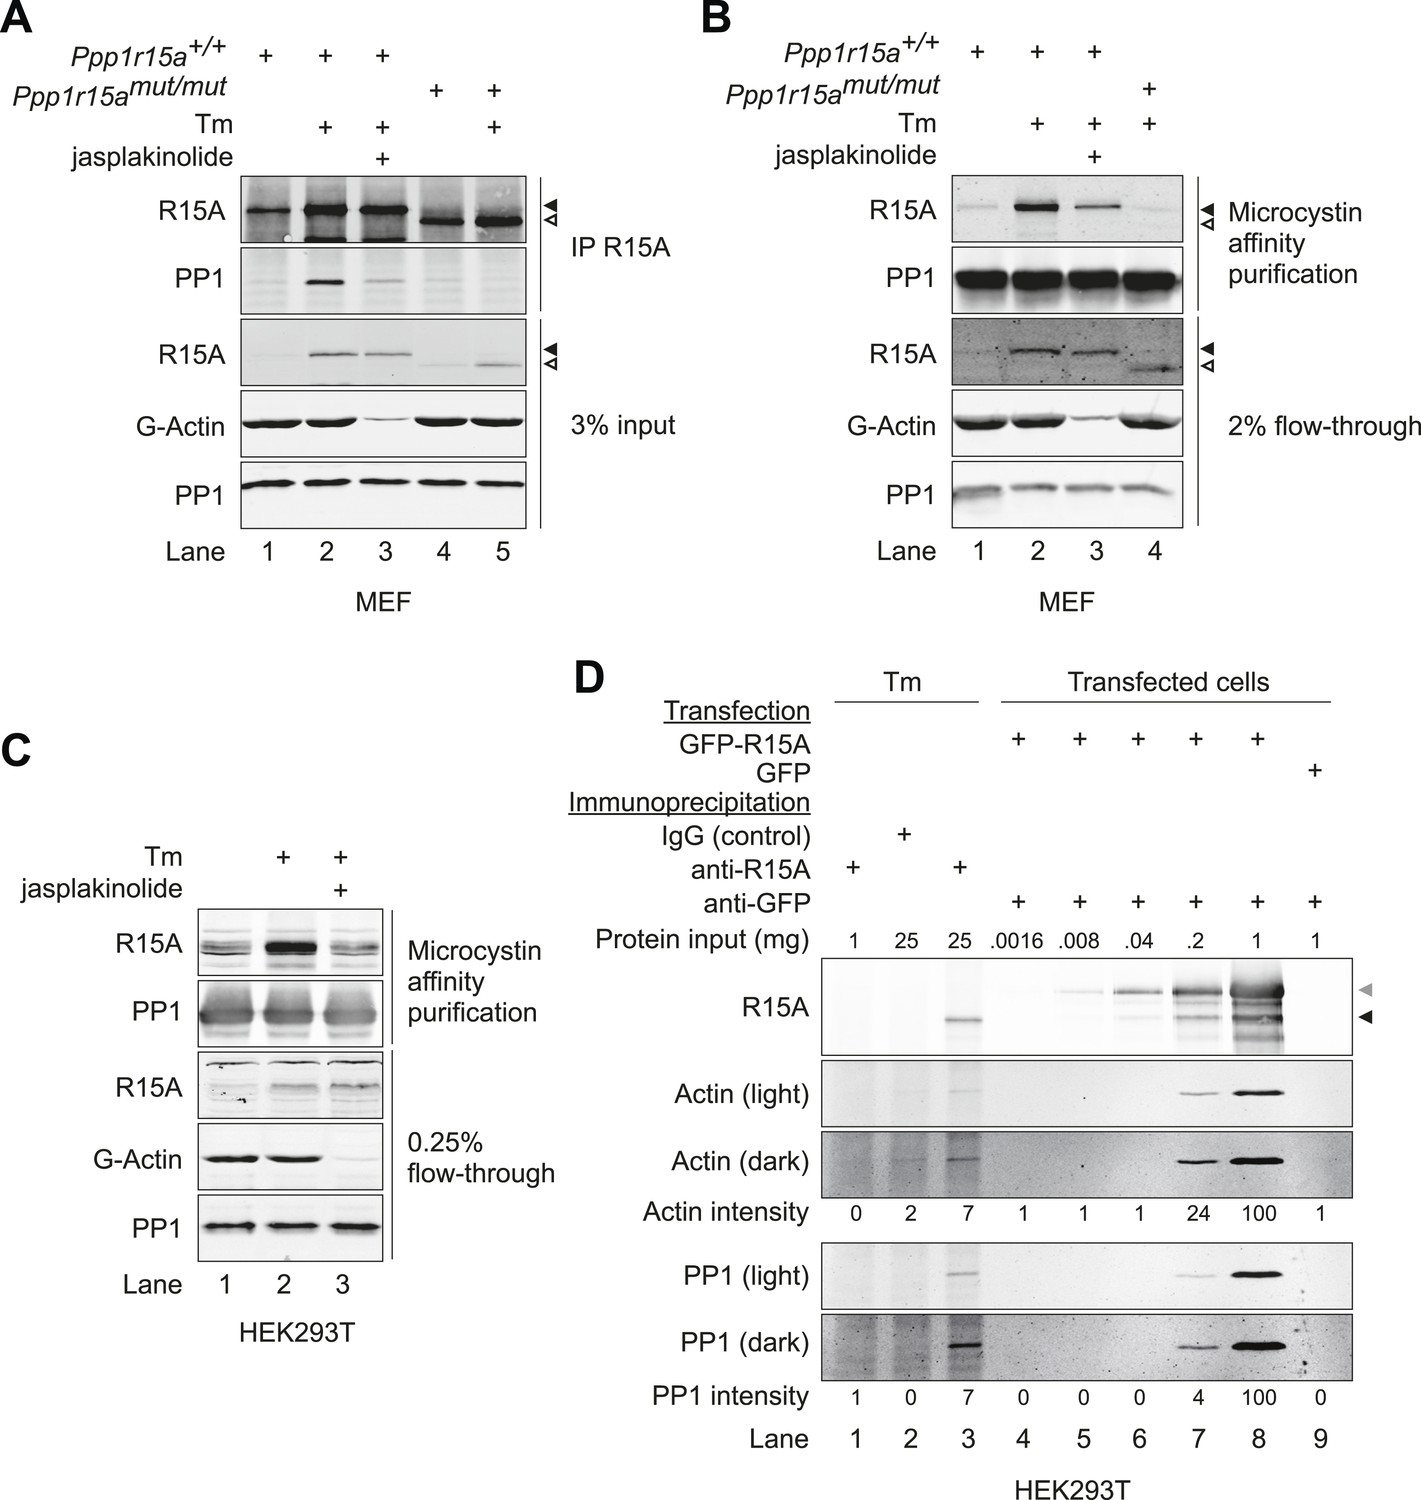
G-actin stabilises the PPP1R15A-PP1 complex in vivo.
(A) Immunoblots of endogenous PPP1R15A (R15A) and associated PP1 immunopurified from wild type (Ppp1r15a+/+) or mutant mouse embryonic fibroblasts homozygous for a C-terminal truncation of PPP1R15A that abolishes interaction with PP1 (Ppp1r15amut/mut) with an anti-PPP1R15A antiserum (IP R15A). Where indicated, cells were treated with tunicamycin 2 µg/ml (Tm) for 8 hr to induce PPP1R15A and jasplakinolide (1 µM) for 1.5 hr before harvest. The lower three panels are immunoblots of the input of the immunoprecipitation reactions analysed in the top two panels. Closed and open triangles mark, respectively, the wild type and mutant PPP1R15A lacking the C-terminal functional core. To assess G-actin content of the input, the sample was subjected to ultracentrifugation to remove F-actin. (B) PPP1R15A and PP1 immunoblots of PP1-containing complexes purified by microcystin affinity chromatography from cells as in ‘A’ above. The lower three panels report on the content of input material. (C) As in ‘B’, above, but reporting on PP1-continaing complexes purified by microcystin affinity chromatography from HEK293T cells. (D) Immunoblots of endogenous or over-expressed GFP-tagged PPP1R15A and associated endogenous PP1 and actin immunopurified with antiserum to PPP1R15A, non-immune rabbit IgG (as a control) or antiserum to GFP from lysates of tunicamycin-treated HEK293T cells (Tm, 2.5 µg/ml for 8 hr to induce endogenous PPP1R15A) or cells transfected with plasmids expressing GFP-PPP1R15A (GFP-R15A) or GFP. The protein content of the cell lysate applied to the immunoprecipitations is noted above the immunoblots (‘Protein input’). Endogenous PPP1R15A and the larger GFP-PPP1R15A are marked by black and grey arrowheads, respectively. Both heavy and light exposures of the actin and PP1 immunoblots are provided and the relative intensity of the signals is noted.
Figure 5 with 1 supplement
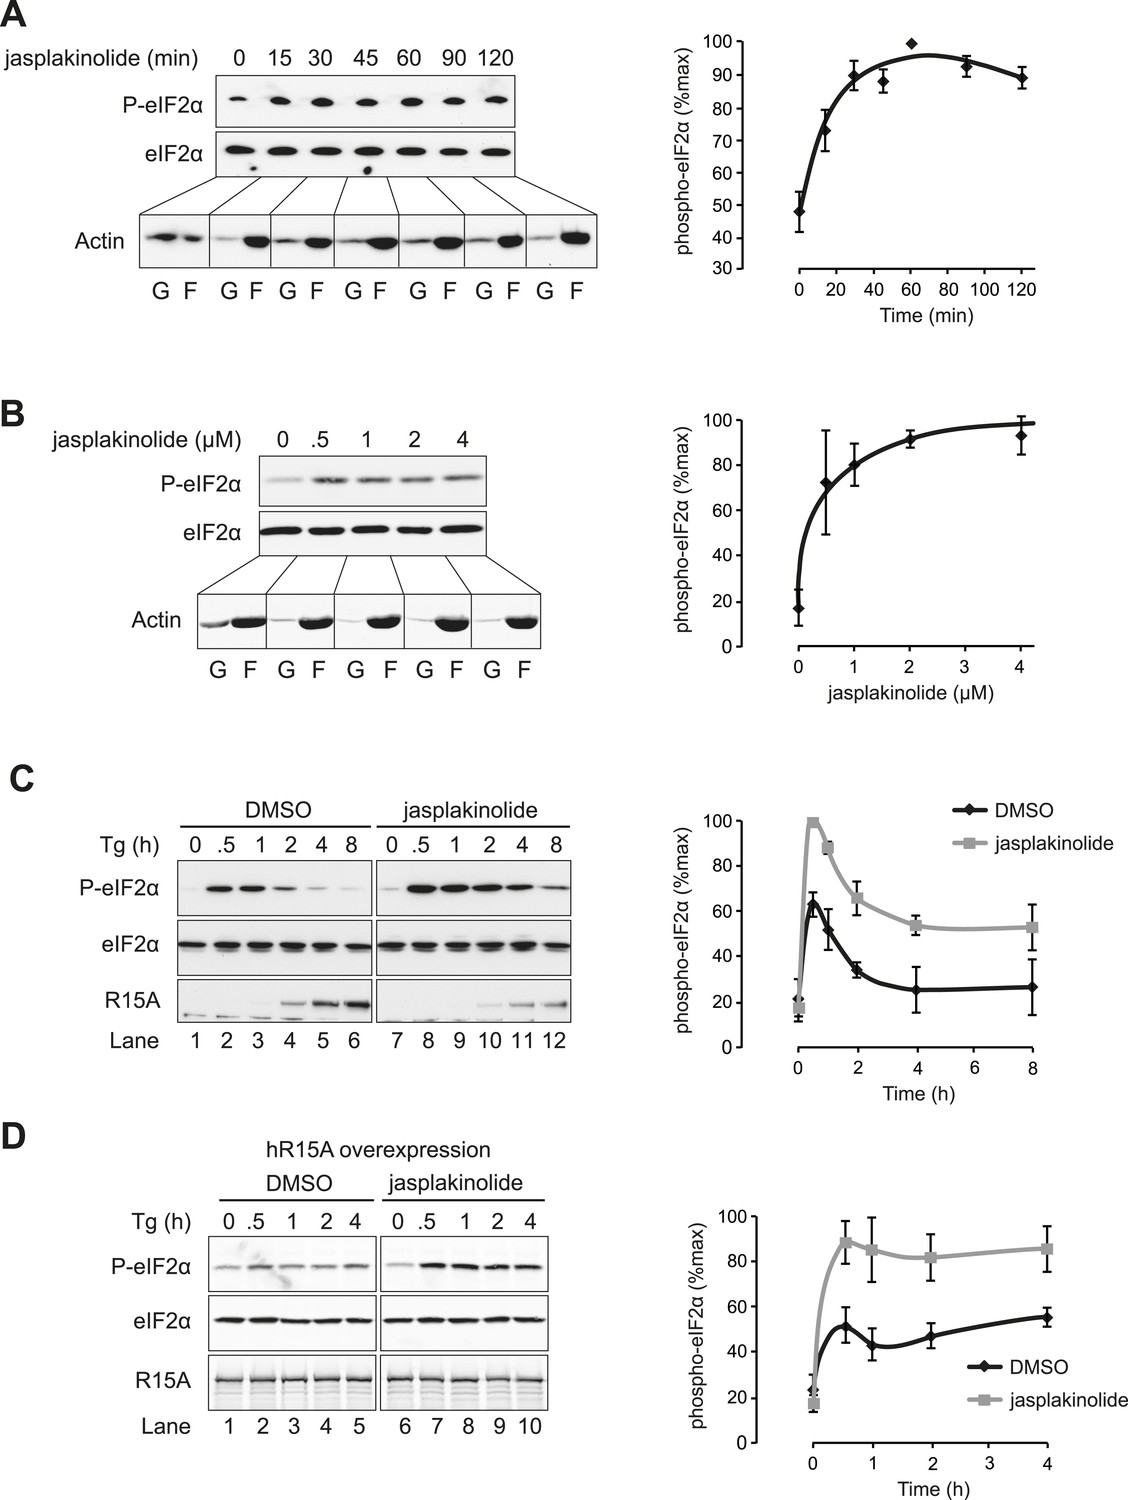
Association of G-actin with PPP1R15 regulates eIF2α phosphatase activity.
(A) Immunoblot for phosphorylated eIF2α (P-eIF2α), total eIF2α, and actin. Wild-type (WT) mouse embryonic fibroblasts (MEF) were treated with jasplakinolide 1 µM for the indicated times. Lysates were subjected to sedimentation assay and immunoblot for G-actin in the supernatant (G) or F-actin in the pellet (F). (B) Immunoblot for phosphorylated eIF2α (P-eIF2α), total eIF2α, and actin. WT MEFs were treated with the indicated concentrations of jasplakinolide for 1 hr. Lysates were analysed as in ‘A’. (C) Immunoblot for phosphorylated eIF2α (P-eIF2α), total eIF2α, and PPP1R15A. WT MEFs were treated with thapsigargin 400 nM for the indicated times, without or with jasplakinolide 1 µM. (D) Immunoblot for P-eIF2α and PPP1R15A (hR15A). GFP-hPPP1R15A Tet-On HeLa cells were treated with doxycycline to induce transgene expression and then with thapsigargin 400 nM for the indicated times. Cells were co-treated with jasplakinolide or latrunculin B 1 µM or vehicle as indicated. Accompanying graphs show means ±SEM of n = 3 independent repeats.
Figure 5—figure supplement 1
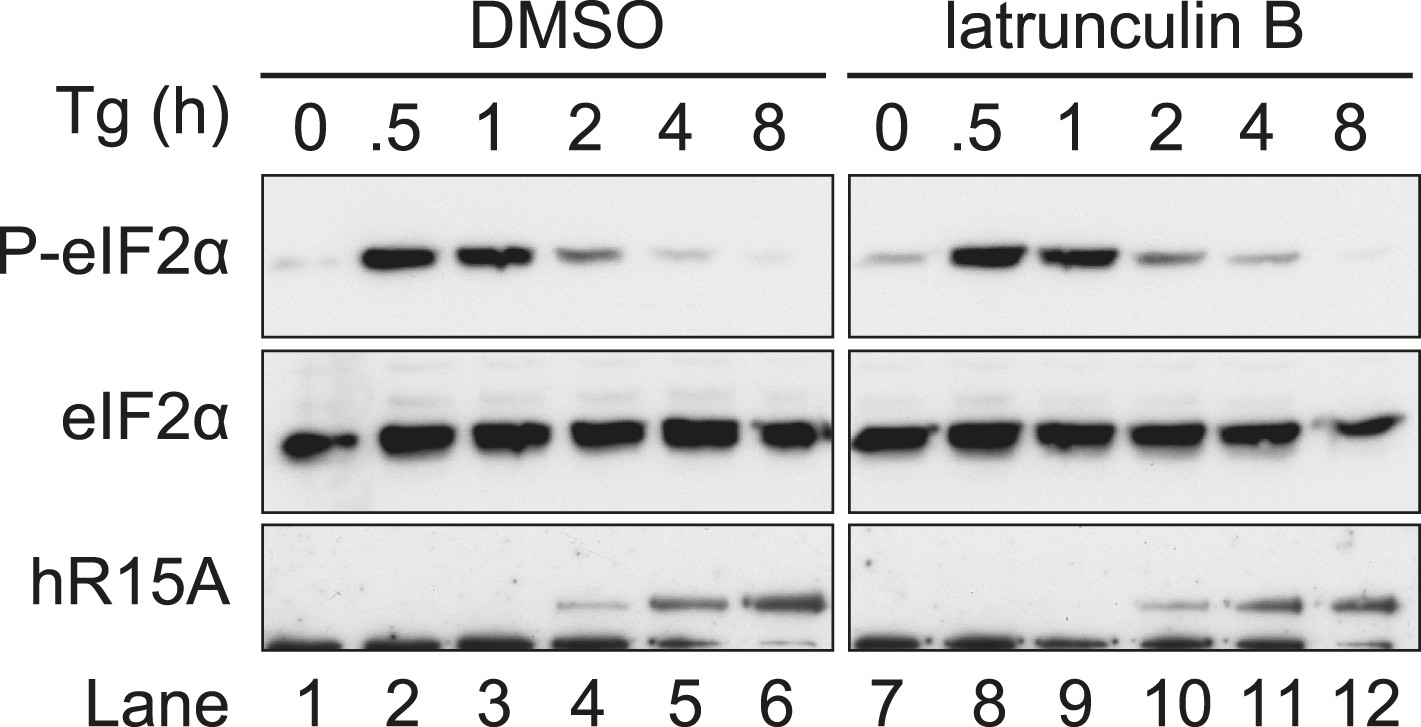
Immunoblot for phosphorylated eIF2α (P-eIF2α), total eIF2α and PPP1R15A.
WT MEFs were treated with thapsigargin 400 nM for the indicated times, without or with latrunculin B 1 µM.
Figure 6 with 1 supplement
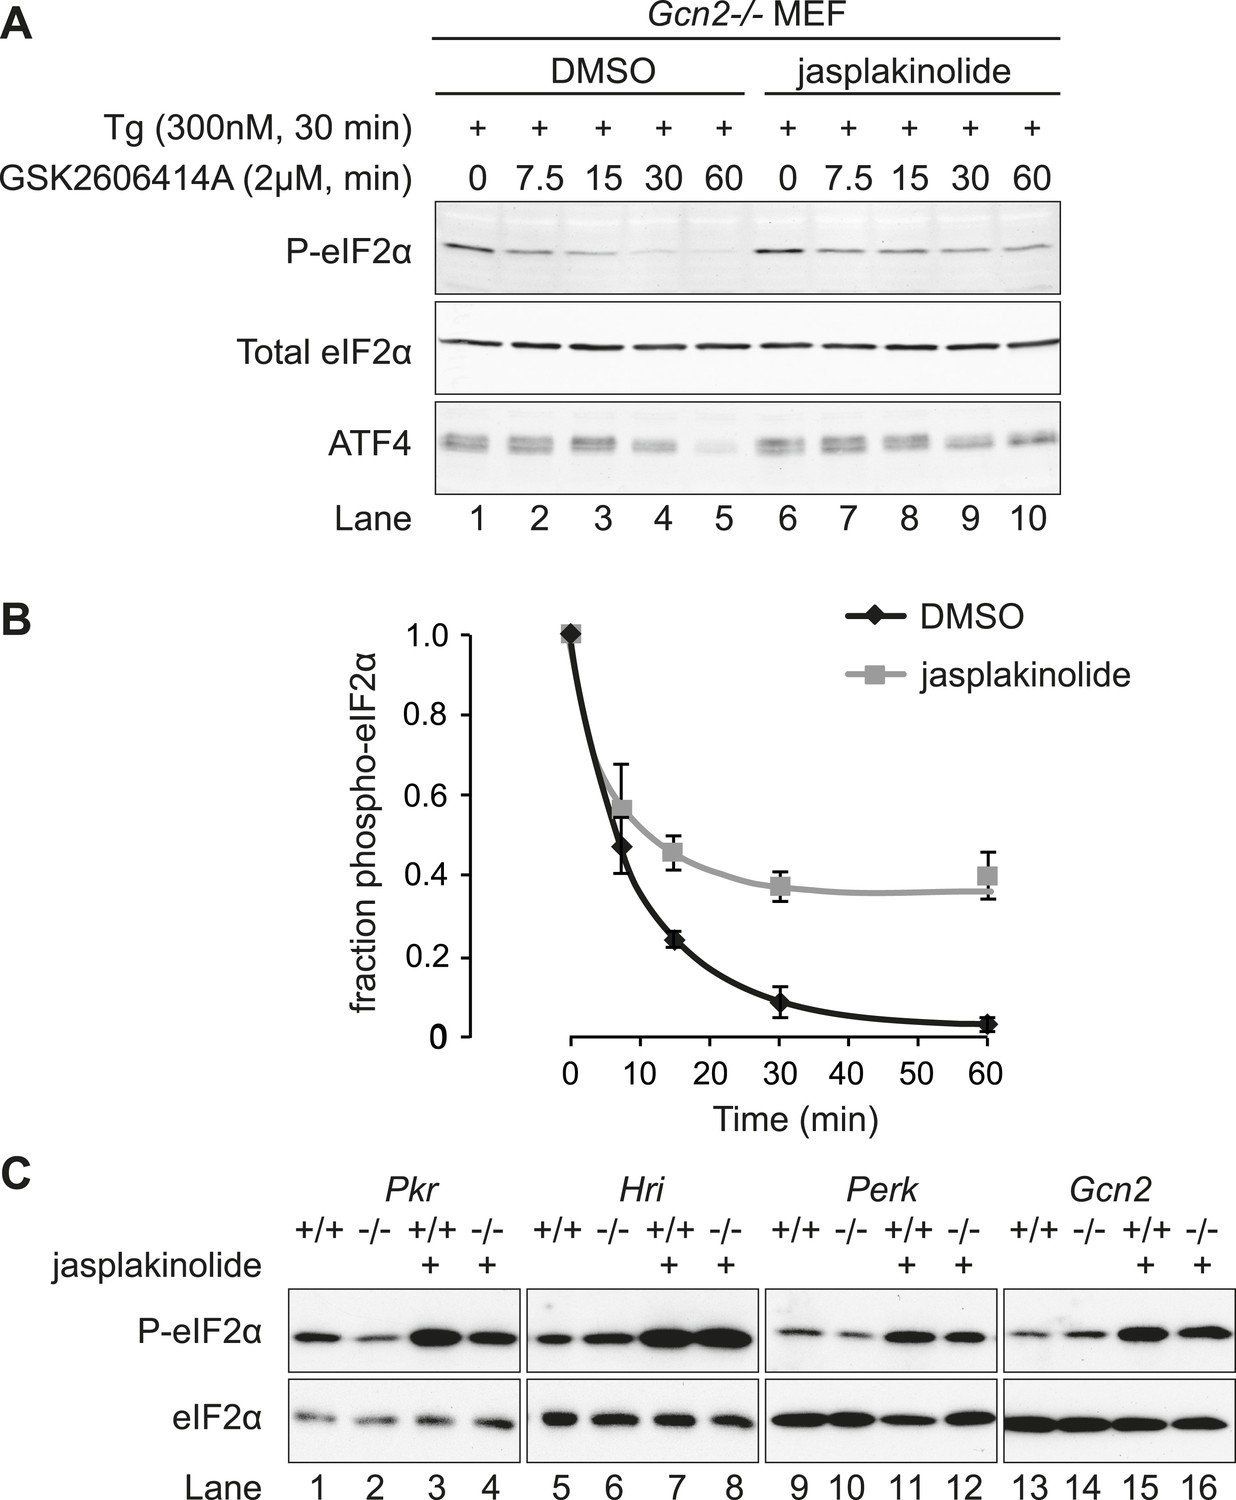
Jasplakinolide diminishes eIF2α phosphatase activity in vivo.
(A) Immunoblot for phosphorylated eIF2α (P-eIF2α), total eIF2α, and ATF4. Gcn2−/− MEFs were pre-treated with thapsigargin 300 nM for 30 min to induce eIF2α phosphorylation and ATF4 protein levels. GSK2606414A at 2 µM was then added for the indicated times. Protein lysates were analysed by SDS-PAGE and subjected to immunoblot. (B) Quantification of ‘A’ using ImageJ software. Mean ± SEM of n = 3 independent repeats. (C) Immunoblot for phosphorylated eIF2α (P-eIF2α) and total eIF2α. MEFs of the indicated genotypes were treated with or without jasplakinolide 1 µM for 1 hr. Protein lysates were analysed by SDS-PAGE and subjected to immunoblot.
Figure 6—figure supplement 1
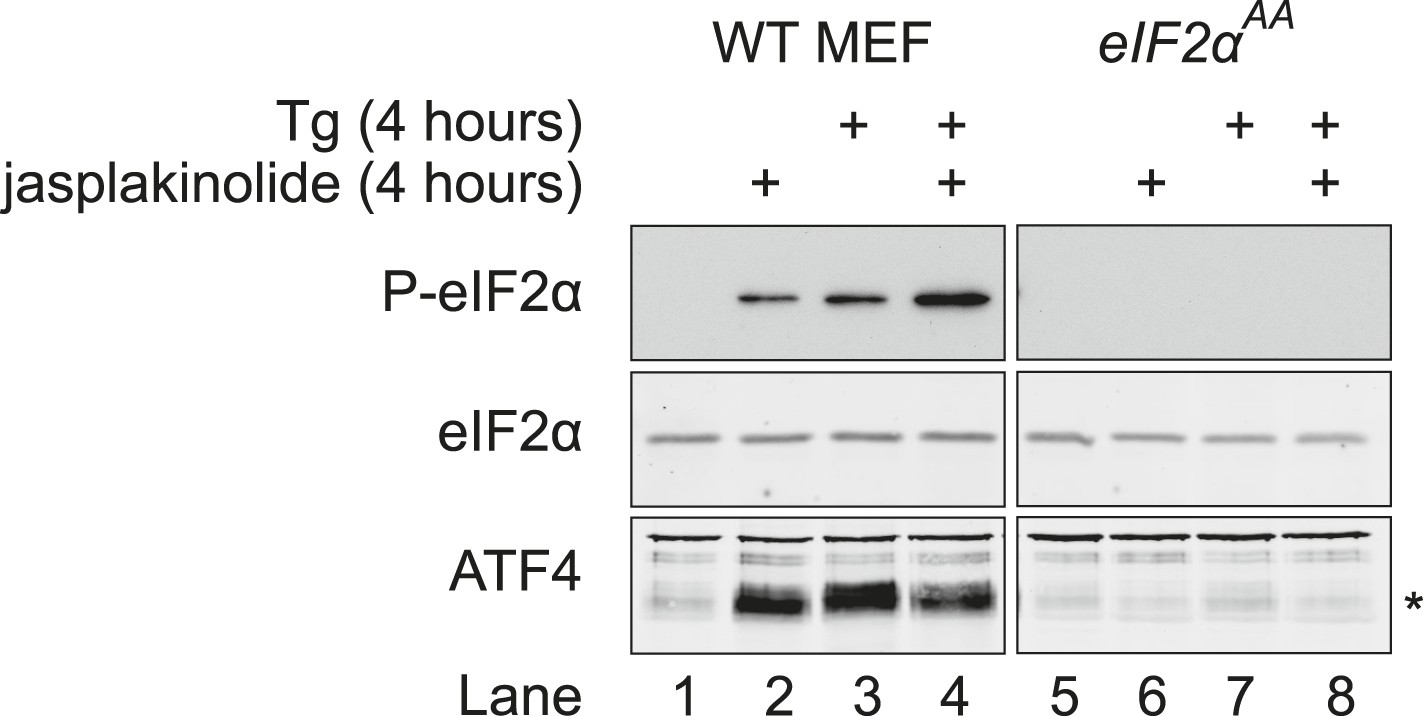
Immunoblot for P-eIF2α, total eIF2α, and ATF4 (specific band marked with an asterisk) in lysates of wild type (WT) or eIF2αAA MEFs following treatment with thapsigargin 300 nM for 4 hr and/or jasplakinolide 1 µM for 4 hr.
https://doi.org/10.7554/eLife.04872.014
Figure 7
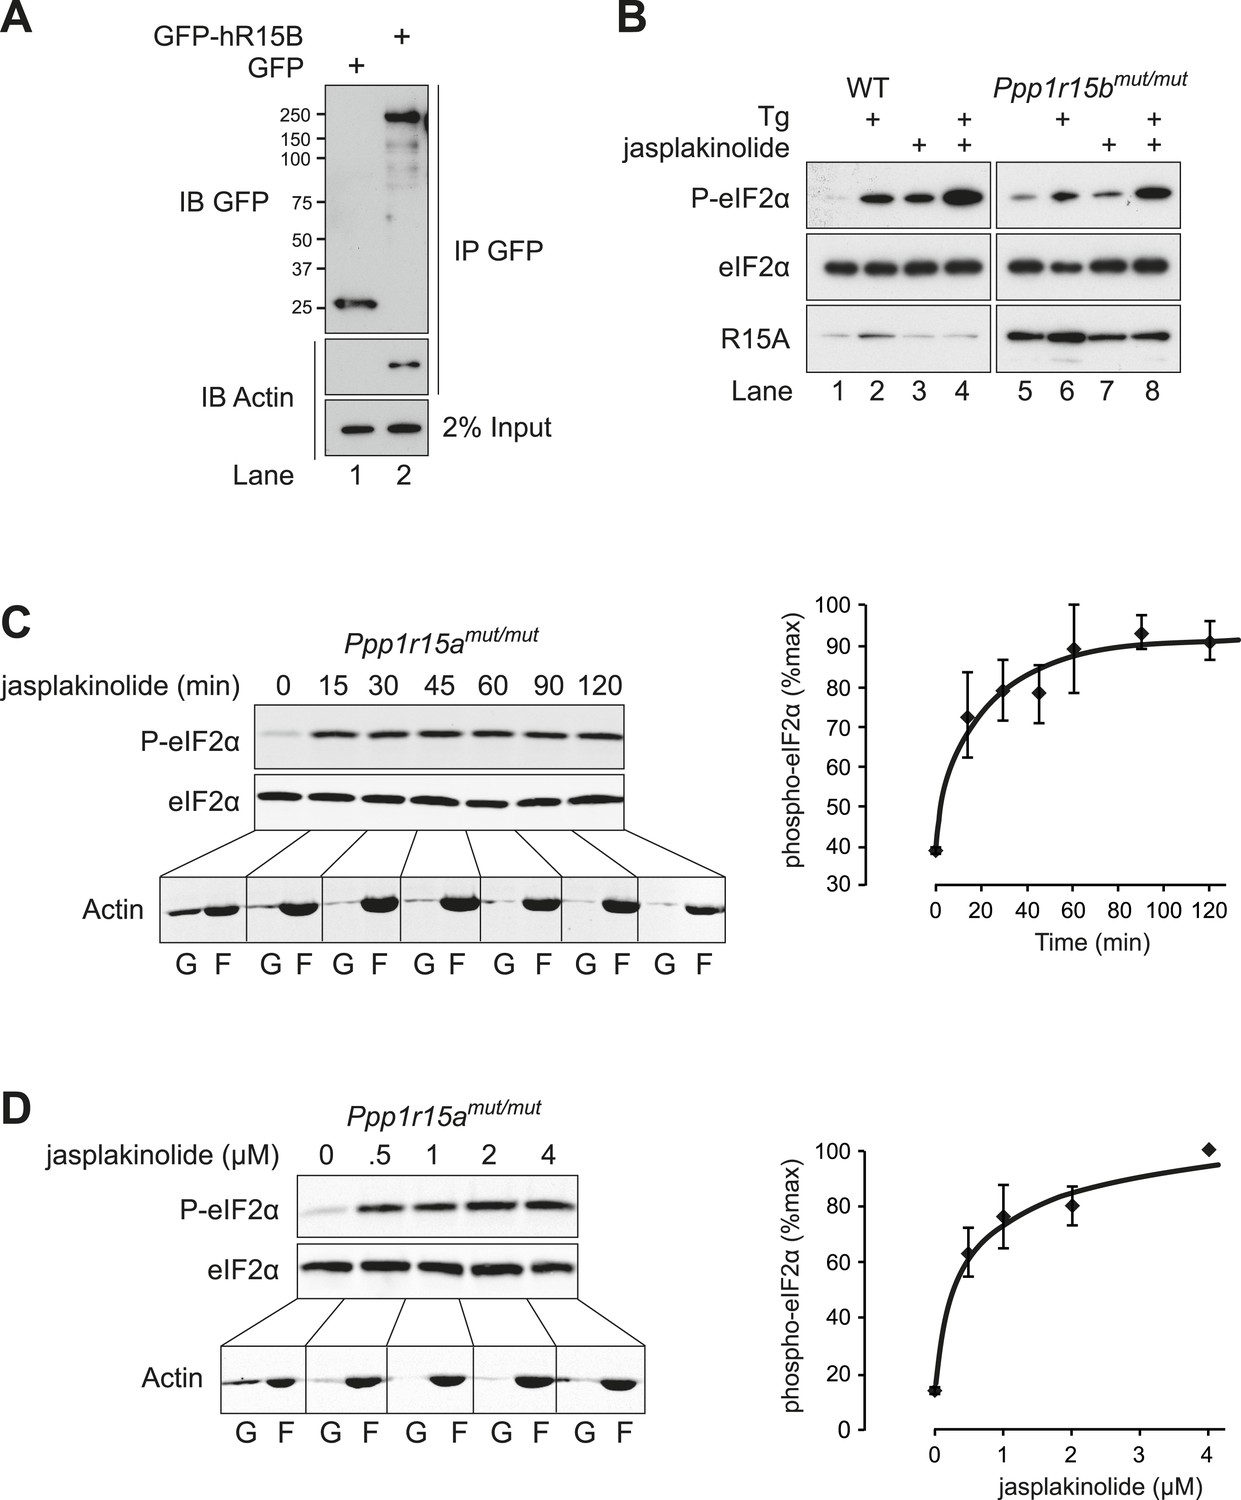
Actin associates with PPP1R15B to alter the level of eIF2α phosphorylation.
(A) Immunoblot for GFP and actin of HEK293T cell lysates expressing either GFP or GFP-PPP1R15B. Upper two panels indicate proteins immunoprecipitated by anti-GFP beads. Lower panel shows 2% of input lysate. (B) Immunoblot for P-eIF2α, total eIF2α, and PPP1R15A of lysates from WT or Ppp1r15btm1Dron/tm1Dron MEFs treated for 1 hr with thapsigargin 400 nM, jasplakinolide 1 µM or both. (C) Immunoblot for phosphorylated eIF2α (P-eIF2α), total eIF2α and actin. Ppp1r15atm1Dron/tm1Dron MEFs were treated with jasplakinolide 1 µM for the indicated times. Lysates were subjected to sedimentation assay and immunoblot for G-actin in the supernatant (G) or F-actin in the pellet (F). (D) Immunoblot for phosphorylated eIF2α (P-eIF2α), total eIF2α, and actin. Ppp1r15atm1Dron/tm1Dron MEFs were treated with the indicated concentrations of jasplakinolide for 1 hr. Lysates were analysed as in ‘C’. Accompanying graphs show mean ± SEM of n = 3 independent repeats.
Figure 8

Association of actin with PPP1R15A promotes eIF2α phosphatase activity in vitro.
(A) Silver-stained SDS-PAGE or GFP-affinity purified PPP1R15A-GFP (hR15-GFP) and associated proteins. Asterisks signify identity confirmed by mass spectrometry. Purified complex incubated with phosphorylated recombinant eIF2α N-terminal lobe (eIF2α) for incubated time. Note size shift corresponds to dephosphorylation. (B) Quantification of ‘A’ using ImageJ software. Mean ± SEM. p value calculated by two-way ANOVA, n = 3. (C) Immunoblot for PPP1R15A and eIF2α of HEK293T cells expressing hPPP1R15A-GFP (hR15A-GFP). Treated with cycloheximide 50 µM for indicated times. (D) Quantification of ‘C’. Mean ± SEM, n = 3.
Figure 9 with 1 supplement

Localised changes in the polymeric status of actin modulate the sensitivity of the ISR.
(A) Fluorescence microscopy image of Flp-In T-REx HEK293 cells treated with 1 µg/ml doxycycline for 12 hr to express either ER membrane-localised GFP (GFP-R15B 1–146) or ER membrane-localised GFP-mDia2 fusion (GFP-R15B 1–146_mDia2) then fixed and stained with Alexa-Fluor 568 phalloidin and imaged by confocal microscopy. Bar = 5 µm. (B) Immunoblot for GFP and ATF4 in lysates of GFP-R15B 1–146 or GFP-R15B 1–146_mDia2 Flp-In T-REx HEK293 cells following treatment with doxycycline (Dox) 0.1 µg/ml for indicated times or with ISRIB 100 nM and or thapsigargin 300 nM for 4 hr. Immunoreactivity to ATF4 was quantified using ImageJ software (ATF4 Intensity). Proteins of the expected sizes are marked with a solid triangle GFP-R15B 1–146_mDia2 or an open triangle GFP-R15B 1–146. (C) Immunoblot for P-eIF2α, total eIF2α, and puromycin in lysates of GFP-R15B 1–146 or GFP-R15B 1–146_mDia2 Flp-In T-REx HEK293 cells following pre-treatment—if indicated with doxycycline (Dox) 0.1 µg/ml for 10 hr followed by treatment with tunicamycin 2.5 µg/ml for indicated times. 10 min prior to harvesting, puromycin was added to the culture medium at a final concentration of 10 µg/ml. Immunoreactivity to puromycin within lysates served as a marker of protein translation and was quantified using ImageJ software (Puromycin intensity). Accompanying graphs of mean ± SEM of n = 3 independent repeats.
Figure 9—figure supplement 1
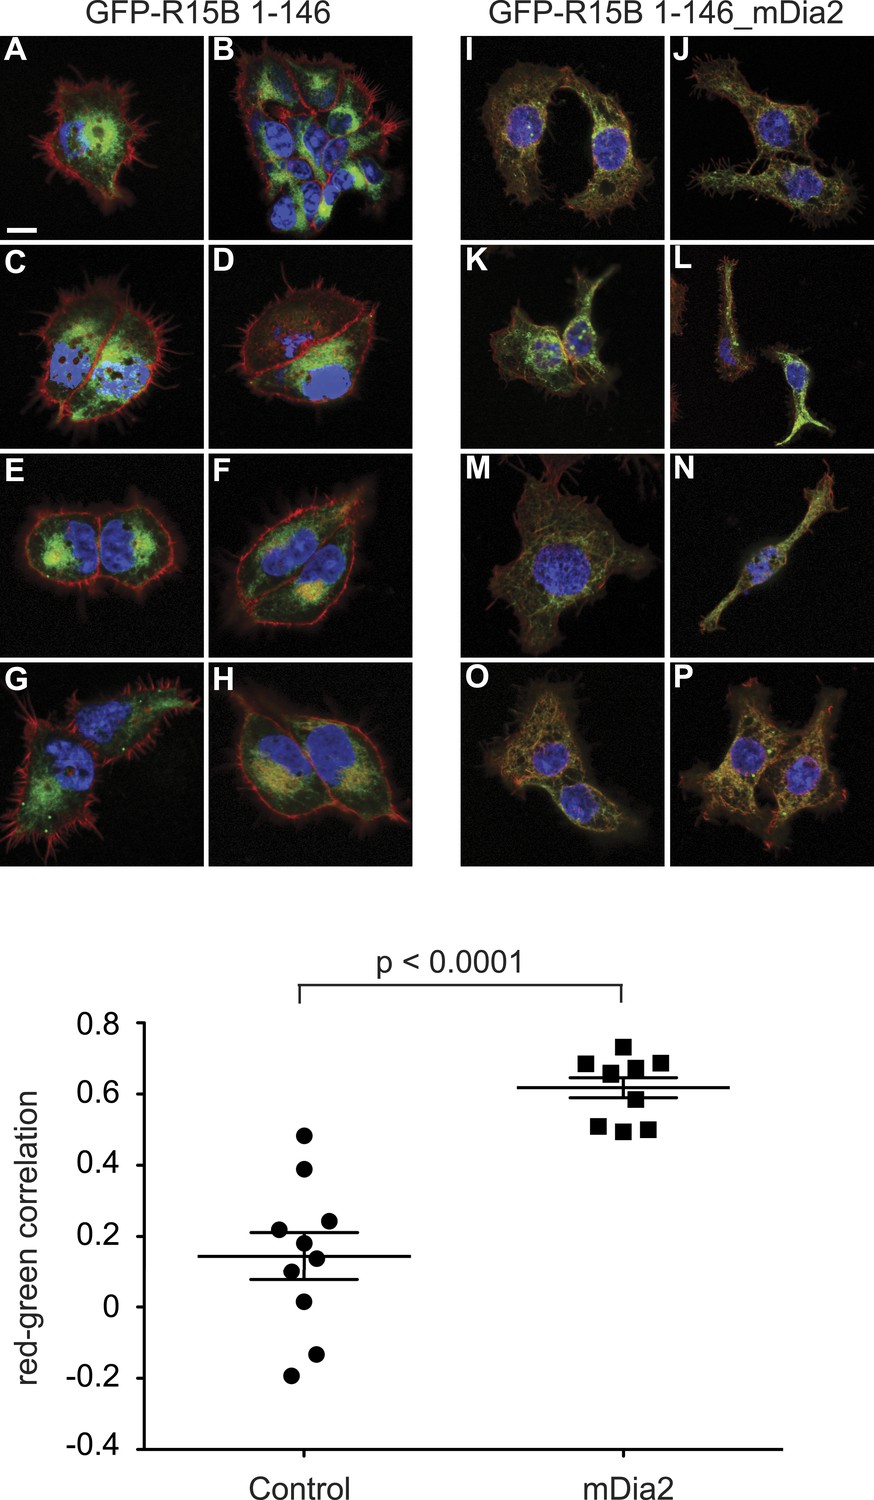
Colocalisation of filamentous actin with ER membrane-localised GFP (GFP-R15B 1–146) or ER membrane-localised GFP-mDia2 fusion (GFP-R15B 1–146_mDia2).
Confocal microscopy images of Flp-In T-REx HEK293 a cells treated with 1 μg/ml doxycycline for 12 hr. Nuclear DAPI staining is shown in blue, Alexa-Fluor 568 phalloidin staining of F-actin is shown in red, and GFP-R15B 1–146 (A–H) or GFP-R15B 1–146_mDia2 (I–P) is shown in green. The graph presents colocalisation analysis by Costes Pearson's correlation. Ten confocal fields were analysed for each cell type. Higher positive values represent increased colocalisation, whereas negative values represent exclusion of F-actin from GFP containing pixels.
Tables
Table 1
Primers used in this study
| hPPP1R15A truncation or point mutation | ||
| 1–615 | For | CCTGCTGCCCGGGCCAGAGCCTGAGCACGCCTCAGGAACC |
| Rev | GGTTCCTGAGGCGTGCTCAGGCTCTGGCCCGGGCAGCAGG | |
| 1–620 | For | CCTGGGCACGCCTCAGGTAGCCACCTTTAGCC |
| Rev | GGCTAAAGGTGGCTACCTGAGGCGTGCCCAGG | |
| 501–654 | For | TAAGCTAGCACCATGGAAGCTGAGCCC |
| Rev | GTCGCGGCCGCTTTACTTGTACAGCTC | |
| V556E | For | CTAAAGGCCAGAAAGGAGCGCTTCTCCGAGAAGGTCACTG |
| Rev | CAGTGACCTTCTCGGAGAAGCGCTCCTTTCTGGCCTTTAG | |
| W616A | For | CCGGGCCAGAGCCGCGGCACGCCTCAGGAA |
| Rev | TTCCTGAGGCGTGCCGCGGCTCTGGCCCGG | |
| R618A | For | GCCAGAGCCTGGGCAGCCCTCAGGAACCCA |
| Rev | TGGGTTCCTGAGGGCTGCCCAGGCTCTGGC | |
| L619A | For | AGCCTGGGCACGCGCCAGGAACCCACCTTT |
| Rev | AAAGGTGGGTTCCTGGCGCGTGCCCAGGCT | |
| R620A | For | CCTGGGCACGCCTCGCGAACCCACCTTTAG |
| Rev | CTAAAGGTGGGTTCGCGAGGCGTGCCCAGG | |
| W616A/L619A | For | CGGGCCAGAGCCGCGGCACGCGCCAGGAACCC |
| Rev | GGGTTCCTGGCGCGTGCCGCGGCTCTGGCCCG | |
| mDia2 fusion | For | AATCCCGGATCCGTGCCTTGCCACCTGGTACA |
| Rev | AGCTCGCTCGAGTTATAAAGCTCGTAATCTTGCCAG | |
| PPP1R15B fusion | ||
| GFP fusion | For | AGATTAGATCTGCCACCATGGAGCCGGGGACAGG |
| Rev | GATCGTCGACACATTGCTTGAGAACATTAAGTCC | |
| dPPP1R15 truncation | ||
| 1–307 | For | CCAGTTCACCGAGATCGTTAGTACCAAGCTCGATTCTTGCACG |
| Rev | CGTGCAAGAATCGAGCTTGGTACTAACGATCTCGGTGAACTGG | |
| 1–312 | For | CGTGTCTACCAAGCTCGATAGTTGCACGAGGACGAGC |
| Rev | GCTCGTCCTCGTGCAACTATCGAGCTTGGTAGACACG | |
Download links
A two-part list of links to download the article, or parts of the article, in various formats.
Downloads (link to download the article as PDF)
Open citations (links to open the citations from this article in various online reference manager services)
Cite this article (links to download the citations from this article in formats compatible with various reference manager tools)
Actin dynamics tune the integrated stress response by regulating eukaryotic initiation factor 2α dephosphorylation
eLife 4:e04872.
https://doi.org/10.7554/eLife.04872


