SnRK1-triggered switch of bZIP63 dimerization mediates the low-energy response in plants
- University of Vienna, Austria
- University of Würzburg, Germany
- Max F. Perutz Laboratories, University of Vienna, Austria
- Instituto Gulbenkian de Ciência, Portugal
- University of Tübingen, Germany
- Universidad Politécnica de Madrid, Spain
- Utrecht University, Netherlands
- Umeå University, Sweden
- University of Natural Resources and Life Sciences, Austria
Figures
Figure 1 with 4 supplements
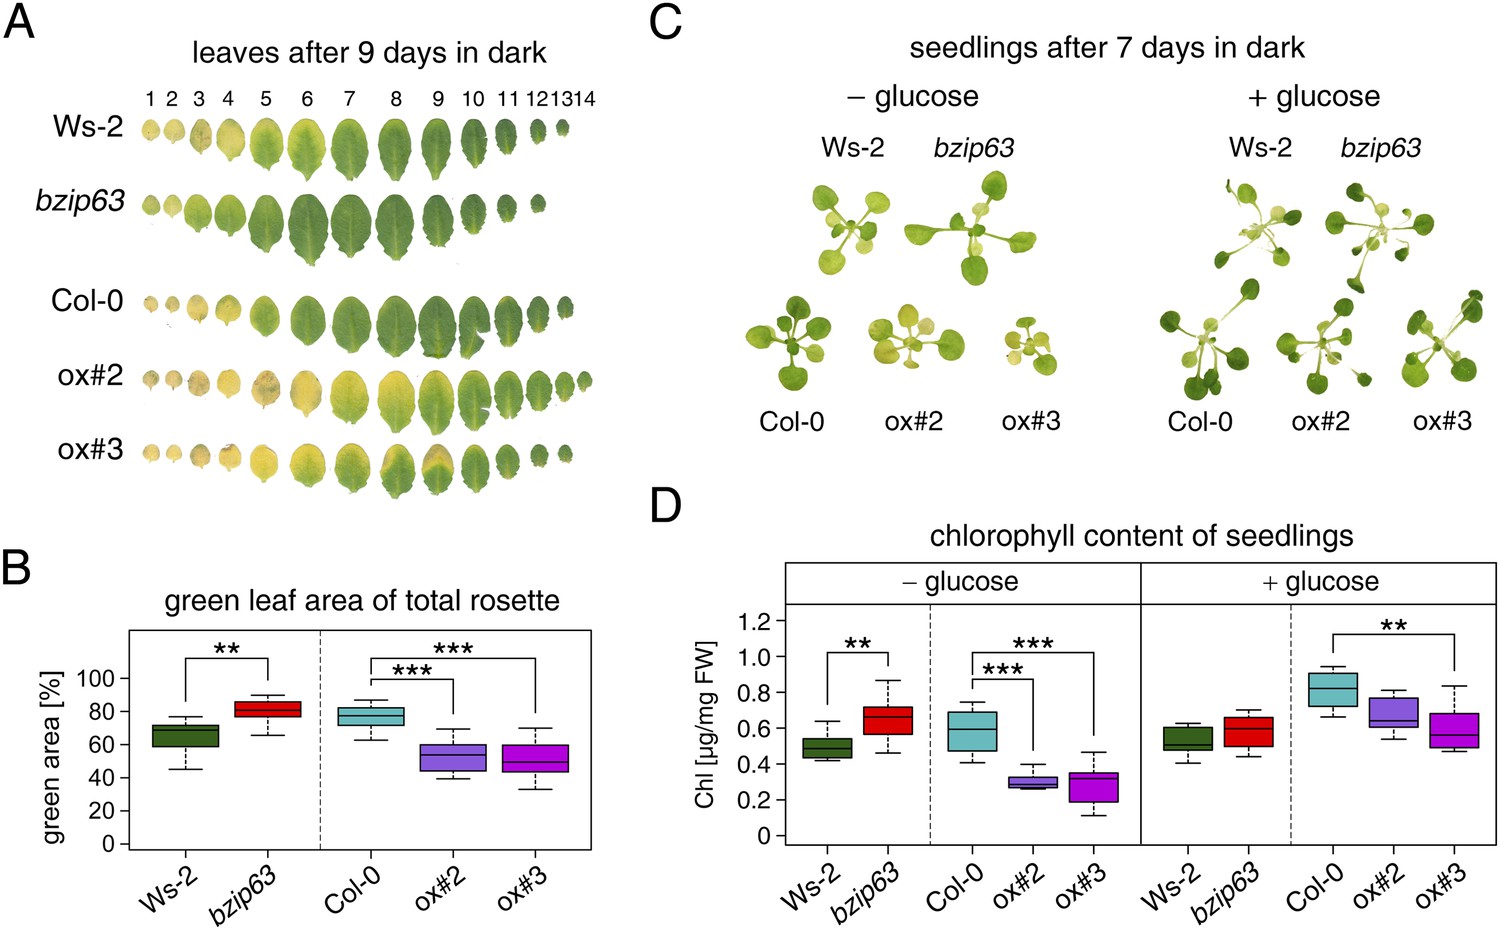
bZIP63 mutants have a phenotype in dark-induced senescence.
(A) and (B) Dark-induced senescence phenotype of 4.5 week-old soil grown plants. Comparison of a bzip63 line in the Wassilewskya (Ws-2), and two bZIP63 ox lines in the Columbia (Col-0) background, after 9 days in darkness. (A) Representative leaf series. (B) Box-and-whiskers plot of the total green leaf area of eight biological replicates as determined with ImageJ. See Figure 1—figure supplement 1 for molecular characterization of the bZIP63 mutant lines, Figure 1—figure supplement 2 for a scheme of the determination of the green leaf area, quantitative chlorophyll measurements, controls and green area of individual leaves, Figure1—source data 1 for the used ImageJ macro, and Figure 1—figure supplement 3 for expression of senescence marker genes in wt and bzip63. (C) and (D) Sugar rescue of the dark-induced senescence phenotype. Seedlings were grown for 12 days on ½ MS agar containing 0.5% sucrose, transferred to ½ MS agar containing 0% or 2% glucose, and grown for another 6 days before incubation in the dark for 7 days. (A) Representative seedlings. (B) Box-and-whiskers plot of the chlorophyll content of 8 seedlings per line and condition. See Figure 1—figure supplement 4 for pictures and chlorophyll content of seedlings before dark incubation. p-values from T-tests between mutants and wt < 0.05, < 0.01, and < 0.001 are indicated by *, **, and ***, respectively.
-
Figure 1—source data 1
ImageJ macro for determination of leaf area and green leaf area.
- https://doi.org/10.7554/eLife.05828.004
Figure 1—figure supplement 1
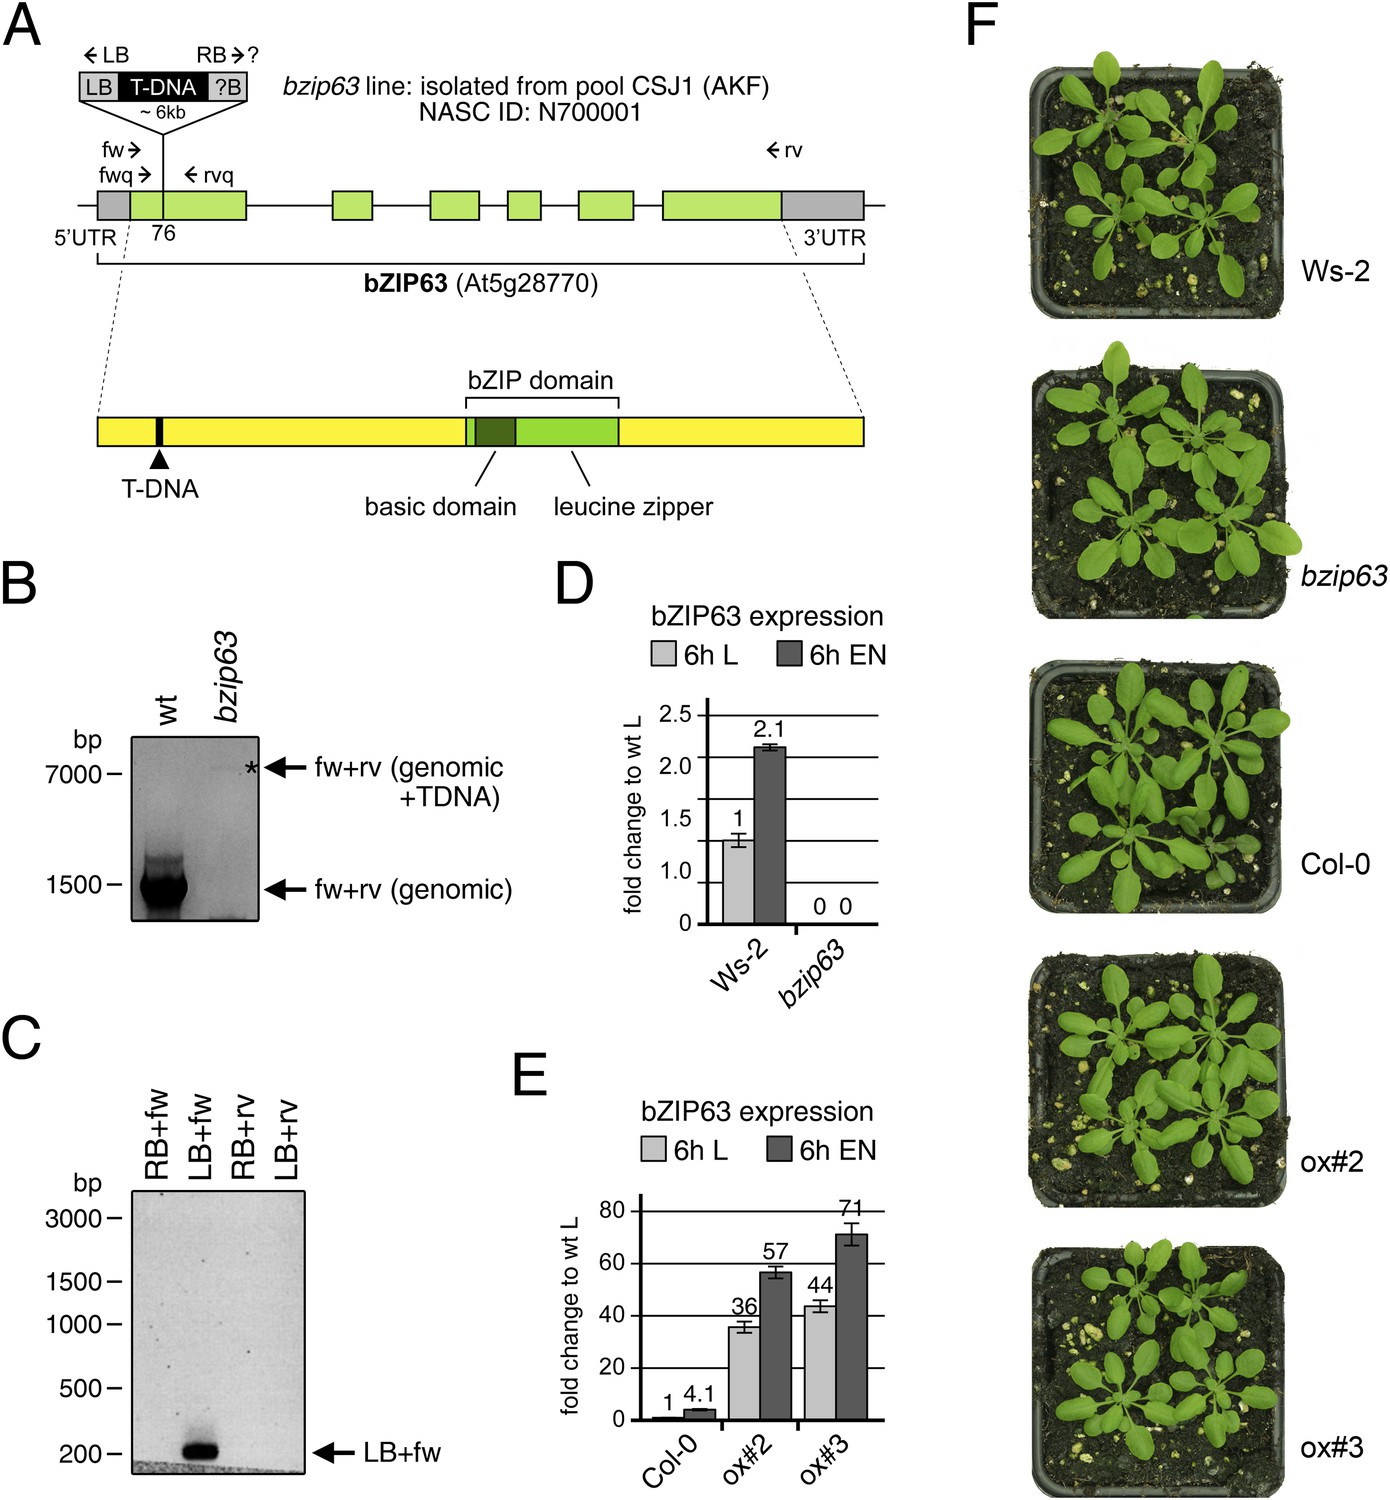
Molecular characterization of the bzip63 line and expression of bZIP63 in the ko and ox lines.
(A) Scheme of the genomic locus (top) and the protein (bottom) of bZIP63. UTRs and exons are shown in grey and green, respectively. The position of the T-DNA in the first exon, as well as the position of primers used for PCR and RT-qPCR are indicated. The position of the T-DNA insertion was determined by sequencing of the PCR product in (C). (B) PCR on genomic DNA using primers fw and rv to show the homozygous T-DNA insertion in the bzip63 line. (C) PCR on genomic DNA from bzip63 plants using primers fw, rv, LB, and RB to determine the localization and orientation of the T-DNA insertion. (D) and (E) Expression of bZIP63 in wt, bZIP63 ko and ox plants. RT-qPCR of bZIP63 in 5 week-old plants after 6 hr of light (L) or extended night (EN) using primers fwq and rvq. Bars represent means ± SD of 5 biological replicates and are given as fold change to Ws-2 in L. (F) Pictures of 5 week-old wt and mutant plants grown in a 12 hr light/12 hr dark cycle.
Figure 1—figure supplement 2
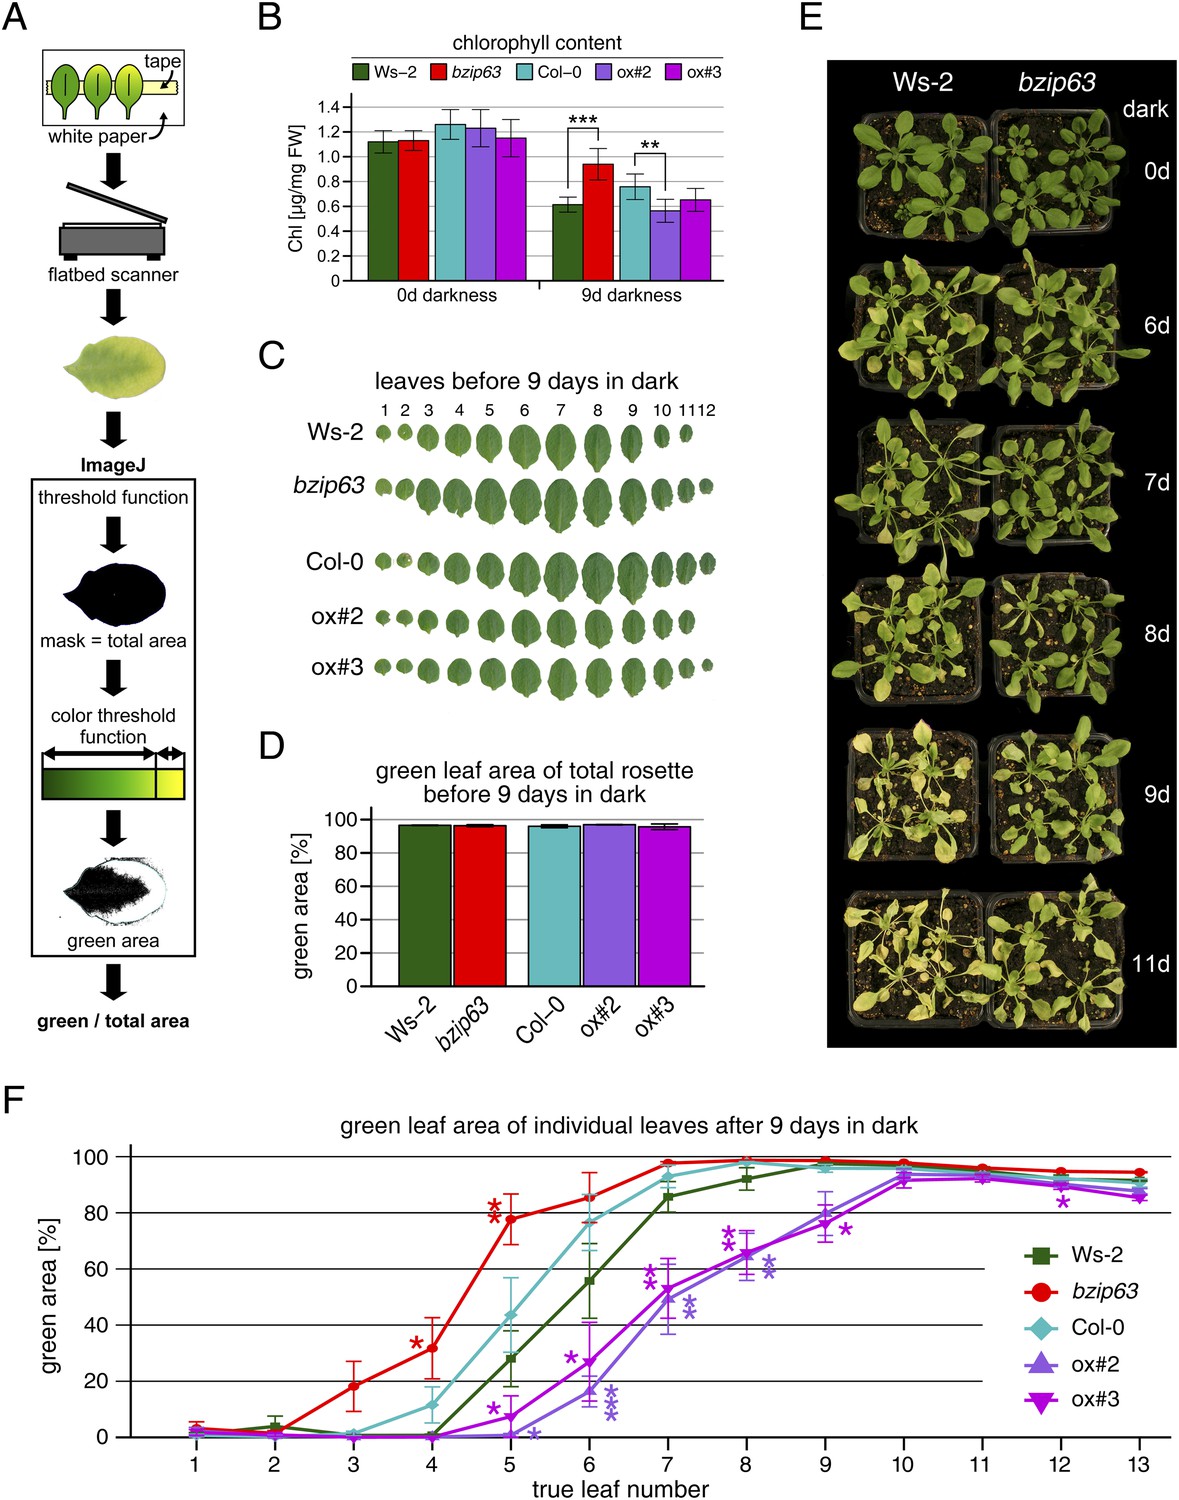
Phenotype of bZIP63 mutants in dark-induced senescence.
Dark-induced senescence phenotype of 4.5 week-old soil-grown plants. Comparison of a bzip63 line in the Wassilewskya (Ws-2) and two bZIP63 ox lines in the Columbia (Col-0) background. (A) Scheme of the workflow to determine the green leaf area. A detailed description and the ImageJ macro can be found in the methods section and in Figure 1—source data 1. (B) Total chlorophyll (chl) content in µg/mg freshweight (FW) of plants before and after 9 days in darkness. Bars represent the mean ± SD of six biological replicates. (C) Representative leaf series of plants before dark treatment. (D) Barplot of the total green leaf area of the rosette before darkness. Values are the mean ± SD of four biological replicates. (E) Dark-induced senescence timecourse. (F) Dotplot of the green leaf area of individual leaves after 9 days in darkness. p-values from T-tests between mutants wt < 0.05, < 0.01, and < 0.001 are indicated by *, ** and ***, respectively.
Figure 1—figure supplement 3
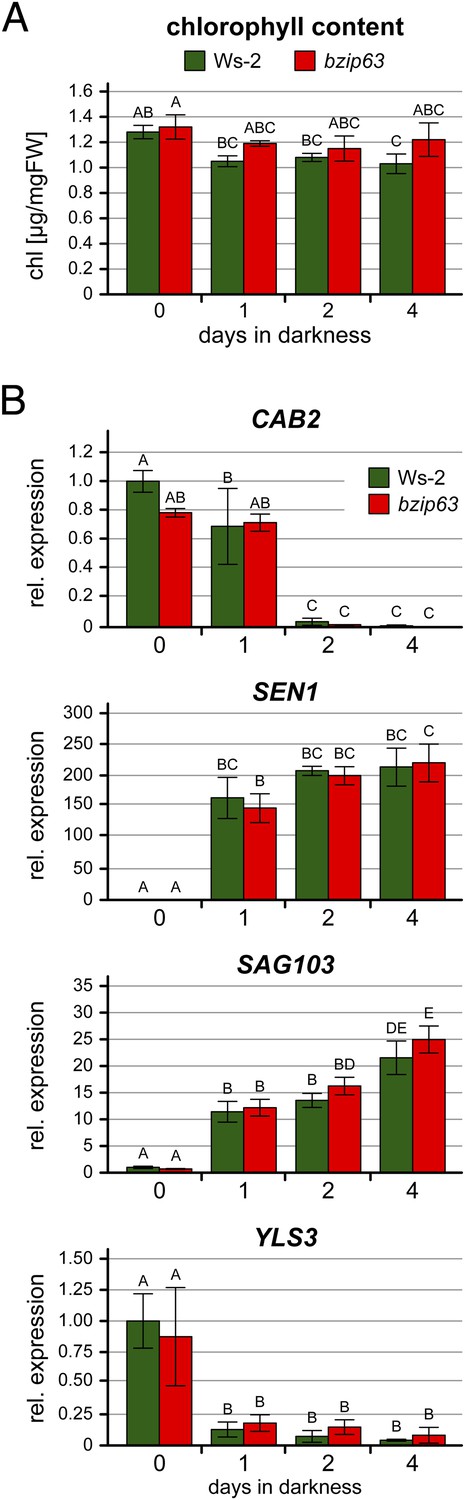
Expression of senescence marker genes during prolonged darkness.
Chlorophyll content (A) and expression of senescence marker genes (B) in 4.5 week-old soil-grown wt and bzip63 plants after 0–4 days of darkness. Bars represent the mean ± SD of three biological replicates. Letters indicate significant differences as determined by ANOVA and pairwise T-testing (p < 0.05). (A) Total rosettes were harvested at the indicated time points and the chlorophyll content in µg/mg FW was determined. (B) From the same plants, expression of the photosynthetic marker gene CAB2 (CHLOROPHYLL A/B-BINDING PROTEIN 2) and three senescence marker genes (Dietrich et al., 2011) was determined by RT-qPCR. The expression is shown relative to wt at day 0 (before dark incubation). SEN1 (SENESCENCE 1) and SAG103 (SENESCENCE-ASSOCIATED GENE 103) are known to be strongly induced by dark-induced senescence, while YLS3 (YELLOW-LEAF-SPECIFIC 3) is induced by natural, but not by dark-induced senescence (Oh et al., 1996; Yoshida et al., 2001; van der Graaff et al., 2006).
Figure 1—figure supplement 4
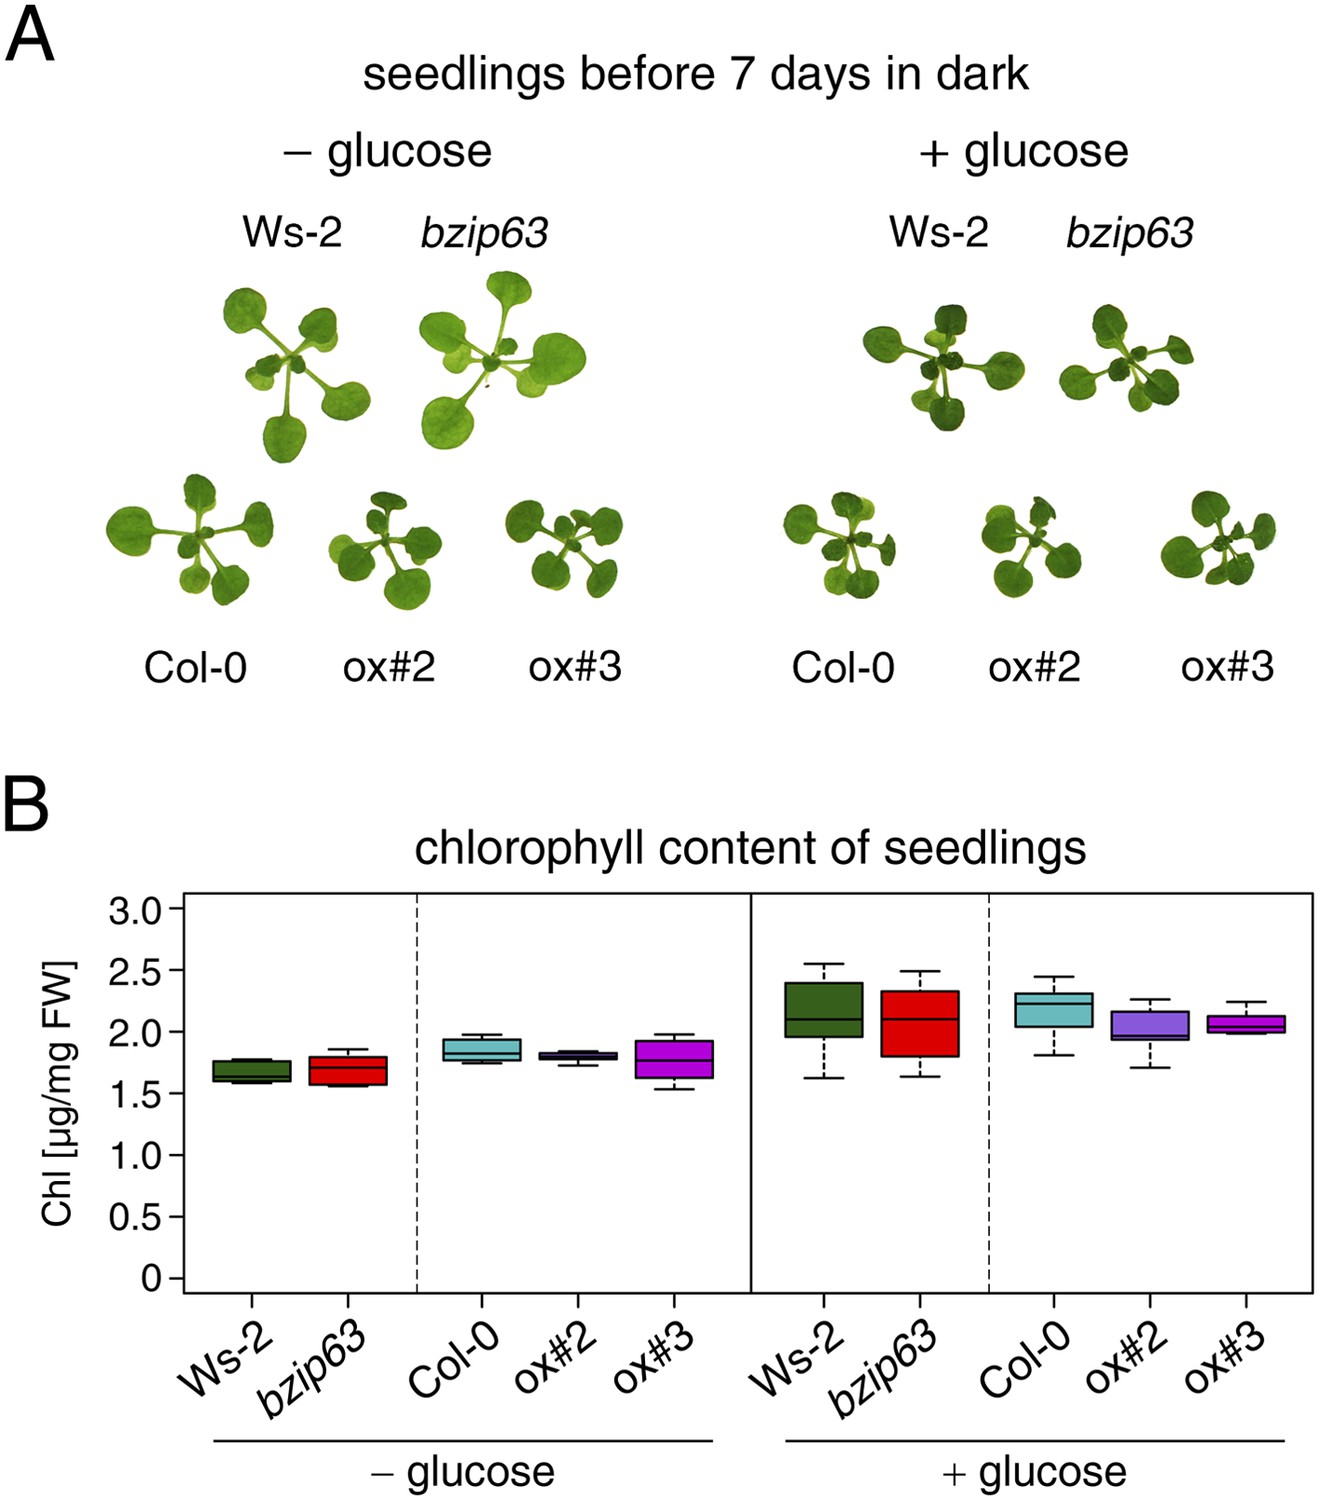
Effect of sugar on bZIP63 mutants in light.
Controls for the sugar rescue of the dark-induced senescence phenotype shown in Figure 1C,D. Seedlings were grown for 12 days on ½ MS agar containing 0.5% sucrose, transferred to ½ MS agar containing 0% or 2% glucose, and grown for another 6 days in a 12 hr light/12 hr dark cycle. (A) Representative seedlings. (B) Box-and-whiskers plot of the chlorophyll content of eight seedlings. T-tests revealed no significant differences between chlorophyll content in wt and mutants.
Figure 2 with 1 supplement
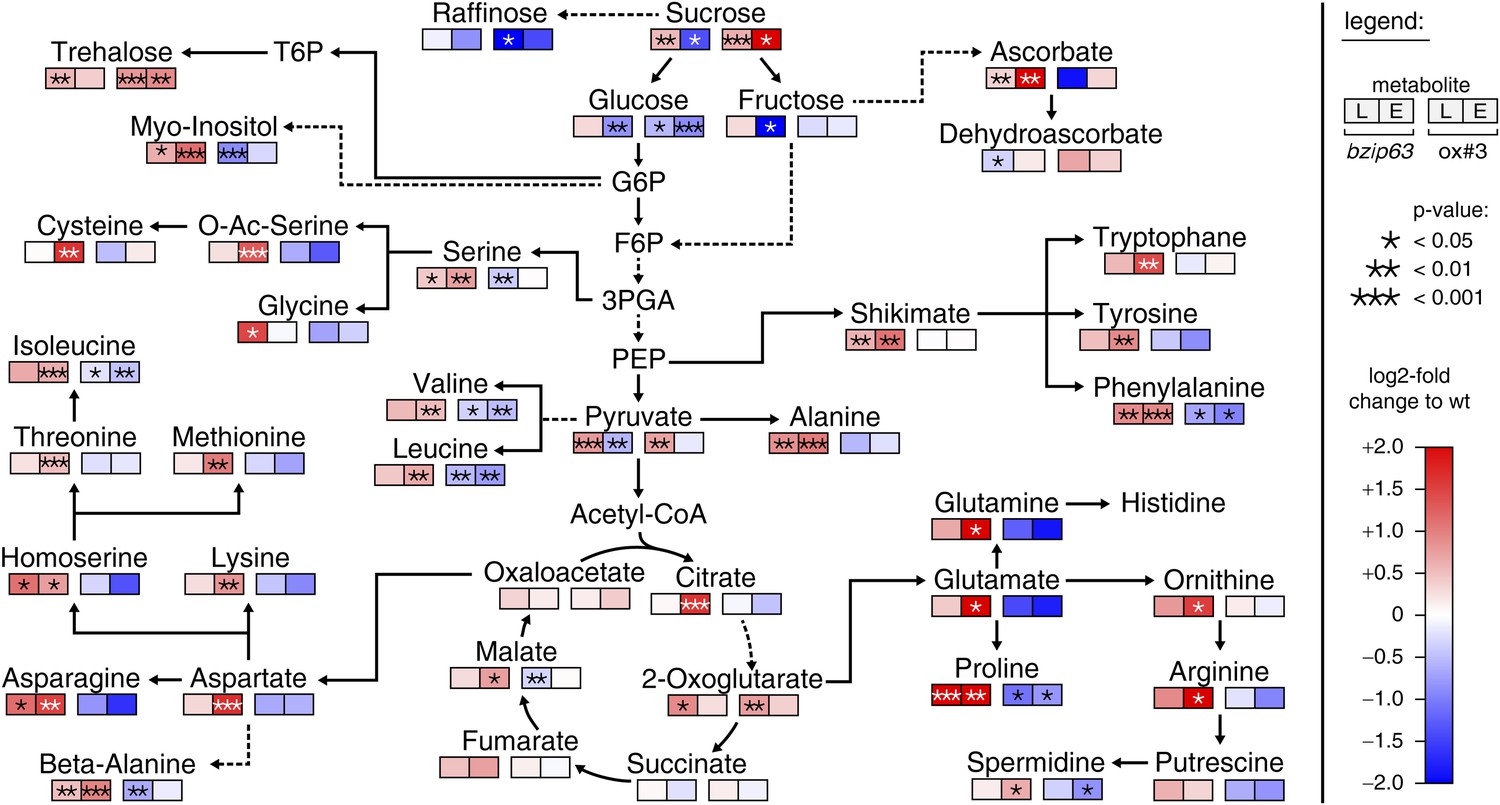
bZIP63 mutants have an altered primary metabolism.
Metabolic phenotype of 5 week-old soil grown plants after 6 hr light (L) and extended night (E). Log-2 fold changes of metabolite levels in ko and ox compared to their respective wt, displayed on a simplified map of the central primary metabolism. Values are means of five biological replicates. p-values from T-tests between mutants and wt < 0.05, < 0.01, and < 0.001 are indicated by *, ** and ***, respectively. For more details including mean values and SD see Figure 2—figure supplement 1 and Figure 2—source data 1.
-
Figure 2—source data 1
Excel table of relative metabolite levels in bZIP63 mutants and p-values from T-tests.
Table of relative metabolite levels in Ws-2, bzip63, Col-0 and ox#3 after 6 hr in light or extended night, which were used to calculate the log2-fold changes shown in Figure 2 and Figure 2—figure supplement 1. Mean values and SD of five biological replicates are given as fold changes to the corresponding wt. p-values from T-tests between wt and mutant are listed.
- https://doi.org/10.7554/eLife.05828.010
Figure 2—figure supplement 1
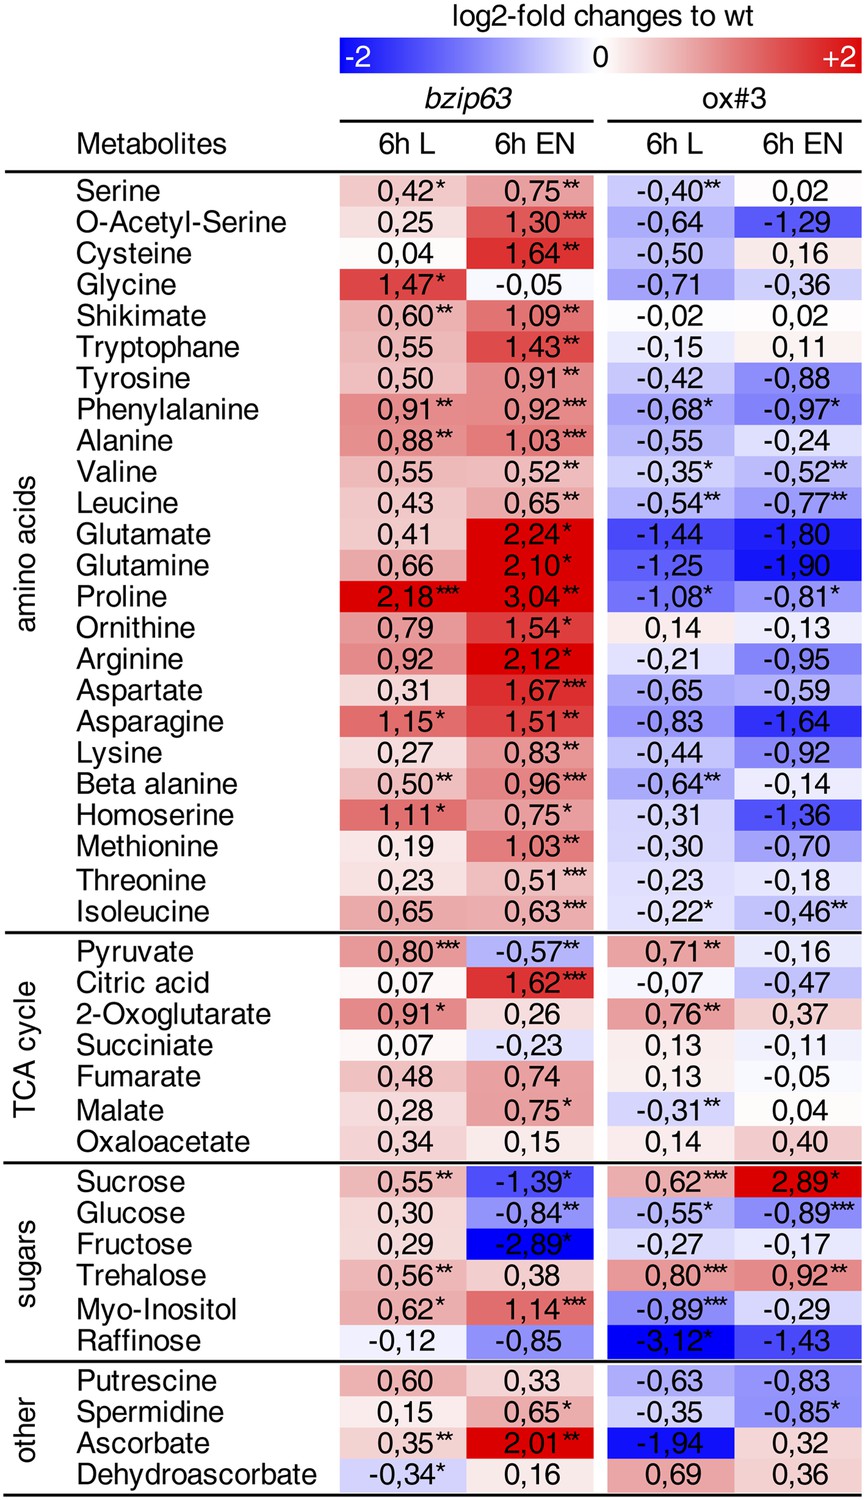
Metabolic changes in bZIP63 ko and ox plants.
Table of the metabolite levels in bzip63 and ox#3 compared to their respective wt shown in Figure 2. Values are the log-2 transformed means of five biological replicates. p-values from T-tests between mutants and wt < 0.05, < 0.01, and < 0.001 are indicated by *, ** and ***, respectively. The color gradient indicates increased (red) or decreased (blue) metabolite levels in the mutant. For relative changes between mutant and wt including the SD and p-values from T-tests see Figure 2—source data 1.
Figure 3 with 2 supplements
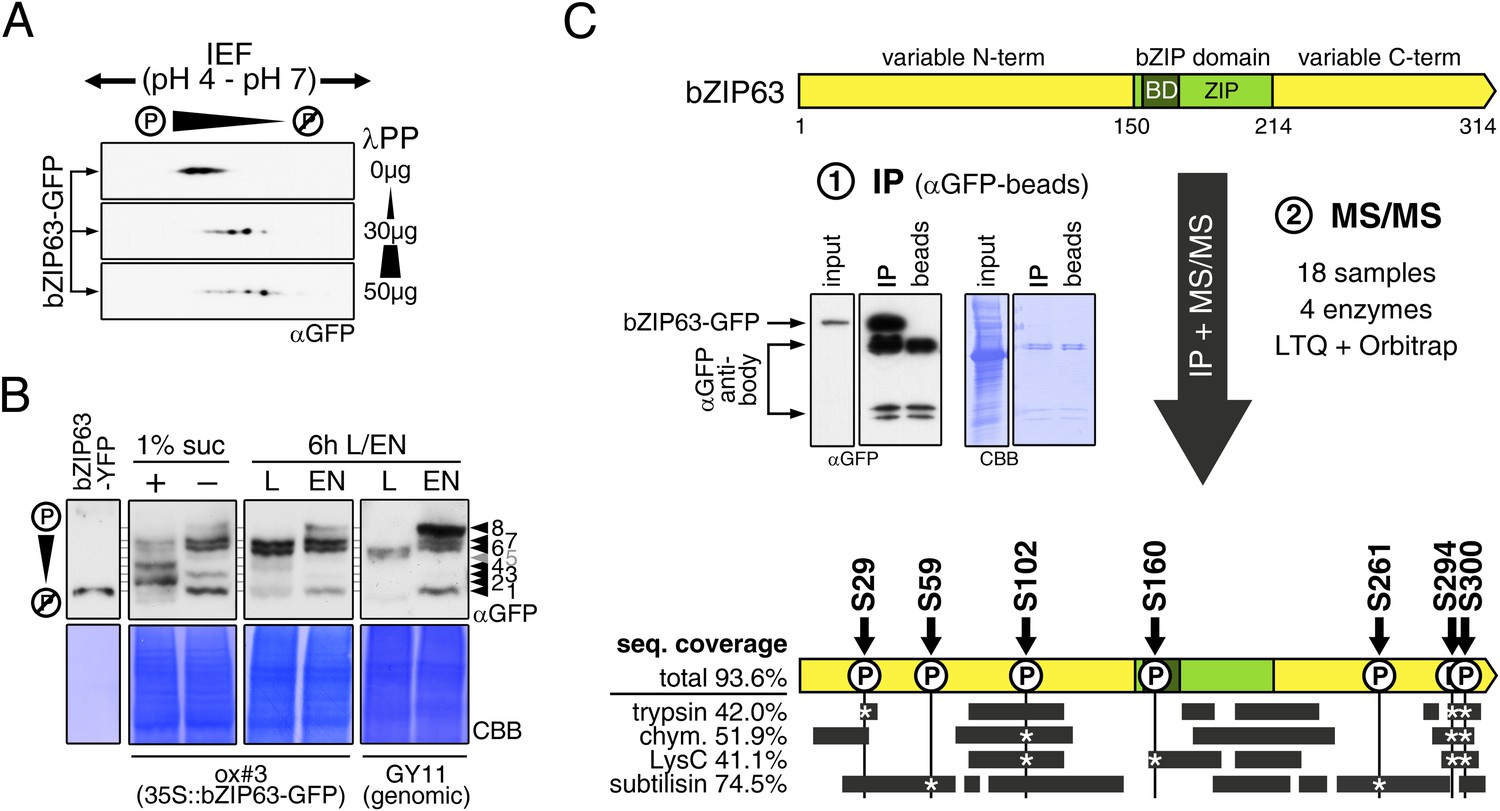
bZIP63 is phosphorylated at multiple sites in an energy-dependent manner in vivo.
(A) 2D gel western blots (αGFP) of lambda phosphatase (λPP)-treated protein extracts from adult soil-grown plants expressing bZIP63-GFP (ox#3). (B) Phos-tag gel western blots showing the in vivo phosphorylation state of bZIP63 in seedlings after 6 hr extended night in the presence (+) or absence (−) of 1% sucrose and in 5 week-old soil-grown plants after 6 hr light (L) or extended night (EN). Plants either expressed 35S::bZIP63-GFP (ox#3) or a genomic fragment of bZIP63 (GY11) with a YFP-tag. Recombinant bZIP63-YFP was used as a nonphosphorylated control. Numbered arrowheads on the right mark the position of each observed bZIP63 band for easy reference with other figures (see Figure 3—figure supplement 1 for a comparative image of all Phos-tag western blots). For more information on the genomic line see Figure 7 and Figure 7—figure supplement 1. (C) Identification of in vivo phosphorylation sites by immunoprecipitation (IP) and tandem mass spectrometry (MS/MS). An exemplary western blot of the IP is shown. The scheme at the bottom shows the positions of the identified in vivo phosphorylation sites and the total sequence coverage reached with each proteolytic enzyme (grey bars). Asterisks mark the identification of a phospho-site. For more information on samples and (phospho-) peptides see Figure 3—figure supplement 2. IEF, isoelectric focusing; CBB, coomassie brilliant blue; BD, basic domain; ZIP, leucine zipper; LTQ, linear ion trap quadrupole; chym., chymotrypsin.
Figure 3—figure supplement 1

Comparison of Phos-tag western blots from different figures.
For better comparison of Phos-tag western blots (αGFP) shown in different figures of this manuscript, all Phos-tag western blots were aligned here. In case more than one image of the same lines and conditions exists, only one is shown. The bands were labeled with numbers from 1 to 8, where 1 is the presumably non-phosphorylated state and 8 is the highest phosphorylated form. The two semicircles to the right of each blot indicate the presence of a band at this position in each of the two lanes, with the shade corresponding to the intensity of the band (light grey for weak bands, dark for strong bands). The figures and figures supplements (S) in which the blots are shown are given below.
Figure 3—figure supplement 2
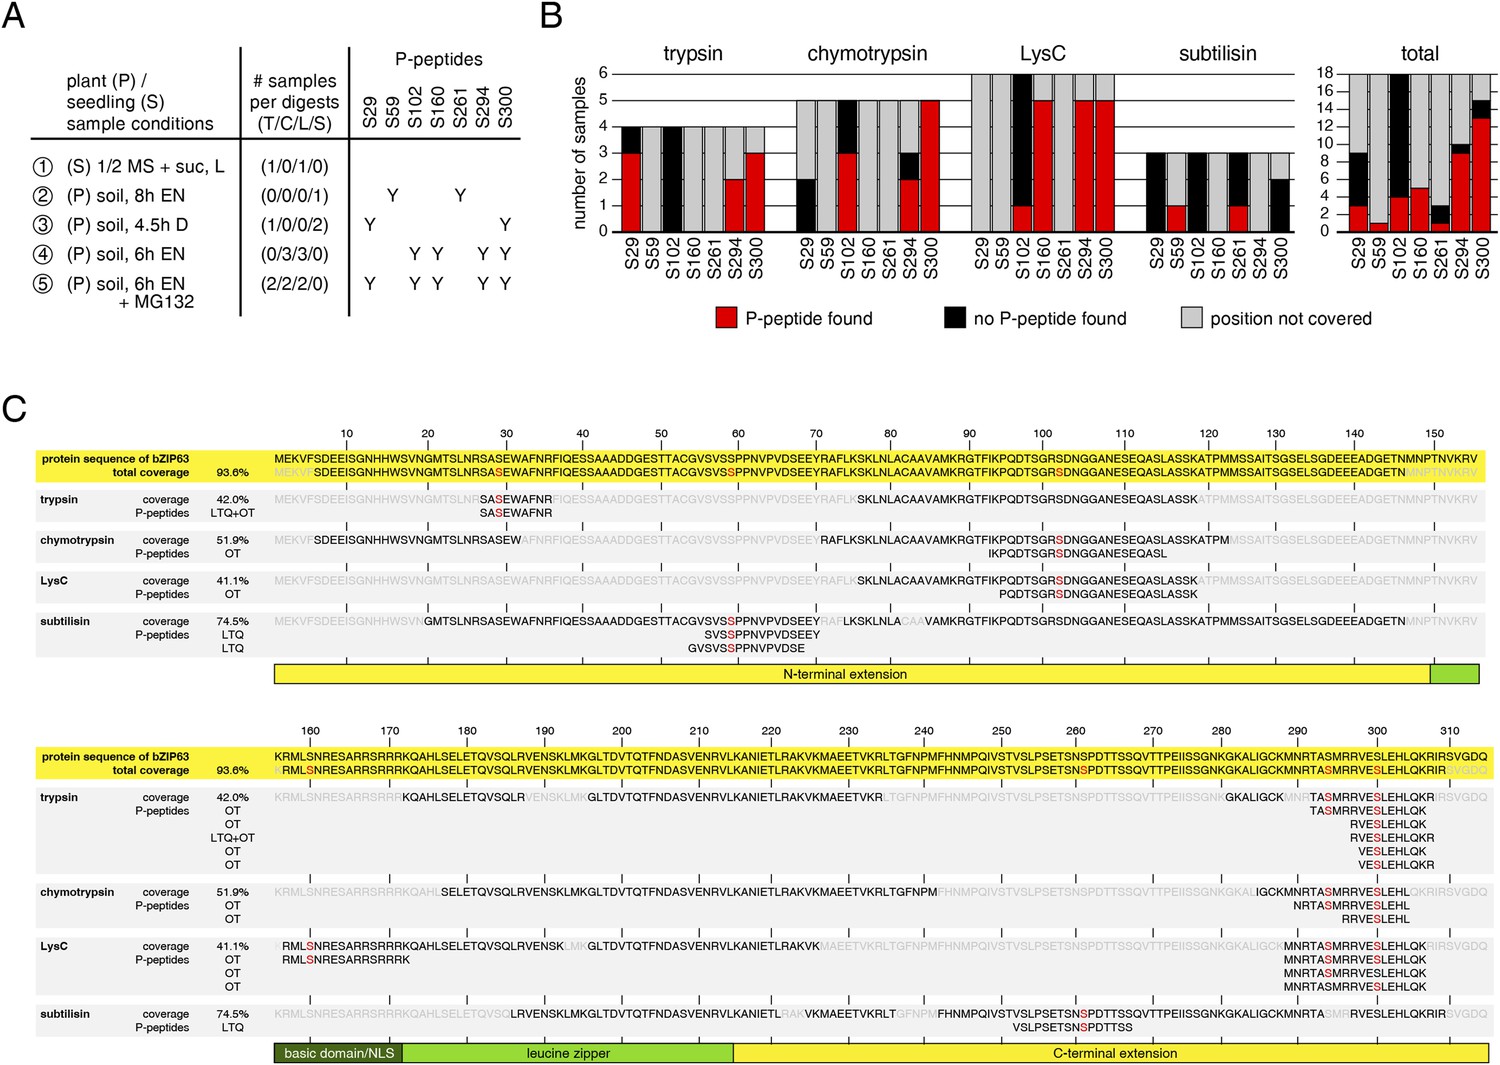
Overview over identified phospho-peptides of bZIP63.
(A) Sample overview, summarizing for each of the five independent experiments: plant material, growth conditions, the number of samples digested with each proteolytic enzyme, and the identified phospho-sites (Y). Experiments 1 to 3 were measured with a linear ion trap quadrupole (LTQ), experiments 4 and 5 with an LTQ-Oribtrap (OT). (B) Phospho-peptide identification frequencies for the proteolytic enzymes. The barplot shows, for each proteolytic enzyme, the number of samples in which an in vivo phosphorylation-site was covered (black or red) or not covered (grey), and how often a phospho-peptide was identified (red). (C) Graph showing the total protein coverage from all experiments, as well as the protein coverage that was achieved with each of the four proteolytic enzymes in % and as a sequence. Parts of the sequence that were covered and not covered are shown in black and light grey, respectively. Identified phospho-serines are red. Below the coverage, all identified phospho-peptides are listed and the instrument used for identification is specified (LTQ or OT). The numbers on top indicate the position in the protein sequence. The scheme below indicates the position of the conserved bZIP domain (green), including the basic domain (dark green), and the N- and C-terminal extensions (yellow). L, light; EN, extended night; D, dark; suc, sucrose; T, trypsin; C, chymotrypsin; L, LysC; S, subtilisin; NLS, nuclear localization signal.
Figure 4 with 1 supplement
Several different kinases can phosphorylate bZIP63.
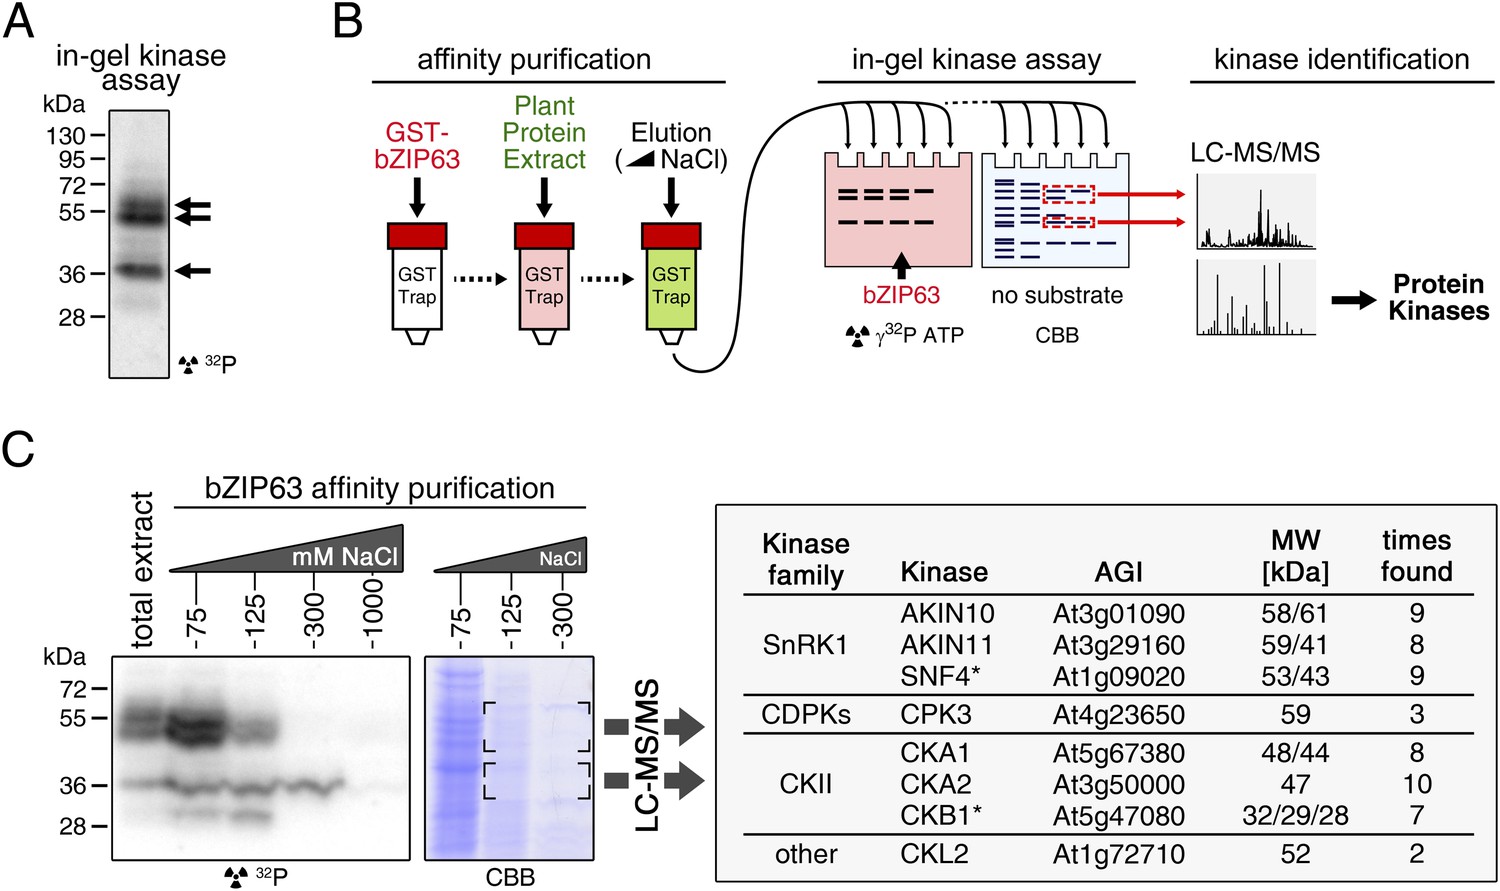
(A) In-gel kinase assay with a root protein extract from hydroponically grown wild type plants and bZIP63 as substrate. Arrows indicate the positions of potential bZIP63 kinases. (B) Scheme of the kinase identification process. (C) In-gel kinase assay with samples from affinity purification of a root protein extract with bZIP63 and bZIP63 as a substrate (left) and a list of catalytic and regulatory (*) kinase subunits identified with high confidence (right). The list also contains the gene identifier (AGI), molecular weight (MW), and number of samples in which the protein was found. For controls and a list of all identified kinases and kinase peptides see Figure 4—figure supplement 1 and Figure 4—source data 1, 2. CBB, Coomassie brilliant blue.
-
Figure 4—source data 1
Overview over the kinases identified by LC-MS/MS after affinity purification with bZIP63.
- https://doi.org/10.7554/eLife.05828.016
-
Figure 4—source data 2
Excel table containing a detailed overview over the identified kinases and analyzed samples as well as all peptides found for the kinase subunit.
The tab ‘kinase overview’ contains a table showing in which samples each kinase subunit was identified, including the number of peptides, proteotypic peptides, MASCOT (Matrix Science) score, and expected molecular weight. The other tabs list all peptides found for the kinase subunits in each sample and state whether the peptide is proteotypic (Y) or not.
- https://doi.org/10.7554/eLife.05828.017
Figure 4—figure supplement 1
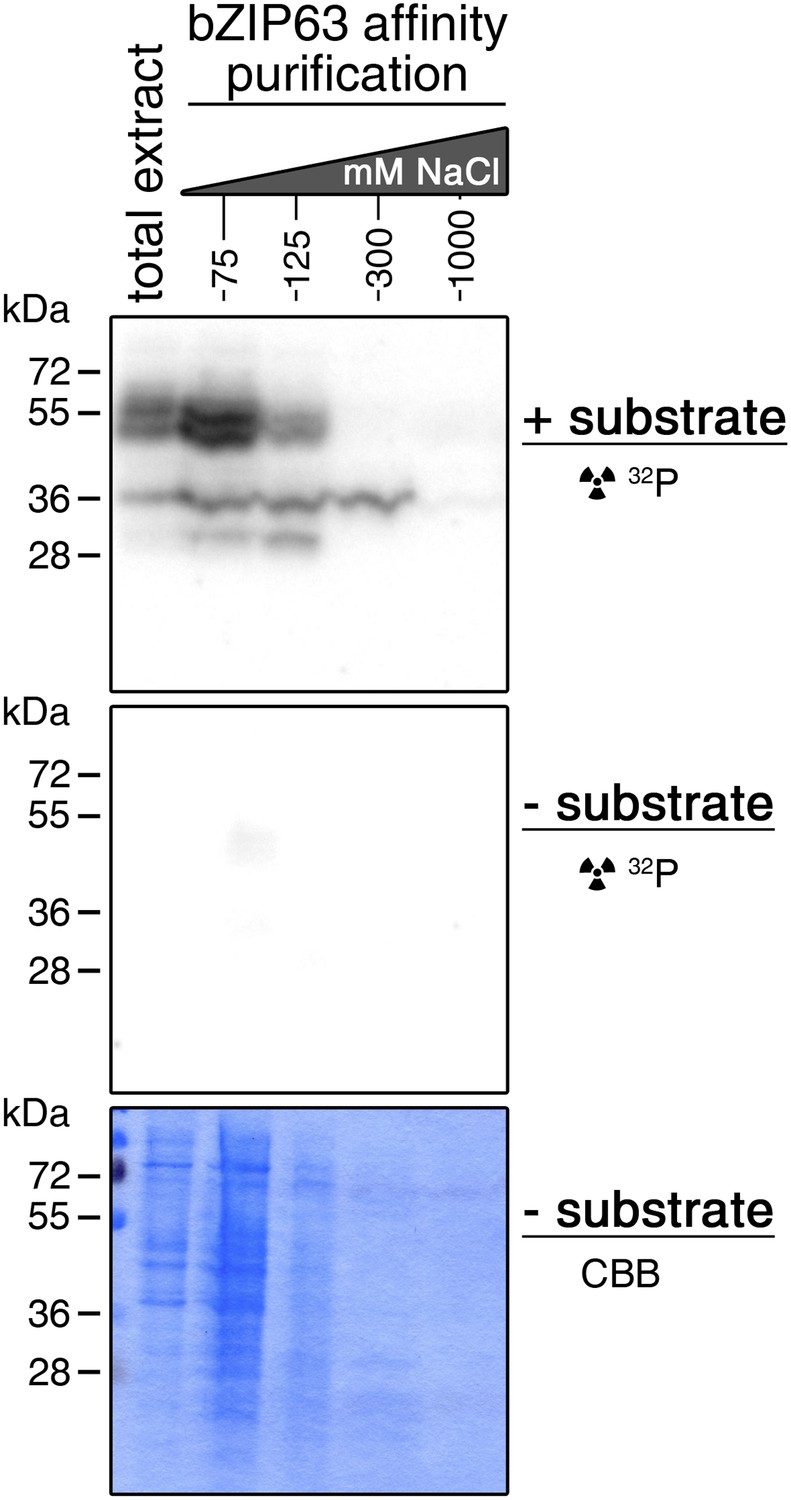
Auto-phosphorylation from the protein extracts is negligible in in-gel kinase assays.
In-gel kinase assay with samples from affinity purification of a root protein extract from hydroponically grown plants with bZIP63. Comparison of a gel with bZIP63 as a substrate (top, see also Figure 4C) and a gel without substrate (middle). A Coomassie brilliant blue (CBB) stained gel is shown at the bottom.
Figure 5 with 7 supplements
The SnRK1 kinase AKIN10 phosphorylates bZIP63 and interacts with bZIP63 in vivo.
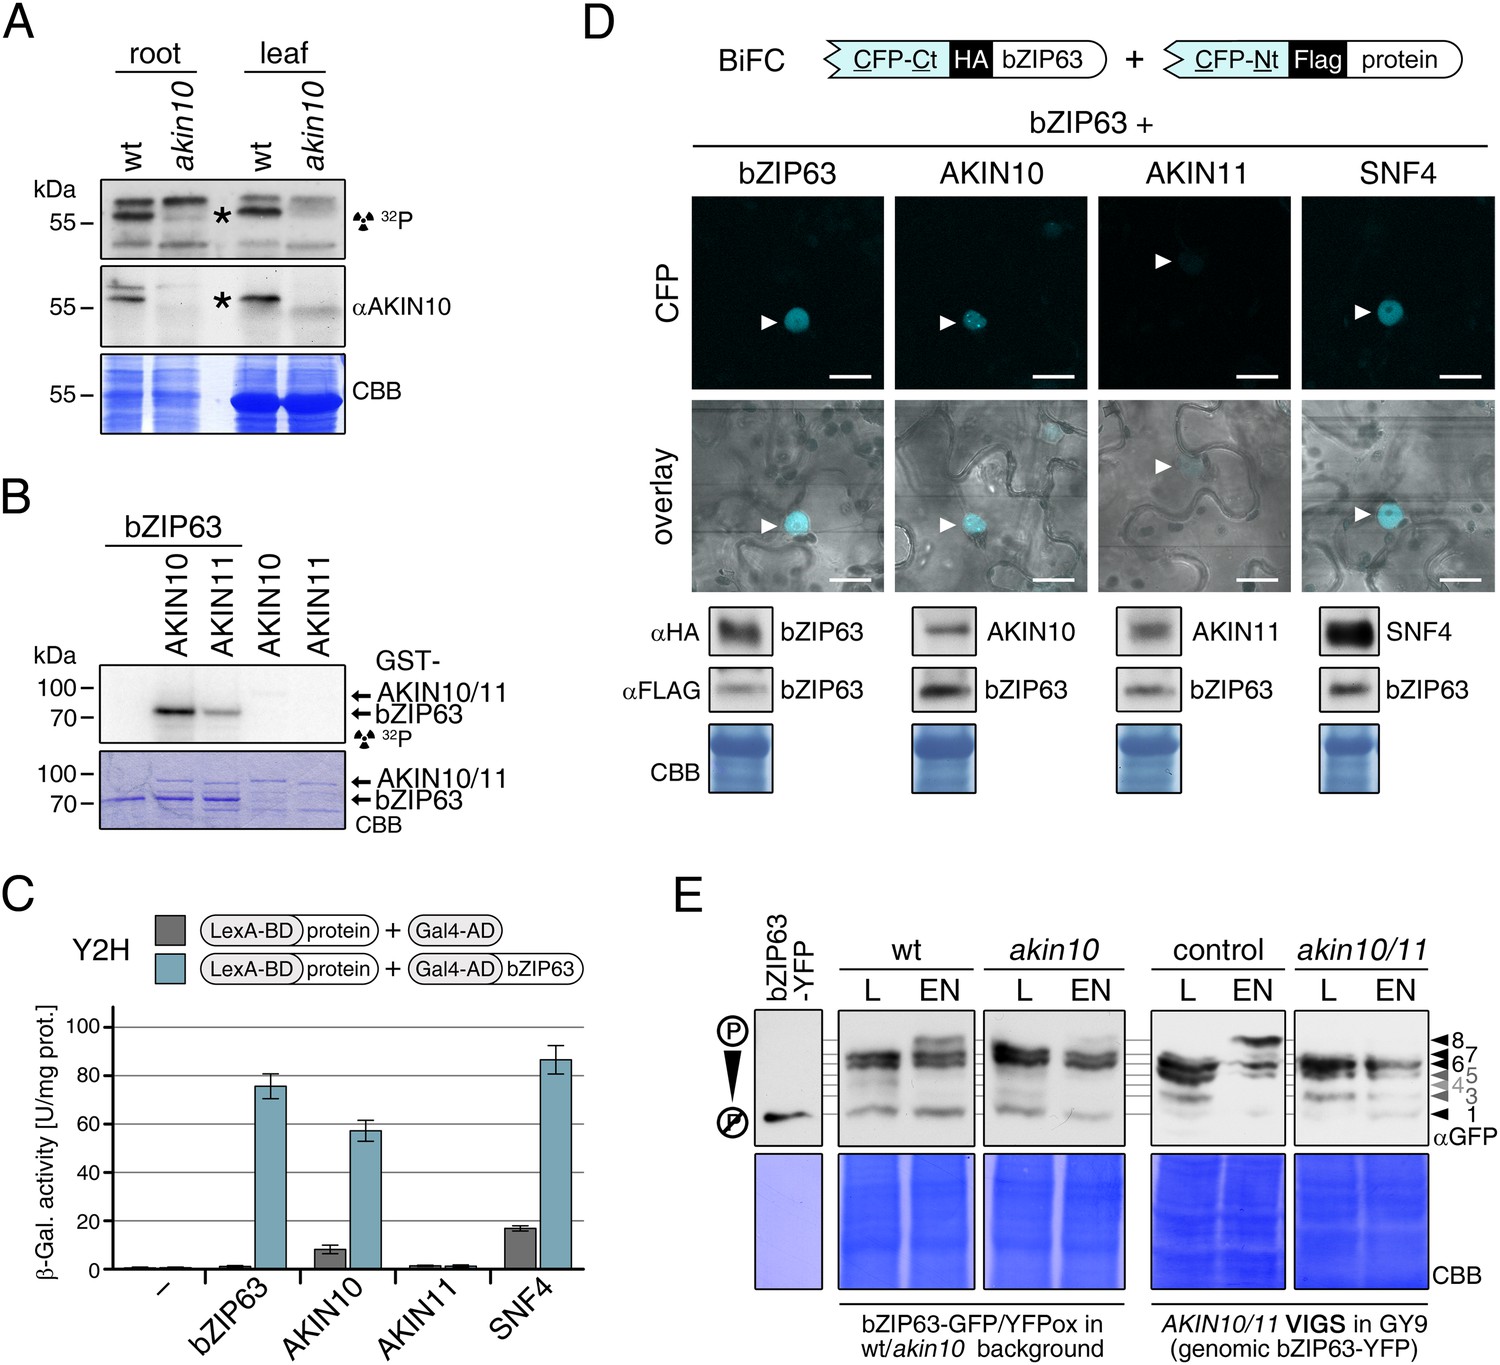
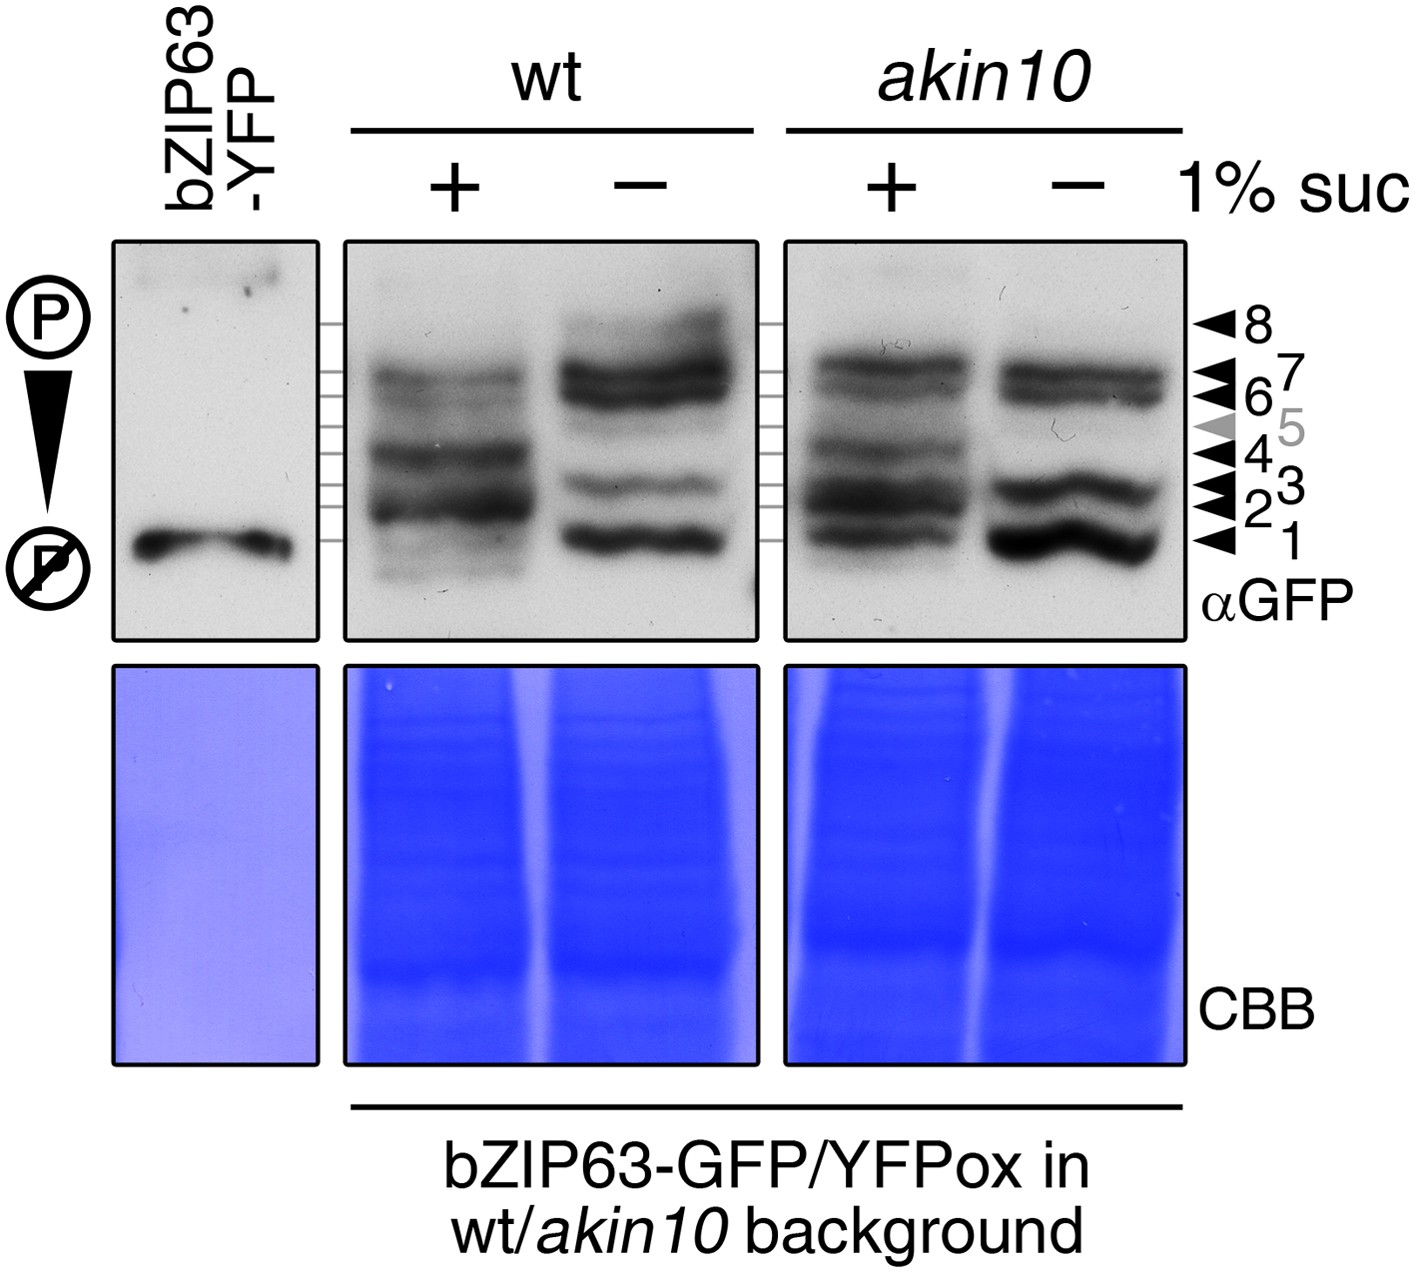
(A) In-gel kinase assay with protein extracts from wt and akin10 plants and bZIP63 as a substrate (top), western blot against AKIN10 (αAKIN10, middle), and Coomassie brilliant blue stain (CBB, bottom). Asterisks mark the position of AKIN10. For characterization of the akin10 line see Figure 5—figure supplements 1–3. (B) In vitro kinase assay with recombinant AKIN10/AKIN11 and bZIP63 as a substrate. See also Figure 5—figure supplement 4 for kinase assays including the SnRK1 upstream kinase SnAK2. (C) and (D) Interaction of SnRK1 subunits with bZIP63. Homo-dimerization of bZIP63 was used as a positive control. (C) Yeast two-hybrid (Y2H) assay with auto-activation in grey and interaction with bZIP63 in blue. Bars represent means ± SD of eight biological replicates. For Y2H with AKINβ1 and β2 see Figure 5—figure supplement 5. (D) Laser scanning microscopy images of bimolecular fluorescence complementation (BiFC) in transiently transformed Nicotiana tabacum leaves (top). Arrowheads indicate the position of the nucleus. Size bar = 20 µm. Expression of the fusion proteins was verified by western blots (αHA, αFlag, bottom). (E) Phos-tag gel western blots showing the in vivo phosphorylation state of bZIP63 in 4–5 week-old soil grown plants after 6 hr light (L) or extended night (EN) in the presence and absence of AKIN10 alone or both AKIN10 and AKIN11. Plants overexpressing bZIP63-YFP in the akin10 line were compared to plants overexpressing bZIP63-GFP in the wt background (ox#3) (left). Additionally, AKIN10 and AKIN11 were knocked down (akin10/11) by virus-induced gene silencing (VIGS) in plants expressing genomic bZIP63 with a YFP-tag (GY9 line). See Figure 5—figure supplement 7 for images and a western blots of the VIGS plants. Recombinant bZIP63-YFP was used as a nonphosphorylated control. Numbered arrowheads on the right mark the position of each observed bZIP63 band for easy reference with other figures (see Figure 3—figure supplement 1 for a comparative image of all Phos-tag western blots). A comparison of the phosphorylation state of bZIP63 in seedlings can be found in Figure 5—figure supplement 6.
Figure 5—figure supplement 1
Molecular characterization of the akin10 line.
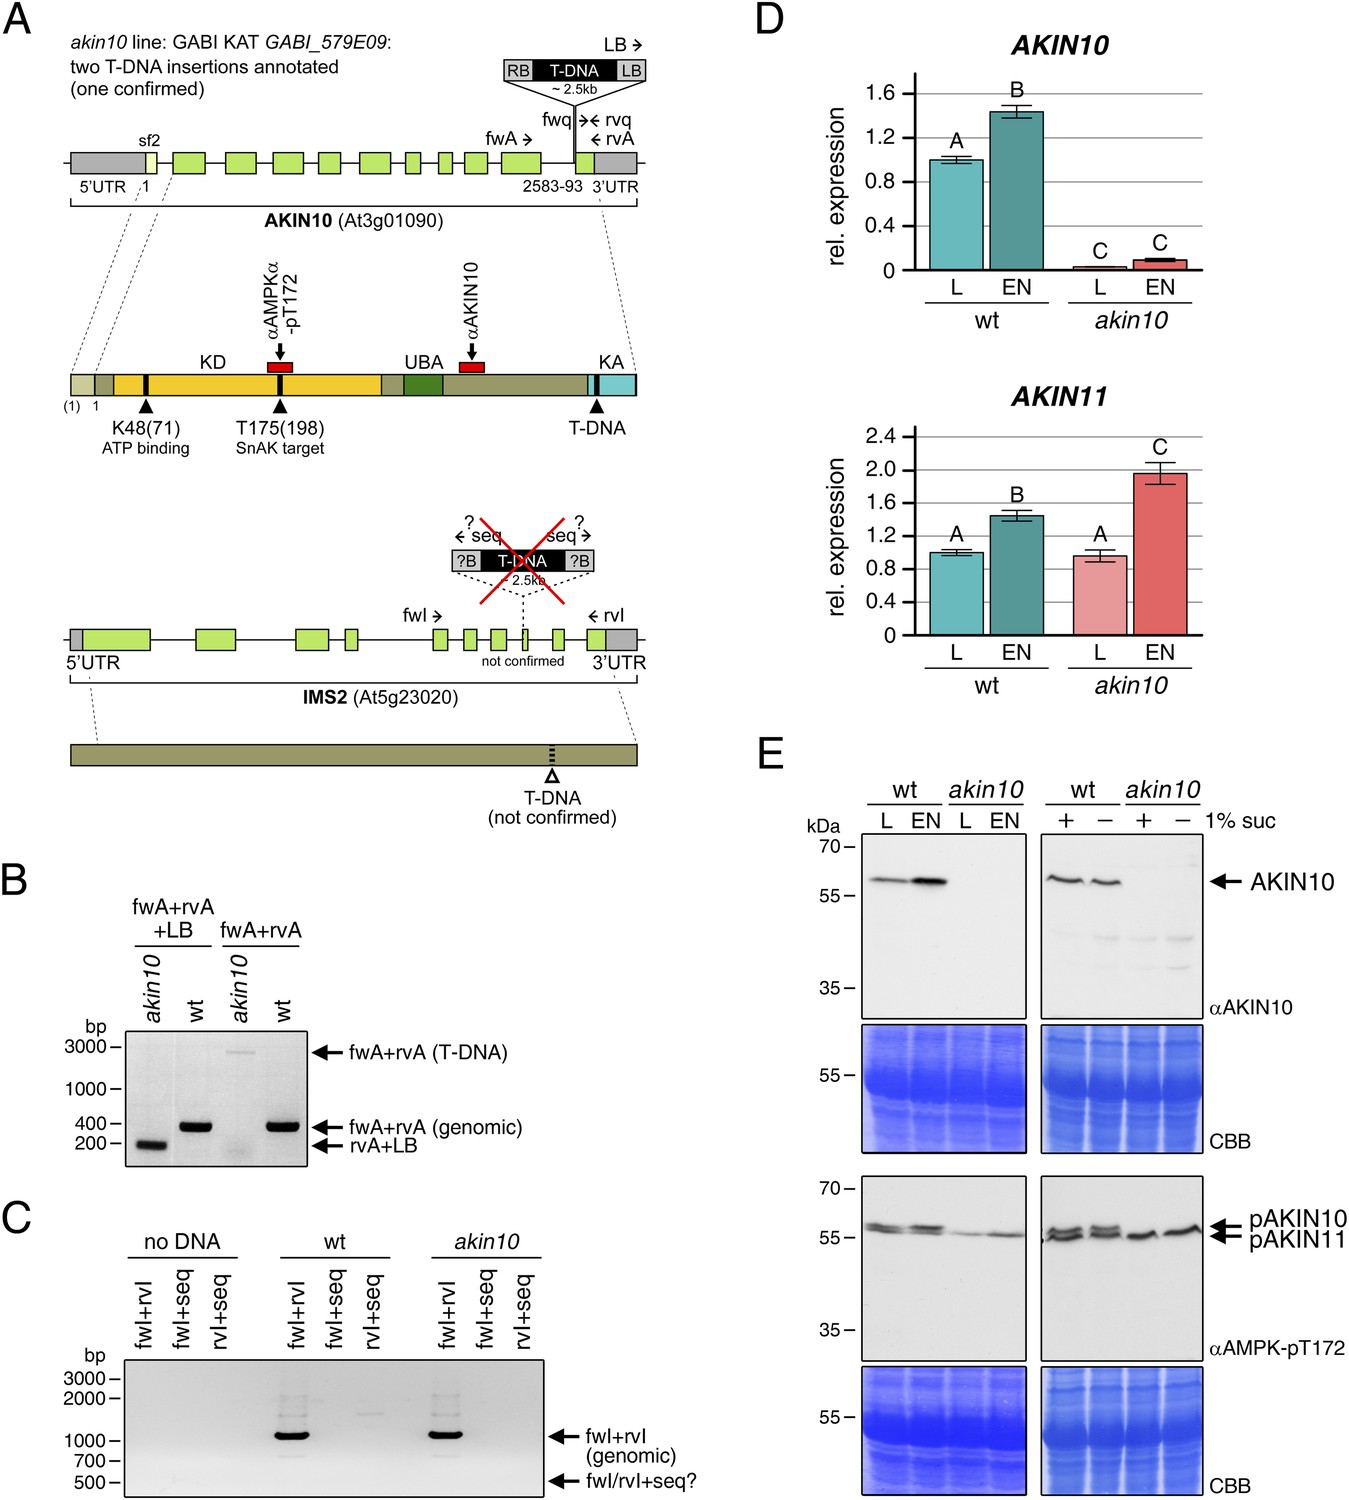
(A) Scheme of the genomic locus and protein of AKIN10 (top) and IMS2 (bottom). For the genomic locus, UTRs and exons are shown in grey and green, respectively. For AKIN10 an alternative first exon for splicing form 2 (sf2) is shown in light green. The confirmed (AKIN10) and annotated but not detected (ISM2) T-DNA insertion sites are indicated, as well as the binding sites of primers used for PCRs in (B–D). For the AKIN10 protein, the positions of the kinase catalytic domain (KD), the ubiquitin-associated domain (UBA), the kinase-associated domain (KA), as well as the binding sites for antibodies against AKIN10 and AMPK-pT172 used in (E) are shown. The AMPK-pT172 antibody recognizes the phosphorylated T in the T-loop of both AKIN10 and AKIN11. The position of K48, which was mutated in the inactive AKIN10 version used in this manuscript, is shown as well. (B) PCR on genomic DNA from wt and akin10 plants to confirm the T-DNA insertion in AKIN10 and homozygosity of the plant lines. (C) PCR on genomic DNA from wt and akin10 plants did not confirm the second T-DNA insertion in the akin10 line in the IMS2 gene. (D) Expression of AKIN10 and AKIN11 in rosette leaves of 5 week-old wt and akin10 plants after 6 hr of light (L) and extended night (EN) as determined by RT-qPCR. Bars represent the means ± SD of four biological replicates and are normalized to wt in L. Letters indicate significant differences as determined by ANOVA and pairwise T-testing (p < 0.05). (E) Western blots detecting AKIN10 (αAKIN10) and AKIN10 and 11 phosphorylated in the T-loop (αAMPK-pT172) in wt and akin10 plants. Proteins were extracted from mature soil-grown plants after 6 hr of light or extended night (left) or from 2 week-old seedlings treated with 6 hr of extended darkness in the presence (+) or absence (−) of 1% sucrose (suc; right). CBB, Coomassie Brilliant Blue.
Figure 5—figure supplement 2

Phenotype and gene expression of selected AKIN10 target genes in the akin10 line.
(A) No obvious difference in growth could be observed between wt and akin10 plants grown for 7 weeks under short day conditions. The number of leaves, fresh weight (FW), dry weight (DW) and the water content (FW/DW) were determined. Bars represent the means ± SD of 20 biological replicates. (B) Mild flowering phenotype of akin10. Wt and akin10 plants were grown under short day conditions and the number of leaves at time of bolting was determined. Bars represent the means ± SD of 14 (wt) and 11 (akin10) biological replicates. (C) Expression of selected AKIN10 target genes (Baena-Gonzalez et al., 2007) involved in amino acid metabolism (ASN1, ProDH, BCAT2 (BRANCHED-CHAIN AMINO ACID TRANSAMINASE 2), AA-TP family protein (amino acid transporter family protein)) and sugar metabolism (DIN10) after 6 hr of light (L) and extended night (E) as determined by RT-qPCR. Bars represent the means ± SD of three biological replicates. p-values from T-tests between mutants and wt < 0.05, < 0.01, and < 0.001 are indicated by *, ** and ***, respectively.
Figure 5—figure supplement 3
Expression of bZIPs in the akin10 line.
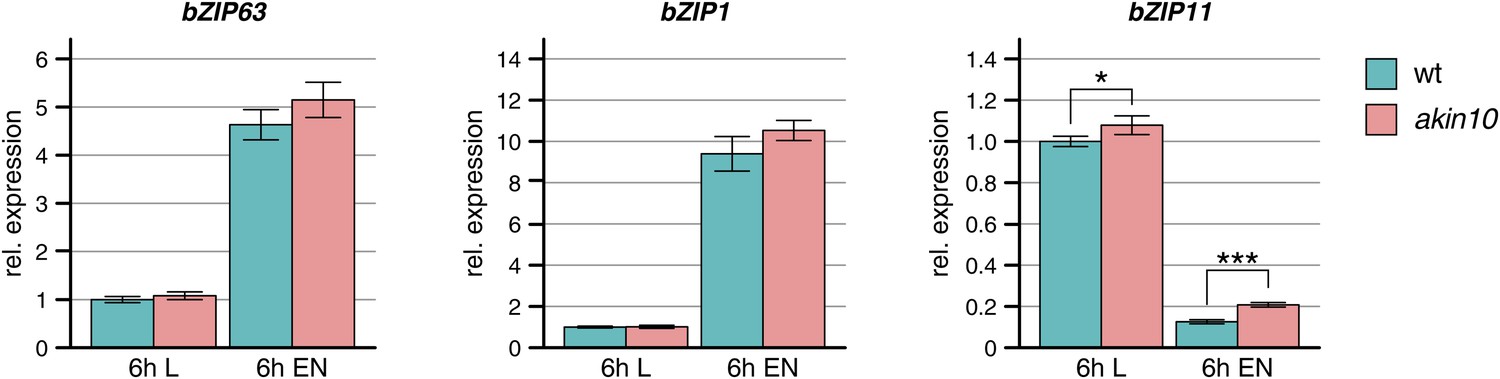
Expression of bZIP63, bZIP1, and bZIP11 in rosette leaves of 5 week-old wt and akin10 plants after 6 hr of light (L) and extended night (EN) as determined by RT-qPCR. Bars represent the means ± SD of four biological replicates and are normalized to wt in L. P-values from T-tests between mutants and wt < 0.05, < 0.01, and < 0.001 are indicated by *, ** and ***, respectively.
Figure 5—figure supplement 4
SnAK2 increases the kinase activity of AKIN10 and AKIN11 but does not phosphorylate bZIP63.
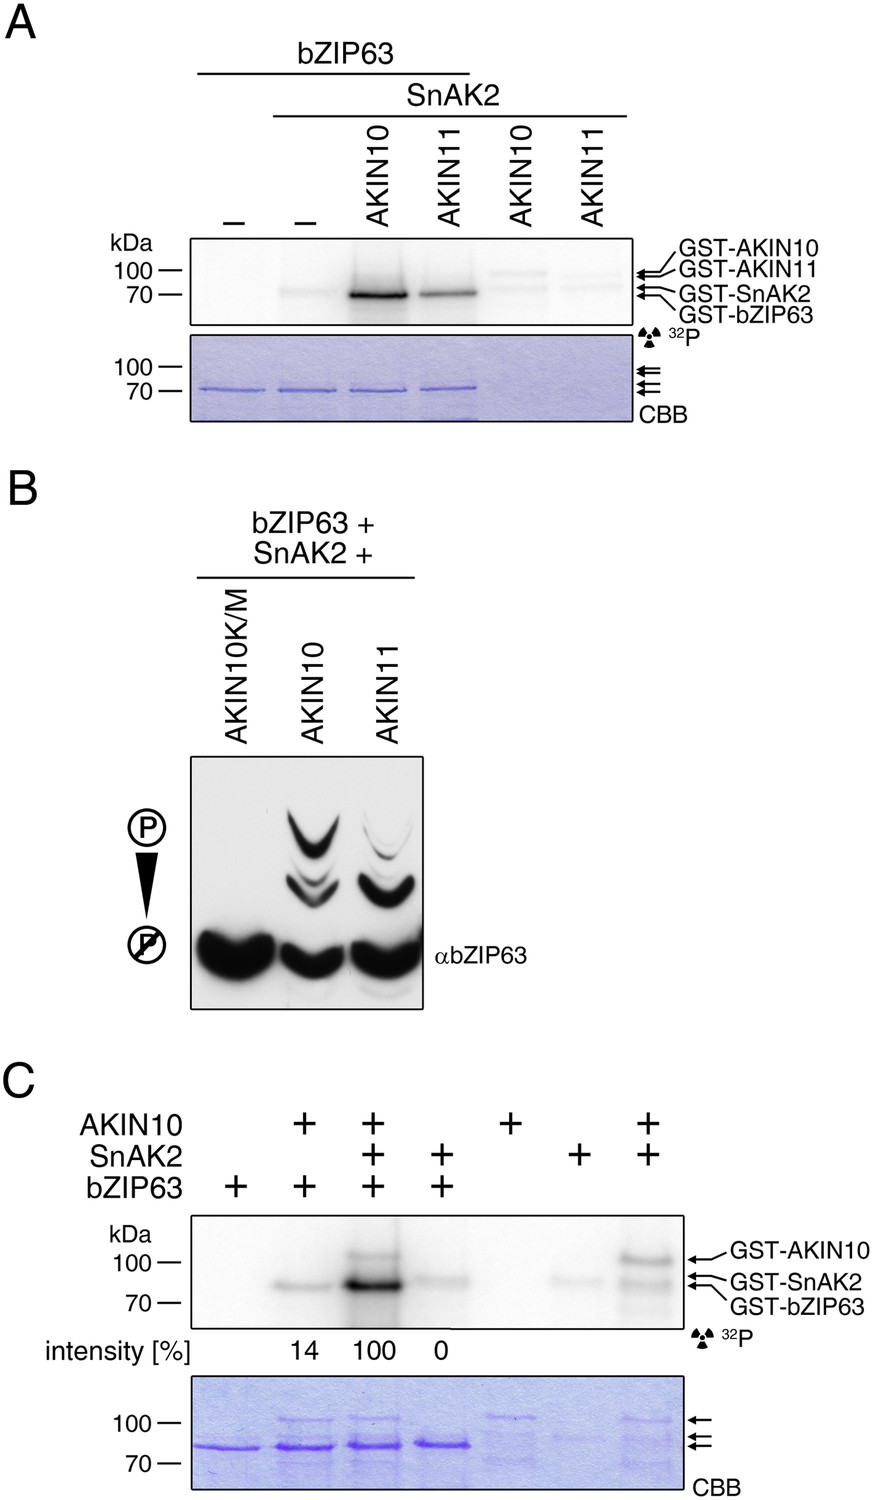
(A) In vitro kinase assay with recombinant AKIN10 or AKIN11 and bZIP63 as a substrate in the presence of SnAK2. (B) Phos-tag gel western blot of an in vitro kinase assay with inactive AKIN10 (AKIN10 K/M), active AKIN10, or AKIN11 and bZIP63 as a substrate in the presence of SnAK2. An antibody recognizing the C-terminus of bZIP63 (αbZIP63) was used (see Figure 6—figure supplement 1). (C) In vitro kinase assay with AKIN10 and/or SnAK2 and bZIP63 as a substrate showing the activity of AKIN10 in the presence or absence of SnAK2. The signal intensity from the bZIP63 phosphorylation is given in % of the strongest signal. CBB, Coomassie brilliant blue.
Figure 5—figure supplement 5
AKINβ1 and AKINβ2 do not interact with bZIP63.
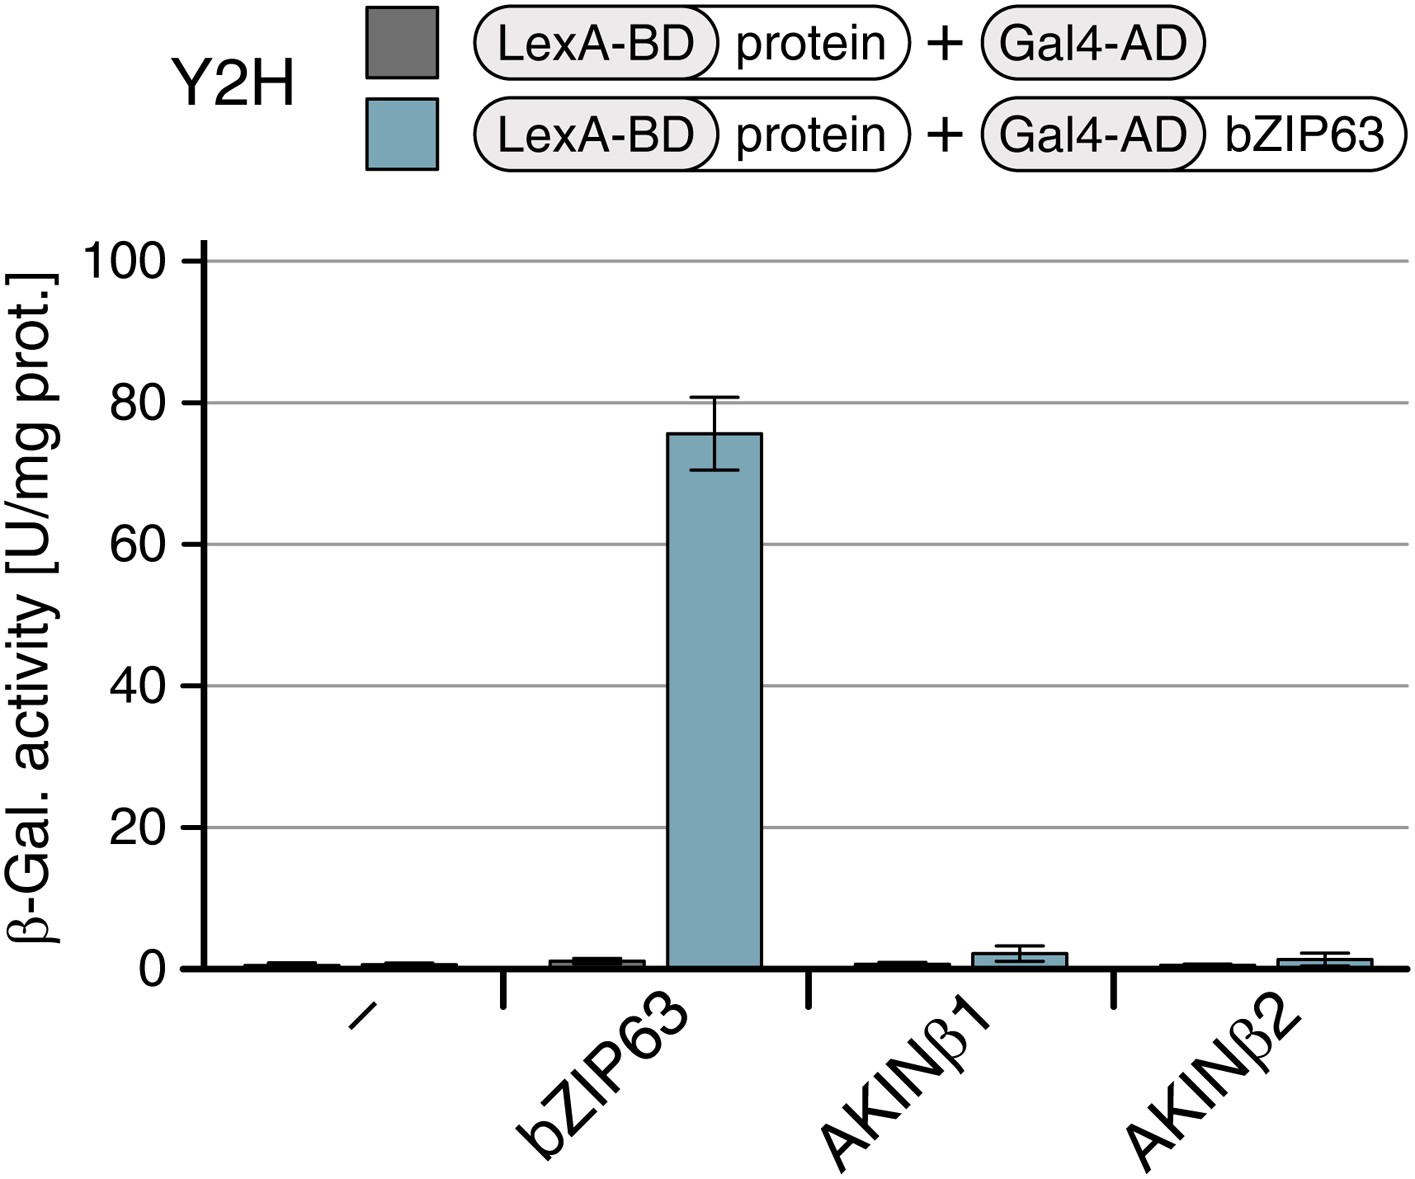
Yeast two-hybrid (Y2H) assay showing of AKINβ1 and AKINβ2 with bZIP63. Homo-dimerization of bZIP63 was used as a positive control. Auto-activation of BD-fusion proteins is shown in grey, interaction with bZIP63 in blue. Bars represent means ± SD of eight biological replicates.
Figure 5—figure supplement 6
Altered sugar-dependent in vivo phosphorylation of bZIP63 in seedlings.
Phos-tag gel western (αGFP) blots showing the in vivo phosphorylation state of bZIP63 in plants overexpressing bZIP63-GFP/YFP in the wt or akin10 background. Proteins were extracted from seedling cultures after 6 hr extended night in the presence (+) or absence (−) of 1% sucrose. Recombinant bZIP63-YFP was used as a nonphosphorylated control. Numbered arrowheads on the right mark the position of each observed bZIP63 band for easy reference with other figures (see Figure 3—figure supplement 1 for a comparative image of all Phos-tag western blots). 8 indicates the hyper-phosphorylated form of bZIP63. CBB, Coomassie brilliant blue.
Figure 5—figure supplement 7
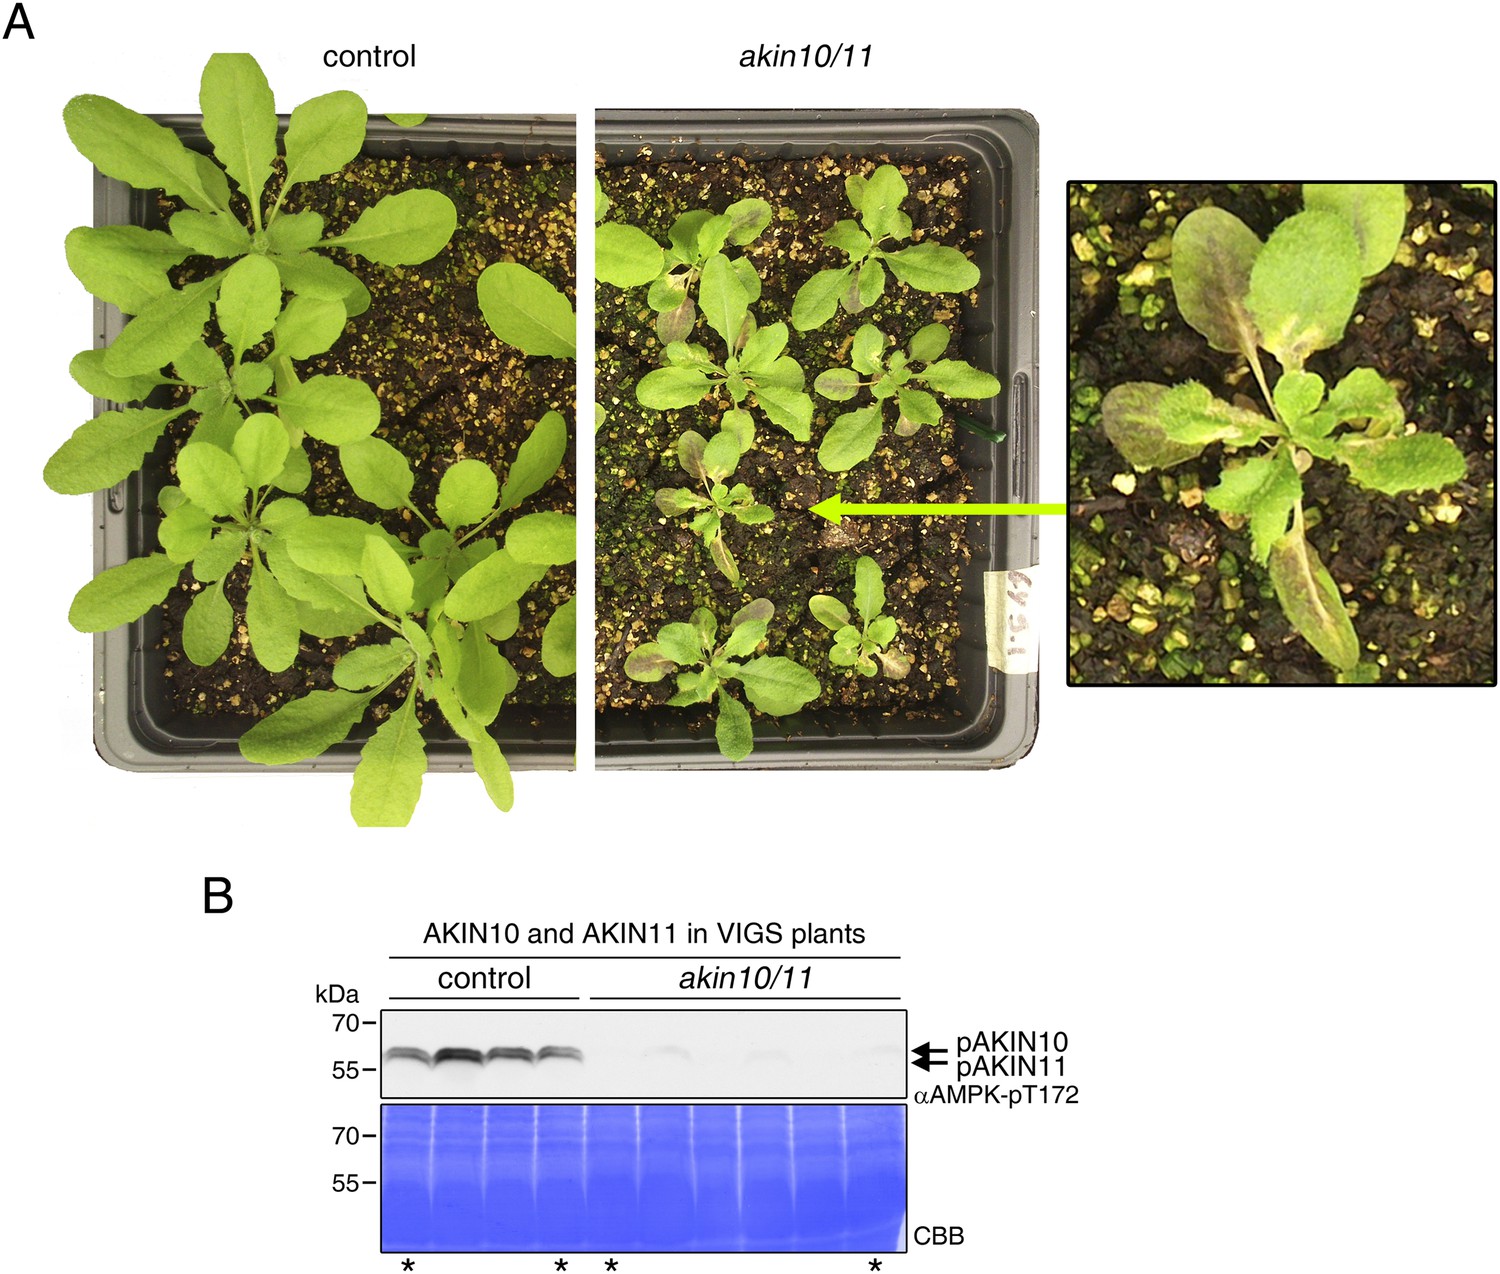
AKIN10/AKIN11 VIGS plants.
AKIN10 and AKIN11 were knocked down in plants expressing a genomic fragment of bZIP63 with a c-terminal YFP tag (GY9 line) using VIGS. 2 week-old plants were infiltrated with the VIGS construct (akin10/11, right) or not (control, left) and 2 weeks later plants showed a clear phenotype and a strong reduction in AKIN10 and AKIN11 protein amount. (A) Pictures of representative plants showing stunted growth of akin10/11 plants, as well as increased anthocyanin accumulation, leaf wilting and early senescence. (B) Western blot of control and akin10/11 leaf extracts with an antibody against the phosphorylated T-loop of AMPK (αAMPK-pT172), recognizing both AKIN10 and AKIN11. Samples marked with an asterisk were used for the Phos-tag gels shown in Figure 5E. CBB, Coomassie brilliant blue.
Figure 6 with 4 supplements
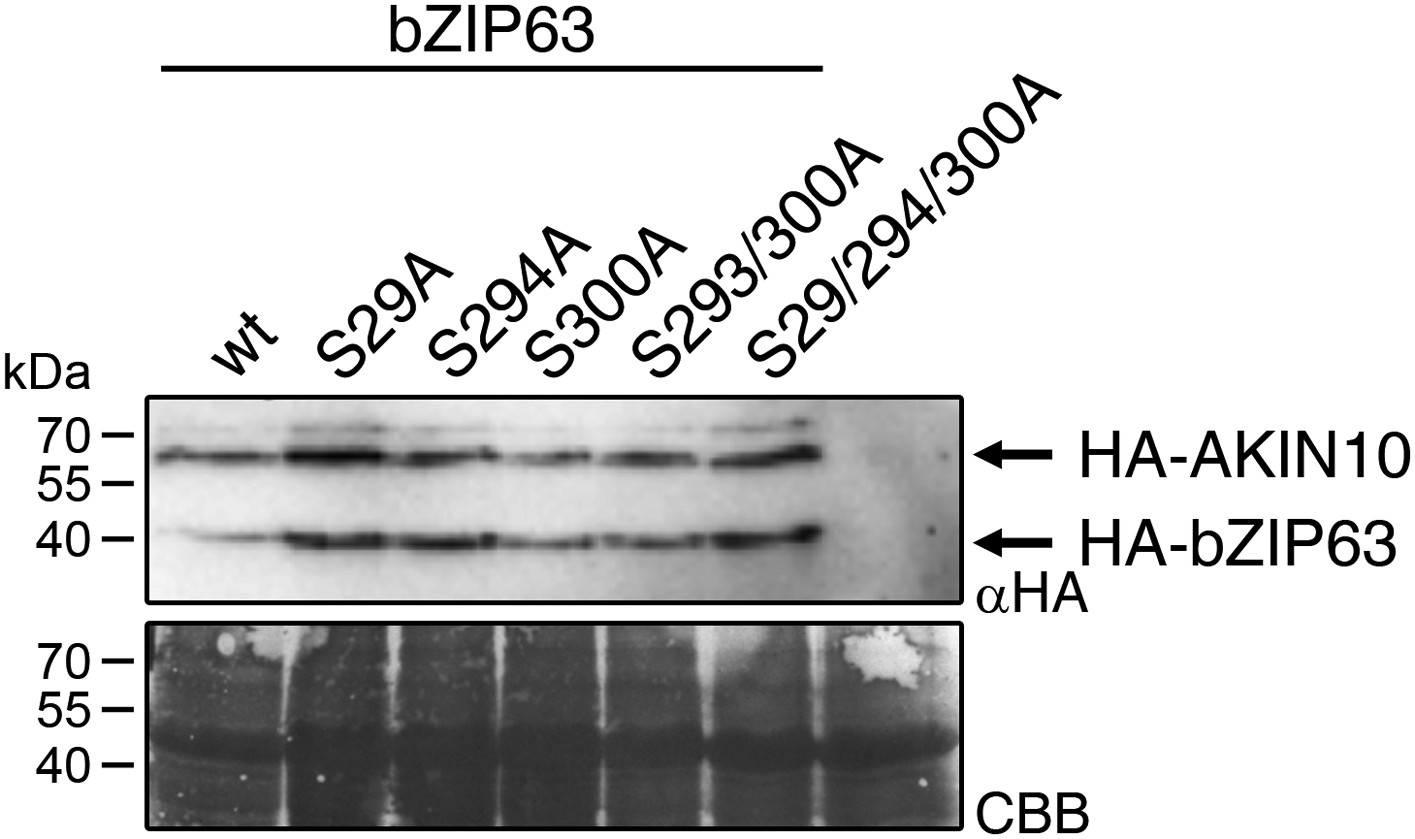
AKIN10 targets three highly conserved and functionally important serine residues in bZIP63.
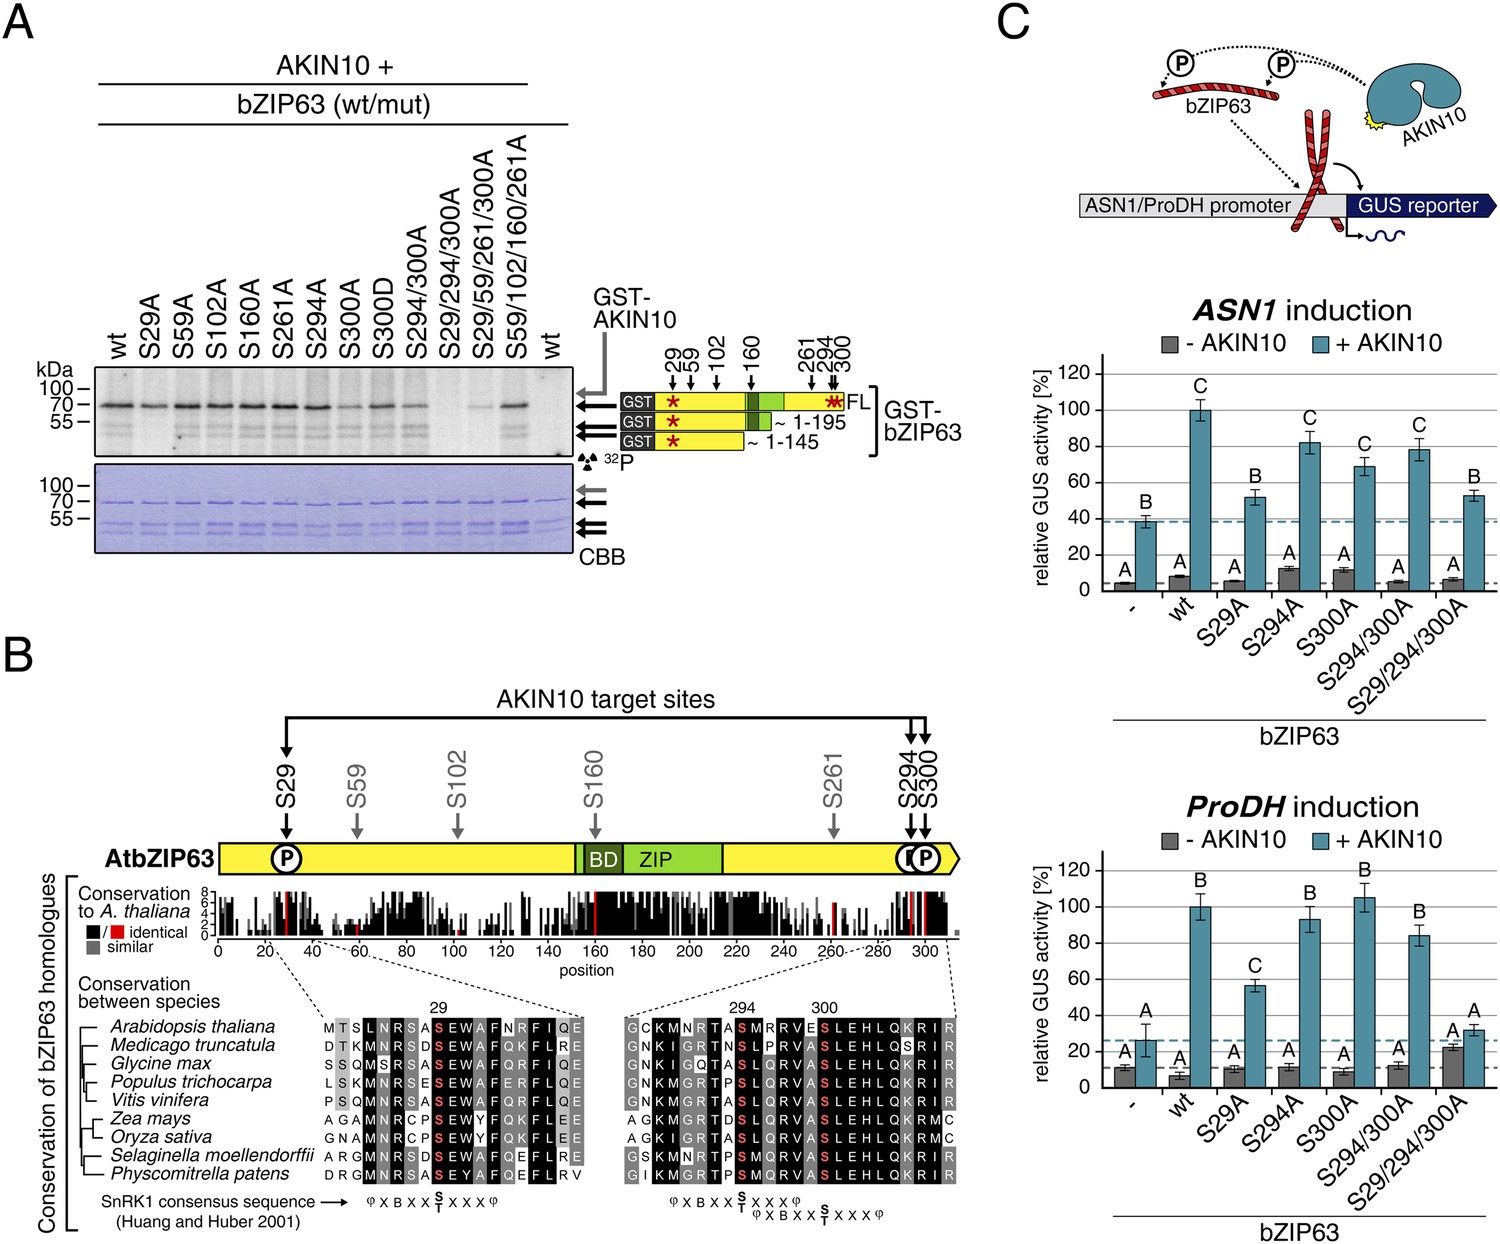
(A) In vitro kinase assay of wt and S/A mutants of GST-tagged bZIP63 with AKIN10. Positions of full length (FL) and N-terminal fragments of bZIP63 are marked by black arrows. The scheme on the right shows the position of the in vivo phosphorylation sites and the in vitro target sites of AKIN10 (red asterisk) on bZIP63. See Figure 6—figure supplements 1, 2 for controls and Phos-tag gel of kinase assays, respectively. (B) Conservation of phosphorylation sites in bZIP63. Sequences of bZIP63 homologues from eight species were aligned with ClustalΩ. The scheme on top indicates the positions of the in vivo phosphorylation and AKIN10 target sites on bZIP63. The histogram below shows the sequence identity (red/black) and similarity (grey) to A. thaliana bZIP63. Red bars represent the in vivo phosphorylation sites. Below, the alignment of the sequence surrounding the AKIN10 target sites and the SnRK1 consensus motif (Huang and Huber, 2001) are shown. The grey/black shading indicates the degree of conservation, phosphorylation sites are in red. For alignment of non-AKIN10 target sites and full sequence alignment see Figure 6—figure supplement 3, for sequences in fasta format see Figure 6—source data 1. (C) Promoter activation assays in protoplasts with an ASN1/ProDH promoter-driven GUS reporter. Activation by bZIP63 wt and S/A mutants without (grey) or with (blue) co-transformation of AKIN10 is shown. Bars are means ± SD of 4 biological replicates, given in % of the activity of wt bZIP63 with AKIN10. Horizontal dashed lines indicate the signal in the control without bZIP63. Letters indicate significant differences as determined by ANOVA and pairwise T-testing (p < 0.05). See Figure 6—figure supplement 4 for a western blot control. CBB, Coomassie brilliant blue.
-
Figure 6—source data 1
Sequences of the bZIP63 homologues.
Text file containing the sequences of the bZIP63 homologes used for ClustalΩ alignment in Figure 5B and Figure 5—figure supplement 3 in fasta format.
- https://doi.org/10.7554/eLife.05828.028
Figure 6—figure supplement 1

AKIN10 phosphorylates bZIP63 but not GST.
(A) In vitro kinase assay with recombinant AKIN10 and GST-tagged bZIP63 or GST as a substrate. Positions of full length (FL) and N-terminal fragments of bZIP63 are marked by black arrows. The scheme on the right shows the position of the in vivo phosphorylation sites and the in vitro target sites of AKIN10 (red asterisk) in GST-bZIP63, as well as the approximate length of the N-terminal fragments. (B) Western blot (αbZIP63-N and -C) of GST-tagged bZIP63, used as substrate for the kinase assays. The scheme on the right indicates the binding sites of the two antibodies on bZIP63 and the approximate length of the detected fragments. CBB, Coomassie brilliant blue.
Figure 6—figure supplement 2
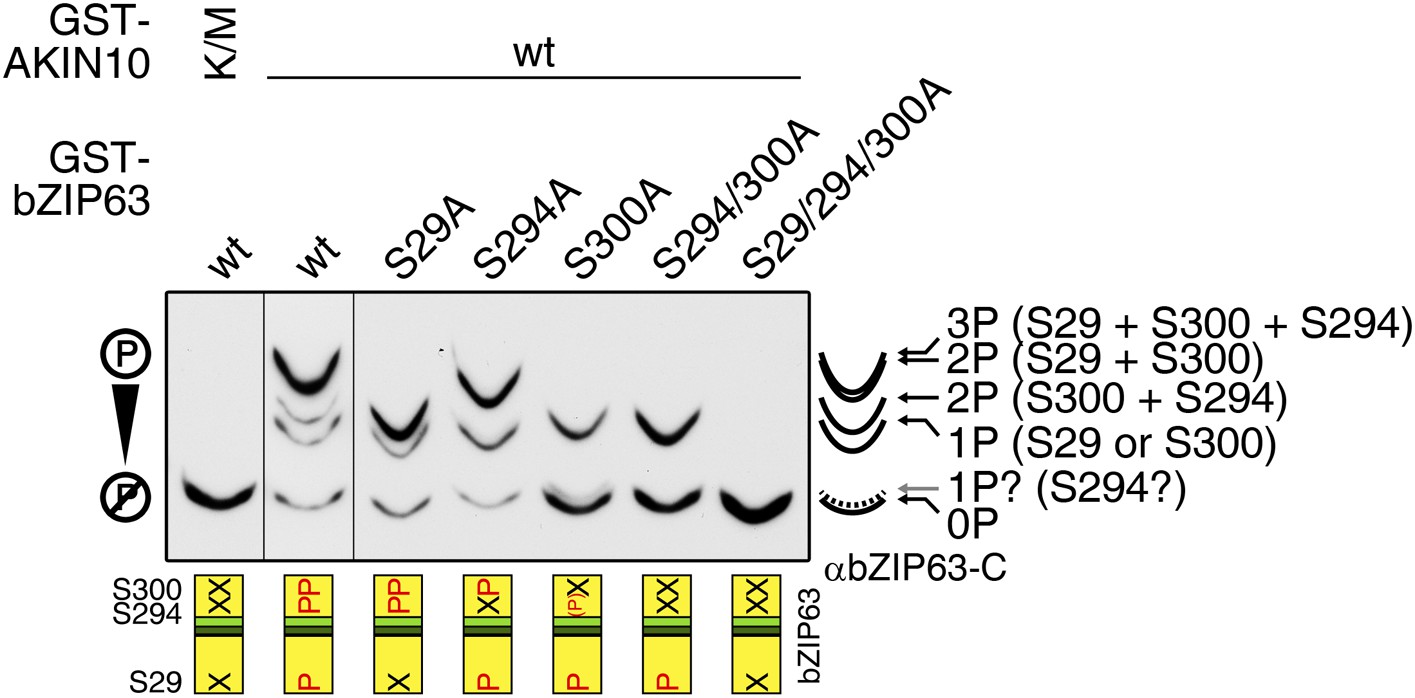
AKIN10 phosphorylates S29, S294, and S300 on bZIP63.
Phos-tag gel western blot (αbZIP63-C) of an in vitro kinase assay with active (wt) and inactive (K/M) AKIN10 and wt and S/A mutants of GST-tagged bZIP63 as substrate. The scheme on the bottom shows which of the three AKIN10 target sites can be phosphorylated (P) or are mutated (X). The scheme on the right indicates the likely phosphorylated sites for each band.
Figure 6—figure supplement 3
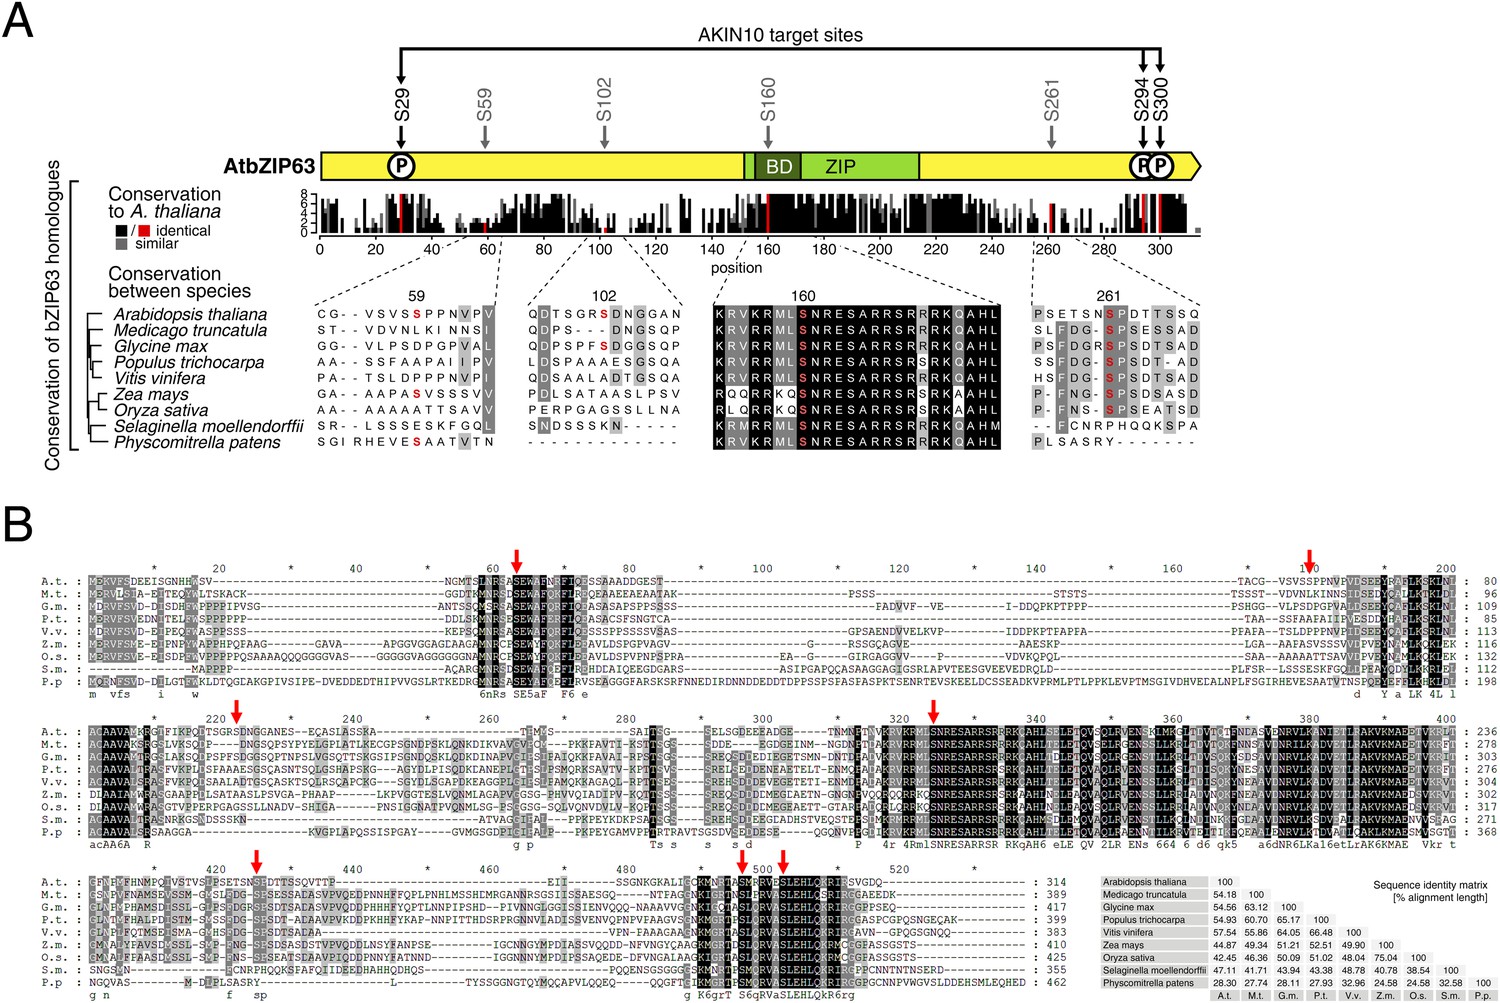
The AKIN10 target sites and S160 in the bZIP domain are highly conserved.
(A) and (B) Sequence conservation of bZIP63. Sequences of bZIP63 homologues from eight species were aligned with ClustalΩ. (A) Conservation of non-AKIN10 target sites. The scheme on top indicates the positions of the in vivo phosphorylation and AKIN10 target sites on bZIP63. The histogram below shows the sequence identity (red/black) and similarity (grey) to A. thaliana bZIP63 in each position. Red bars represent the in vivo phosphorylation sites. Below, an alignment of the sequences surrounding the phosphorylation sites not targeted by AKIN10 is depicted. The grey/black shading indicates the degree of conservation, phosphorylation sites are in red. (B) Full sequence alignment. Species names are abbreviated. The grey/black shading indicates the degree of conservation. Red arrows indicate the positions of the in vivo phosphorylation sites. Numbers on top indicate the position in the alignment, numbers on the right indicate the position in each sequence. A consensus sequence is given below the alignment. The sequence identity matrix is at the bottom right.
Figure 6—figure supplement 4
Expression of bZIP63 and AKIN10 in the promoter activation assays.
Exemplary western blot (αHA) of protoplasts co-transformed with AKIN10 and wt or S/A mutants of bZIP63. CBB, Coomassie brilliant blue.
Figure 7 with 2 supplements
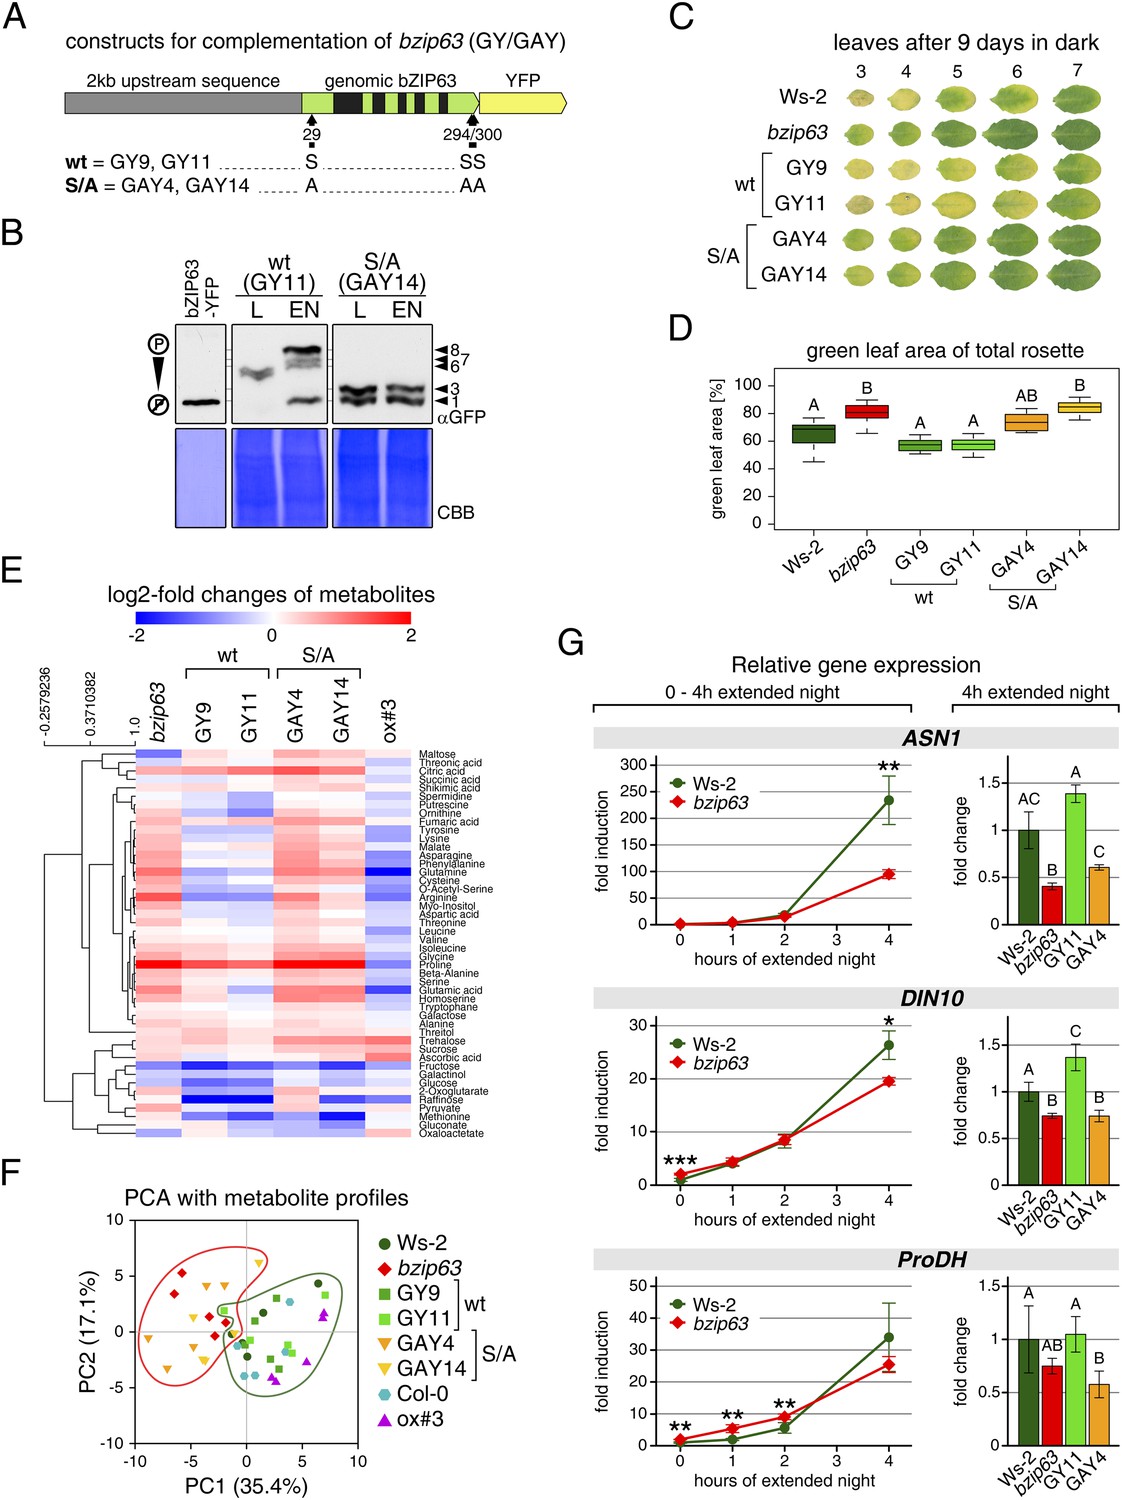
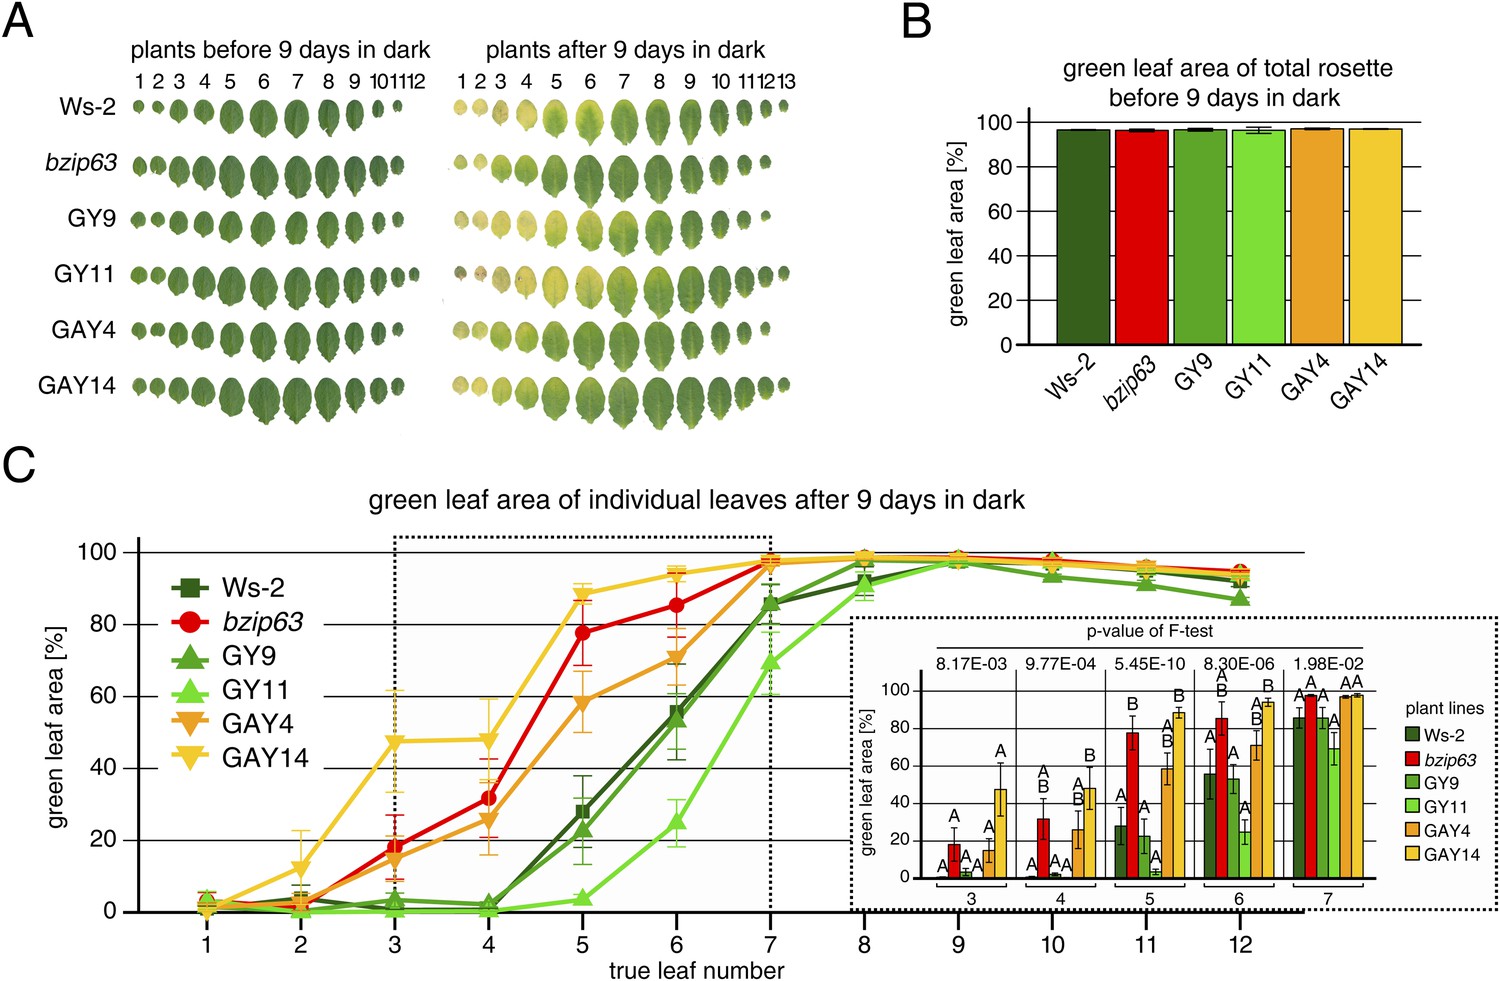
The bzip63 phenotype can be complemented by wt bZIP63, but not by bZIP63 harboring S/A mutations of the AKIN10 target sites.
(A) Genomic complementation constructs. Exons are green, introns black. See Figure 7—figure supplement 1 for characterization of the complementation lines. (B) Phos-tag gel western blots (αGFP) showing the in vivo phosphorylation state of bZIP63 in the complementation lines after 6 hr light (L) or extended night (EN) in 5 week-old soil-grown plants. Recombinant bZIP63-YFP was used as a nonphosphorylated control. Numbered arrowheads on the right mark the position of each observed bZIP63 band for easy reference with other figures (see Figure 3—figure supplement 1 for a comparative image of all Phos-tag western blots). (C) and (D) Dark-induced senescence phenotype of 4.5 week-old soil-grown plants after 9 days in darkness. (C) Leaves 3–7 of one representative plant per line. (D) Box-and-whiskers plot of the total green leaf area of eight biological replicates. Letters indicate significant differences as determined by ANOVA and pairwise T-testing (p < 0.05). See Figure 7—figure supplement 2 for untreated plants and green leaf area of individual leaves. (E) and (F) Metabolite profile. (E) Hierarchical clustering of log-2 fold changes of metabolite concentrations compared to wt. Values are means of five biological replicates. (F) Principal component analysis (PCA). PC1 is plotted against PC2. The proportion of variance in % is indicated. The red line surrounds bzip63 and GAY samples, the green line wt, GY, and ox#3 samples. For relative metabolite concentrations and PCA loadings see Figure 7—source data 1. (G) Relative expression of potential bZIP63 target genes in 5 week-old plants during early extended night as determined by RT-qPCR. Values are means ± SD of four biological replicates and are given as fold change compared to Ws-2 at 0 hr (left) or 4 hr (right). p-values from T-tests between mutants and wt < 0.05, < 0.01, and < 0.001 are indicated by *, ** and ***, respectively. Letters indicate significant differences as determined by ANOVA and pairwise T-testing (p < 0.05). CBB, Coomassie brilliant blue.
-
Figure 7—source data 1
Excel table containing the relative metabolite levels of the complementation lines and the PCA loadings.
The tab ‘metabolites normalized to wt’ contains the relative metabolite levels, which were used to calculate the fold changes shown in Figure 7E, as well as p-values from statistical tests. Values are the mean ± SD of five biological replicates given as fold change to the corresponding wt. The tab ‘PCA—variance and loadings’ contains the SD, proportion of variance, and loadings of all principal components from the PCA analysis shown in Figure 7F.
- https://doi.org/10.7554/eLife.05828.034
Figure 7—figure supplement 1
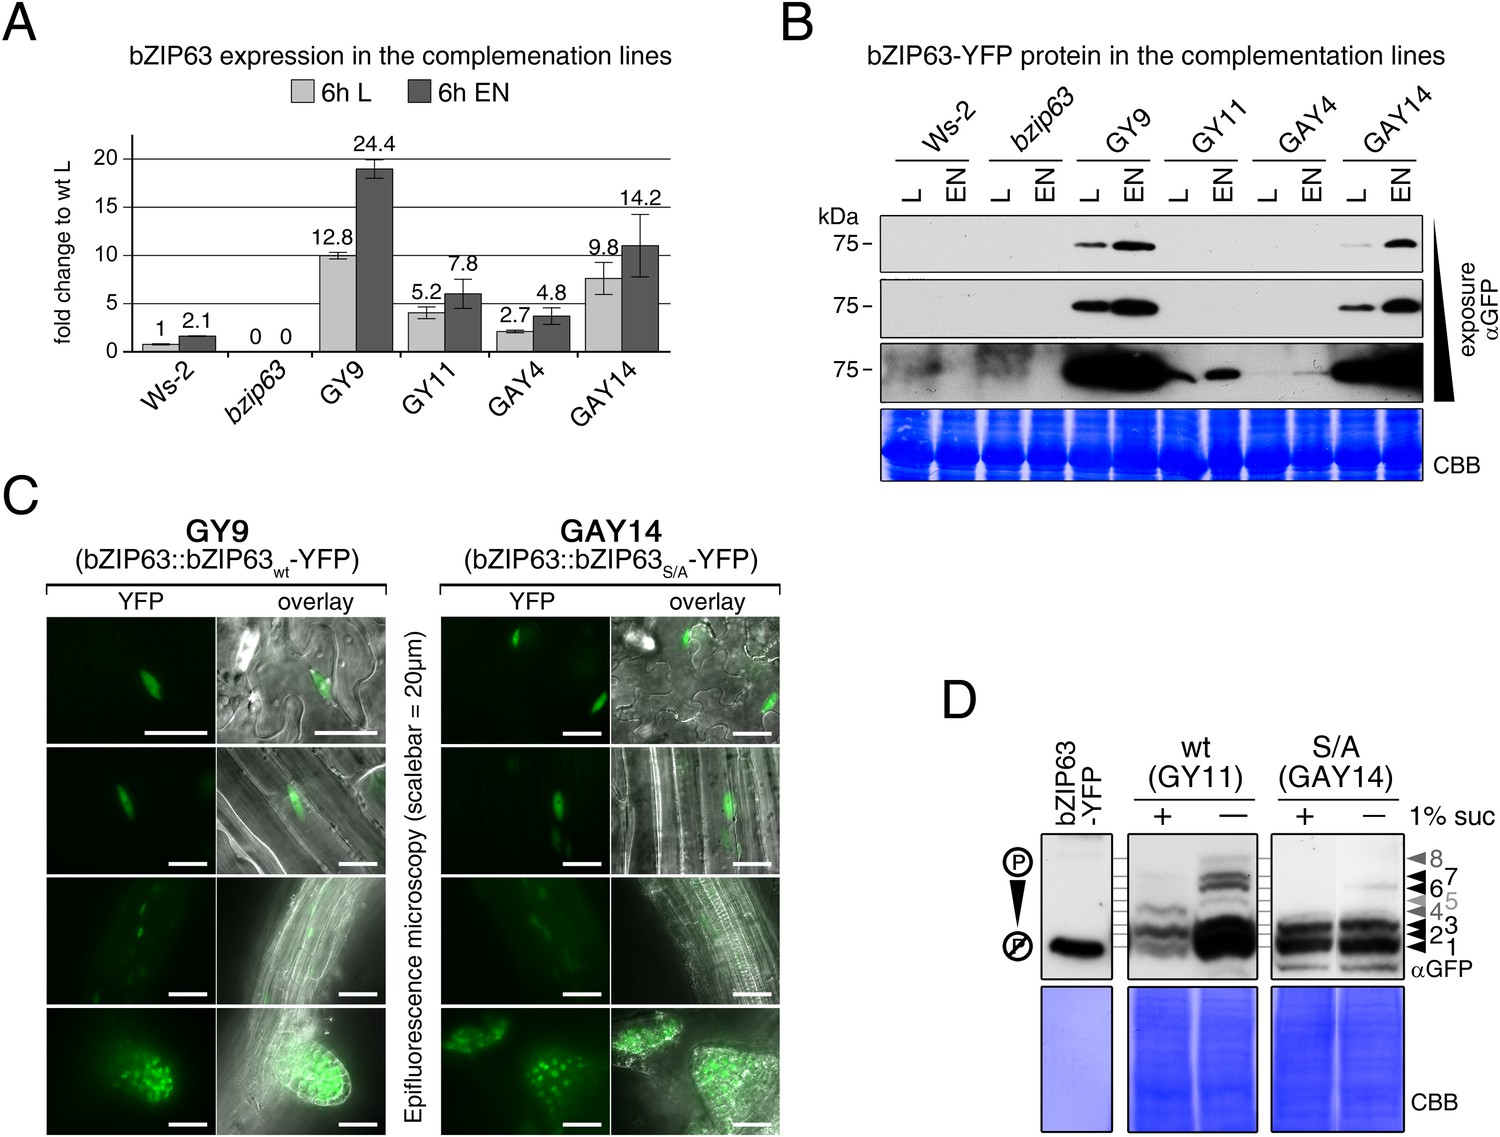
Characterization of the bzip63 complementation lines.
(A) and (B) Expression of bZIP63 in different plant lines. (A) RT-qPCR of bZIP63 in 5 week-old plants after 6 hr of light (L) or extended night (EN). Bars represent means ± SD of five biological replicates and are given as fold change to Ws-2 in L. The 6 hr L samples were also used for the metabolic profiling shown in Figure 7E,F and Figure 7—source data 1. (B) Western blot (αGFP) detecting YFP-tagged bZIP63 in transgenic plant lines after 6 hr of L and EN. (C) Epifluorescence microscopy images of soil-grown seedlings of the GY9 and GAY14 lines showing expression of bZIP63-YFP. From top to bottom: leaf epidermis, leaf veins, roots, lateral root tips. Scale bar is 20 µm. (D) Phos-tag gel western blots (αGFP) showing the in vivo phosphorylation state of bZIP63 in the complementation lines. Proteins were extracted from seedling cultures after 6 hr extended night in the presence (+) or absence (−) of 1% sucrose. Recombinant bZIP63-YFP was used as a nonphosphorylated control. Numbered arrowheads on the right mark the position of each observed bZIP63 band for easy reference with other figures (see Figure 3—figure supplement 1 for a comparative image of all Phos-tag western blots). CBB, Coomassie brilliant blue.
Figure 7—figure supplement 2
Complementation of the dark-induced senescence phenotype of bzip63.
(A) Representative leaf series of 4.5 week-old plants before and after 9 days in darkness. (B) Barplot of the total green leaf area of the rosette before darkness. Values are the mean ± SD of four biological replicates. (C) Dotplot of the green leaf area of individual leaves after 9 days in darkness. Values are the mean ± SD of eight biological replicates. The insertion at the right side shows the values from leaves 3–7 as a barplot (framed by dotted line). Letters indicate significant differences as determined by ANOVA and pairwise T-testing (p < 0.05). The p-values of the F-test for each leaf are given.
Figure 8 with 2 supplements
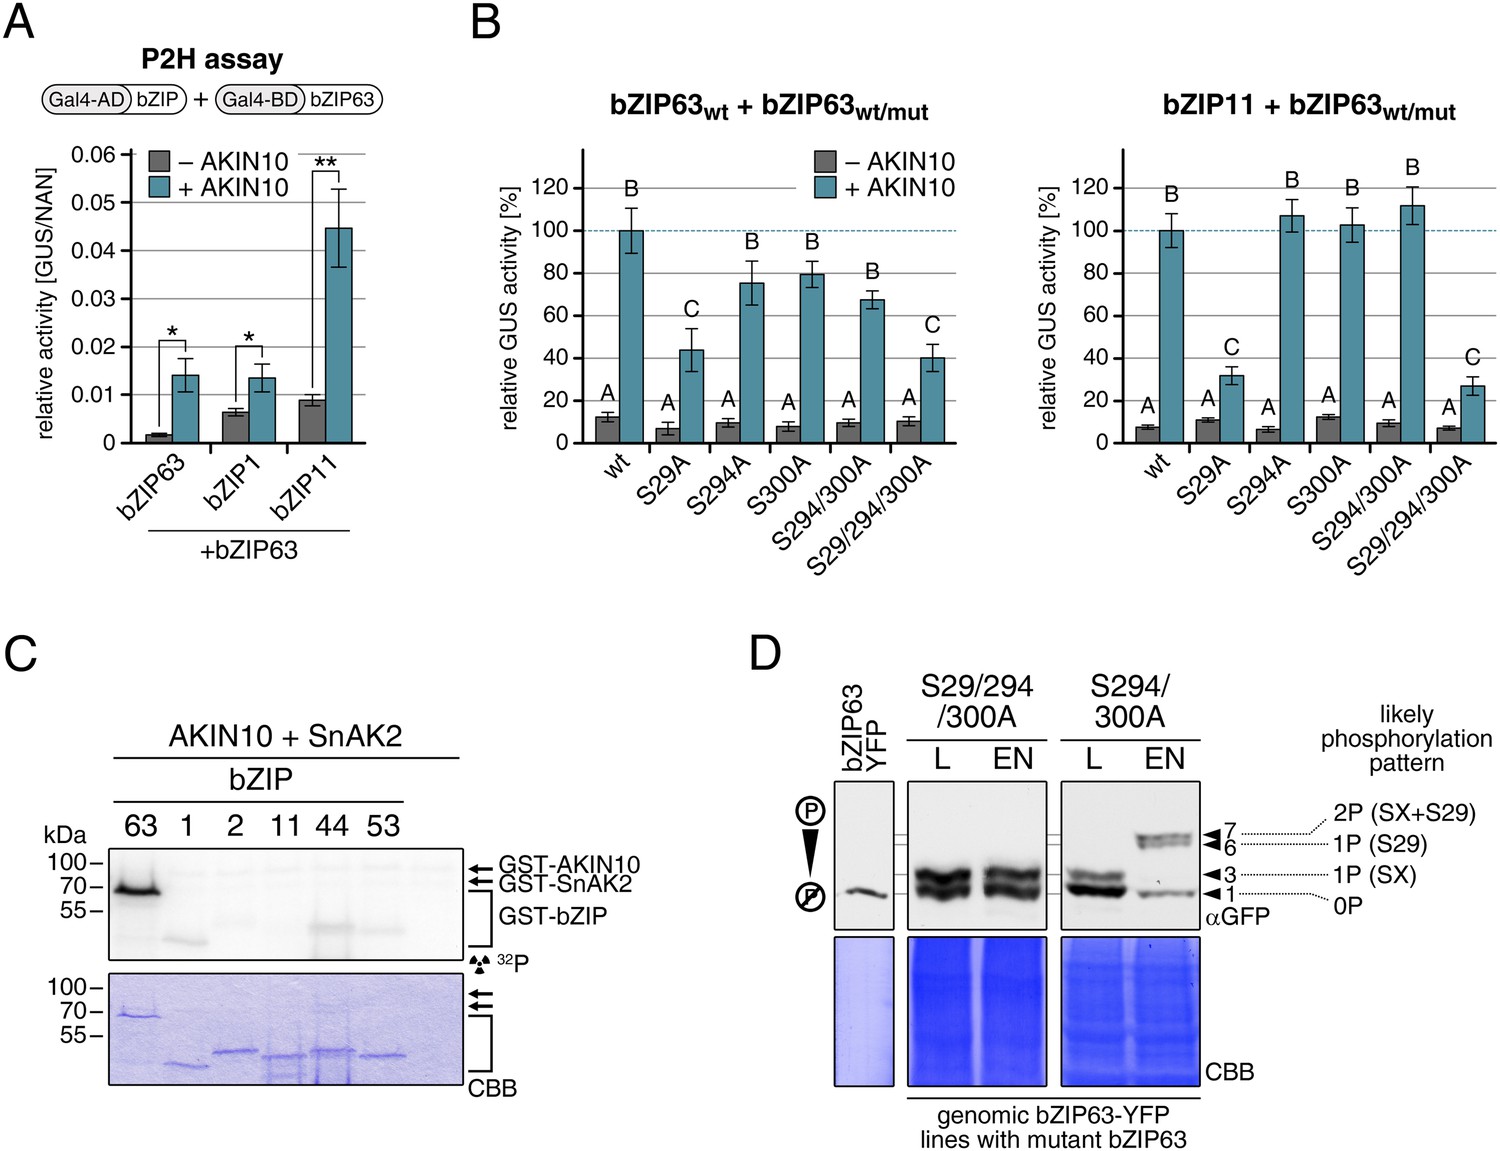
AKIN10-mediated phosphorylation of bZIP63 promotes its dimerization.
(A) and (B) Protoplast two-hybrid (P2H) assays. (A) Interaction of bZIP63 fused to the Gal4-AD (activation domain) with bZIP63, bZIP1, and bZIP11 fused to the Gal4-BD (binding domain) without and with co-transformation of AKIN10. Bars represent the mean normalized GUS activity ± SD of 3–4 biological replicates. p-values from T-tests < 0.05 and < 0.01 are indicated by * and **, respectively. (B) Interaction of AD-bZIP63 (left) or AD-bZIP11 (right) with wt and S/A mutants of BD-bZIP63 without and with co-transformation of AKIN10. Values are given in % of the signal with wt bZIP63 and AKIN10. Letters indicate significant differences as determined by ANOVA and pairwise T-testing (p < 0.05). For western blots for (A) and (B) see Figure 8—figure supplement 1. (C) In vitro kinase assay of bZIP63, 1, 2, 11, 44, and 53 with AKIN10 and the SnRK1 upstream kinase SnAK2. For a kinase assay with the bZIPs and SnAK2 alone see Figure 8—figure supplement 2. (D). Phos-tag gel western blots (αGFP) showing the in vivo phosphorylation state of S29 in bZIP63 after 6 hr light (L) or extended night (EN). 5 week-old soil-grown plants of two genomic bzip63 complementation lines harboring different S/A mutations were used. In line GAY14 (left) none of the AKIN10 target sites (S29/294/300) can be phosphorylated, while in the S294/300A (right) line S29 can still be phosphorylated. Numbered arrowheads on the right mark the position of each observed bZIP63 band for easy reference with other figures (see Figure 3—figure supplement 1 for a comparative image of all Phos-tag western blots). The likely phosphorylation state of the bands in the western blot is shown on the right. X stands for one of the non-mutated serines (59, 102, 160, or 261). CBB, Coomassie brilliant blue.
Figure 8—figure supplement 1

Western blots and controls for the protoplast two-hybrid (P2H) assays.
(A) Western blot showing the expression of AD (activation domain)-bZIPs and AKIN10 (αHA) and BD (DNA binding domain)-bZIP63 (αBD) in the P2H assay in Figure 8A. (B) Exemplary western blot showing the expression of BD-bZIP63 in the P2H assays in Figure 8B. CBB, Coomassie brilliant blue.
Figure 8—figure supplement 2
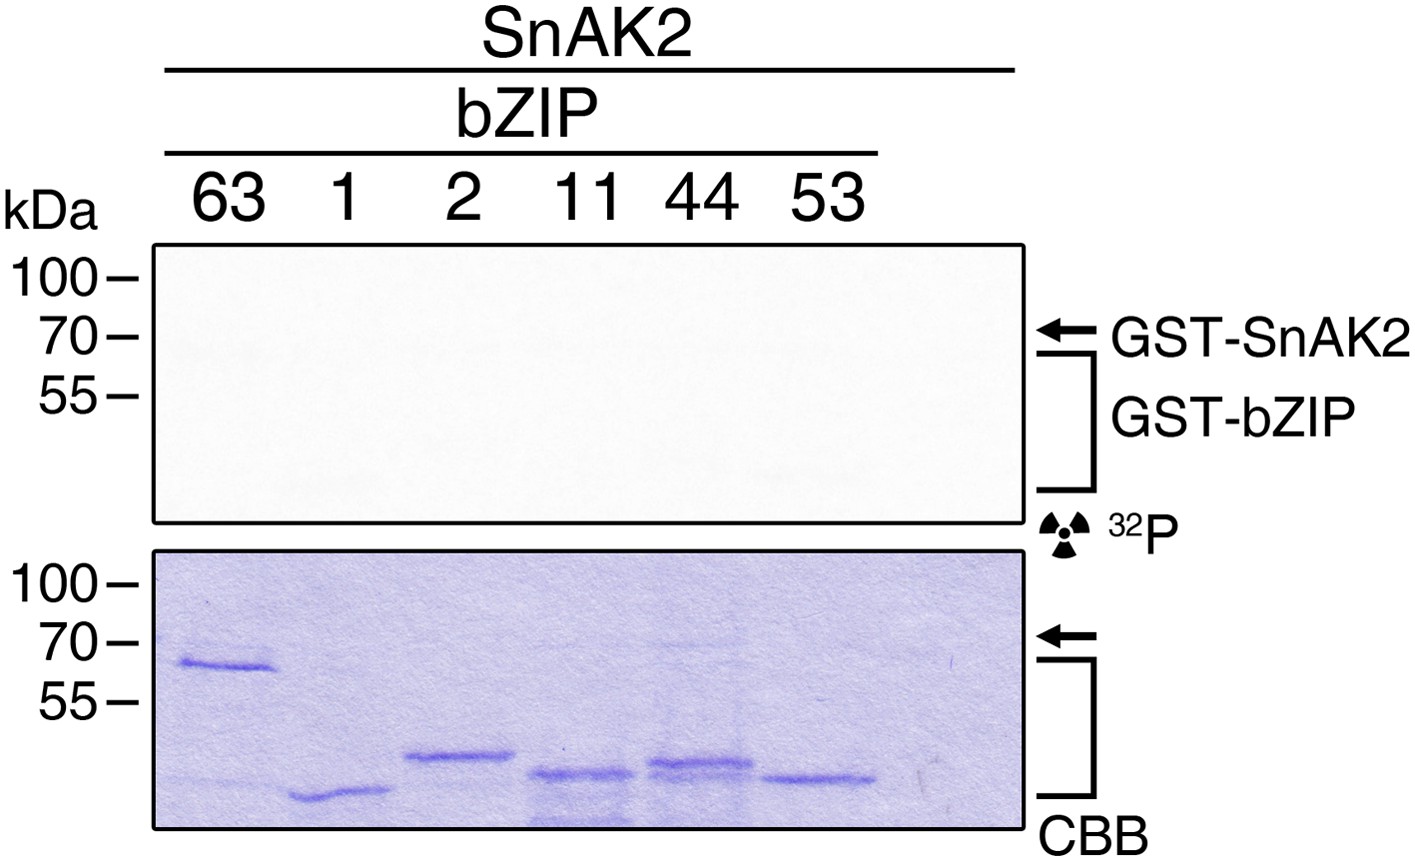
SnAK2 does not phosphorylate bZIP63 or the S1 class bZIPs.
In vitro kinase assay of bZIP63, 1, 2, 11, 44, and 53 with SnAK2. CBB, Coomassie brilliant blue.
Figure 9

Phosphorylation of bZIP63 shifts its dimerization preferences.
(A) Multi-color bimolecular fluorescence complementation (BiFC) in transiently transformed N. tabacum leaves to test the effect of bZIP63 phosphorylation on its dimerization preference. A cassette containing bZIP63 (wt or S29/294/300A), bZIP11, and bZIP1—tagged with the C-terminal moiety of CFP and the N-terminal moieties of CFP and VENUS, respectively—was co-transformed with mCherry-tagged AKIN10. CFP (bZIP63-11) and VENUS (bZIP63-1) fluorescence was detected on a confocal laser scanning microscope and quantified for nuclei showing co-expression of AKIN10. Top: scheme of the multi-color BiFC construct and principle. Bottom center: representative microscopy pictures. Size bar = 50 µm. Bottom right: box-and-whiskers plot of the VENUS/CFP ratio of 115–118 nuclei, normalized to the median of the S29/294/300A bZIP63 construct. T-test p-value was < 0.001, as indicated by ***. (B) Model of the regulation of bZIP63 dimerization and activity by AKIN10. Energy deprivation triggers activation of AKIN10, which phosphorylates S29 on bZIP63. This leads to increased formation of specific bZIP63 dimers and altered expression of dimer-specific genes.
Author response image 1
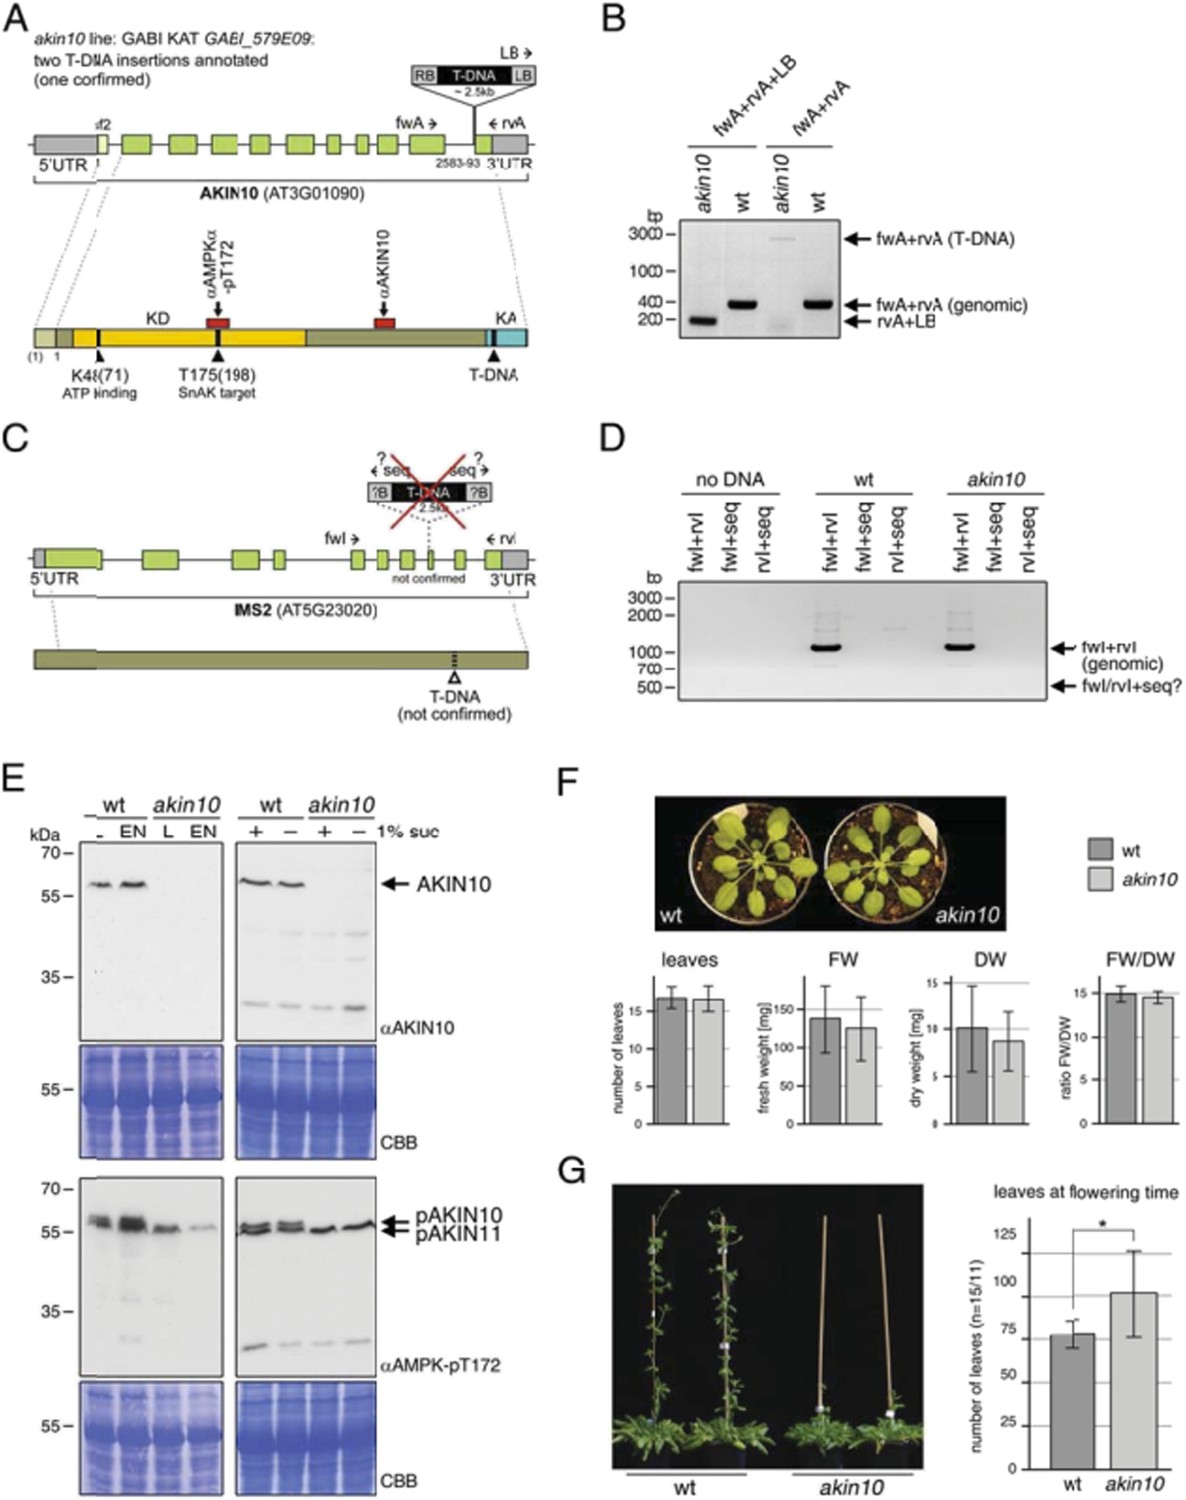
Characterization of the akin10 mutant line GABI_579E09.
(A‐D) Mapping of the T‐DNA insertion site. (A) The top scheme represents the genomic locus of AKIN10 (AT3G01090). UTRs are grey, exons are green boxes. The first exon, which is only present in splicing form 2 (sf2), is shown in light green. By sequencing of the flanking regions the T‐DNA insertion was mapped to position 2583‐2593 (11pb deletion), just before the last exon. Primers used for the genotyping PCR shown in (B) are indicated. The scheme below represents the AKIN10 protein with the kinase domain (KD) in yellow and the kinase associated (KA) domain in blue. The position of K48 (ATP binding; mutated to M in the inactive version) and T175 (target for SnAK2 in the T‐loop), as well as the approximate binding sites of the antibodies against AKIN10 (Agrisera; AS 10919) and AMPKα‐pT172 (Cell Signaling; #2531) are indicated. (B) Genotyping PCR with primers binding in the AKIN 10 sequence (fwA and rvA) and the T‐DNA left border (LB). (C) The scheme represents the genomic locus and protein of IMS2 (AT5G23020), a potential second T‐DNA insertion site. Sequencing of the T‐DNA flanking region by GABI KAT (www.gabi.kat.da) produced a sequence with partial homology to IMS2. However, this insertion was not confirmed. The proposed position of the T‐DNA is indicated. (D) Genotyping PCR with primers binding in the IMS2 sequence (fwI and rvI) and the sequencing primer (seq) used by GABI KAT. (E) Western blots against AKIN10 in Col‐0 wt and akin10 plants. Antibodies against AKIN10 (top) and AMPKα‐pT172, which recognizes both AKIN10 and AKIN11 phosphorylated in the T‐loop, (bottom) were used. The position of AKIN10 and phospho‐AKIN10/11 is indicated. Left: 5 week‐old plants grown on soil in a 12h/12h light/dark cycle. Total proteins were extracted from rosettes harvested after 6h of light (L) or extended night (EN). Right: 2 week‐old seedlings in liquid ½ MS medium. Total proteins were extracted from seedlings treated with 6h of extended night in the presence (+) or absence (‐) of 1% sucrose. (F) Comparison of 8 week‐old wt and akin10 plants. The plants were grown under short day conditions (8h/16h light/dark). The number of leaves, fresh weight (FW), dry weight (DW), and the ratio between FW and DW was determined. The bars represent the mean ± SD of 19‐20 replicates. T‐tests did not produce significant differences between wt and mutant. (G) Mild flowering phenotype of akin10. Col‐0 wt and akin10 plants were grown under SD conditions and the number of leaves at bolting time were counted. The bars represent the mean ± SD of 15 and 11 replicates, respectively. The p‐value of an unpaired t‐test with unequal variance was < 0.05 as indicated by *.
Author response image 2
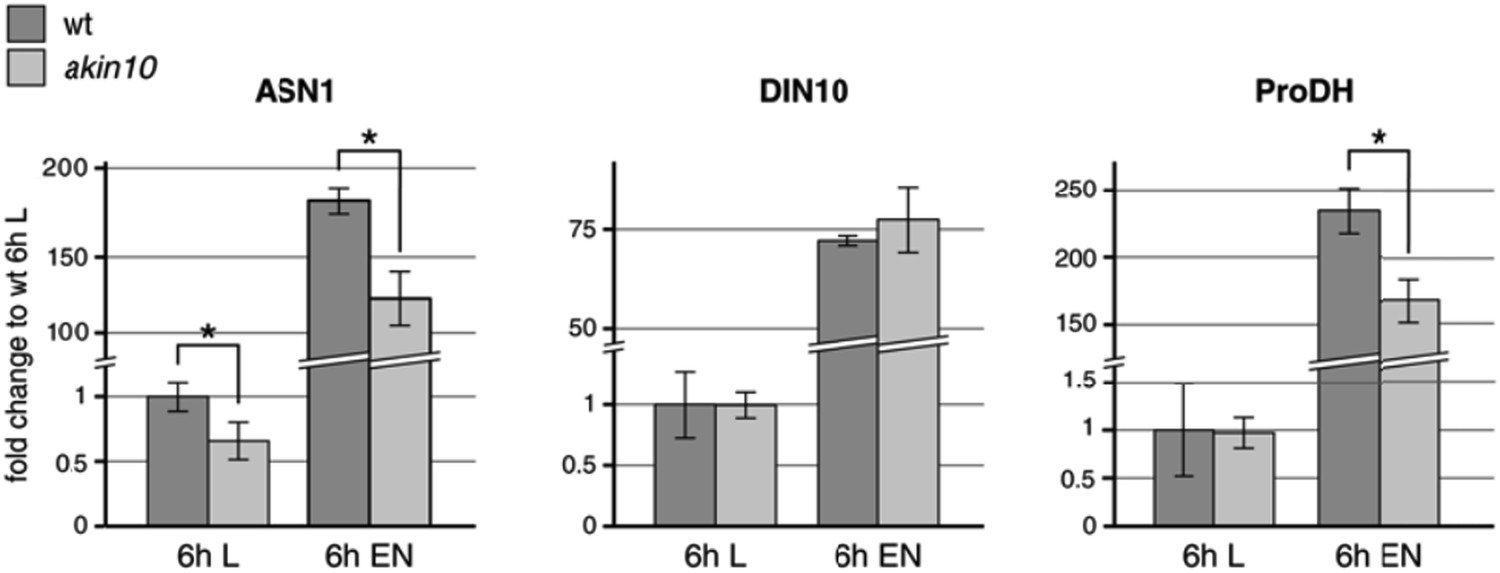
Expression levels of the proposed AKIN10/bZIP63 target genes ASN1, DIN10, and ProDH in wt and the akin10 mutant line in light (L) and extended night (EN). Col‐0 wt and akin10 plants were grown on soil in a 12h/12h light/dark regime for 5 weeks and harvested after 6h of light and extended night. RNA was extracted from whole rosettes, reverse transcribed and used for qPCR of ASN1 (ASPARAGINE SYNTHASE 1; AT3G47340), DIN10 (DARK INDUCIBLE 10; AT5G20250), and ProDH (PROLINE DEHYDROGENASE; AT3G30775). TBP2 (TATA BINDING PROTEIN 2; AT1G55520) and MHF15 (Thioredoxin superfamily protein; AT5G06430) were used as reference genes. Raw data were analyzed with LinRegPCR (version 2014.02, Ramaker et al., 2003). The mean N0 values from two technical replicates were normalized using the geometric mean of the values for TBP2 and MHF15. The bars represent the mean ± SD of 3 biological replicates normalized to the expression in wt in light. P‐values from t‐test < 0.05 are indicated by *.
Author response image 3

Comparison of bZIP63 phosphorylation on phos‐tag gels in response to different treatments and in different genetic backgrounds. GFP/YFP‐tagged bZIP63 was detected by western blotting with an antibody against GFP (top). The Coomassie Brilliant Blue (CBB) stained membranes are given below. Recombinant bZIP63‐YFP is shown as a control for non‐phosphorylated bZIP63. On the left, phosphorylation of bZIP63 after 6h of light (L) or extended night (EN) is shown. Proteins were extracted from whole rosettes of 5 week‐old plants grown on soil in a 12h/12h light/dark cycle. On the right, phosphorylation of bZIP63 in response to sugar treatment is depicted. Seedlings were grown for 1 week in liquid ½ MS in the presence of 0.5% sucrose, followed by 1 week without sucrose. They were then treated with 6h of EN in the presence (+) or absence (‐) of 1% sucrose and harvested. The plant lines used are two bZIP63 over‐expressor lines – 35S::bZIP63‐GFP in wt and UBI10::bZIP63‐YFP in akin10 – and two genomic complementation lines expressing YFP‐tagged bZIP63 – wt bZIP63 (GY11) and bZIP63 harboring S/A mutations in all three AKIN10 target sites (AY14) – under its endogenous promoter in the bzip63 background. All bands (except unspecific bands and degradation bands in the two blot on the right) are indicated by black and grey dots. The color of the dot indicates the strength of the band in the blot. The scheme on the right shows the numbers assigned to each band in the other figures.
Tables
Table 1
List of primers
| Gene | Forward primer | Reverse primer |
|---|---|---|
| Primers for cloning | ||
| genomic bZIP63 | GGTACCAAAACTATAAATTTCTTGTAGGACAGTG | TTGCGGCCGCCCTGATCCCCAACGCTTCGAATACG |
| bZIP63.2 | GGGCCCATGGAAAAAGTTTTCTCCGACGAAGAAATCTCC | TTGCGGCCGCCCTGATCCCCAACGCTTCGAATACG |
| AKIN10.1+3 | GGGCCCATGGATGGATCAGGCACAGGCAGTA | GCGGCCGCAGAGGACTCGGAGCTGAGCAA |
| AKIN11.1+2 | GGGCCCATGGATCATTCATCAAATAG | GCGGCCGCAGATCACACGAAGCTCTGTAA |
| SNF4 | GGGCCCATGTTTGGTTCTACATTGGA | GCGGCCGCAAAGACCGAGCAGGAATTGGAA |
| AKINβ1.1 | GGGCCCATGGGAAATGCGAACGGCAAA | GCGGCCGCACCGTGTGAGCGGTTTGTAG |
| AKINβ2.1+2 | GGGCCCATGTCTGCTGCTTCTGATGGT | GCGGCCGCACCTCTGCAGGGATTTGTAG |
| bZIP1 | CGATGGGCCCCATGGCAAACGCAGAGAAG | CGATGCGGCCGCTGTCTTAAAGGACG |
| bZIP2 | AAAACCATGGCGTCATCTAGCAGCAC | TGCGGCCGCTATACATATTGATATCATTAG |
| bZIP11 | TAGGGCCCATGGAATCGTCGTCGTCGGGAA | TGGCGGCCGCAATACATTAAAGCATCAGAAG |
| bZIP44.1 | CAGGGCCCATGAATAATAAAACTG | CTGCGGCCGCAACAGTTGAAAACATC |
| bZIP53 | AAAACCATGGGGTCGTTGCAAATGCAAAC | TGCGGCCGCTGCAATCAAACATATCAGCAG |
| AKIN10 VIGS | GGAATTCACTTTTTCAGCTCAGAAAATTTTG | GGGGTACCCCCTCGAGCCACTCCTGATATTATCTGCTG |
| AKIN11 VIGS | CCTCGAGGTTTCTGTATATTTCTTCGCTC | GGGGTACCCAGTACTCTACACCAGATATTATC |
| BiFC MCS1 | TCTAGAGGGCCCATGGGCCACAGACACAG | CCCGGGGCGGCCGCACATTCTGCGTC |
| BiFC MCS2 | AAAAGGATCCGGGCCCATGGGCCACAGACACAGCAAGTCCAAATCCTCCG | CCCGGGGCGGCCGCACATTCTGCGTC |
| multi-color BiFC bZIP1 | TCGGTACCAAGCTTAGCTTGCATGCCTGCAGG | CAGGATCCAGCTGGCGAAAGGGGGATGTGCTG |
| multi-color BiFC bZIP11 | CAGGATCCTTAGCTTGCATGCCTGCAGGTCC | CTAGGCCTAAGCTTCGCTATTACGCCAGCTGGCGAAAGG |
| Mutagenesis | ||
| bZIP63S29A | CGTCGTTGAATCGCTCGGCCGCCGAATGGGCATTCAATC | ACGTCATTCCATTAACCGACCAGTG |
| bZIP63S59A | GTGTGGTGTTTCCGTCTCCGCTCCTCCTAATGTTCCTG | CACACGCCGTCGTAGATTCTCCGTCGTC |
| bZIP63S102A | GATACTTCTGGTAGAGCTGACAATGGTGGAGC | GTATCCTGAGGTTTGATGAAAGTTC |
| bZIP63S160A | CTGATTCTCTATTAGCTAGCATCCTTTTAACG | ATCAGCTAGACGGTCCAGAAGAAG |
| bZIP63S261A | CAGAGACATCAAATGCTCCAGACACTACAAG | CTTGTAGTGTCTGGAGCATTTGATGTCTCTG |
| bZIP63S294A | GAACAGAACAGCTGCCATGCGTAGAGTTGAG | TGTTCATCTTGCACCCTATCAAGGC |
| bZIP63S294/300A | GAACAGAACAGCTGCCATGCGTAGAGTTGAGGCCTTGGAACATCTGCAG | TGTTCATCTTGCACCCTATCAAGGC |
| AKIN10K48M | GGTTGCTATCATGATCCTCAATCGTCG | GCAACCTTATGTCCTGTCAATGC |
| qPCR | ||
| bZIP63 | GAAGAAATCTCCGGTAACCATCAC | GATTCTCCGTCGTCTGCAGC |
| bZIP1 | AACGCGGGTCTTAGATCGGAGAAG | TCAGCGTTAAACTCGTCGTAGCAA |
| bZIP11 | TCGTCAGGATCGGAGGAGAGT | GATCGTCTAGGAGCTTTTGTTTCTTC |
| CAB2 | TCAATCTTTTGAATTCGAGTGAGA | TCCACCACAAACACAAACCTAC |
| SEN1 | CAGAGTCGGATCAGGAATGG | ATTATGATTTCATCGTGTTTCC |
| SAG103 | AGCTCGAGTGCTGGGATG | CGGATTCACAGATCCTTCCT |
| YLS3 | GACATCACTAAGTGCCCTGCT | ACTGTTTCGTTCAGACCTTTAGC |
| AKIN10 | ACTGGATTTGCAGAGAGTACAAGGTCC | TCAGAGGACTCGGAGCTGAGCA |
| AKIN11 | GCTCGTAACTTTTTCCAGCAGA | TTCAGGTCTCTATGGACAACCA |
| ASN1 | GTCGCAAGATCAAGGCTC | TGAAGTCTTTGTCAAGGAAAGG |
| DIN10 | GCTTGTATTGCCTGATGGA | ATCTTTAGCAAGCTGACACC |
| ProDH | CGCCAGTCCACGACACAATTCA | CGAATCAGCGTTATGTGTTGCG |
| BCAT2 | AAGGTTATCAGGTAGTAGAGAAGG | TTCCTGATATGTGATAGTGCC |
| AA-TP family protein | GTTCTTGGGATCAACTTCTACAG | AACCATTTACATTCCGTAGGAC |
| TBP2 | TGCAAGAAAGTATGCTCGG | ACATGAGCCTACAATGTTCTG |
| MHF15 | GTTTCCTGAGCTTCTCCAC | TGGTCGCTTCATCTTGAG |
| Characterization of plant lines (PCR) | ||
| bZIP63 | TTGCGGCCGCCCTGATCCCCAACGCTTCGAATACG | AACCATGGATAATCACACAGCTAAAGACATTGG |
| bzip63 RB | TGGCGAATGAGACCTCAATTGCGAGCTTT | |
| bzip63 LB | CATTTTATAATAACGCTGCGGACATCTAC | |
| AKIN10 | CCAGCATAATAGAGAACGAAGC | GTCCGGTTTAGTATTCAGAGG |
| akin10 LB | ATATTGACCATCATACTCATTGC | |
Download links
A two-part list of links to download the article, or parts of the article, in various formats.
Downloads (link to download the article as PDF)
Open citations (links to open the citations from this article in various online reference manager services)
Cite this article (links to download the citations from this article in formats compatible with various reference manager tools)
SnRK1-triggered switch of bZIP63 dimerization mediates the low-energy response in plants
eLife 4:e05828.
https://doi.org/10.7554/eLife.05828


