ULK3 regulates cytokinetic abscission by phosphorylating ESCRT-III proteins
- King's College London School of Medicine, United Kingdom
- University of Utah School of Medicine, United States
Figures
Figure 1 with 1 supplement
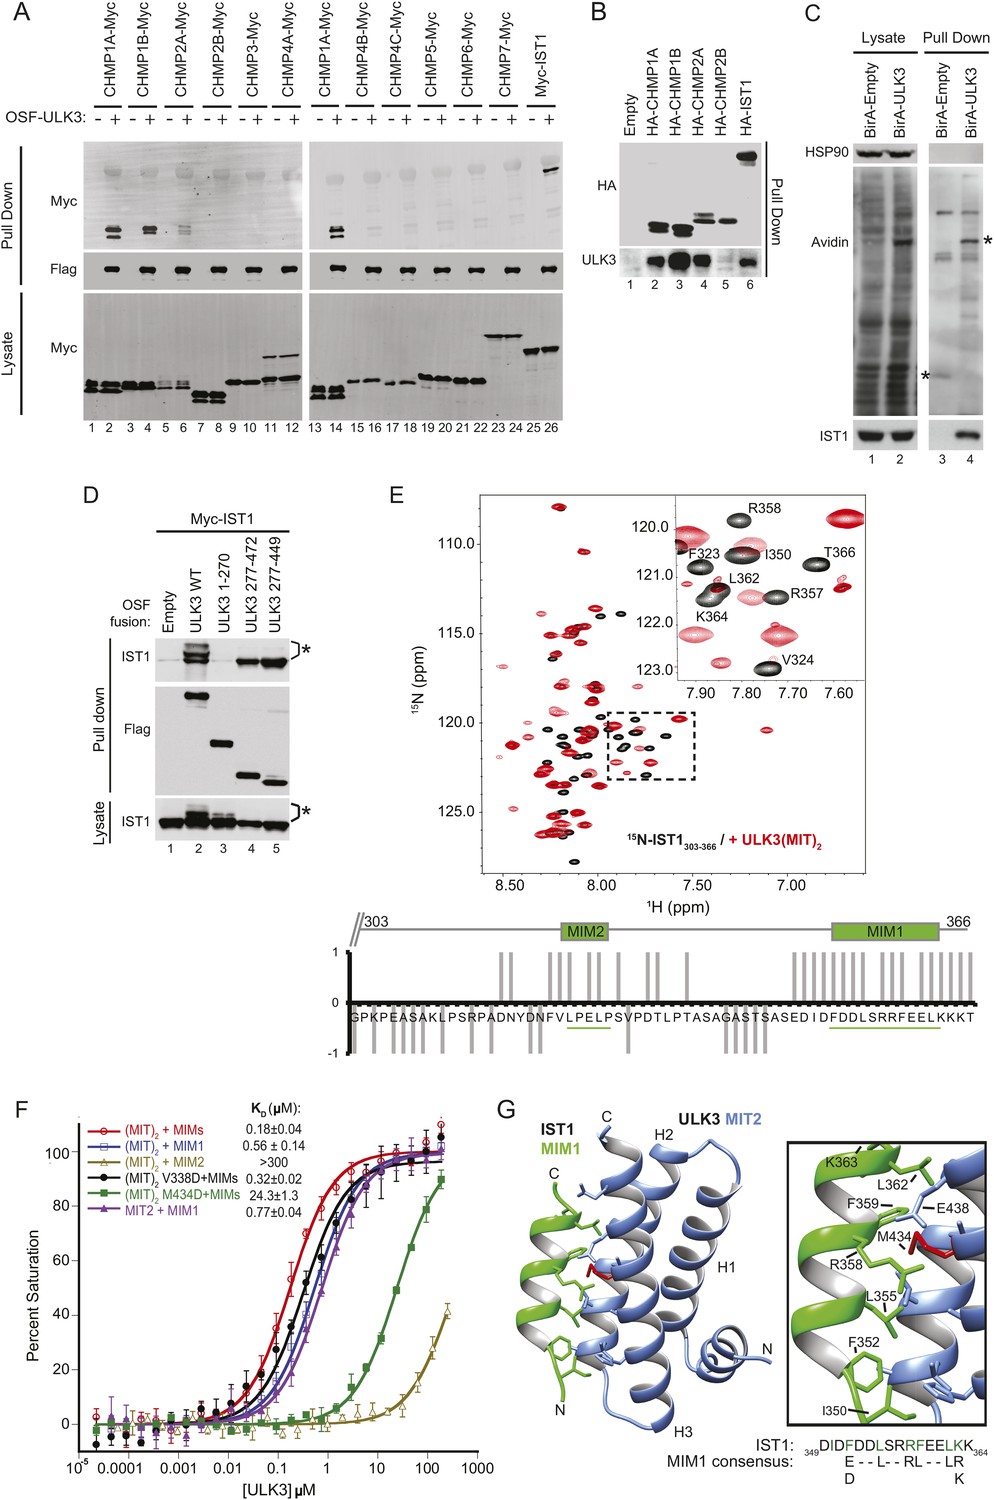
ULK3 binds ESCRT-III via tandem MIT domains.
(A) Lysates from 293T cells overexpressing Myc-endosomal sorting complexes required for transport (ESCRT)-III proteins were mixed with lysates from cells non-transfected (−) or overexpressing One-strep-flag (OSF)-Unc-51-like kinase 3 (ULK3) (+). OSF-ULK3 proteins were bound to streptactin resin and bound ESCRT-III proteins were detected with α-Myc antibody (top). (B) Lysates from 293T cells expressing HA-ESCRT-III were immunoprecipitated with α-HA antibody and co-precipitated endogenous ULK3 protein was detected by Western blot with α-ULK3 antibody. (C) HeLa cells expressing ULK3 fused to the biotin protein ligase BirA-113G or unfused BirA were treated overnight with biotin. Vicinal biotinylated proteins were isolated with streptavidin-coated beads, and endogenous IST1 was found to be biotinylated, implying that it was in close proximity with ULK3. ‘Asterisks’ denote isolated BirA-Empty and BirA-ULK3, respectively, on α-Avidin blot (lanes 3 and 4). Images shown for both lysate and pull-down samples were cropped from the same blot in all cases. (D) Co-immunoprecipitation of Myc-IST1 with different ULK3 constructs. ‘Asterisks’ denote phosphorylated IST1 species. (E) Top: overlaid 15N-HSQC NMR spectra of 15N,13C-IST1 (residues 303–366) alone (black) or with 2 equivalents of ULK3(MIT)2 (residues 277–449) (red). Inset shows an expanded view of the boxed region in the spectrum. Bottom: individual IST1 backbone amide resonances perturbed (1) or not (−1) upon addition of ULK3(MIT)2. Ambiguous changes (due to spectral overlap) were scored as 0. (F) Fluorescence polarization (FP)-binding isotherms show interactions between different ULK3 MIT constructs corresponding to MIT2 (residues 359–449) or both MIT domains (ULK3(MIT)2) and fluorescently labeled IST1 peptides for MIT-interacting motifs (MIM) 1, MIM2, or both MIM1+MIM2 (MIMs). Data points are averages ±SD of at least three separate measurements, and curves show fits to simple 1:1 binding models with dissociation constants. (G) Crystal structure of the ULK3 MIT2-IST1 MIM1 complex. Inset shows key interacting side-chains (in green) with ULK3 M434 highlighted in red. Sequence alignment compares IST1 MIM1 to the consensus MIM1 sequence. See also Figure 1—figure supplement 1 and Figure 1—source data 1.
-
Figure 1—source data 1
Data Collection and Refinement Statistics for the ULK3 MIT2:IST1 MIM1 Complex.
- https://doi.org/10.7554/eLife.06547.004
Figure 1—figure supplement 1

ULK3 binds to ESCRT-III via tandem MIT domains.
(A) Y2H assays in which ULK3 fused to the VP16 activation domain was tested for interactions with the designated human components of ESCRT-I, ESCRT-II, ESCRT-III, and ESCRT-associated proteins fused to Gal4 DNA-binding domain. (B) Overlay of the ULK3 MIT2 (blue)/IST1-MIM1 (green) structure with the structure of VPS4A (red) in complex with the MIM1 element of CHMP1A (orange; PDB 2JQ9). Structure-based sequence alignments of the IST1 and CHMP1A MIM1 sequences are shown below with residues within 4 Å of the MIT/MIM interface highlighted in red. (C) Overlay of the ULK3 MIT2 (blue) structure with the structure of VPS4A (red) in complex with the MIM2 element of CHMP6 (orange, PDB ID 2K3W). The overlay demonstrates that the N-terminal helix of ULK3 MIT2 would sterically preclude binding of a canonical MIM2 element. Structures in B and C were analyzed and generated using Chimera (Pettersen et al., 2004). (D) Co-precipitations from 293T cells co-transfected with HA-CHMP1A or HA-IST1 and GST-ULK3 WT, V338D, or M434D. An empty GST vector was used as a negative control. 10% of the volume eluted from the beads was analyzed by Western blot with α-HA antibody to visualize bound proteins. Western blot with α-GST shows equivalent capture of GST fusion proteins, where empty GST bands (lanes 1 and 5) were cropped from the same blot. (E) Y2h assay in which CHMP1B WT and deletion and point mutants fused to Gal4 DNA-binding domains were tested for binding to ULK3 fused to the VP16 activation domain. Point mutant designations are as follows: M1 (LSQ185-187/AAA, MIM1 element), M2 (RLA188-190/AAA, MIM1 element), M3 (RLR191-193/AAA, MIM1 element), M4 (DQV194-196/AAA, MIM1 element), TAE/RRR (T178A181E184/RRR, MIM3 element). Binding of all constructs to CHMP1A was used as a positive control. (F) Y2H assay with ULK3 WT, V338D, or M434D fused to VP16. Note that both mutations impair binding to CHMP1A and CHMP1B Gal4-fused proteins. (G) In vitro kinase assay showing equivalent auto-phosphorylation activities for GST-ULK3 WT, GST-ULK3 V338D, and GST-ULK3 M434D. GST alone was used as a negative control; bands shown were cropped from the same blot. In (A), (E), and (F) data are represented as mean β-galactosidase activity ±SD from triplicate measurements of two separate experiments.
Figure 2 with 2 supplements
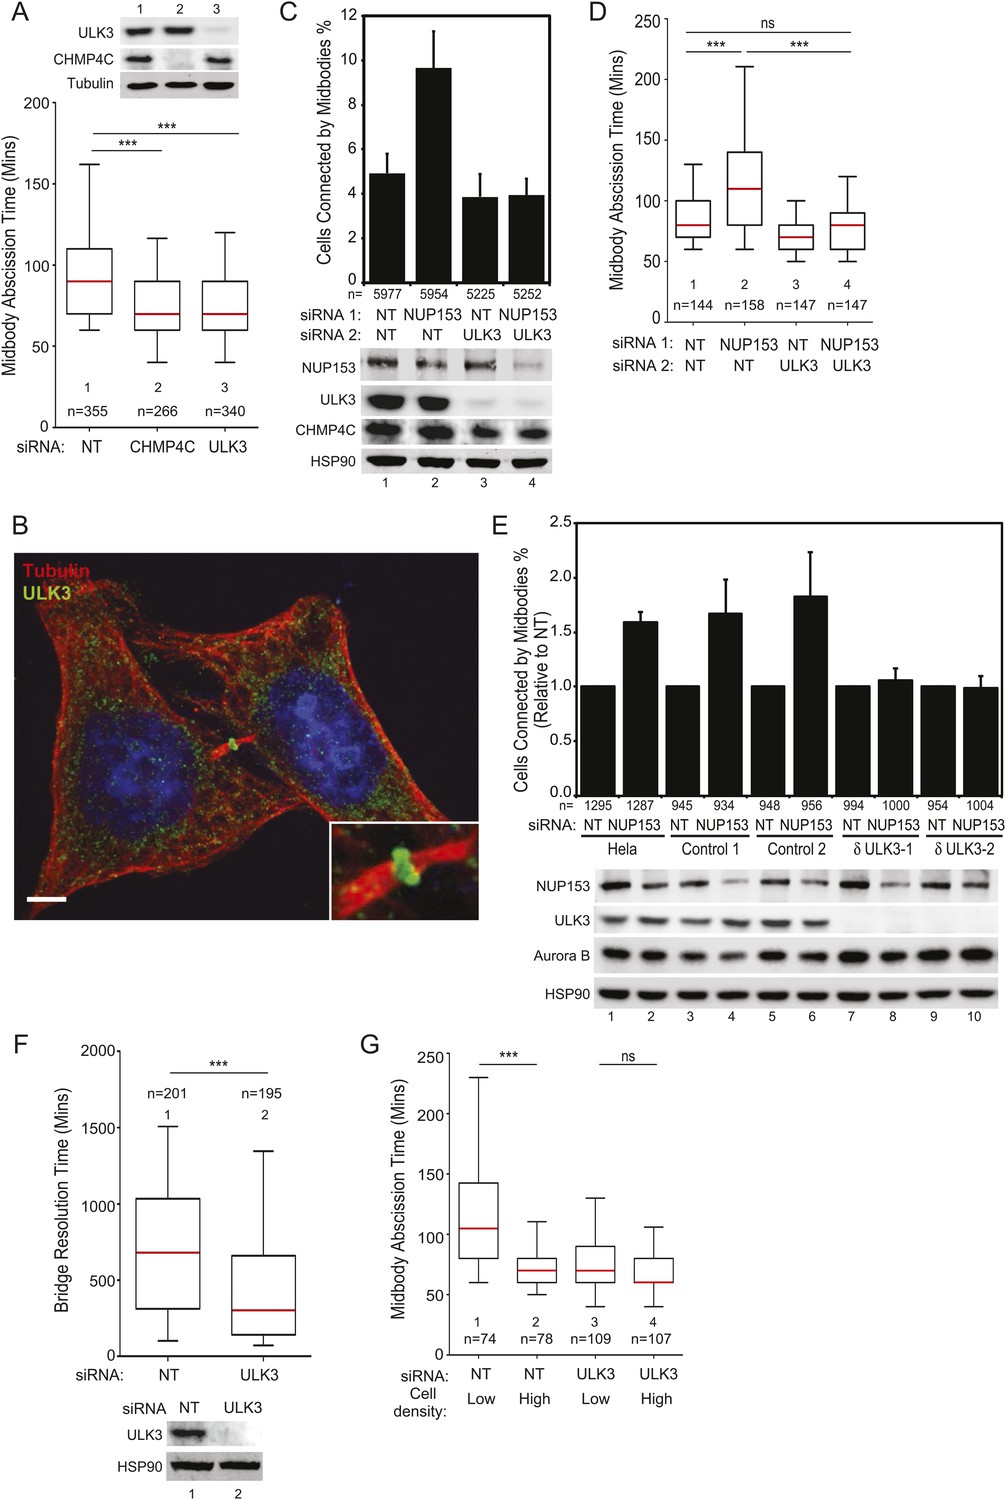
ULK3 regulates abscission timing.
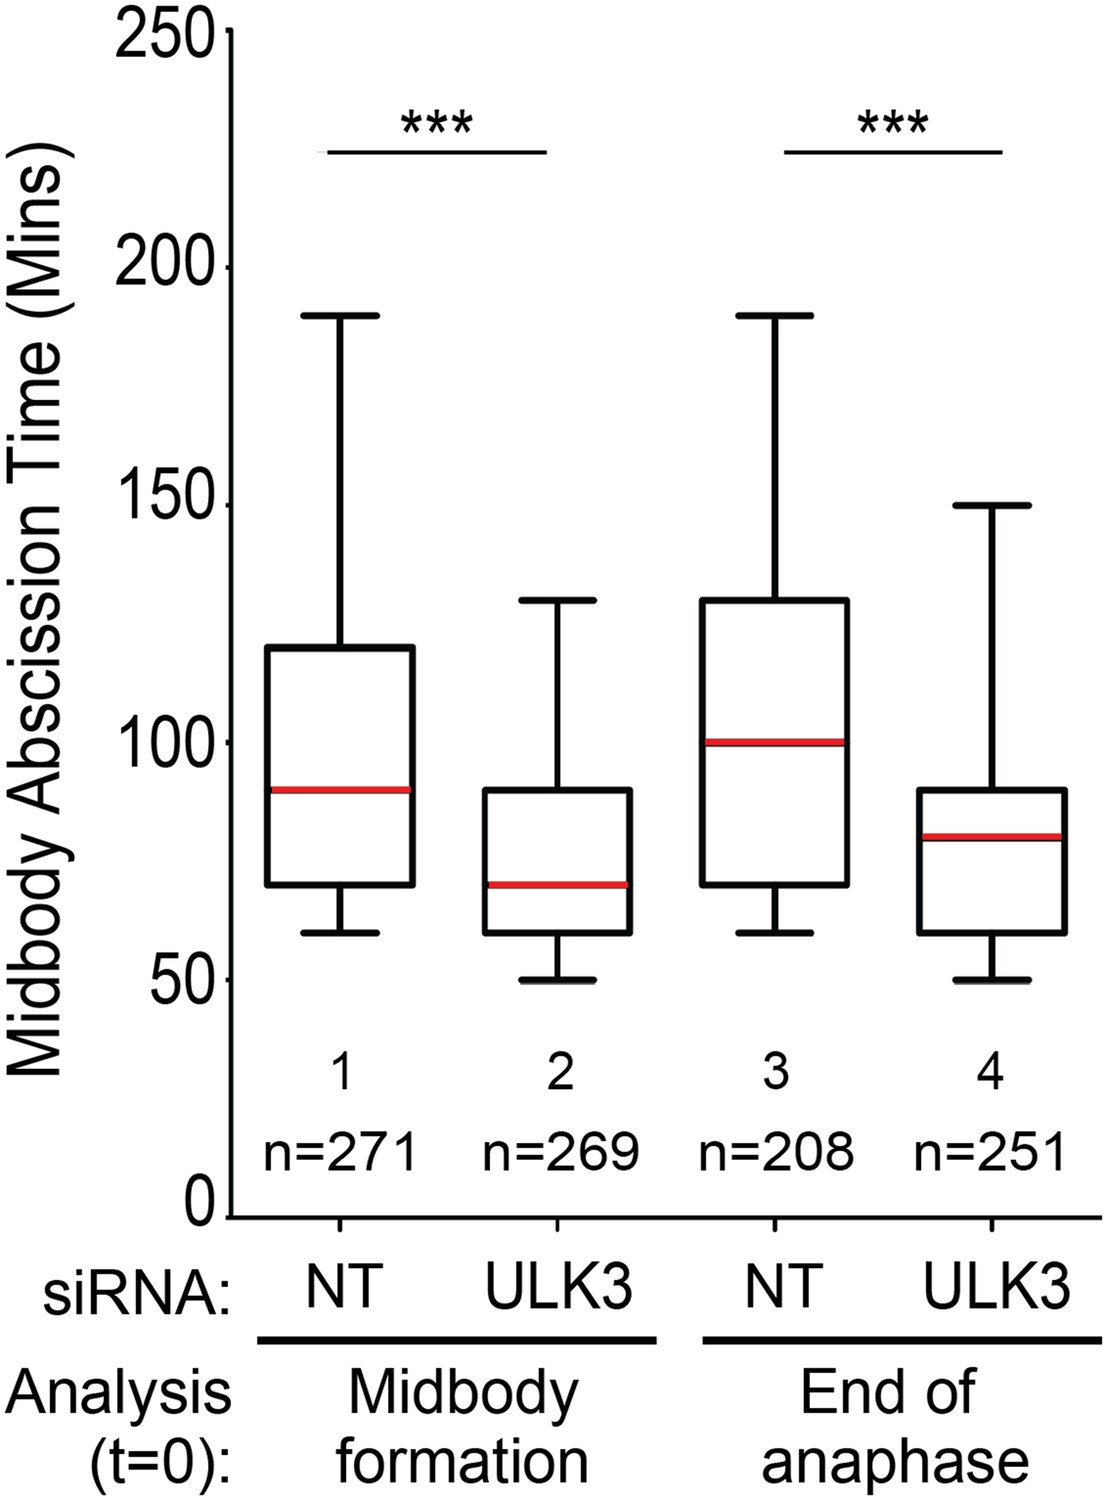
(A) Asynchronous cultures of HeLa mCherry-Tubulin cells were transfected with the specified siRNA. Midbody resolution times were calculated from three separate experiments (mean times ±SD were non-targeting (NT): 96 ± 36 min; CHMP4C: 74 ± 26 min; ULK3: 74 ± 31 min). (B) HeLa cells were stained with Hoechst, α-Tubulin, and α-ULK3 antibody (Santa Cruz). ULK3 was observed at the Flemming body in 79% of observed midbodies (total n = 34). Image shows a representative example of Flemming body localization, with the ULK3 signal in green, Tubulin in red, and nuclei in blue. Bar = 5 μm. Inset shows an expanded view of the midbody. (C and D) HeLa mCherry-Tubulin cells transfected with NT or ULK3 siRNA were transfected with Nucleoporin 153 (NUP153) siRNA to trigger the abscission checkpoint. In (C), cells were fixed and stained with α-Tubulin antibody to visualize midbody-arrested cells. Data are represented as a mean percentage of midbodies ±SD from six separate experiments. NUP153 depletion levels as mean percentages from three independent experiments were lane 1: 100%, 2: 67%, 3: 108%, 4: 70%. In (D), midbody abscission times were analyzed (mean times are 1: 86 ± 22 min; 2: 118 ± 50 min; 3: 70 ± 15 min; 4: 81 ± 25 min). (E) Clonal HeLa cells stably expressing a lentiviral vector containing CRISPR-Cas9 with a guide RNA sequence targeting the ULK3 locus (δULK3-1 or δULK3-2) or without guide RNA (Controls) were transfected with NT or NUP153 siRNA as above and stained with α-Tubulin antibody to visualize midbody-arrested cells. Data are represented as the mean percentage increase in midbody-connected cells compared to the percentage of midbodies in NT-treated cells for each cell line ±SD from four separate experiments. Mean percentages of NUP153 depletion levels compared to HeLa + NT siRNA (lane 1) from four independent experiments were lane 1: 100%, 2: 52%, 3: 85%, 4: 52%, 5: 94%, 6: 51%, 7: 75%, 8: 48%, 9: 96%, 10: 48%. (F) HeLa YFP-lamina-associated polypeptide 2β (LAP2β) expressing cells were transfected with NT and ULK3 siRNA, and resolution times of intercellular chromatin bridges were quantified in three separate experiments (mean times are NT: 708 min; ULK3: 459 min). (G) Analysis of tension-dependent modulation of abscission time, mean times: 1: 120 ± 53 min; 2: 73 ± 19 min; 3: 77 ± 41 min; 4: 69 ± 20 min). Data in (A, D, F–G) are represented as box plots showing median abscission times (A, D, and G) or LAP2β bridge resolution times (F). Here and throughout, whiskers mark 5–95 percentiles, box edges represent the first and third quartiles, and red bars denote the median. n = total number of events counted per sample. Cell lysates in (A, C, E, and F) were examined by Western blot using indicated antibodies. See also Figure 2—figure supplements 1 and 2, and Videos 1–11.
Figure 2—figure supplement 1
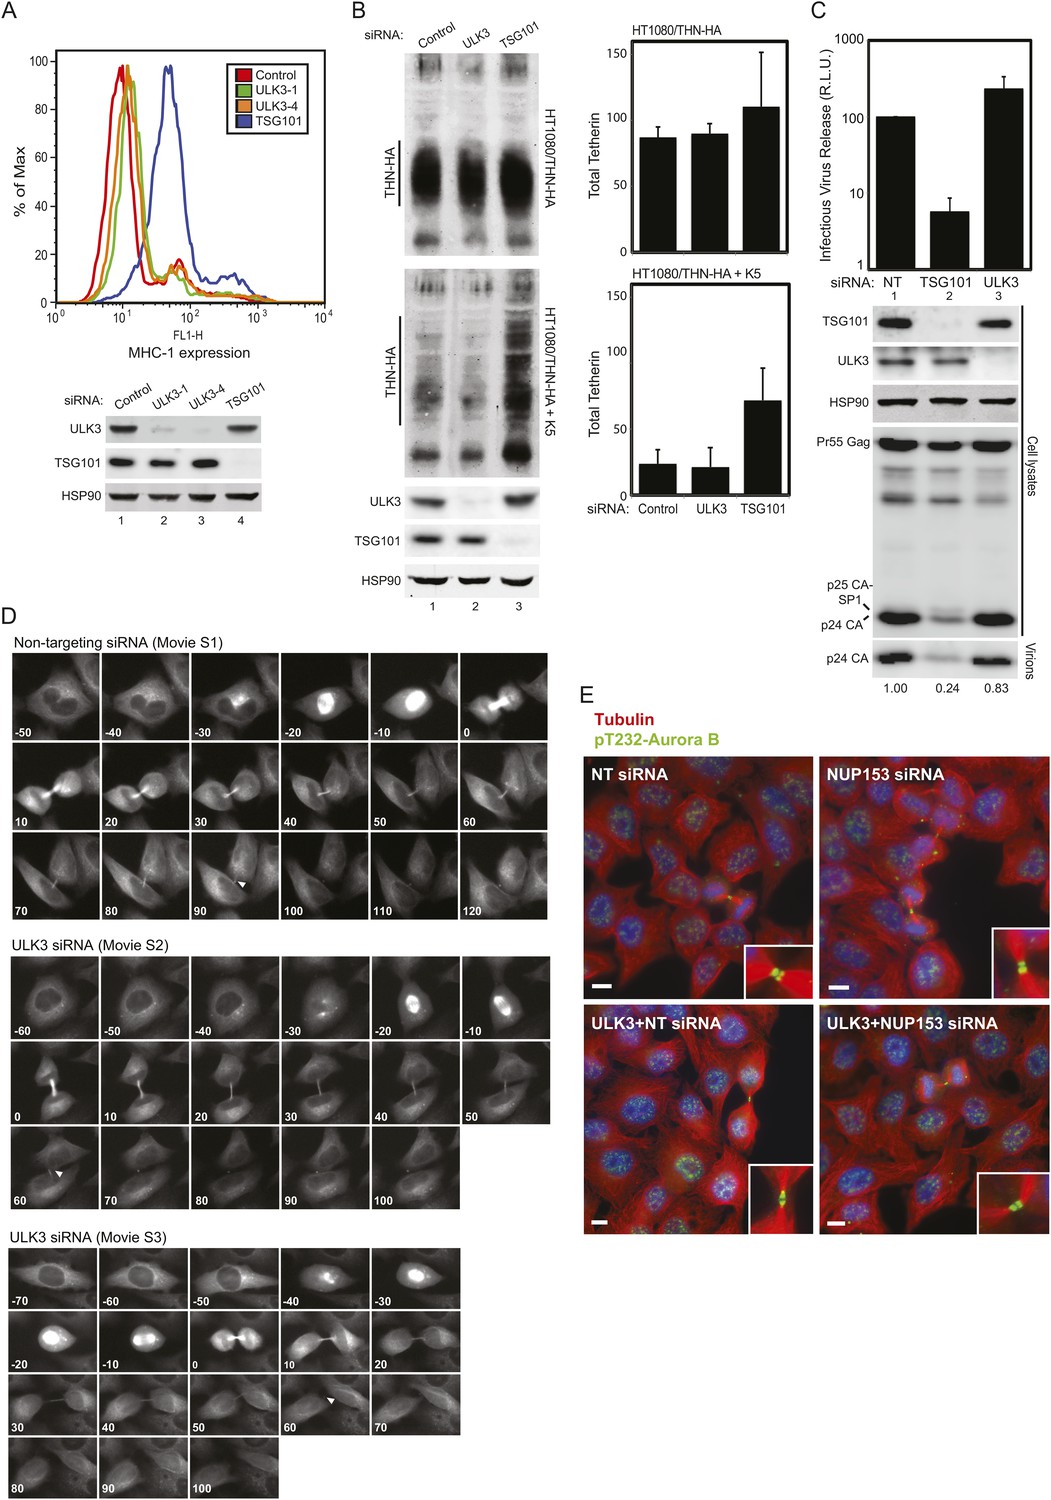
ULK3 is not required for endosomal sorting or HIV-1 budding, but does regulate abscission timing.
(A) HeLa Kaposi sarcoma-associated herpesvirus (KSHV) K3 expressing cells were transfected with NT or two different siRNAs against ULK3 (ULK3-1 and ULK3-4). Cells were fixed and stained with a FITC-conjugated α-MHC-I antibody and analyzed by flow cytometry. TSG101 depletion was used as a positive control for disruption of ESCRT-mediated endosomal sorting. Cell lysates were analyzed by Western blot with α-ULK3 and α-TSG101 to verify knockdown of endogenous proteins. (B) HT/THN-HA (top) and HT/THN-HA KSHV K5 (bottom) expressing cells were transfected with NT, TSG101, or ULK3 siRNA. Cell lysates obtained 72 hr after initial transfection were analyzed by Western blot using α-HA and α-HSP90 antibodies. Data are represented as mean values of Tetherin-HA levels detected by Western blotting with infrared imaging ±SD from three separate experiments. (C) 293T cells were co-transfected with an HIV-1 proviral pNL/HXB plasmid and the indicated siRNA. Infectious virion production was measured using β-galactosidase activity on infected TZM indicator cells after 48 hr. Mean infectivity values obtained in three separate experiments are represented as relative luminescence units ±SD. Cell lysates were analyzed by Western blot with α-Gag, α-ULK3, α-TSG101, and α-HSP90 antibodies. Extracellular virions were also analyzed with α-Gag and quantified by Western blotting with infrared imaging. Numbers below the blot represent the ratio of virion release calculated for each sample, compared to the NT siRNA-treated sample. (D) Abscission dynamics for representative HeLa cells expressing mCherry-Tubulin treated with NT siRNA (top) or ULK3 siRNA (middle and bottom). Times in minutes are shown for each frame and ‘arrowheads’ indicate the moment of midbody abscission. Panels correspond to Videos 1–3, respectively. (E) HeLa cells transfected with NT or ULK3 siRNA were transfected with NUP153 siRNA as in Figure 2C, fixed and stained with Hoechst (in blue), α-Tubulin (in red), and α-pT232 Aurora B (in green) antibodies to visualize midbody-arrested cells and active Aurora B, respectively. Insets show magnified views of midbodies. Scale bars = 10 μm.
Figure 2—figure supplement 2

LAP2β-positive intercellular chromatin bridges resolve faster in ULK3-depleted cells.
(A) Selected frames from Videos 4, 5 showing the resolution dynamics of intercellular chromatin bridges present in HeLa cells expressing YFP-LAP2β transfected with NT siRNA (top) or ULK3 siRNA (bottom). Times in minutes are shown for each frame and ‘arrowheads’ indicate the moment of resolution of the LAP2β-positive chromatin bridges. (B) Asynchronous HeLa cells doubly expressing YFP-LAP2β and mCherry-Tubulin transfected with NT or ULK3 siRNA were imaged live over 72 hr. For each condition, dividing cells were segregated between normal midbody-connected cells and chromatin bridge-containing cells, and further classified into cells achieving abscission (bronze) or cells showing failed abscission as seen by the regression of the cleavage furrow (black) (NT normal n = 271; NT chromatin bridge n = 46; ULK3 normal n = 310; ULK3 chromatin bridge n = 49). Dot plot in (C) shows resolution time of chromatin bridges from experiment (B) in three separate experiments. Red line indicates mean resolution times for NT siRNA: 950 min and ULK3 siRNA: 598 min, and n = total number of events counted per sample. **p = 0.0003.
Figure 3

ESCRT-III binding and kinase activity are required for ULK3 function.
(A) HeLa mCherry-Tubulin cells stably expressing empty vector or siRNA-resistant ULK3 (ULK3R) were transfected with the indicated siRNA. Midbody resolution times were calculated in three separate experiments (mean times were 1: 95 ± 32 min; 2: 71 ± 25 min; 3: 115 ± 61 min; 4: 80 ± 38 min; 5: 77 ± 34 min; 6: 74 ± 31 min). (B) HeLa mCherry-Tubulin cells expressing empty vector, ULK3 WT, V338D, or M434D were imaged live. Midbody resolution times were analyzed from three separate experiments (mean times were 1: 81 ± 29 min; 2: 159 ± 88 min; 3: 73 ± 23 min; 4: 83 ± 37 min). (C) In vitro kinase assay showing the auto-phosphorylation activity of GST-ULK3 WT and GST-ULK3 K44H. (D) Yeast two-hybrid (Y2H) assay with ULK3 WT and ULK3 K44H fused to VP16 binding to ESCRT-III proteins fused to Gal4. Data are represented as mean β-galactosidase activity ±SD from triplicate measurements of two separate experiments. (E) HeLa mCherry-Tubulin cells expressing either empty vector or ULK3R constructs were transfected with the indicated siRNA. Midbody resolution times were analyzed in three independent experiments (mean times were 1: 100 ± 42 min; 2: 77 ± 34 min; 3: 104 ± 57 min; 4: 74 ± 31 min). (F) HeLa mCherry-Tubulin cells expressing empty vector, ULK3 WT, or K44H were imaged live. Midbody resolution times were calculated in four separate experiments (mean times are 1: 122 ± 60 min; 2: 161 ± 73 min; 3: 113 ± 47 min). Cell lysates in (A, B, E, and F) were examined by Western blot using the indicated antibodies. See also Videos 12–17.
Figure 4 with 1 supplement
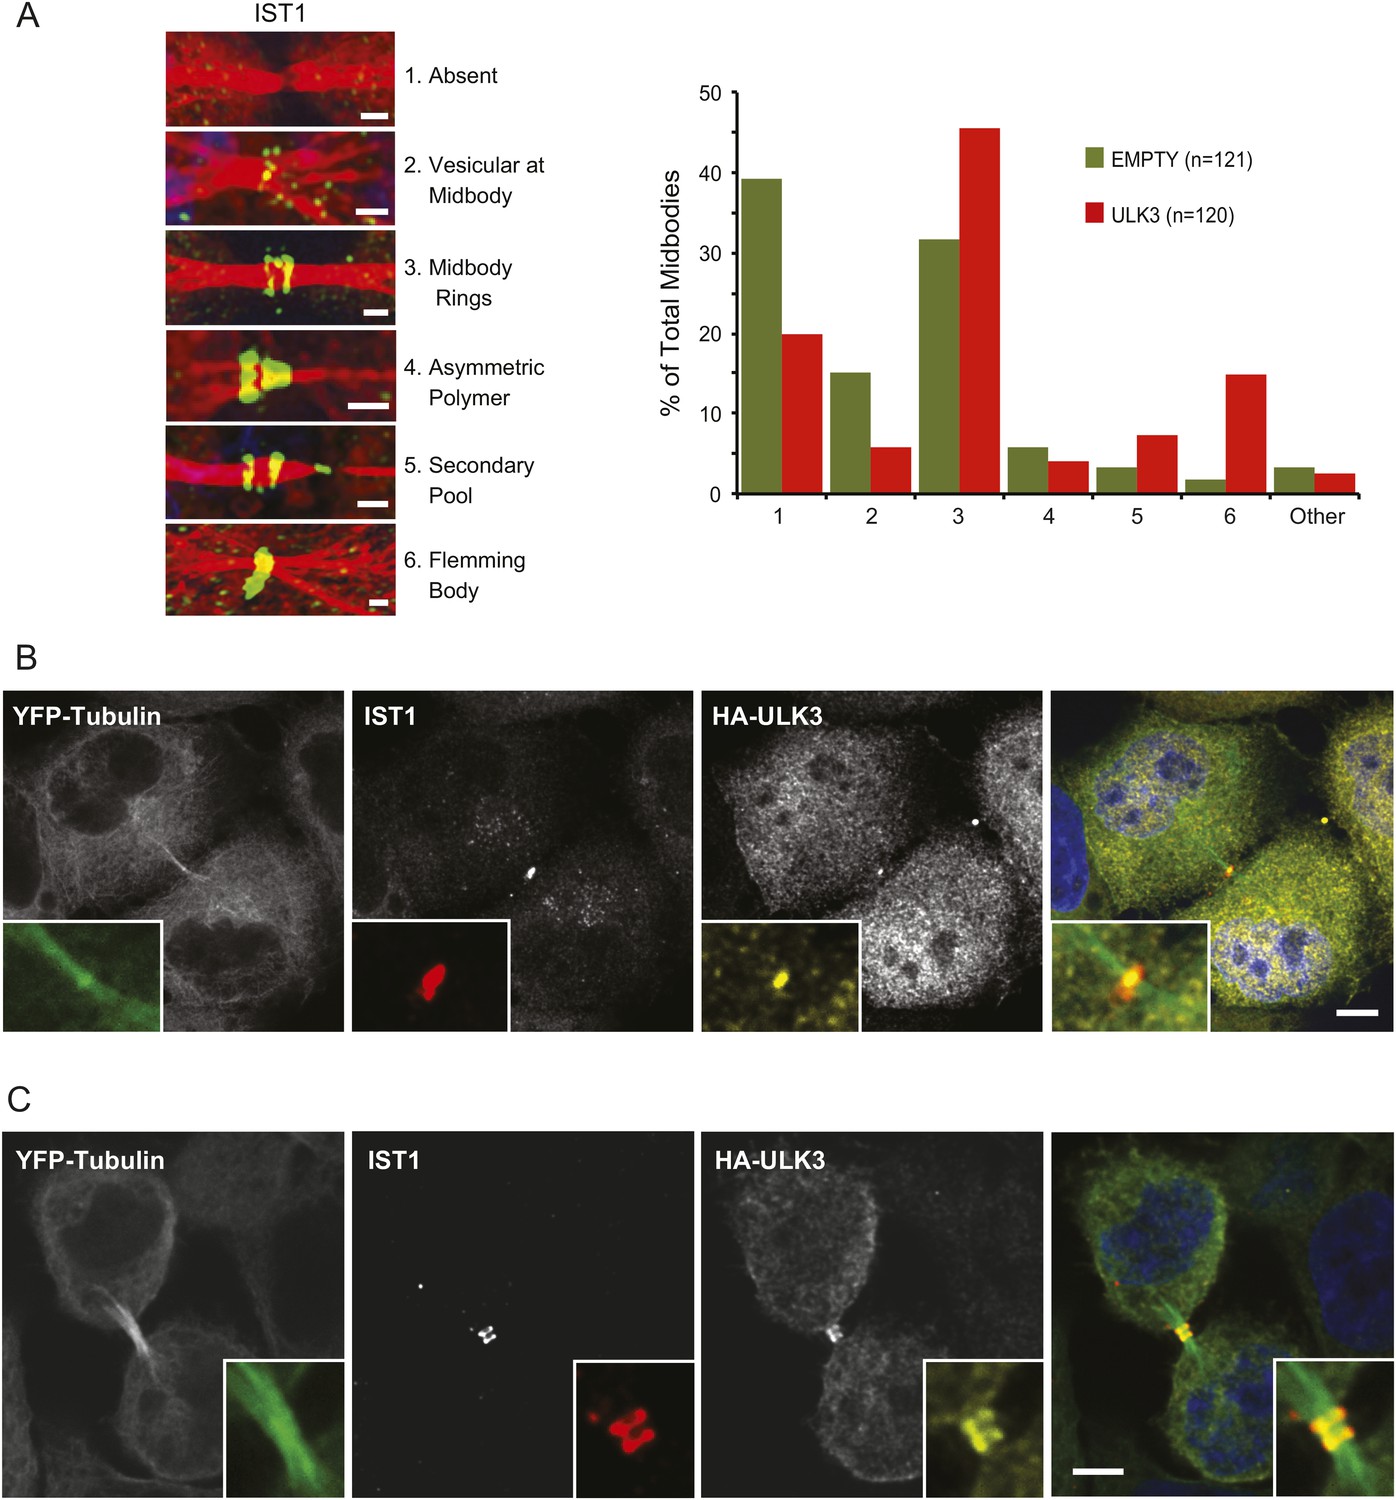
Effects of ULK3 on IST1 localization at the midbody.
(A) HeLa mCherry-Tubulin cells stably expressing empty vector or ULK3 WT were stained with Hoechst and α-IST1 antibody. Cells connected by midbodies were classified by the localization pattern of IST1 as shown on the left panel, where Tubulin is red and IST1 is green. Bars = 1 μm. Data are represented as percentage of midbodies observed for each category from three separate experiments; n = total number of scored midbodies. Cells connected by chromatin bridges or multinucleated were excluded. (B and C) Panels show a representative example of Flemming body localization (B) or midbody rings (C), where the IST1 signal (middle left) co-localizes with HA-ULK3 (middle right) in HeLa YFP-Tubulin (left) cells expressing HA-ULK3 stained with α-IST1 and α-HA antibodies. ULK3 and IST1 co-localization was observed in 100% of midbodies with Flemming body localization for IST1 (n = 48). Merged channels are shown on the right (green: Tubulin, red: IST1, yellow: HA, blue: nuclei). Magnifications of the midbody are shown for each channel. Bar = 5 μm. See also Figure 4—figure supplement 1.
Figure 4—figure supplement 1
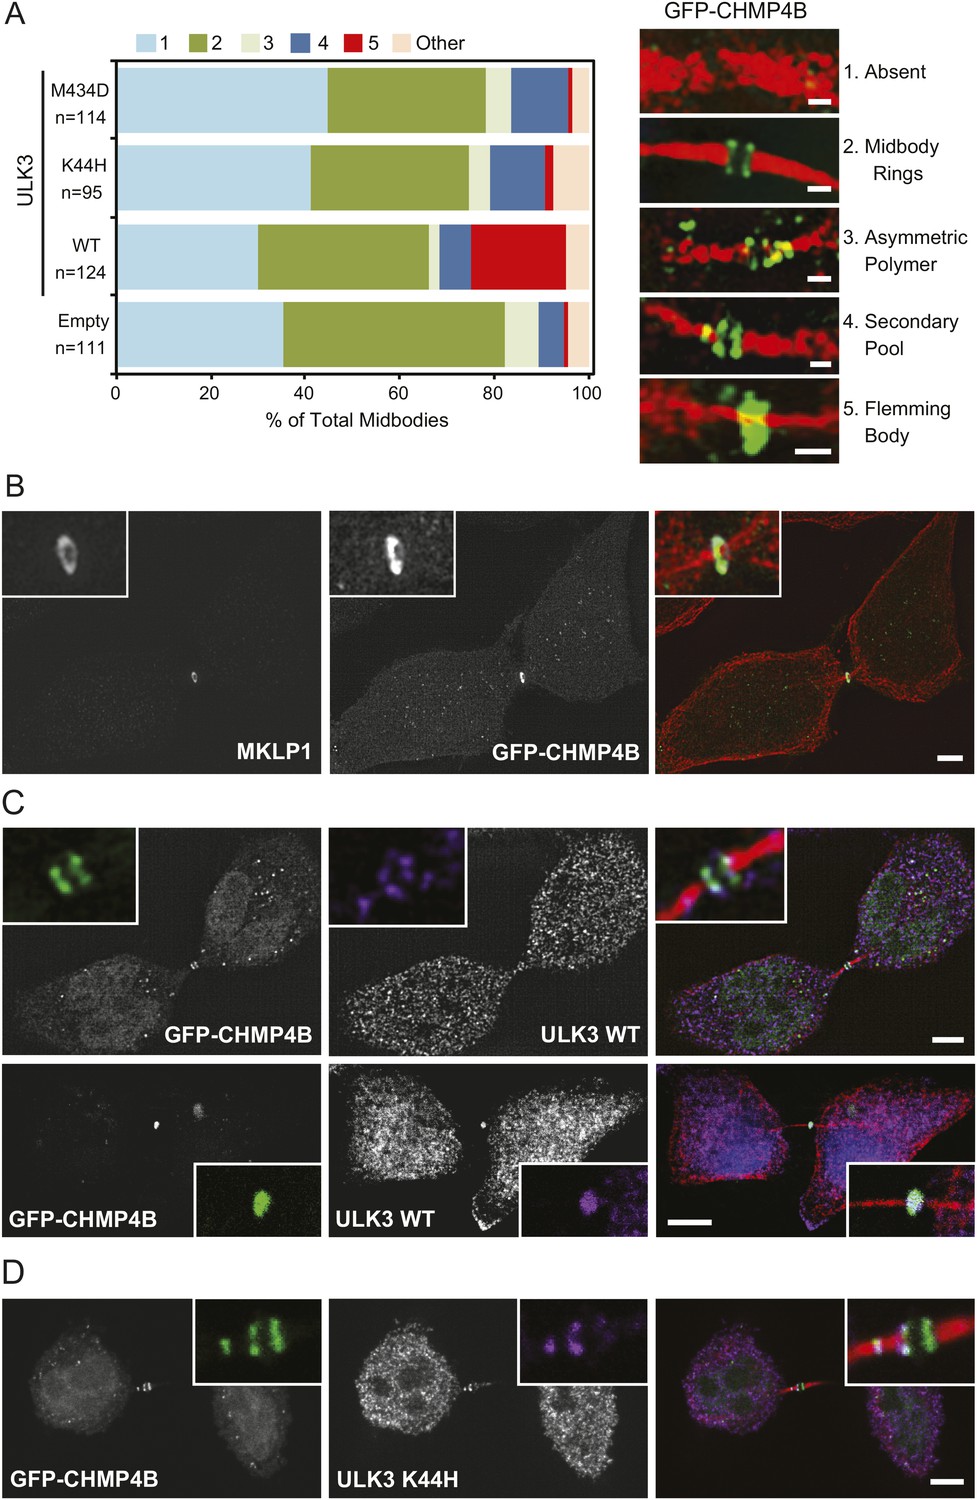
Effects of ULK3 on the abscission machinery.
(A) HeLa cells stably expressing GFP-CHMP4B and empty vector, ULK3 WT, K44H, or M434D were fixed and stained with Hoechst, α-GFP, α-ULK3, and α-Tubulin antibodies. Cells connected by midbodies were counted and classified by the localization pattern of GFP-CHMP4B as shown on the images on the right, where Tubulin is in red and GFP in green. Scale bars = 1 μm. Data are represented as percentage of midbodies observed for each category from three experiments; n is the total number of scored midbodies. Cells connected by chromatin bridges or multinucleated were excluded. (B) Cells overexpressing ULK3 WT from (A) were stained with α-Tubulin and α-MKLP1 antibody, a marker of the Flemming body. Panel shows a representative midbody with a Flemming body ring, where the unusual GFP-CHMP4B pattern (middle) co-localizes with MKLP1 (left). Merged channels are shown on the right (red: Tubulin, green: GFP, white: MKLP1). Scale bars = 5 μm. (C and D) Panels show co-localization of GFP and ULK3 signals in HeLa GFP-CHMP4B cells expressing ULK3 WT (C) or K44H (D) stained with Hoechst, α-ULK3, and α-Tubulin antibodies. In C, top panels show a representative example of ULK3 WT co-localization with GFP-CHMP4B at the midbody rings (61% of observed midbodies) and bottom panels an example of co-localization at the Flemming body (39% of midbodies, n = 33). In C and D, column on the right shows merged channels (red: Tubulin, green: GFP, purple: ULK3, blue: nuclei). Scale bars = 5 μm. Magnifications of the midbody regions are shown for each channel (B, C, and D).
Figure 5 with 1 supplement
Identification of ULK3 phosphorylation sites within IST1.
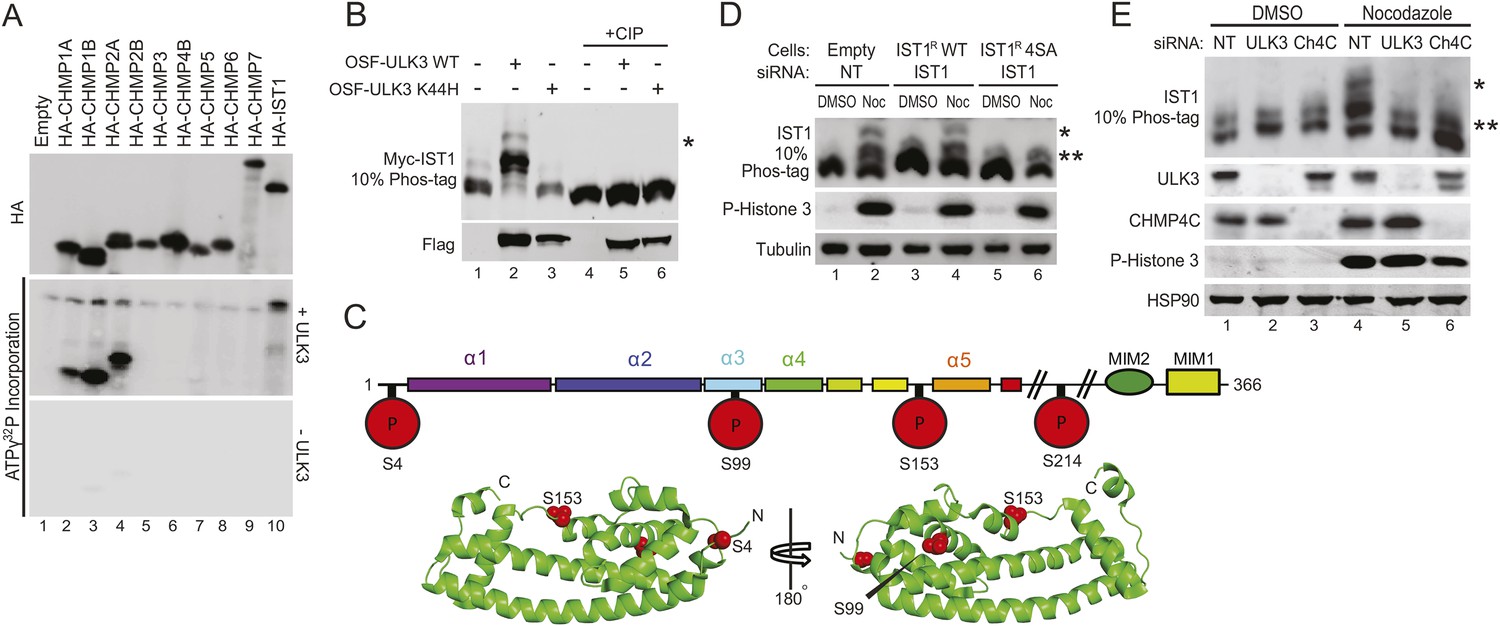
(A) In vitro kinase assay with recombinant ULK3 protein (middle) on immunoprecipitated HA-ESCRT-III proteins expressed in 293T cells. Western blot with α-HA antibody shows immunoprecipitated ESCRT-III proteins (top). (B) 293T cells co-transfected with Myc-IST1 and either empty vector, OSF-ULK3 WT or OSF-ULK3 K44H. Lysates were electrophoresed on a 10% Phos-tag gel to separate phosphorylated species (denoted by ‘asterisk’). Lysates were treated with calf intestinal phosphatase (CIP, lanes 4–6). (C) Identified phosphorylation sites mapped onto the IST1 domain structure (above) and onto the crystal structure of the IST1 N-terminal domain (below, PDB 3FRR) 39. (D) HeLa cells stably expressing empty vector, siRNA-resistant IST1 (IST1R) WT, or IST1R 4SA were transfected with siRNA and treated overnight with DMSO or Nocodazole. (E) HeLa cells were transfected with siRNA prior to overnight treatment with DMSO or Nocodazole. In (D and E), cell lysates were resolved on 10% Phos-tag gels and analyzed by western blot, where ‘asterisks’ denote bands corresponding to IST1 phosphorylated species, sensitive (*) or insensitive (**) to the 4SA mutation or ULK3/CHMP4C depletion. See also Figure 5—figure supplement 1.
Figure 5—figure supplement 1
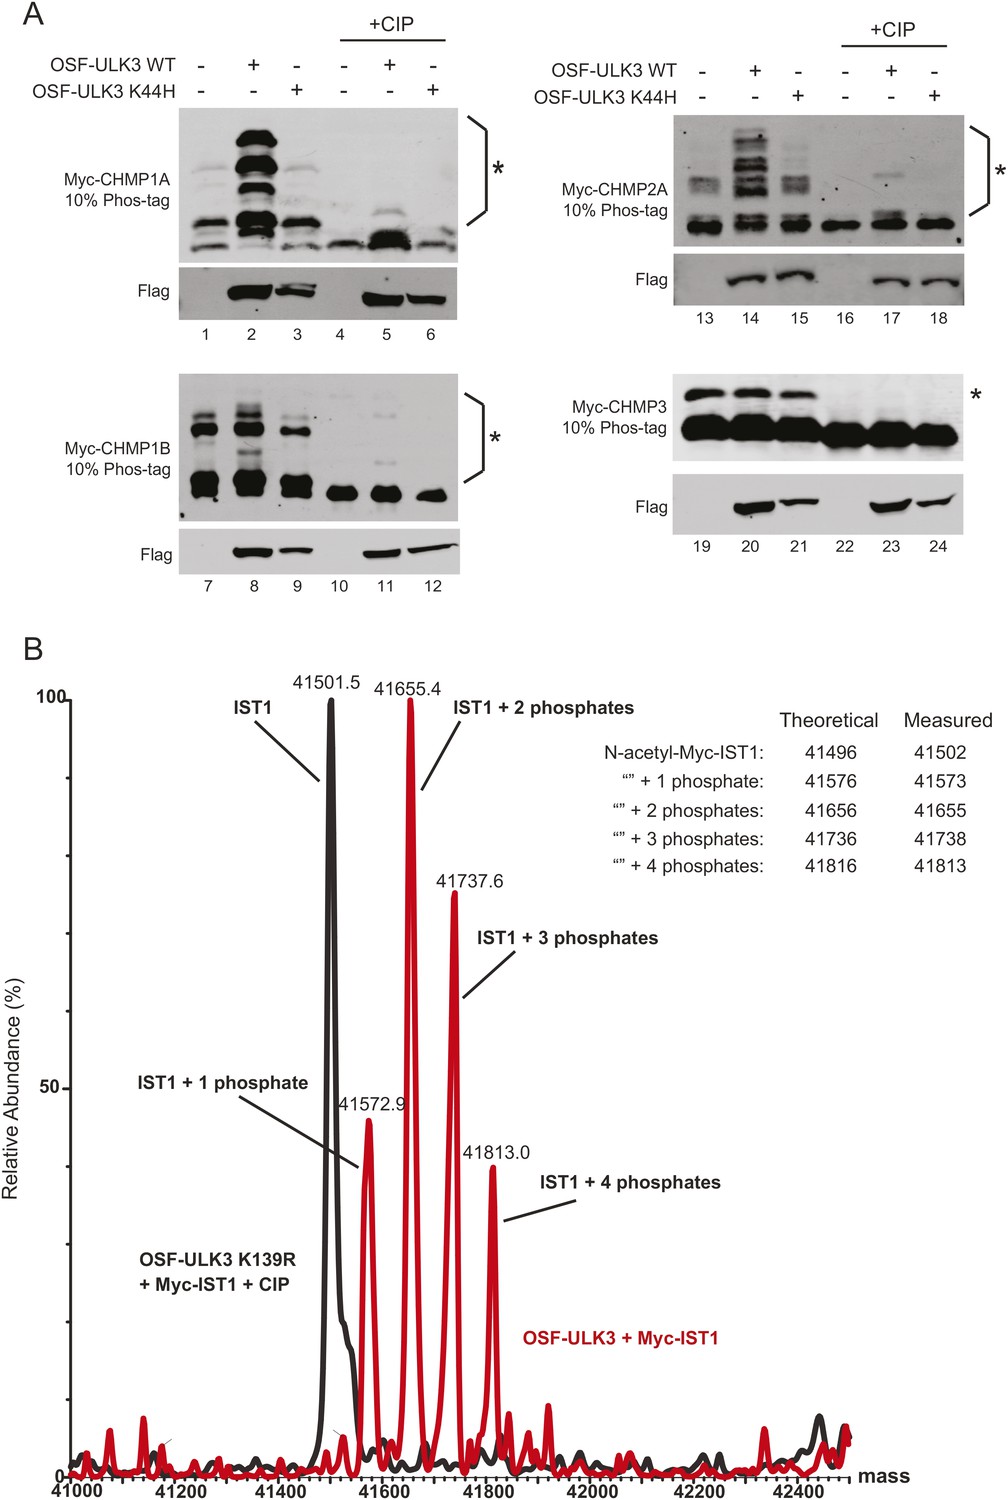
ULK3 phosphorylation of ESCRT-III proteins.
(A) 293T cells were co-transfected with vectors expressing Myc-ESCRT-III proteins and either empty vector, OSF-ULK3 WT, or OSF-ULK3 K44H. Cell lysates were electrophoresed on 10% Phos-tag gels and blotted for the designated ESCRT-III proteins to reveal lower mobility phosphoproteins (designated by ‘asterisks’). Treatment with CIP confirmed that the mobility changes resulted from phosphorylation (final three lanes in each blot). (B) Overlay of ESI/MS spectra showing the intact mass of Myc-IST1 co-immunoprecipitated with either OSF-ULK3 WT (red) or the catalytically inactive OSF-ULK3 K139R protein together with CIP treatment (black). Theoretical vs actual measured masses of phospho-IST1 species detected in this experiment are tabulated.
Figure 6 with 1 supplement

ULK3 phosphorylation of IST1 is required to sustain the abscission checkpoint and inhibits IST1 function in abscission.
(A) HeLa cells stably expressing empty vector, IST1R WT, or IST1R 4SA were co-transfected with the indicated siRNA and NUP153 siRNA to trigger the abscission checkpoint. Cells were fixed and stained with Hoechst and α-Tubulin antibody to visualize nuclei and midbodies, respectively. Data are represented as mean percentage of midbodies ±SD from four separate experiments, n = total number of scored midbodies. NUP153 depletion levels as a mean percentage quantified by Western blot from two independent experiments were lane 1: 100%, 2: 40%, 3: 85%, 4: 39%, 5: 120%, 6: 46%. (B) HeLa YFP-LAP2β cells expressing empty vector, IST1R WT, or IST1R 4SA were transfected with NT or IST1 siRNA, and resolution times of intercellular chromatin bridges were quantified in two separate experiments (mean times are 1: 906 min; 2: 965 min: 3: 638 min). (C and D) HeLa cells stably expressing empty vector, IST1R WT, IST1R 4SA, or IST1R 4SE were transfected with the indicated siRNA, fixed and stained with α-Tubulin antibody to visualize cytokinetic defects. Data in (C) are represented as mean percentage of midbody-arrested or multinucleated cells ±SD from three separate experiments. Microscopy images in (D) are representative examples from each sample in (C), shown as merged images of Tubulin (red) and nuclei (blue). ‘Asterisks’ and ‘arrowheads’ denote multinucleated and midbody-connected cells, respectively. Bars = 10 μm. (E) HeLa YFP-Tubulin cells stably expressing empty vector, IST1R WT, IST1R 4SA, or IST1R 4SE were transfected with the indicated siRNA. Live-cell imaging revealed midbody resolution times from two separate experiments (mean times were 1: 97 ± 33 min; 2: 204 ± 95 min; 3: 103 min ±48; 4: 98 ± 38 min; 5: 145 ± 65 min). Cell lysates in (A, B, C, and D) were examined by Western blot using the indicated antibodies. (F) Co-precipitation assay from 293T cells co-transfected with the indicated YFP and GST fusions. 10% of the volume eluted from the beads was analyzed by Western blot with α-YFP antibody to visualize bound proteins and α-GST as a control for pull-down efficiency. α-YFP Western blot on input lysates (top) is representative for all experiments, and empty YFP band was cropped from the same blot. See also Figure 6—figure supplement 1 and Videos 18–22.
Figure 6—figure supplement 1
The IST1 phosphorylation 4SA mutant retains IST1 binding and abscission functions.
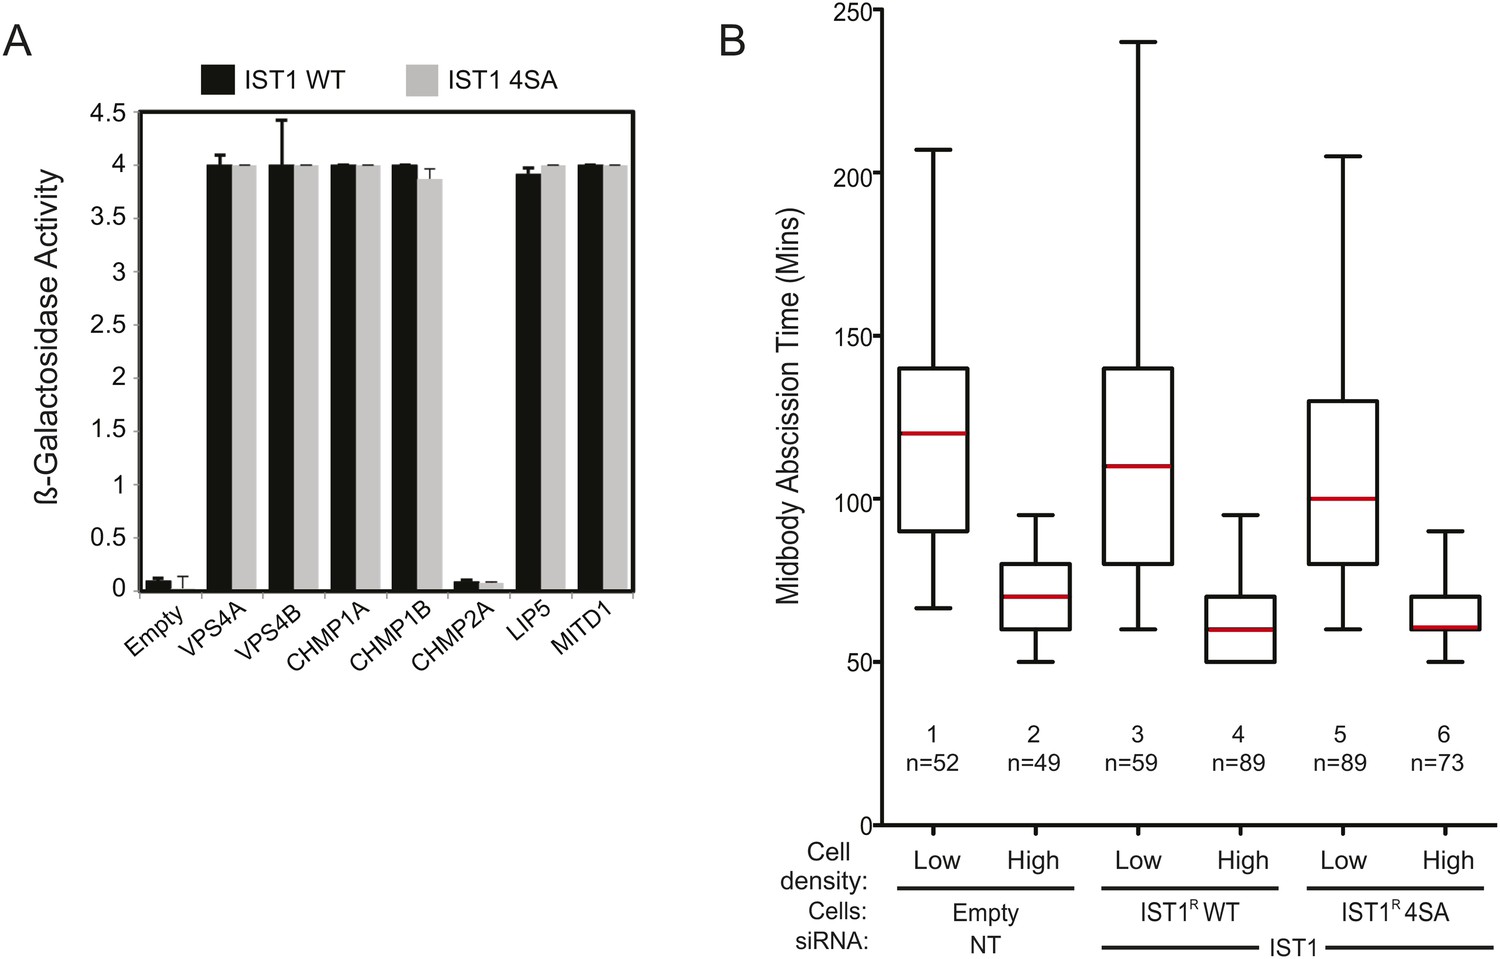
(A) Y2H assays with IST1 WT and IST1 4SA fused to the VP16 activation domain showing binding to VPS4A, VPSP4B, CHMP1A, CHMP1B, LIP5, and MITD1 proteins fused to the Gal4 DNA-binding domain. CHMP2A was used as a negative control. Data are mean β-galactosidase activity ±SD from two separate experiments. (B) Analysis of tension-dependent modulation of abscission time from events in Figure 6D. Mean times from two independent experiments are: 1: 118 ± 38 min; 2: 68 ± 18 min; 3: 122 ± 54 min; 4: 66 ± 17 min; 5: 107 ± 43 min; 6: 65 ± 12 min).
Figure 7 with 1 supplement

ULK3 and CHMP4C are functionally interconnected within the abscission control pathway.
(A) HeLa cells expressing GFP-CHMP4C were transfected with NT, ULK3, or CHMP4C siRNA, fixed and stained with Hoechst and α-Tubulin antibody to visualize multinucleated and cells connected by midbodies. Data are represented as mean percentage of midbody-arrested cells ±SD from three separate experiments. (B) Confocal microscopy of HeLa GFP-CHMP4C cells treated as in (A). Magnifications of the midbody are shown. Data are represented as mean percentage of CHMP4C positive midbodies ±SD from two separate experiments (NT n = 110; ULK3 n = 43; CHMP4C n = 53). Bars = 5 μm. (C) HeLa GFP-CHMP4C cells were stained with α-ULK3 antibody. Panel shows a representative example of GFP-CHMP4C at the Flemming body co-localizing with endogenous ULK3 (94% of cases, n = 31). Merged channels are shown on the right (red: Tubulin, green: GFP, purple: ULK3, blue: nuclei). Magnifications of the midbody are shown for each channel. Bar = 5 μm. (D) HeLa GFP-CHMP4B or GFP-CHMP4C expressing cells were treated as in (A) and imaged live. Midbody resolution times were quantified in three separate experiments (mean times were 1: 106 ± 52 min; 2: 180 ± 114 min; 3: 105 ± 47 min). (E) HeLa cells expressing empty vector or ULK3 WT were transfected with the indicated siRNA, and midbody resolution times were scored in three separate experiments (mean times were 1: 84 ± 34 min; 2: 136 ± 87 min; 3: 110 ± 79 min). n = total number of events analyzed per sample. (F) HeLa cells expressing empty vector or ULK3 WT were treated with 1 μM DMSO or Aurora B inhibitor (ZM447439). Only cells at midbody stage were monitored and imaged live starting at the time of treatment. The time spent in abscission until midbody resolution was analyzed in two separate experiments (mean times were 1: 100 ± 57 min: 2: 171 ± 122 min: 3: 53 ± 41 min: 4: 54 ± 41 min). (G) HeLa cells were treated overnight with media containing DMSO or Nocodazole with or without 1 μM ZM44739 inhibitor. Cell lysates were resolved on 10% Phos-tag gels and analyzed by Western blot. ‘Asterisks’ denote bands corresponding to IST1 phosphorylated species that were sensitive (*) or insensitive (**) to Aurora B inhibition. (H) HeLa cells stably expressing HA-CHMP4CR or HA-CHMP4CRδINS (lacks residues 201–217) were transfected with NT or ULK3 siRNA prior to overnight treatment with media containing DMSO or Nocodazole. HA-CHMP4CR WT or δINS levels were quantified by infrared imaging; data are represented as mean percentage of phosphorylated CHMP4C (P-CHMP4C, higher molecular weight band) vs non-phosphorylated CHMP4C (lower molecular weight) ±SD from three separate experiments. Cell lysates in (A, D-F) were analyzed by Western blot with the indicated antibodies. See also Figure 7—figure supplement 1 and Videos 23–28.
Figure 7—figure supplement 1
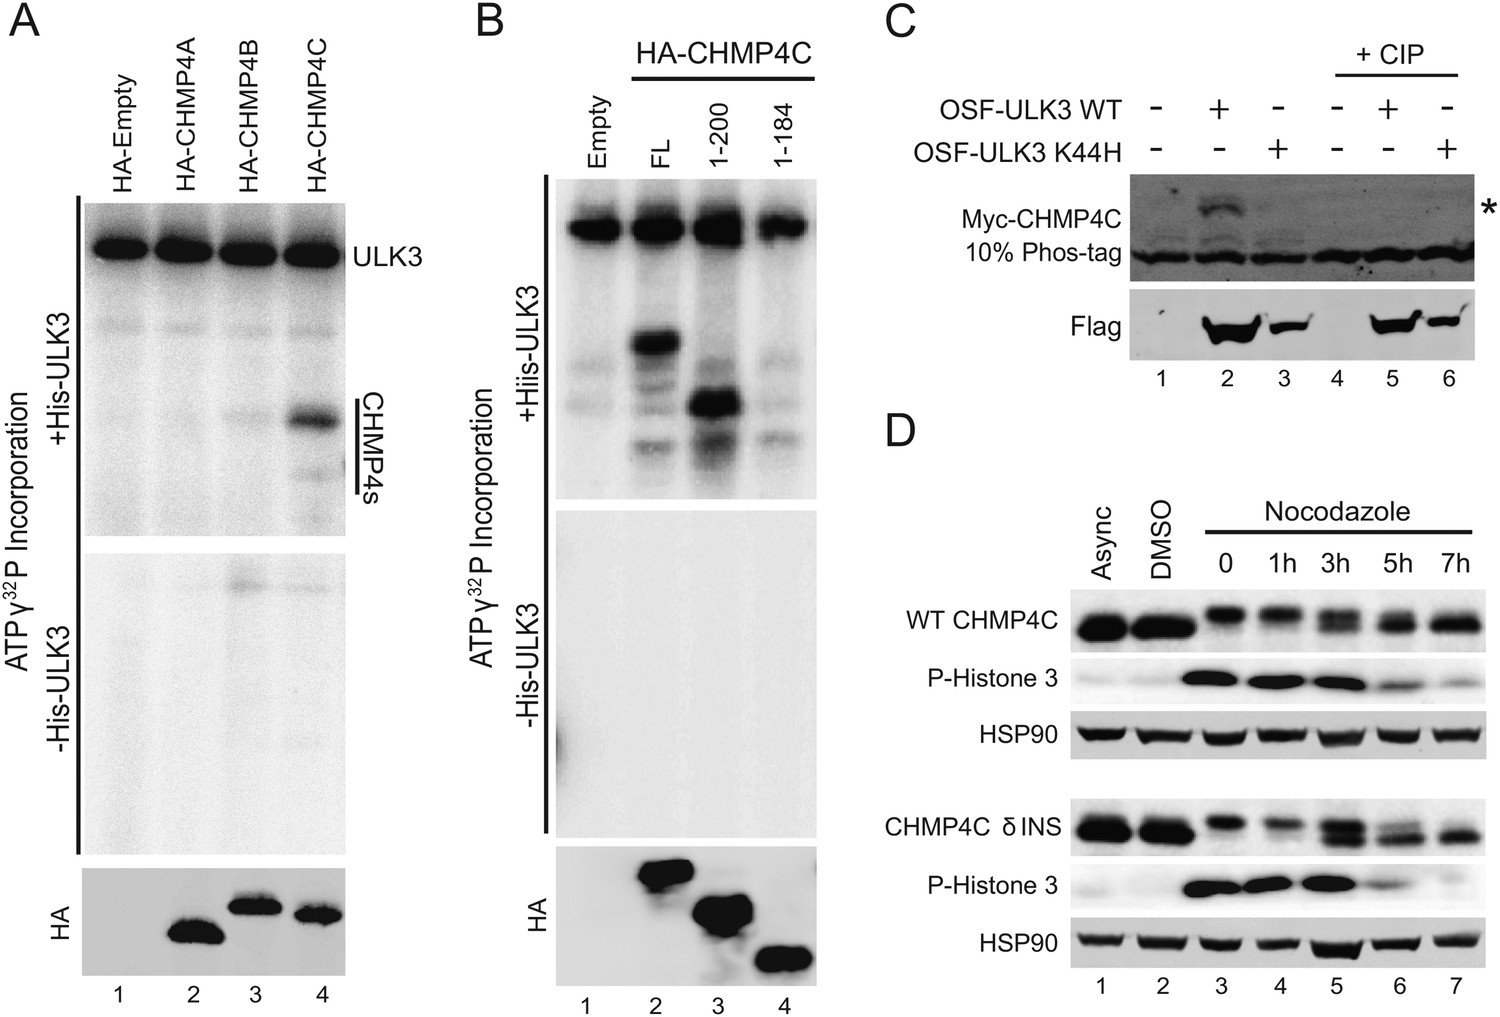
ULK3 phosphorylates CHMP4C.
(A and B) Lysates from 293T cells expressing HA-CHMP4 constructs were immunoprecipitated with α-HA antibodies and subjected to in vitro kinase assays with recombinant ULK3. Incorporated ATP γ32P was visualized by phosphorimaging (upper panels), and CHMP4 proteins were detected by Western blotting (lower panels). CHMP4C truncations used in (B) are described in the text. (C) Same experiment as in Figure 5B and Figure 5—figure supplement 1A in which 293T cells were co-transfected with expression constructs for CHMP4C-Myc and either an empty vector or expression constructs for OSF-ULK3 or OSF-ULK3 K44H, and lysates were run on a 10% Phos-tag gel to separate phosphoproteins. The ‘asterisk’ denotes the band corresponding to phosphorylated CHMP4C. (D) HeLa cells stably expressing siRNA-resistant HA-CHMP4CR or HA-CHMP4CRδINS (lacks residues 201–217) constructs were treated overnight with media containing vehicle dimethyl sulfoxide (DMSO) or nocodazole to induce mitotic arrest. Cells were rinsed with PBS, released into complete DMEM, and lysed at the specified times (0, 1 hr, 3 hr, 5 hr, and 7 hr). Cell lysates were examined by Western blot with α-HA, α-P-Histone 3 (as a marker of mitotic entry) and α-HSP90 antibodies.
Author response image 1
Author response image 2

Videos
Video 1
Representative example of asynchronous HeLa mCherry-Tubulin cells treated with non-targeting (NT) siRNA.
Midbody resolution is indicated with an arrow. Abscission time is 90 min. Related to Figure 2 and Figure 2—figure supplement 1.
Video 2
Representative example of asynchronous HeLa mCherry-Tubulin cells treated with ULK3 siRNA.
Midbody resolution is indicated with an arrow. Abscission time is 60 min. Related to Figure 2 and Figure 2—figure supplement 1.
Video 3
Representative example of asynchronous HeLa mCherry-Tubulin cells treated with ULK3 siRNA.
Midbody resolution is indicated with an arrow. Abscission time is 60 min. Related to Figure 2 and Figure 2—figure supplement 1.
Video 4
Representative example of asynchronous HeLa cells stably expressing YFP-LAP2β transfected with NT siRNA.
Chromatin bridge resolution time is 510 min. Bridge resolution is indicated with an arrow. Related to Figure 2 and Figure 2—figure supplement 2.
Video 5
Representative example of asynchronous HeLa cells stably expressing YFP-LAP2β transfected with ULK3 siRNA.
Chromatin bridge resolution time is 110 min. Bridge resolution is indicated with an arrow. Related to Figure 2 and Figure 2—figure supplement 2.
Video 6
Representative example of asynchronous HeLa cells stably expressing YFP-LAP2β and mCherry-Tubulin, containing an intercellular chromatin bridge that resolves in 850 min when the daughter cells faithfully divide.
Bridge resolution is indicated with an arrow. Related to Figure 2—figure supplement 2.
Video 7
Representative example of asynchronous HeLa cells stably expressing YFP-LAP2β and mCherry-Tubulin, containing an intercellular chromatin bridge that does not resolve and the cleavage furrow regresses.
Related to Figure 2—figure supplement 2.
Video 8
Representative example of low-density asynchronous HeLa mCherry-Tubulin cells treated with NT siRNA.
Midbody resolution is indicated with an arrow. Abscission time is 170 min. Related to Figure 2.
Video 9
Representative example of high-density asynchronous HeLa mCherry-Tubulin cells treated with NT siRNA.
Midbody resolution is indicated with an arrow. Abscission time is 60 min. Related to Figure 2.
Video 10
Representative example of low-density asynchronous HeLa mCherry-Tubulin cells treated with ULK3 siRNA.
Midbody resolution is indicated with an arrow. Abscission time is 60 min. Related to Figure 2.
Video 11
Representative example of high-density asynchronous HeLa mCherry-Tubulin cells treated with ULK3 siRNA.
Midbody resolution is indicated with an arrow. Abscission time is 60 min. Related to Figure 2.
Video 12
Representative example of asynchronous HeLa cells stably expressing mCherry-Tubulin and ULK3 V338D.
Midbody resolution is indicated with an arrow. Abscission time is 80 min. Related to Figure 3.
Video 13
Representative example of asynchronous HeLa cells stably expressing mCherry-Tubulin and ULK3 M434D.
Midbody resolution is indicated with an arrow. Abscission time is 70 min. Related to Figure 3.
Video 14
Representative example of asynchronous HeLa cells stably expressing mCherry-Tubulin and ULK3 K44H.
Midbody resolution is indicated with an arrow. Abscission time is 80 min. Related to Figure 3.
Video 15
Representative example of asynchronous HeLa cells stably expressing mCherry-Tubulin and empty vector.
Midbody resolution is indicated with an arrow. Abscission time is 100 min. Related to Figure 3.
Video 16
Representative example of asynchronous HeLa cells stably expressing mCherry-Tubulin and ULK3 WT.
Midbody resolution is indicated with an arrow. Abscission time is 160 min. Related to Figure 3.
Video 17
Representative example of asynchronous HeLa cells stably expressing mCherry-Tubulin and ULK3 WT.
Midbody resolution is indicated with an arrow. Abscission time is 290 min. Related to Figure 3.
Video 18
Representative example of asynchronous HeLa cells stably expressing YFP-Tubulin and empty vector transfected with NT siRNA.
Midbody resolution is indicated with an arrow. Abscission time is 90 min. Related to Figure 6.
Video 19
Representative example of asynchronous HeLa cells stably expressing YFP-Tubulin and empty vector transfected with IST1 siRNA.
Midbody resolution is indicated with an arrow. Abscission time is 190 min. Related to Figure 6.
Video 20
Representative example of asynchronous HeLa cells stably expressing YFP-Tubulin and siRNA-resistant IST1 (IST1R) WT transfected with IST1 siRNA.
Midbody resolution is indicated with an arrow. Abscission time is 90 min. Related to Figure 6.
Video 21
Representative example of asynchronous HeLa cells stably expressing YFP-Tubulin and IST1R 4SA transfected with IST1 siRNA.
Midbody resolution is indicated with an arrow. Abscission time is 90 min. Related to Figure 6.
Video 22
Representative example of asynchronous HeLa cells stably expressing YFP-Tubulin and IST1R 4SE transfected with IST1 siRNA.
Midbody resolution is indicated with an arrow. Abscission time is 180 min. Related to Figure 6.
Video 23
Representative example of asynchronous HeLa cells stably expressing GFP-CHMP4B and mCherry-Tubulin transfected with NT siRNA.
Midbody resolution is indicated with an arrow. Abscission time is 110 min. Related to Figure 7.
Video 24
Representative example of asynchronous HeLa cells stably expressing GFP-CHMP4C and mCherry-Tubulin transfected with NT siRNA.
Midbody resolution is indicated with an arrow. Abscission time is 140 min. Related to Figure 7.
Video 25
Representative example of asynchronous HeLa cells stably expressing GFP-CHMP4C and mCherry-Tubulin transfected with ULK3 siRNA.
Midbody resolution is indicated with an arrow. Abscission time is 80 min. Related to Figure 7.
Video 26
Representative example of asynchronous HeLa cells stably expressing mCherry-Tubulin and empty vector transfected with NT siRNA.
Midbody resolution is indicated with an arrow. Abscission time is 80 min. Related to Figure 7.
Video 27
Representative example of asynchronous HeLa cells stably expressing mCherry-Tubulin and ULK3 transfected with NT siRNA.
Midbody resolution is indicated with an arrow. Abscission time is 120 min. Related to Figure 7.
Video 28
Representative example of asynchronous HeLa cells stably expressing mCherry-Tubulin and ULK3 transfected with CHMP4C siRNA.
Midbody resolution is indicated with an arrow. Abscission time is 90 min. Related to Figure 7.
Additional files
-
Supplementary file 1
Supplementary information. Includes list of plasmids used in this study, siRNA sequences, primary antibodies, stable cell lines used in this study.
- https://doi.org/10.7554/eLife.06547.046
Download links
A two-part list of links to download the article, or parts of the article, in various formats.
Downloads (link to download the article as PDF)
Open citations (links to open the citations from this article in various online reference manager services)
Cite this article (links to download the citations from this article in formats compatible with various reference manager tools)
ULK3 regulates cytokinetic abscission by phosphorylating ESCRT-III proteins
eLife 4:e06547.
https://doi.org/10.7554/eLife.06547


