Coordination of peptidoglycan synthesis and outer membrane constriction during Escherichia coli cell division
- University of California, San Francisco, United States
- Newcastle University, United Kingdom
- University of Utrecht, The Netherlands
- University of Amsterdam, The Netherlands
- Stanford University, United States
- European Molecular Biology Laboratory Heidelberg, Germany
- Stanford University School of Medicine, United States
- Université Grenoble Alpes, France
Figures
Figure 1
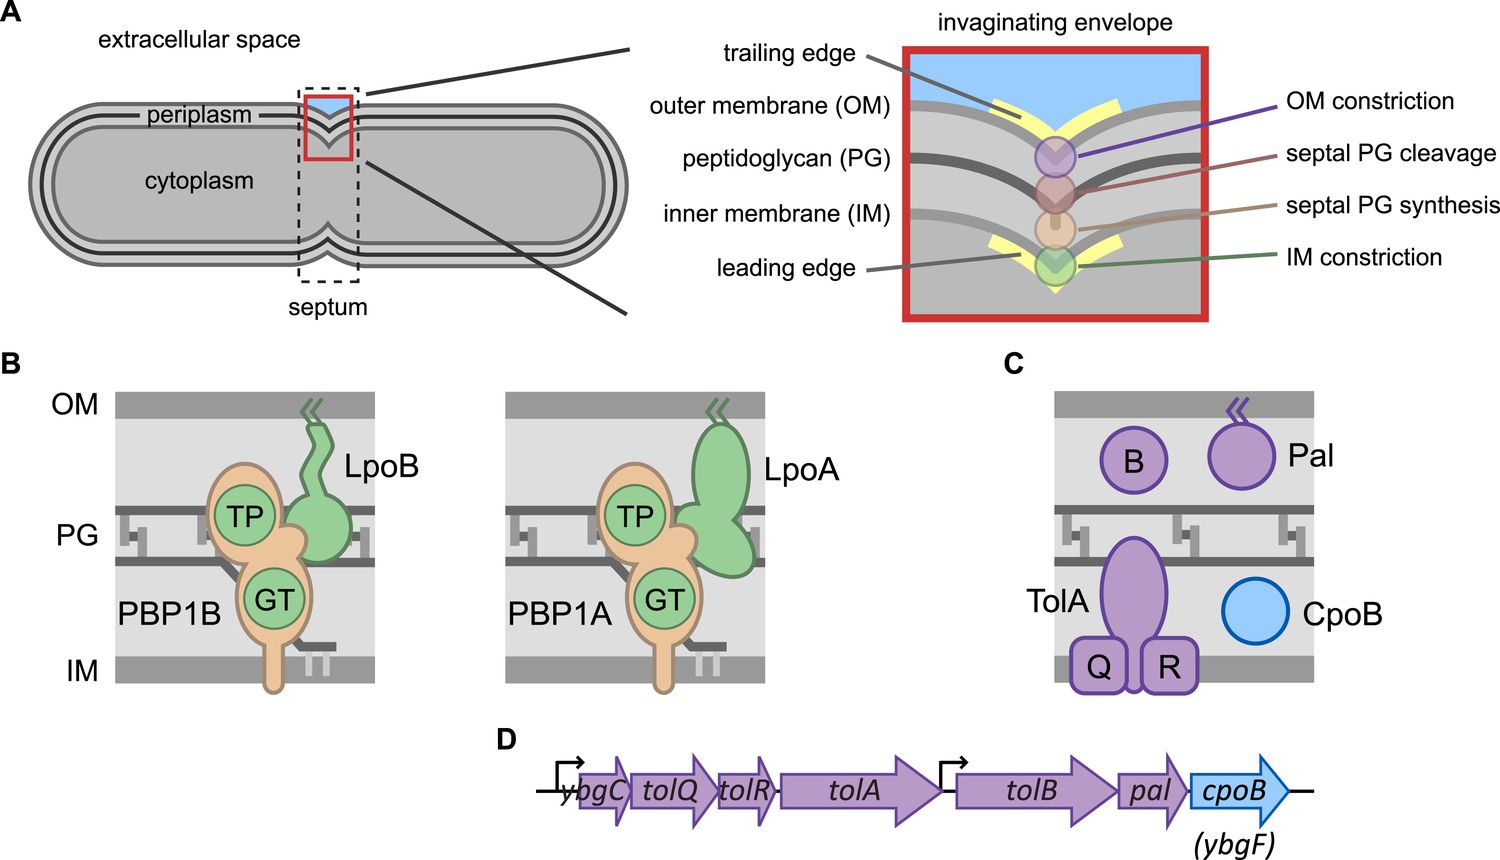
Envelope constriction in Gram-negative bacteria and related protein machines.
(A) Illustration of the tripartite Gram-negative cell envelope. In zoom (right), processes involved in envelope constriction. (B) Major bifunctional PG synthases of E. coli, capable of both glycan strand elongation (glycosyltransferase activity, GT) and peptide cross-linking (transpeptidase activity, TP). The IM-localized synthases are activated by cognate regulatory OM lipoproteins. (C) Proteins encoded by the tol-pal operons (D).
Figure 2 with 4 supplements
Shared chemical sensitivities and genetic interactions implicate CpoB in PBP1B function.
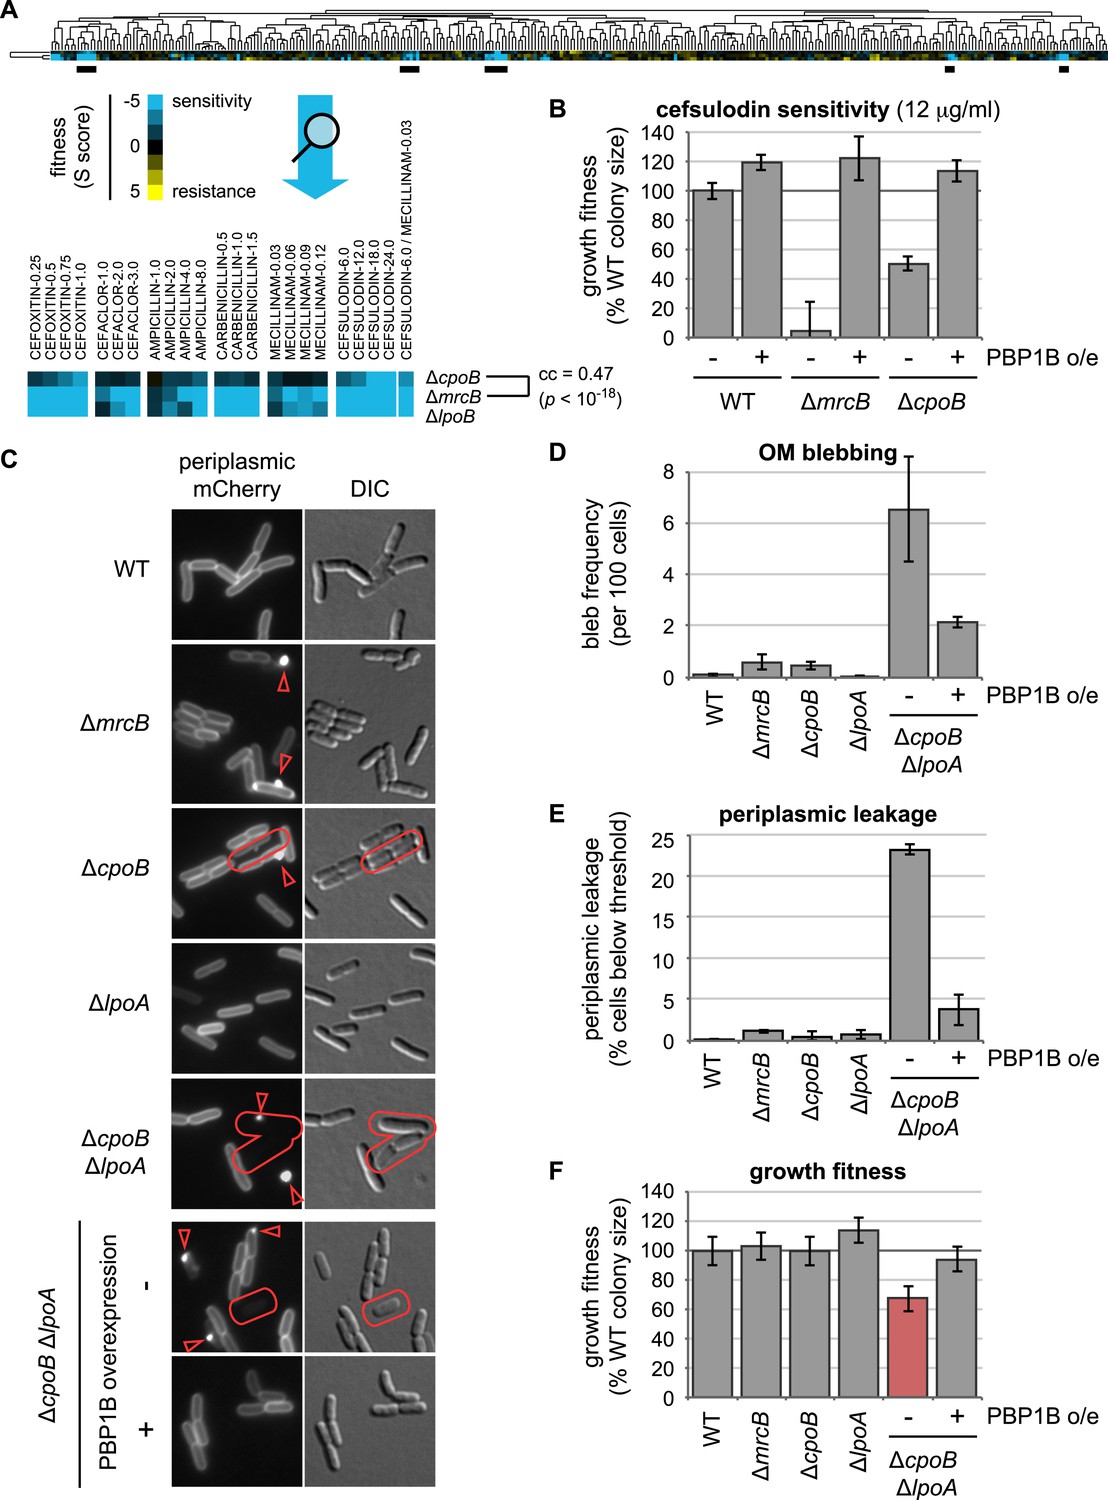
(A) Chemical genetic phenotype profiles for strains lacking PBP1B (encoded by mrcB), LpoB, and CpoB, from hierarchical clustering of the growth fitnesses of 3979 gene deletions across 324 chemical stress conditions (Nichols et al., 2011). Blue, low fitness (sensitivity); yellow, high fitness (resistance). ΔmrcB and ΔcpoB (ΔybgF) showed significant similarity. Underlined regions correspond to strongest shared sensitivities and are magnified below the full profile. (B) Sensitivity of ΔcpoB to cefsulodin, predominantly an inhibitor of PBP1A, is alleviated by PBP1B overexpression. Growth fitness was assessed by pinning cells to agar plates in a 1536-spot format and quantifying colony size after 12–14 hr of growth. Error bars depict standard deviations (n ≥ 44). (C) CpoB-associated envelope defects visualized by fluorescence microscopy using periplasmic mCherry. Arrowheads, fluorescent foci indicating OM blebs or vesicles; outlines, loss of peripheral fluorescence due to periplasmic leakage. (D) and (E). Quantification of microscopy phenotypes: (D) OM blebbing, and (E) loss of periplasmic fluorescence, indicative of periplasmic leakage. Threshold value was established based on quantification of cells with known severe OM defects (ΔtolA). Cells lacking CpoB exhibited envelope defects that were severely exacerbated in the absence of LpoA and alleviated by PBP1B overexpression. (F) Quantification of growth fitness for indicated mutant strains. A strain lacking CpoB and LpoA exhibited a synthetic growth defect that was alleviated by PBP1B overexpression.
Figure 2—figure supplement 1
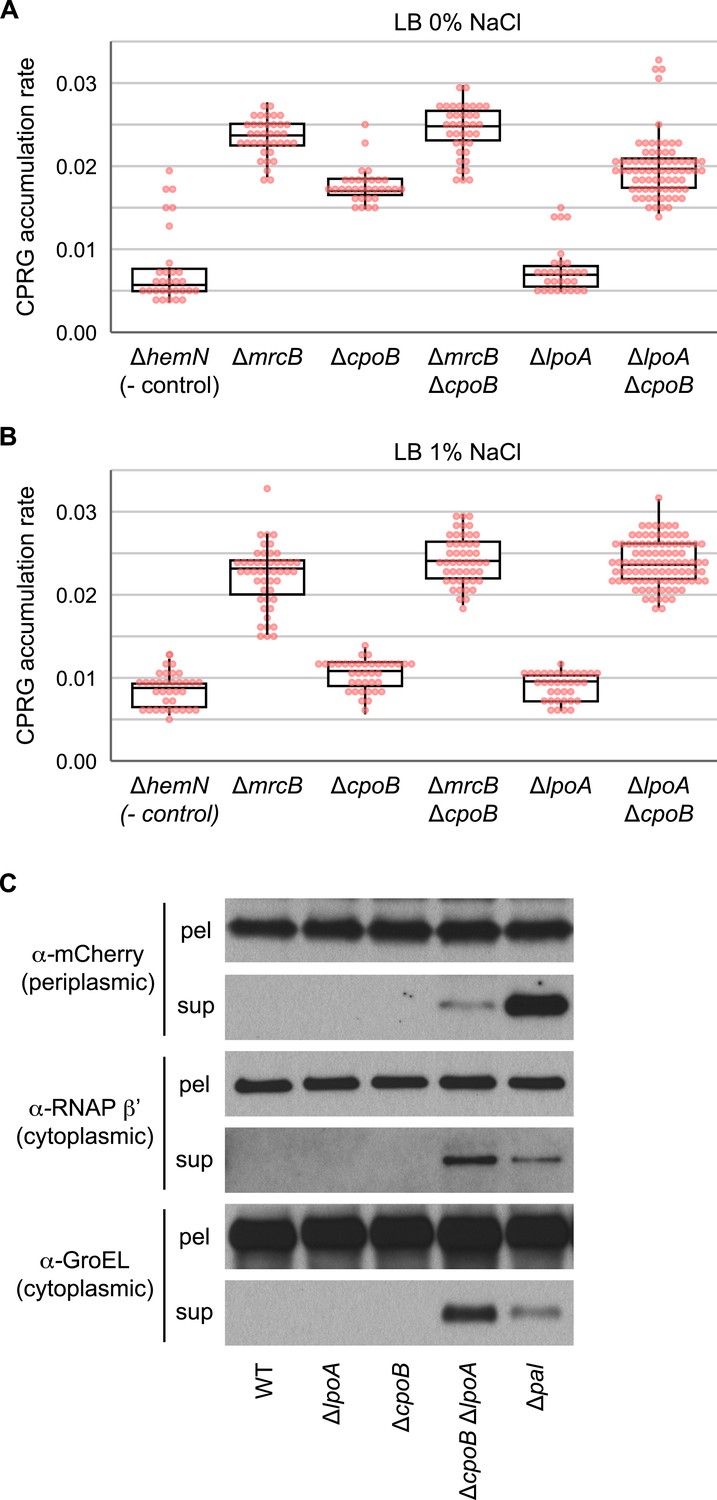
Elevated cell lysis in cells lacking PBP1B or CpoB; loss of LpoA exacerbates lysis in the absence of CpoB.
(A) and (B) Increased cell envelope lysis or permeability measured by a CPRG assay (Paradis-Bleau et al., 2014) at different salt concentrations. The colorless LacZ substrate CPRG cannot enter intact cells, where it would yield red CPR, unless the envelope is severely compromised or the cells lyse. Assay was performed on agar plates, on which mutants were arrayed robotically in a 384-colony format (Paradis-Bleau et al., 2014). Box plots of rate of accumulation of CPR color are shown (n > 32); rates are more sensitive and robust compared to end-point measurements. Box corresponds to 25–75% (IQR). Both ΔmrcB and ΔcpoB mutants exhibit elevated cell lysis, but the effect is not additive. As the double ΔmrcB ΔcpoB mutant phenocopies the single ΔmrcB mutant, we deduce that PBP1B is epistatic to CpoB. In contrast, CpoB and LpoA appear to work in redundant pathways, as the double ΔlpoA ΔcpoB mutant exhibits much stronger cell lysis than either of the parental mutants. (C) A ΔlpoA ΔcpoB mutant exhibits periplasmic leakage and lysis during growth. Immunodetection of periplasmic (mCherryperi, α-mCherry) and cytoplasmic (RNA polymerase β' subunit, α-RNAP β'; GroEL) cell contents in filtered culture supernatants (sup) vs pelleted cells (pel); presence of mCherry in sup indicates periplasmic leakage; presence of RNAP β' and GroEL in sup indicates lysis.
Figure 2—figure supplement 2

Complementation of ΔcpoB phenotypes.
(A) Expression of CpoB in trans complements ΔcpoB cefsulodin sensitivity (see Figure 2B). (B) Expression of CpoB in trans complements the ΔcpoB ΔlpoA double mutant growth defect (see Figure 2F).
Figure 2—figure supplement 3
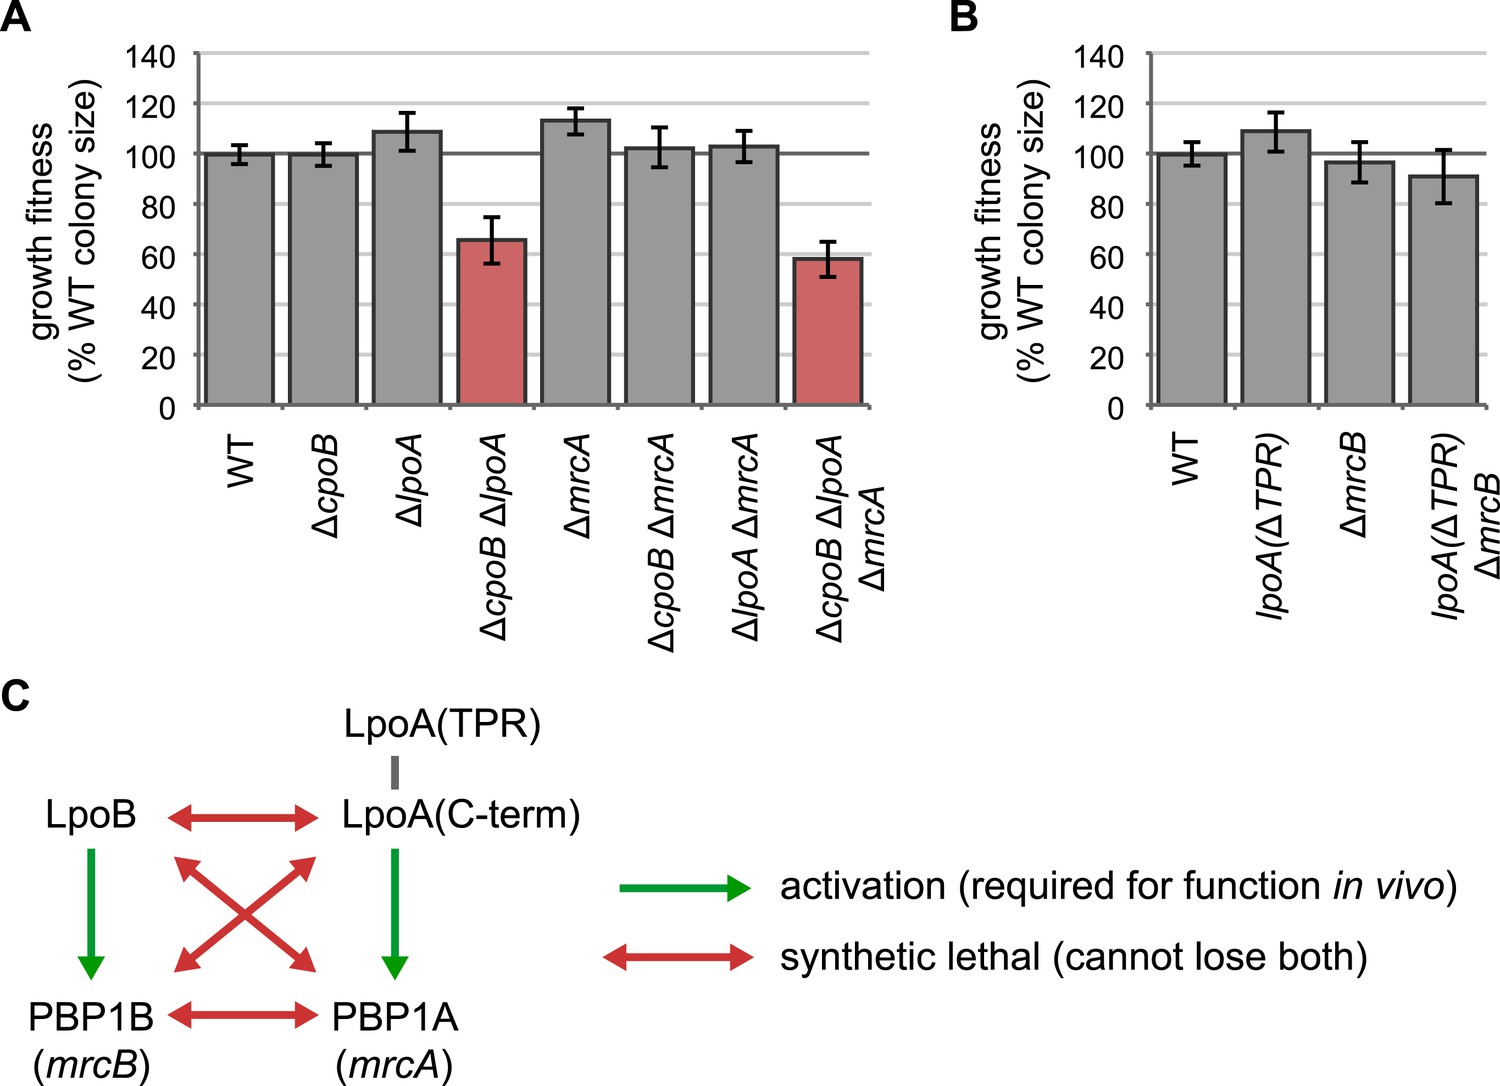
LpoA encodes a second function, and the LpoA TPR domain is dispensable for PBP1A activation.
(A) and (B) Quantification of growth fitness for indicated mutant strains (see Figure 2F). (A) A strain lacking CpoB and LpoA exhibited a synthetic growth defect, but a strain lacking CpoB and PBP1A (encoded by mrcA) did not. A triple ΔcpoB ΔlpoA ΔmrcA mutant also showed a growth defect, indicating that the growth defect of the ΔcpoB ΔlpoA double mutant is not caused by PBP1A malfunction. (B) The LpoA TPR domain is dispensable for PBP1A activation. Lack of PBP1B (encoded by mrcB) and LpoA is synthetic lethal because PBP1A requires activation by LpoA; however a strain lacking PBP1B and the LpoA TPR domain shows no fitness defect. (C) Summary of genetic relationships.
Figure 2—figure supplement 4
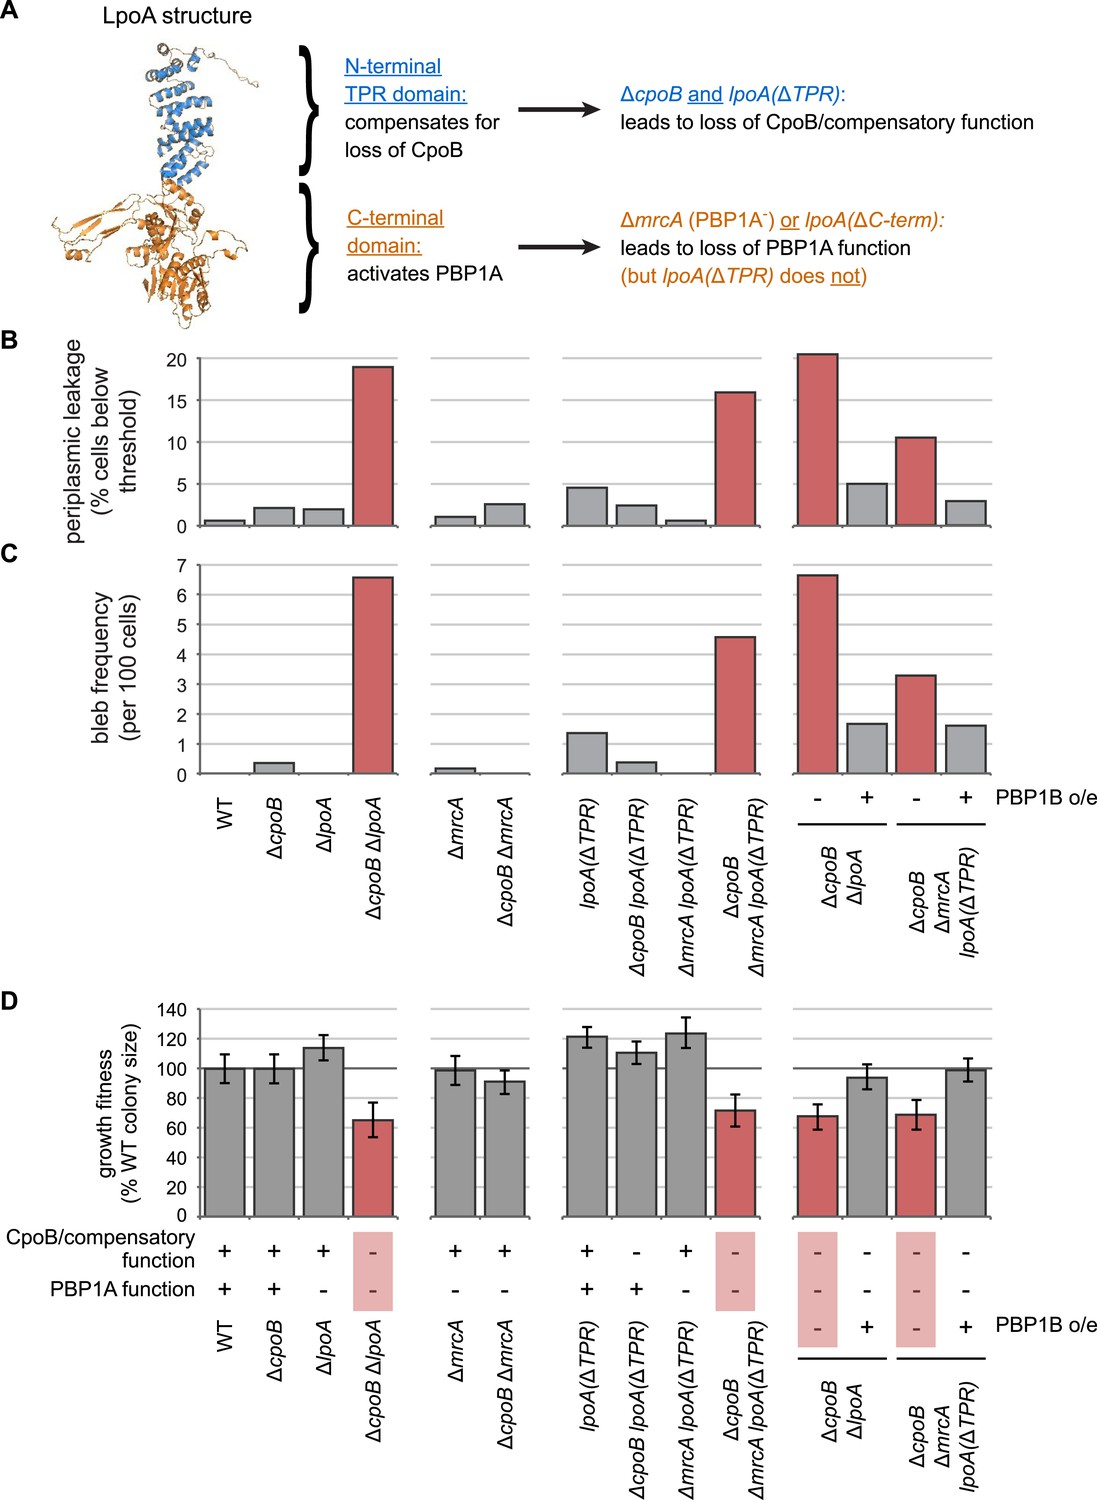
The N-terminal TPR domain of LpoA encodes a novel function that compensates for loss of CpoB.
(A) Structure of LpoA (Jean et al., 2014) and summary of domain functions. The C-terminal domain is required for PBP1A activation; the N-terminal TPR domain is dispensable for PBP1A activation (Figure 2—figure supplement 3B) but required for a second, CpoB-related function. (B) and (C) Quantification of microscopy phenotypes (see Figure 2D, E). (B) OM blebbing. (C) Loss of periplasmic fluorescence, indicative of periplasmic leakage. (D) Quantification of growth fitness for indicated mutant strains (see Figure 2F). CpoB/compensatory function: +, strains that possess either CpoB, the compensatory function of the LpoA TPR domain, or both; −, strains that lack both. PBP1A function: +, strains that possess both PBP1A and the LpoA C-terminal domain, which is required for PBP1A activation in vivo; −, strains that lack one or both. A ΔcpoB ΔmrcA lpoA(ΔTPR) triple mutant lacks both CpoB/compensatory function and PBP1A function, and thus recapitulates the envelope and growth defects of the ΔcpoB ΔlpoA mutant.
Figure 3
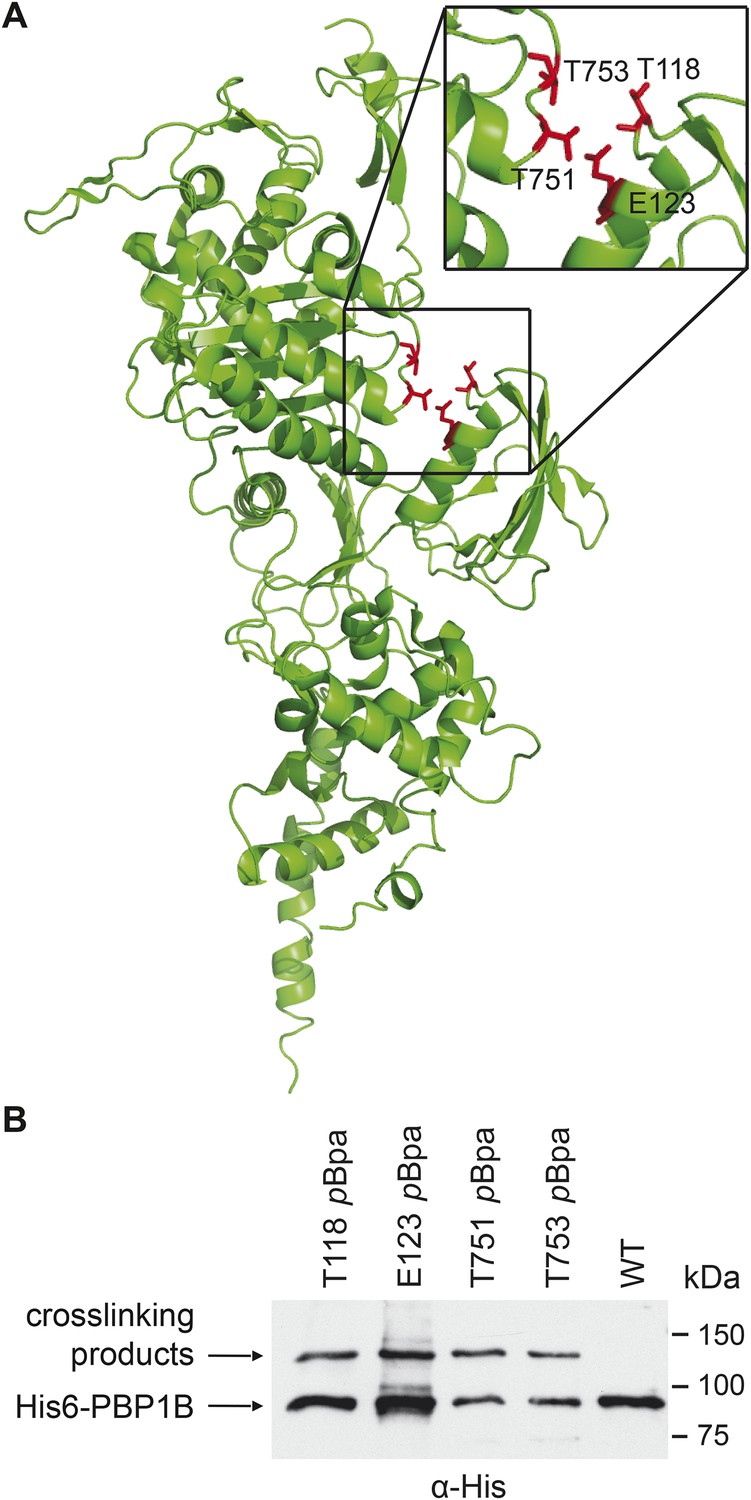
PBP1B interacts with CpoB in vivo.
(A) Photo-cross-linkable amino acid (pBpa) substitutions at the indicated positions in His6-PBP1B, lining a cleft between the TPase and UB2H domains, formed similar UV cross-linking products in vivo. (B) SDS-PAGE and α-His6 immunoblot analysis revealed a cross-linked adduct ∼120 kDa in size (MW of PBP1Bγ = 88.9 kDa). Analysis of the products by mass spectrometry revealed the presence of CpoB (MW = 28.2 kDa) cross-linked to PBP1B at each indicated position.
Figure 4 with 5 supplements
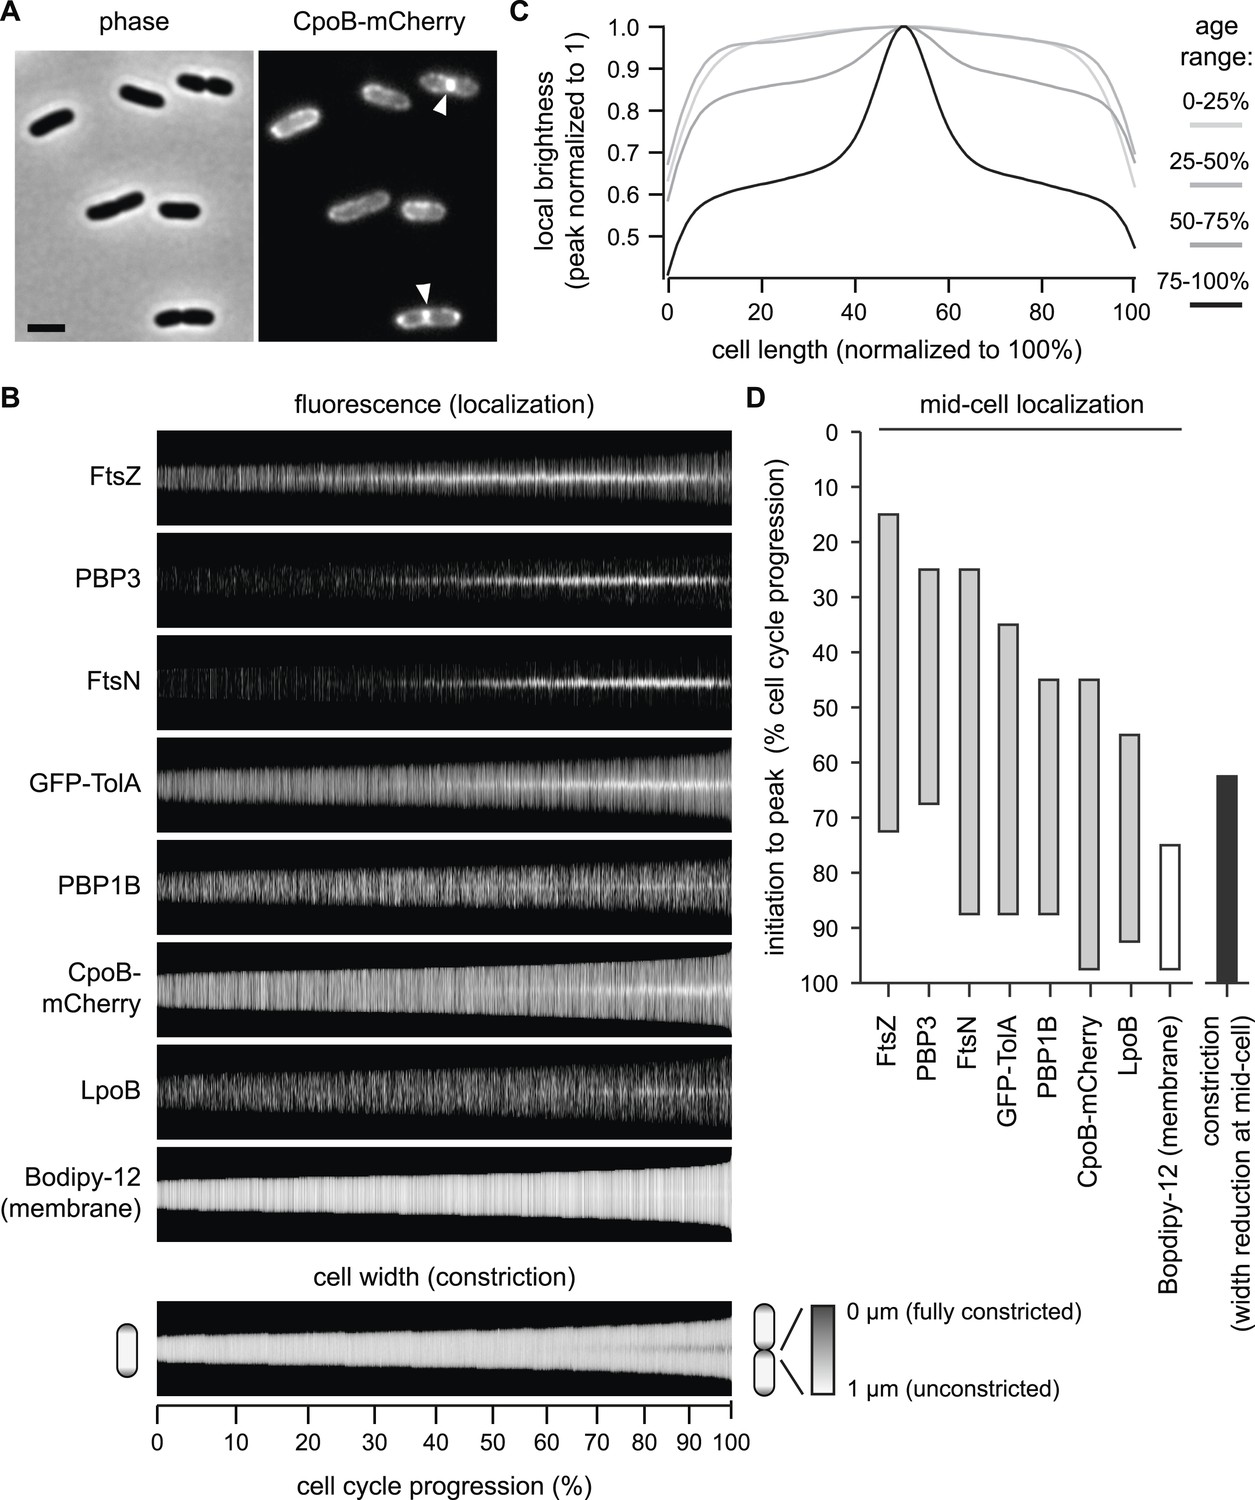
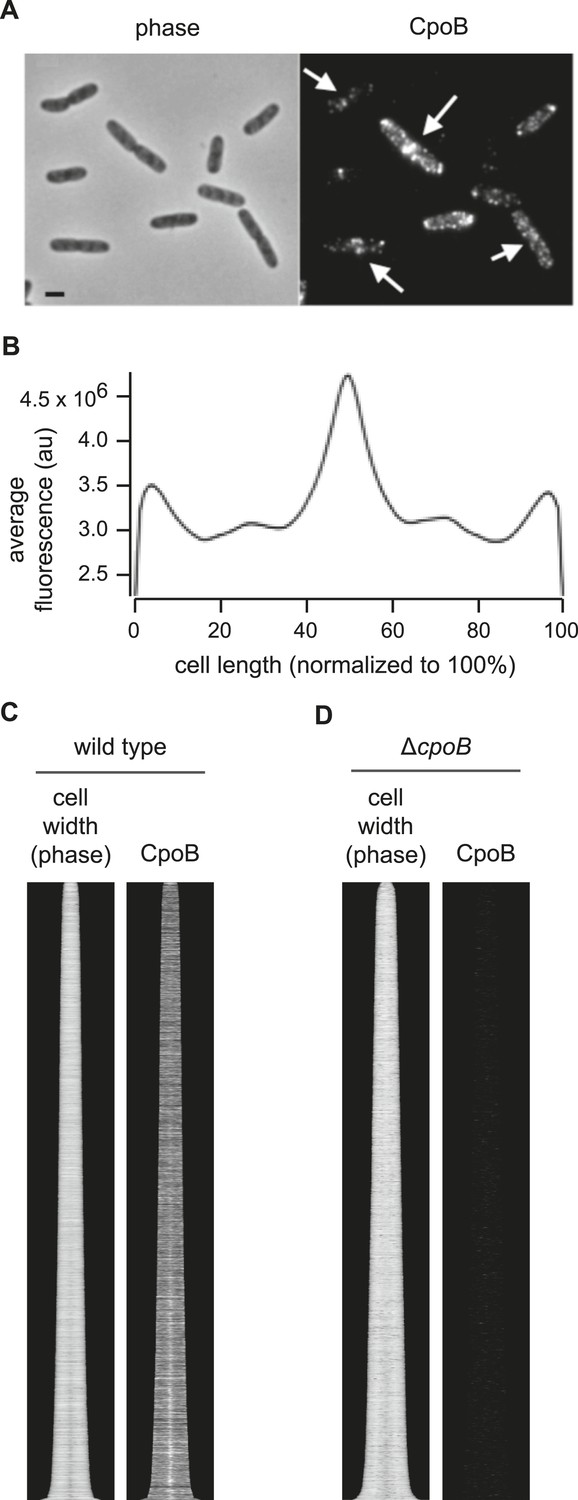
CpoB localizes to mid-cell concurrent with PBP1B, TolA, and the onset of OM constriction.
(A) Endogenously expressed CpoB-mCherry localizes to mid-cell during cell division. Left, phase contrast image; right, mCherry fluorescence; scale bar, 2 μm. (B) Localization of CpoB-mCherry as a function of cell cycle progression (cell length), with comparison to other proteins. PBP1B, LpoB, FtsZ, PBP3, and FtsN were visualized by immunofluorescence using specific antibodies. Cell membranes were stained with Bodipy-12. Cell width (diameter) was measured from phase contrast images; constant brightness along the length of the cell indicates constant diameter, and darkening at mid-cell in longer cells indicates constriction. To generate profile maps for each protein, fluorescence intensity profiles (integrated fluorescence as a function of cell length) were derived for >1000 individual cell images and sorted vertically by cell length. Each horizontal line corresponds to a single cell. Y-axis scale indicates % cell-cycle progression based on cell length. Data for FtsZ, PBP3, FtsN, and cell width have been previously published (van der Ploeg et al., 2013) and are used here for comparisons. (C) Average distribution of CpoB-mCherry for different cell-cycle progression age groups. Fluorescence intensity profiles were normalized by length, then averaged and normalized to the peak local brightness for each age group. (D) Relative timing of mid-cell recruitment for each examined protein. Initiation is based on the onset of enriched localization at mid-cell (quantified in Figure 4—figure supplement 3A,B and van der Ploeg et al., 2013). Peak is the point in the division cycle when maximal localization is reached.
Figure 4—figure supplement 1
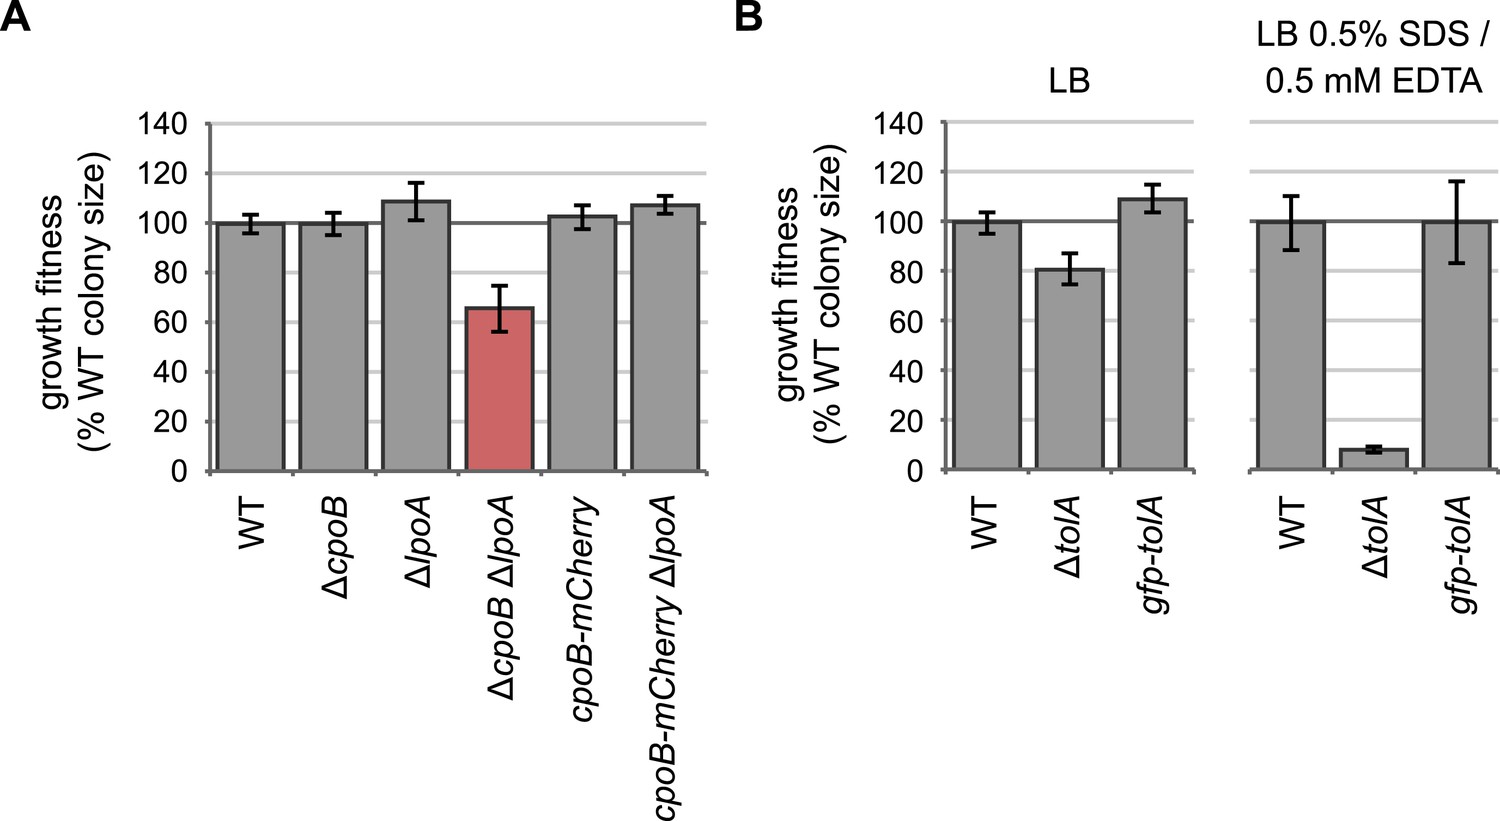
Endogenously-encoded CpoB-mCherry and GFP-TolA fusion proteins are functional.
(A) and (B) Quantification of growth fitness for indicated strains (see Figure 2B, F). The native chromosomal copy of cpoB was replaced with cpoB-mCherry to allow endogenous expression of the mCherry fusion. A ΔcpoB ΔlpoA strain exhibits a severe growth defect, whereas a cpoB-mCherry ΔlpoA strain shows no defect, indicating that the CpoB-mCherry fusion is functional. (B) The native chromosomal copy of tolA was replaced with gfpmut2-tolA to allow endogenous expression of the GFP fusion. A ΔtolA strain was extremely sensitive to 0.5% SDS and 0.5 mM EDTA (envelope stress), while the gfp-tolA strain showed no defect, indicating that the GFP-TolA fusion is functional.
Figure 4—figure supplement 2
CpoB localizes to mid-cell.
(A) WT cells immunolabeled with antibody to CpoB. (B) Average distribution of CpoB along the length of the cell (see Figure 4C). (C) Localization of CpoB as a function of cell cycle progression (see Figure 4B). (D) Antibody to CpoB is specific. Image and profile map of ΔcpoB cells immunolabeled with antibody to CpoB; no appreciable fluorescence signal is observed.
Figure 4—figure supplement 3
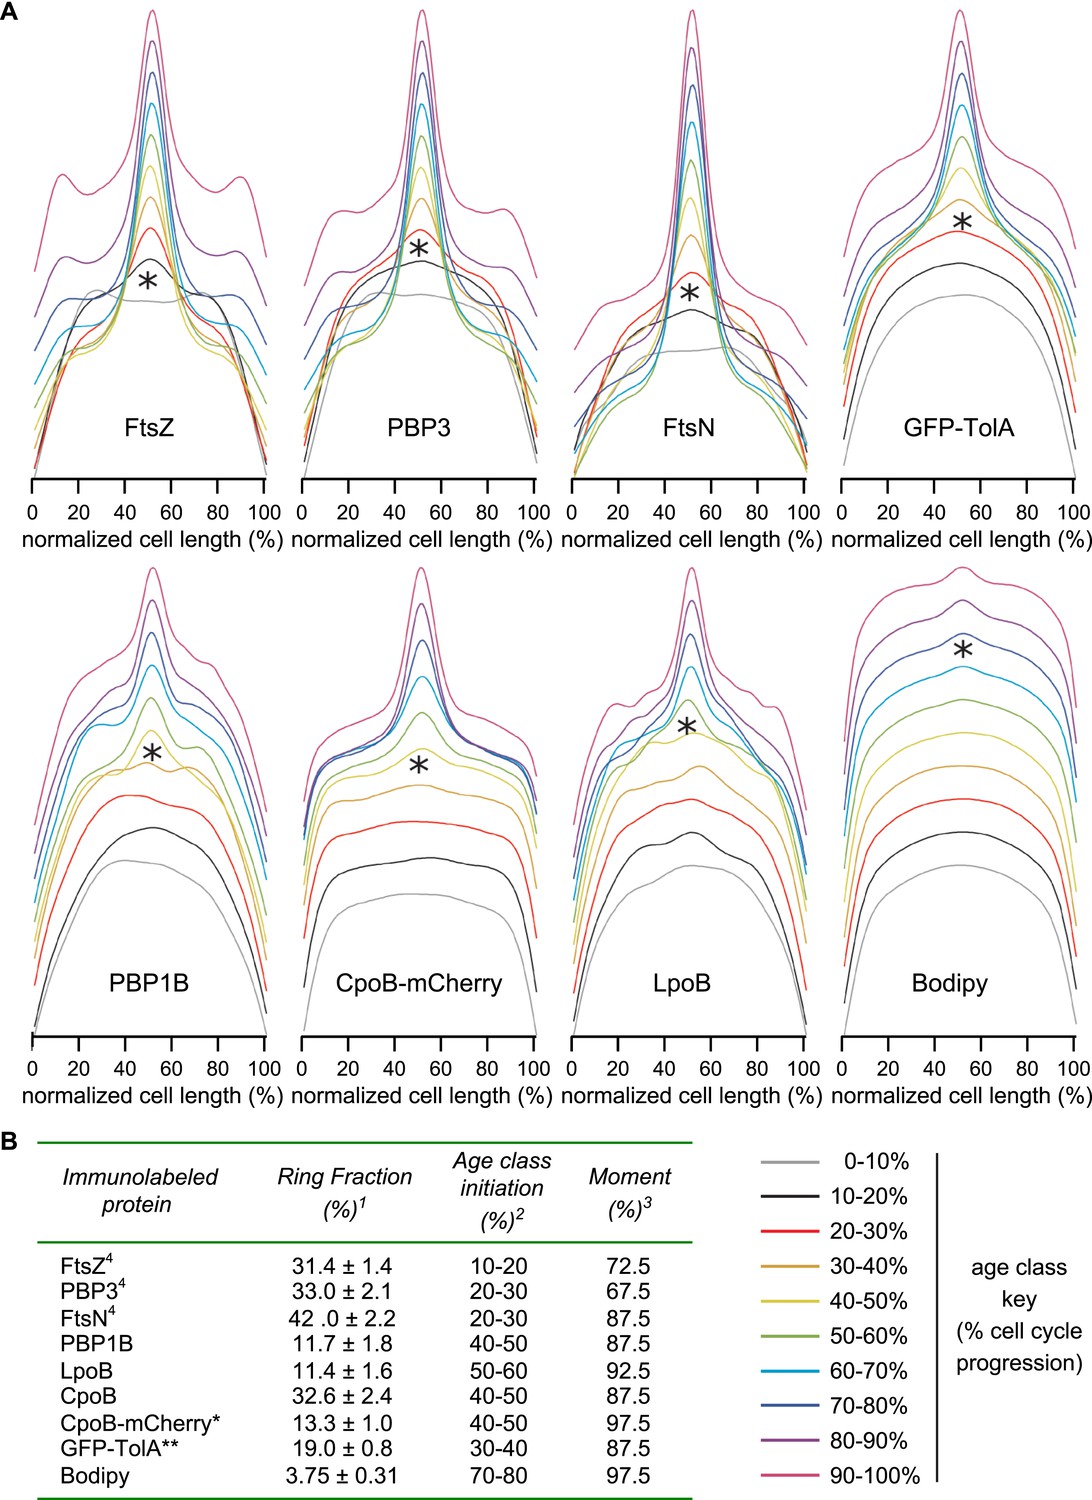
Timing of localization to mid-cell for CpoB-mCherry, GFP-TolA, and PBP1B, with comparison to divisome proteins FtsZ, PBP3, and FtsN.
(A) Average distribution of indicated cell division proteins for different cell-cycle progression age groups (see Figure 4C and key, bottom-right). Profiles of the 10 age classes for each protein have been offset equally to facilitate comparison and minimize overlap. Each age group contains 300–500 cells. *Age class when increased localization at mid-cell was first observed. (B) Localization summary table. 1Ring fraction, the amount of mid-cell fluorescence in a rectangle of 0.8 μm divided by the total fluorescence in the cell at the time point corresponding to the moment. 2Initiation, the time point in the division cycle where the fluorescence at mid cell starts to increase as determined from the collective profiles in age classes of 10% (Figure 4—figure supplement 3A). 3Moment, the time point in the cell cycle when mid-cell fluorescence is highest. 4Data from van der Ploeg et al. (2013). *CpoB-mCherry was used instead of immunolabeling so as to allow live-cell imaging; we have found that freely diffusing periplasmic proteins in cells grown in minimal medium do not retain their original localization following fixation, likely due to osmotic effects. **GFP-TolA was used because the quality of available TolA antiserum was not sufficient for reliable labeling.
Figure 4—figure supplement 4
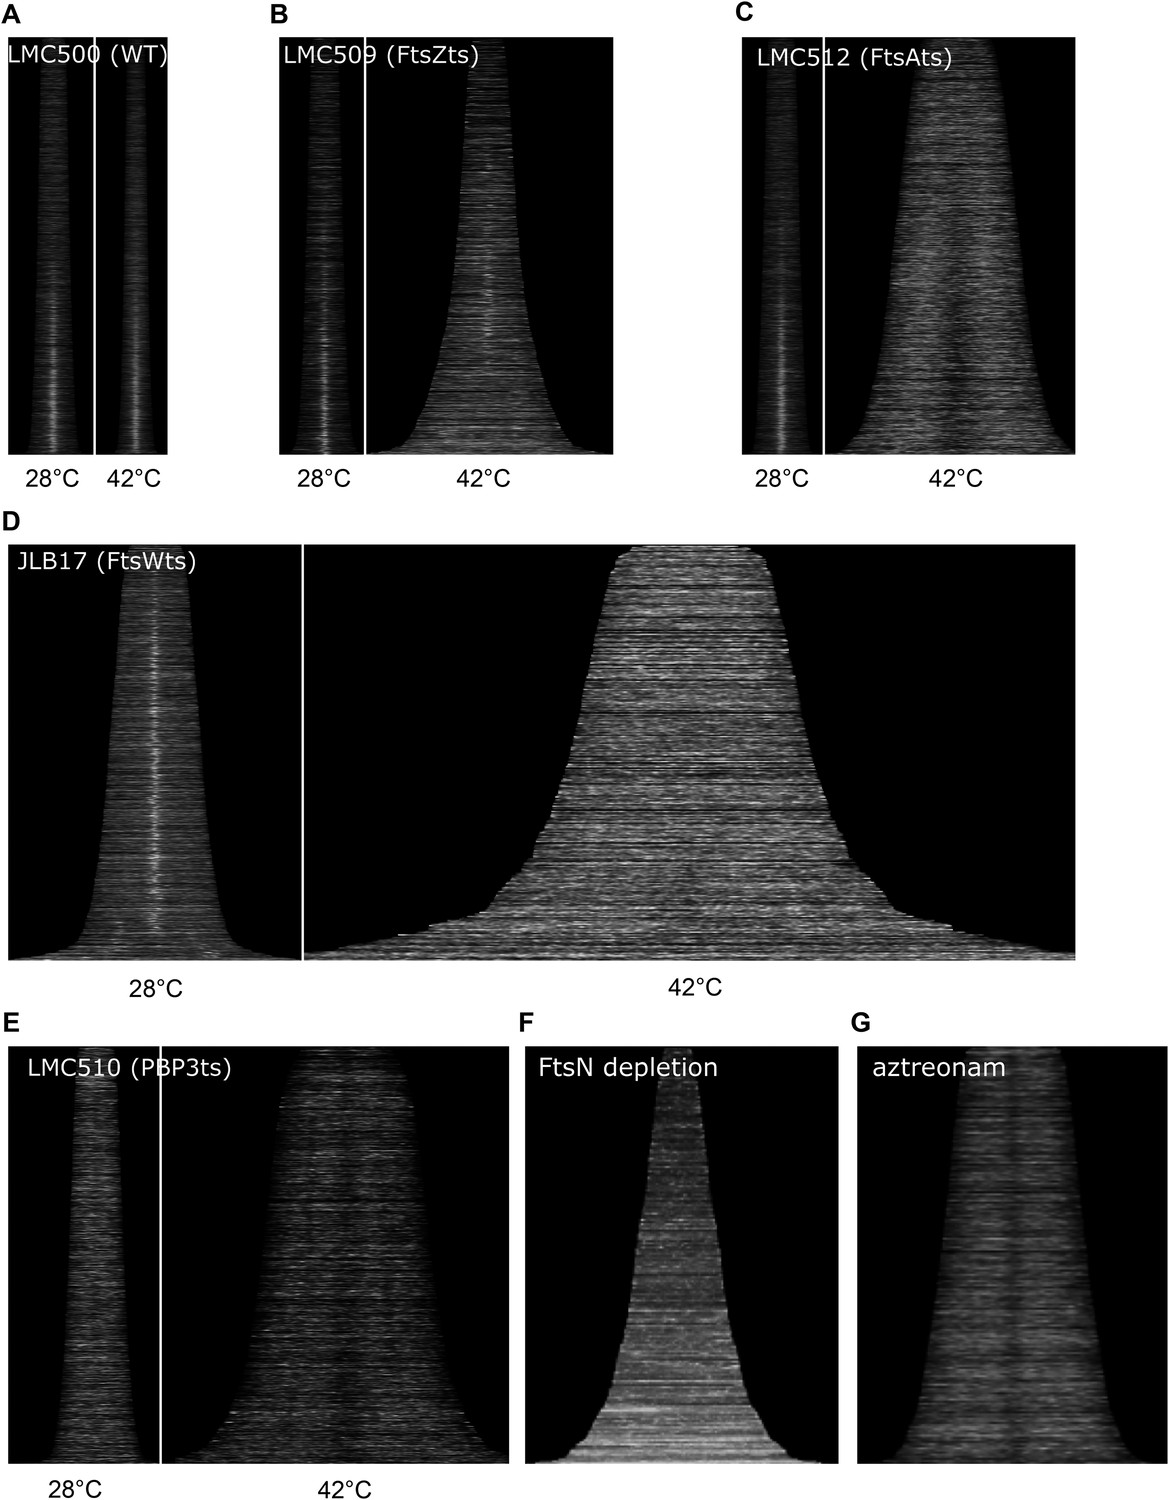
Localization of CpoB to mid-cell is dependent on divisome assembly and function.
(A)–(G) Profile maps showing localization of CpoB as a function of cell cycle progression (see Figure 4B), visualized by immunolabeling cells of the indicated strains with antibody specific to CpoB. (A)–(E). For wild type and temperature-sensitive (ts) strains, localization at both the permissive (28°C, left) and restrictive (42°C, right) temperatures is shown. (A) Parental wild type strain (LMC500). (B) FtsZ(ts) strain LMC509 is not completely temperature sensitive; consequently, CpoB still localizes at mid-cell in shorter pre-divisional cells, but not in longer smooth filaments. (E) PBP3(ts) strain LMC510 is already somewhat elongated at the permissive temperature because even at this temperature the PBP3(ts) protein is partially unstable (Fraipont et al., 2011). (F) CpoB localization over the course of FtsN depletion (see ‘Methods’). (G) CpoB localization following treatment with aztreonam, which inhibits PG synthesis by PBP3. CpoB localization to mid-cell is thus dependent on FtsZ, FtsA, FtsW, PBP3, ongoing PBP3-mediated PG synthesis, and FtsN.
Figure 4—figure supplement 5

Localization of CpoB to mid-cell is independent of PBP1B and TolA.
(A) and (B) Profile maps showing localization of CpoB as a function of cell-cycle progression (see Figure 4B), visualized by immunolabeling cells of the indicated strains. Cell width (diameter) is based on phase contrast images; darkening indicates constriction at mid-cell. (A) CpoB localizes to mid-cell in the absence of PBP1B (encoded by mrcB). (B) CpoB localizes to mid-cell in the absence of TolA. Loss of TolA causes mild cell chaining, observed here in the longer ΔtolA cells possessing multiple points of constriction (ΔtolA, cell width plot). CpoB also localizes to these future division sites. Cells were grown under conditions that minimized non-specific accumulation of periplasmic proteins at the septum in ΔtolA cells (glucose minimal medium (GB1) pH 7.0, 28°C; see 'Methods'). (C) Average distribution of CpoB in WT, ΔtolA and TolA-overexpressing complemented (pTolA) strains. Fluorescence intensity profiles were normalized by length and then averaged. In ΔtolA cells, CpoB abundance is increased, while in cells overexpressing TolA, CpoB abundance is decreased. A shorter exposure time was used to image ΔtolA cells in (B) to compensate for increased fluorescence; quantification in (C) accounts for this difference.
Figure 5 with 2 supplements
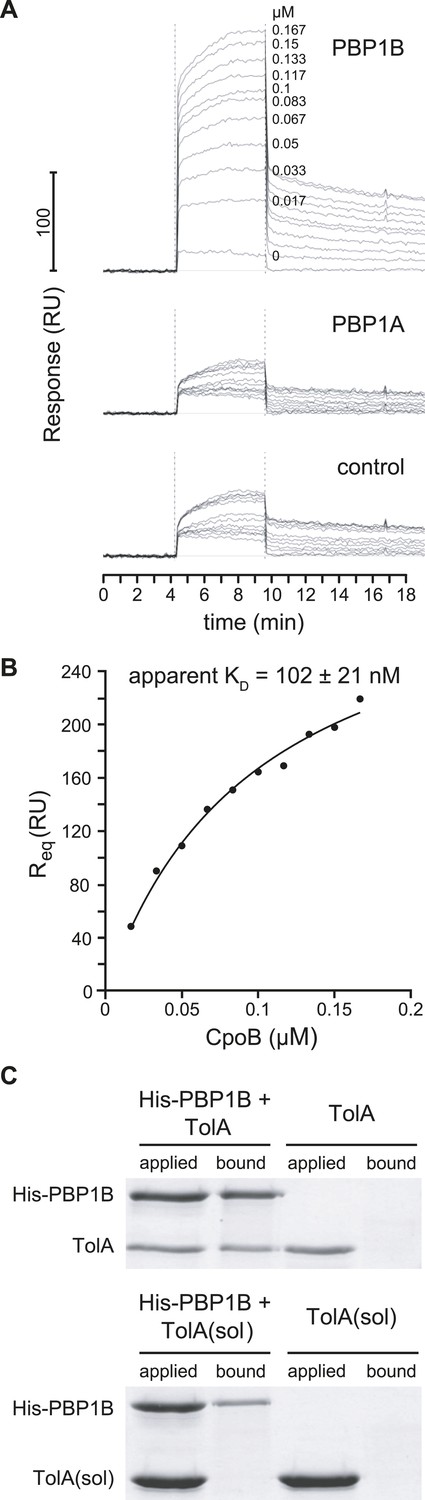
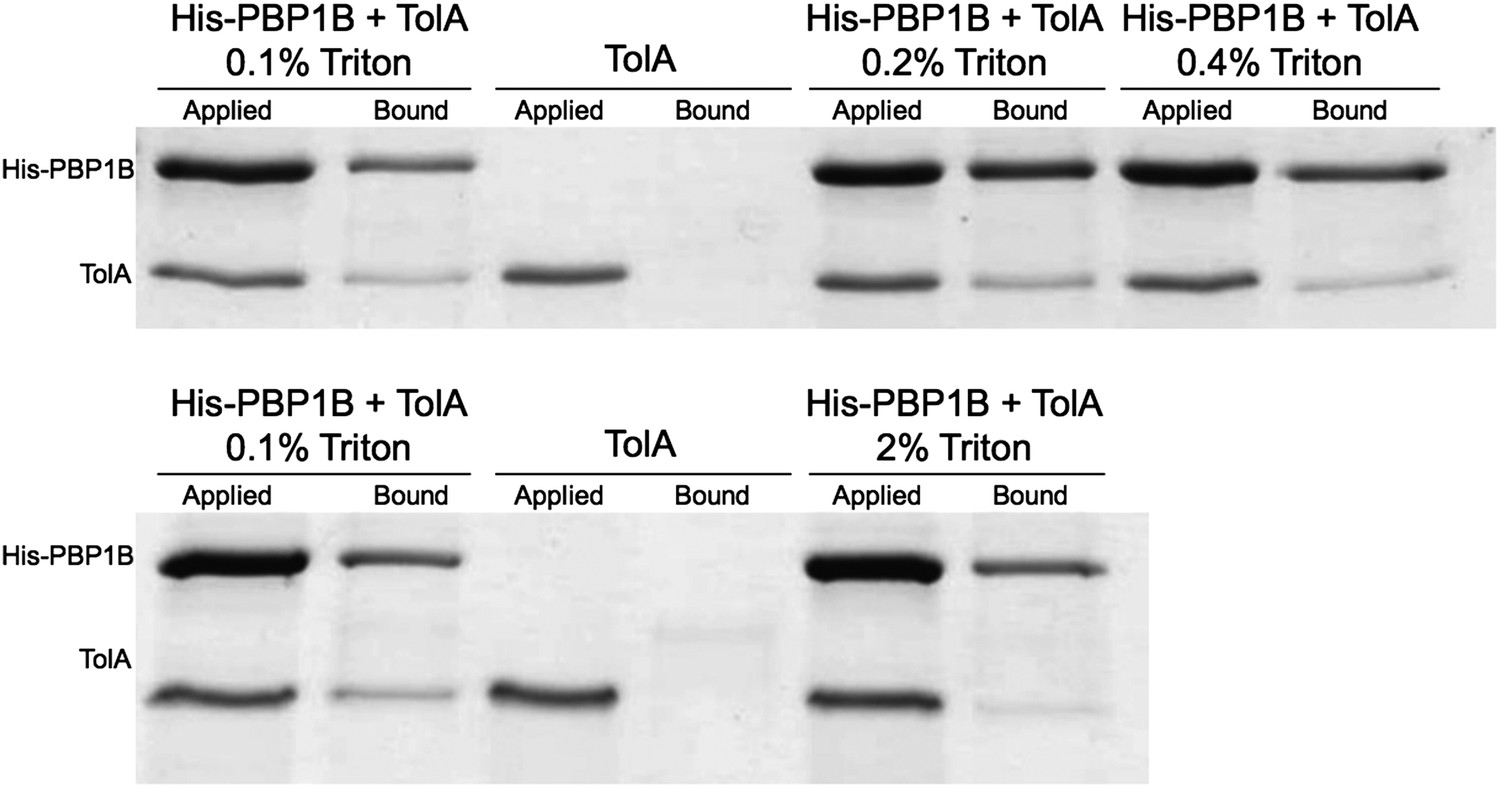
PBP1B interacts directly with CpoB and TolA.
(A) CpoB interacts directly with PBP1B in vitro, assayed by SPR. Sensorgrams show binding of CpoB to a chip surface with immobilized PBP1B, but not PBP1A or an empty control surface. Concentrations of trimeric CpoB (0–0.167 µM) are indicated. (B) The KD of the PBP1B-CpoB interaction was determined by non-linear regression using Sigma Plot 11.0, and assuming that CpoB interacts in its trimeric form. (C) TolA interacts directly with PBP1B in vitro only when TolA contains its transmembrane domain I. Interaction between His6-PBP1B and either full length TolA or TolA(sol), a soluble variant lacking domain I, was assessed using an in vitro cross-linking/pull-down approach. His-PBP1B specifically retained TolA, but not the soluble version lacking domain I, when pulled down by Ni-NTA beads. TolA or TolA(sol) alone showed no significant binding to Ni-NTA.
Figure 5—figure supplement 1
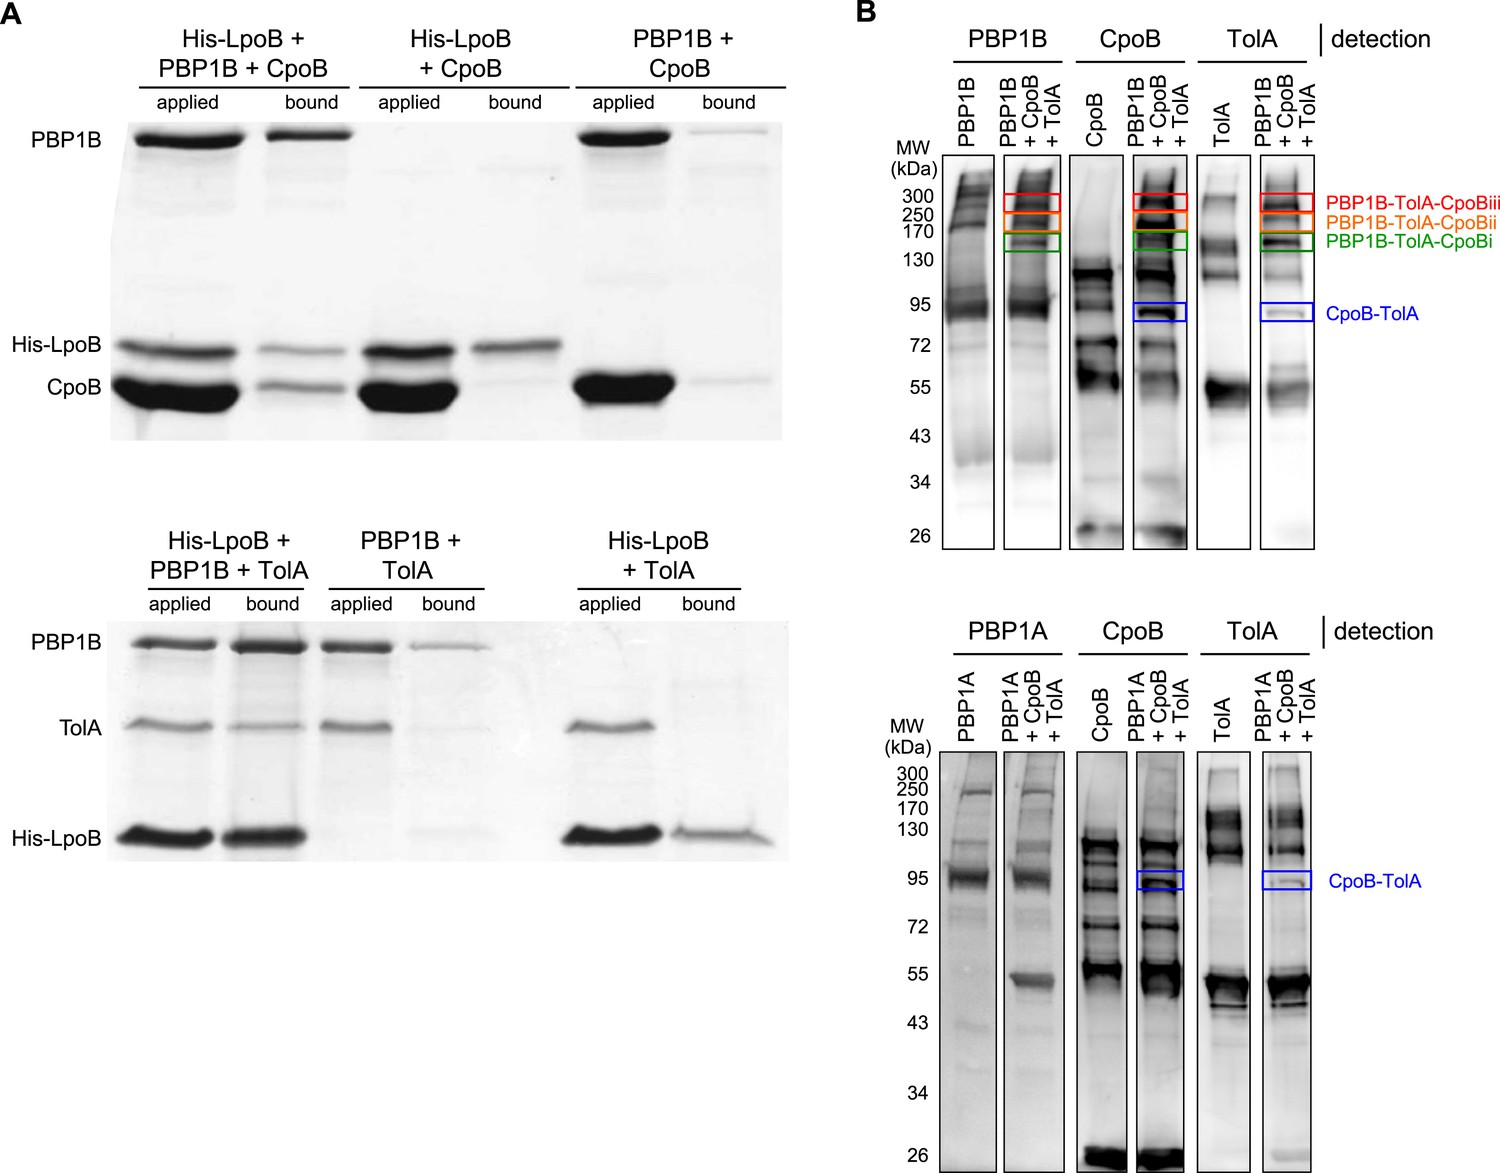
Demonstration of ternary complexes in vitro.
A) Ternary complexes of LpoB-PBP1B-CpoB and LpoB-PBP1B-TolA detected by in vitro cross-linking/pull-down. Proteins were cross-linked and applied to Ni-NTA beads. Cross-linkage of bound proteins was cleaved and samples separated by SDS-PAGE. Gels were then stained with Coomassie blue. His-LpoB retained CpoB or TolA only in the presence of PBP1B, indicating the presence of His-LpoB-PBP1B-CpoB and His-LpoB-PBP1B-TolA complexes. (B) Ternary complex of PBP1B, CpoB, and TolA. Mixtures of proteins (indicated above) were cross-linked and complexes were resolved by SDS-PAGE. After western blot PBP1B, CpoB and TolA were detected by specific antibodies. The CpoB–TolA complex (blue box) and several bands containing all three proteins (green, orange and red boxes) were detected. The bottom part shows an experiment where PBP1B was replaced by PBP1A, showing the absence of the ternary complex bands.
Figure 5—figure supplement 2
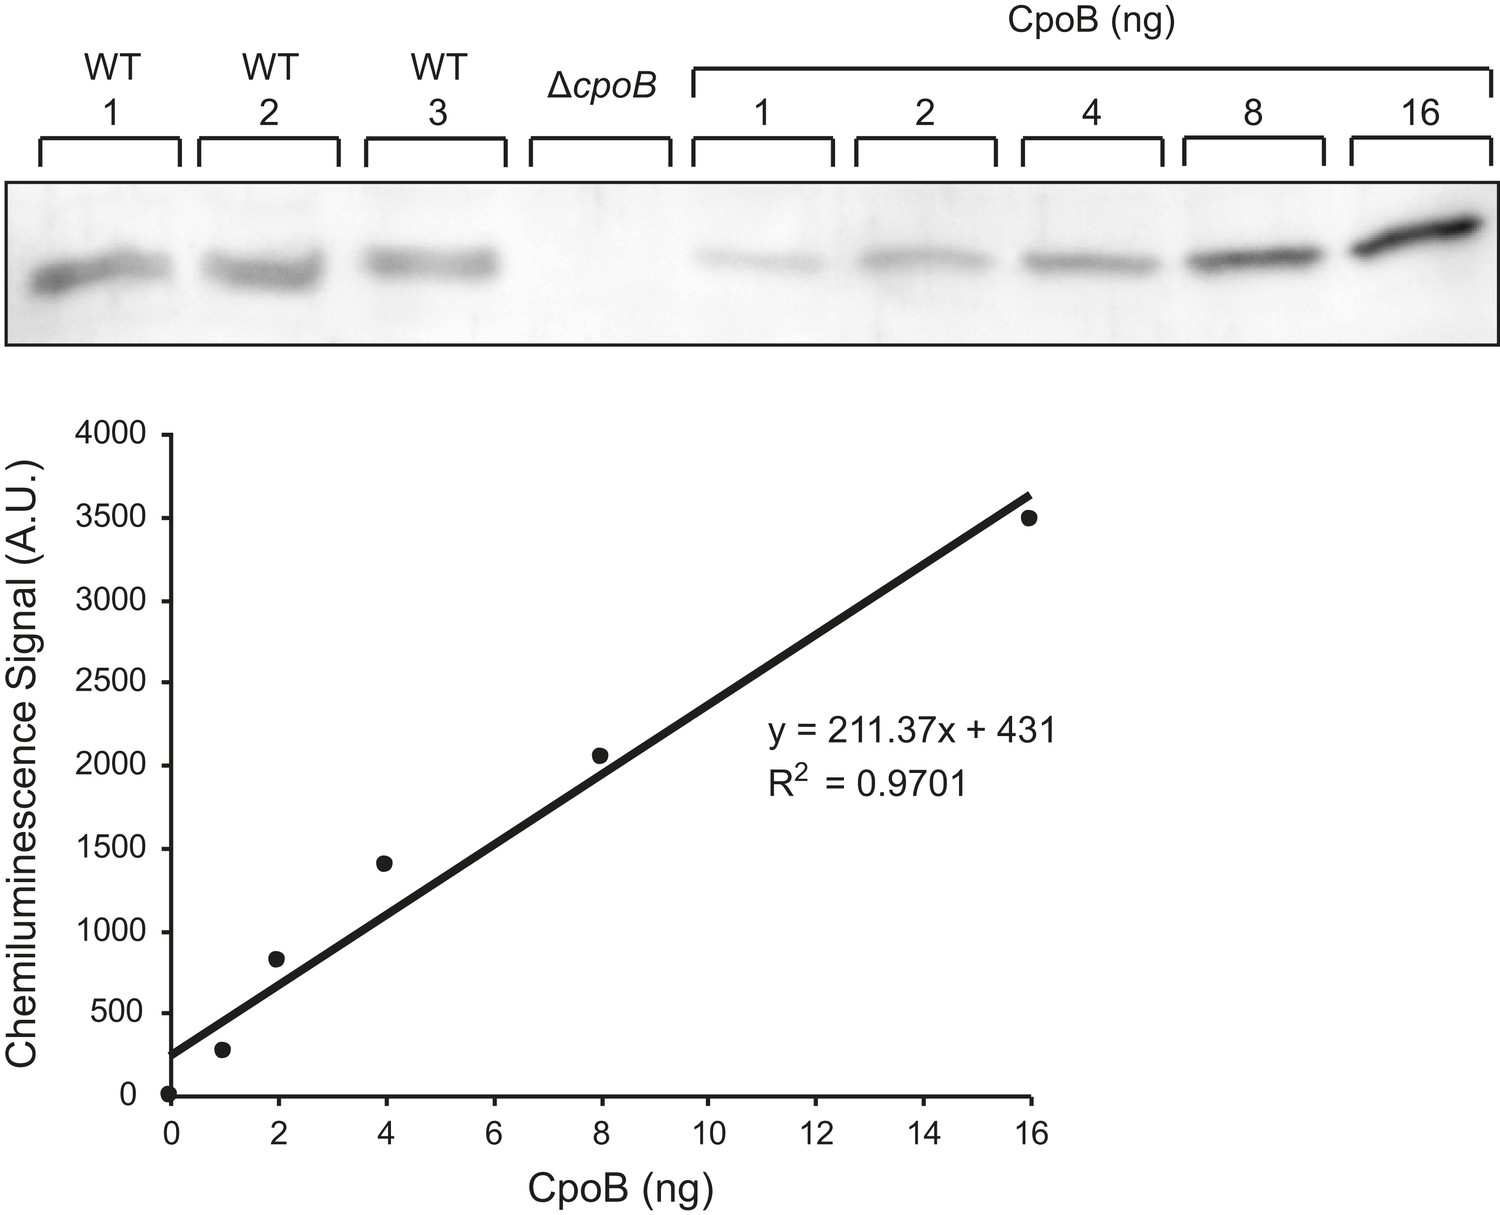
CpoB copy number determination.
Representative western blot detection of CpoB from BW25113 whole cell lysate along with purified CpoB standards. Standards were loaded in BW25113 ΔcpoB lysate to ensure a similar transfer efficiency to the endogenous CpoB. Chemiluminescence signal was quantified using the ImageQuant LAS4000 software.
Figure 6 with 1 supplement
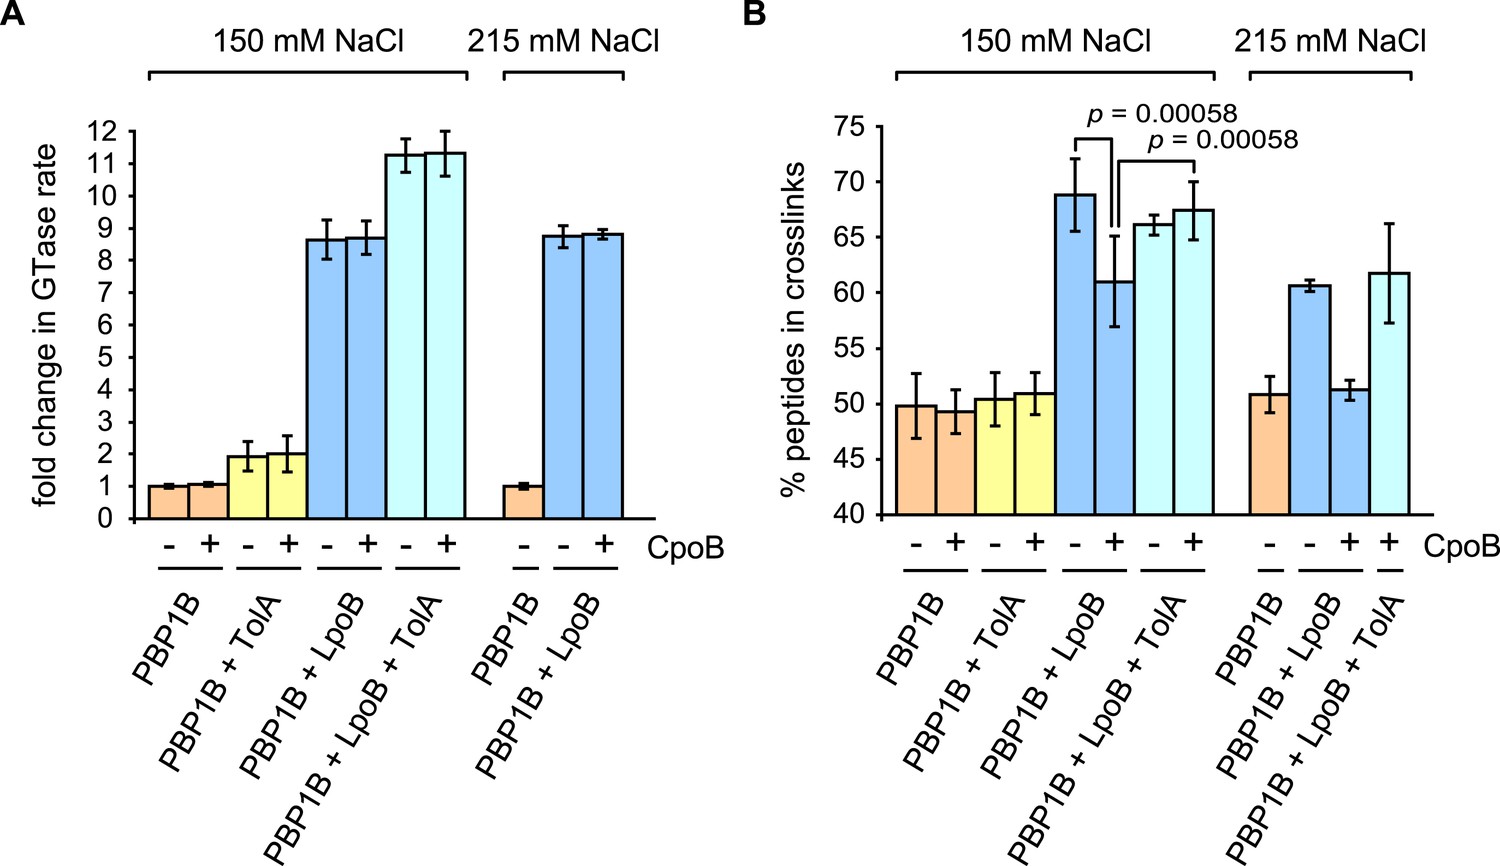
CpoB modulates stimulation of PBP1B TPase activity by LpoB.
GTase and TPase activities of PBP1B in the presence of LpoB, TolA, and/or CpoB. (A) GTase rate was assayed by consumption of fluorescently labelled lipid II by PBP1B in vitro. Change in GTase rate is relative to PBP1B alone and is shown as mean ± SD (n = 3–4). (B) TPase activity was determined by analyzing peptide cross-linkage following in vitro PG synthesis by PBP1B with radiolabelled lipid II substrate. TPase activity is shown as percentage of peptides present in cross-links in PG produced by PBP1B (mean ± SD). TPase assays were performed at 150 mM NaCl (n = 4–7) and at an increased salt concentration of 215 mM NaCl (n = 2, shown as the mean ± maximum and minimum values), at which the negative impact of CpoB on PBP1B TPase stimulation by LpoB is exacerbated. Statistical significance/difference was determined by Mann–Whitney U test, with p values of 0.00058 for both data sets.
Figure 6—figure supplement 1
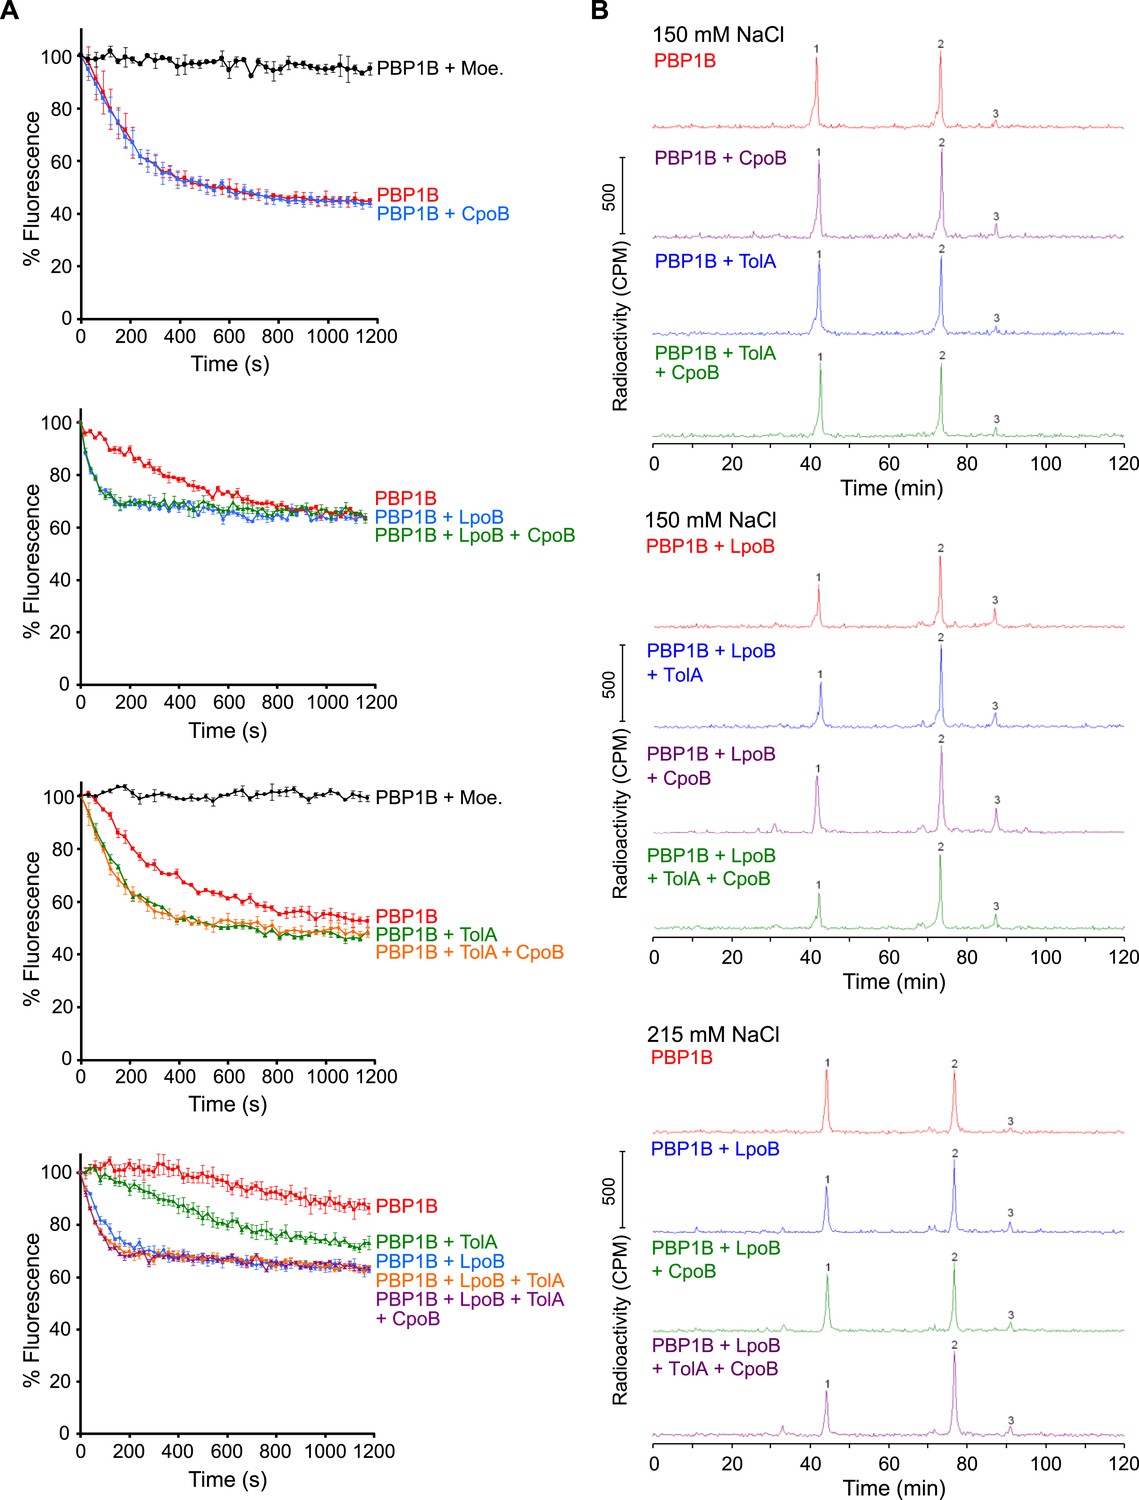
PBP1B GTase and TPase activity assays.
(A) PBP1B GTase activity assay. Representative continuous fluorescence assay graphs for GTase data shown in Figure 6. PBP1B concentrations were 0.5 µM (graphs 2 and 4) or 1 µM (graphs 1 and 3), the differences in basal PBP1B activity are also due to different detergent concentration in the reactions. The reactions shown in the bottom graph were performed at a lower temperature of 25°C to slow the reaction and allow the measurement of initial rates. Proteins present in each reaction are indicated next to their corresponding curves in the same color. Each point is the mean ± SD of three or four independent experiments. (B) PBP1B TPase activity assay. Representative examples of HPLC chromatograms for TPase data shown in Figure 6B. PBP1B was incubated with radioactive lipid II and 150 mM NaCl (standard condition, top chromatograms) or 215 mM NaCl (bottom chromatograms) in the presence of the proteins indicated above the corresponding chromatogram. The resulting PG was digested with muramidase (cellosyl) to yield muropeptides, which were reduced with sodium borohydride and separated by HPLC. The percentage of peptides in cross-links was calculated as 100% minus the monomeric (non-cross-linked) disaccharide pentapeptide (peak 1). Peak 2 corresponds to bis-disaccharide tetrapentapeptide, and peak 3 to tris-disaccharide tetrapentapeptide.
Figure 7
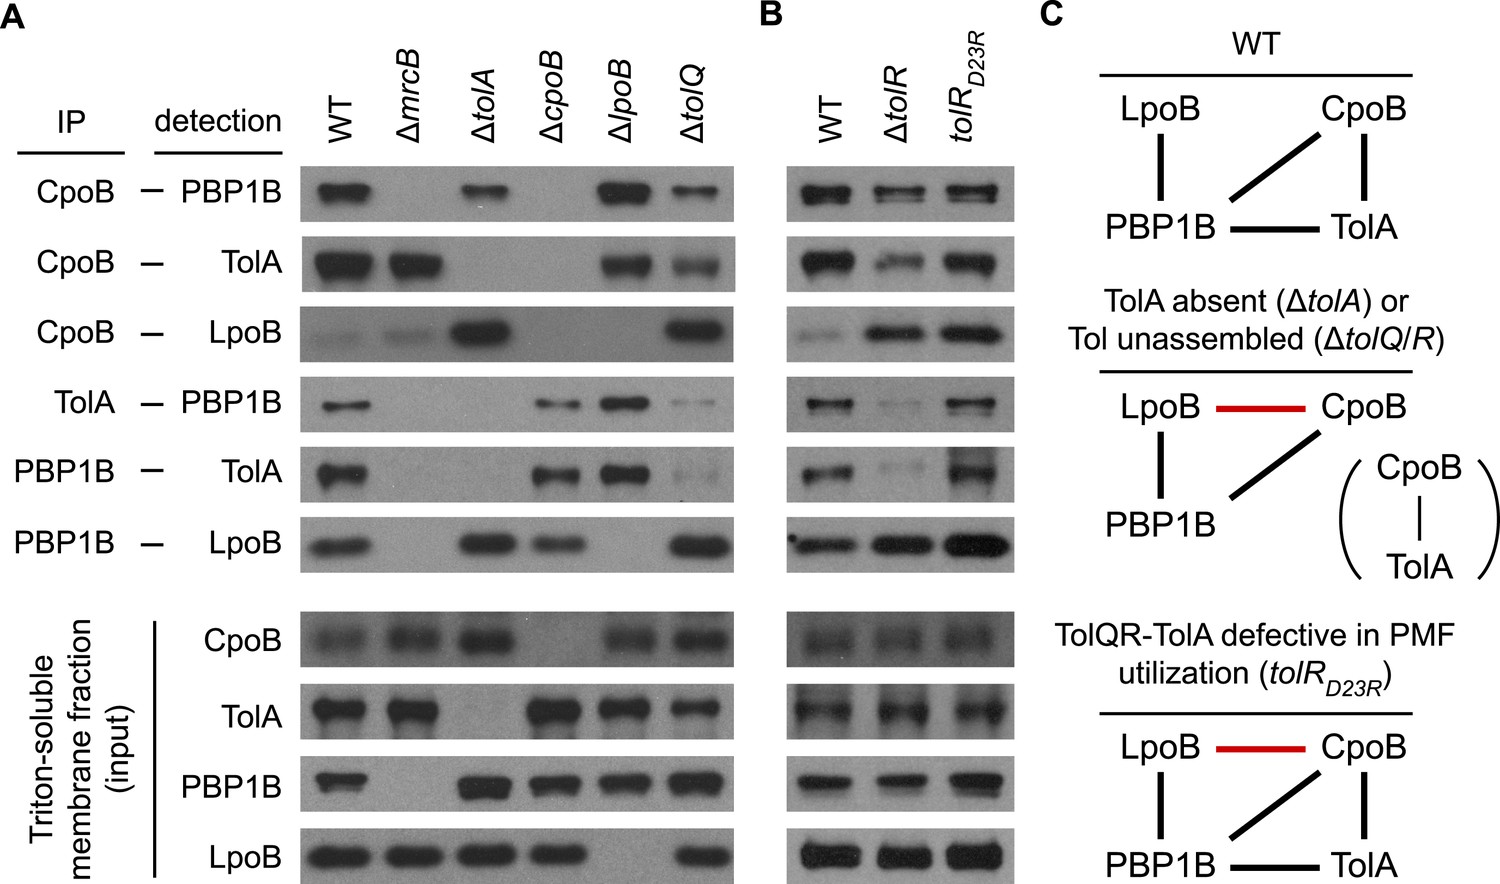
Regulatory interactions between CpoB, TolA, and PBP1B-LpoB respond to Tol apparatus assembly and energy state.
(A) and (B). Interactions between CpoB, TolA, PBP1B, and LpoB were characterized in vivo by cross-linking and co-immunoprecipitation for wild type (WT) and indicated mutant strains. Antibodies specific for CpoB, TolA, and PBP1B were used to immunoprecipitate their antigens from Triton X-100-solublized E. coli membrane extracts derived from cells treated with DTSSP cross-linker. Interacting proteins were detected in the immuno-precipitates by western blot using specific antibodies. IP and input panels are from different blot exposures (see ‘Methods’). (C) Schematic of observed in vivo interactions. Black bars indicate interactions observed in WT; red bars indicate novel interactions in mutant strains.
Figure 8

Model for physical and functional coordination of the PBPB-LpoB PG synthesis and Tol OM constriction machines by CpoB.
(A) Data-driven docking of the PBP1B/LpoB/CpoB complex calculated with HADDOCK/CNS protocols (de Vries et al., 2010) and integrating experimental data. The lowest energy structure obtained is shown with PBP1B, LpoB, and CpoB colored in wheat, pale green, and blue, respectively. LpoB binds the PBP1B UB2H domain, while CpoB binds in an adjacent cleft between the UB2H and TPase domains (Figure 3). We propose that CpoB can contact LpoB in this conformation, preventing hyper-activation of the PBP1B TPase by LpoB. TolA counteracts this CpoB effect, and increases both PBP1B TPase activity (by restoring stimulation by LpoB) and GTase activity (directly). (B) Schematic of PBP1B regulation by LpoB, CpoB, and TolA. TP: transpeptidase domain; GT: glycosyltransferase domain. Green circles indicate activity stimulation (increase in glycan synthesis rate for GTase; formation of more highly cross-linked product for TPase). Top left: LpoB binding stimulates both PBP1B GTase and TPase activities; the latter produces highly cross-linked PG. Top right: CpoB modulates TPase stimulation without interfering with GTase stimulation. Bottom left and right: When energized, TolA reverses the effect of CpoB, restoring production of highly cross-linked PG. Regulation by TolA is thus dependent on TolQR–TolA PMF utilization, tying cycles of PBP1B TPase activation to cycles of Tol function.
Author response image 1
Author response image 2
Author response image 3
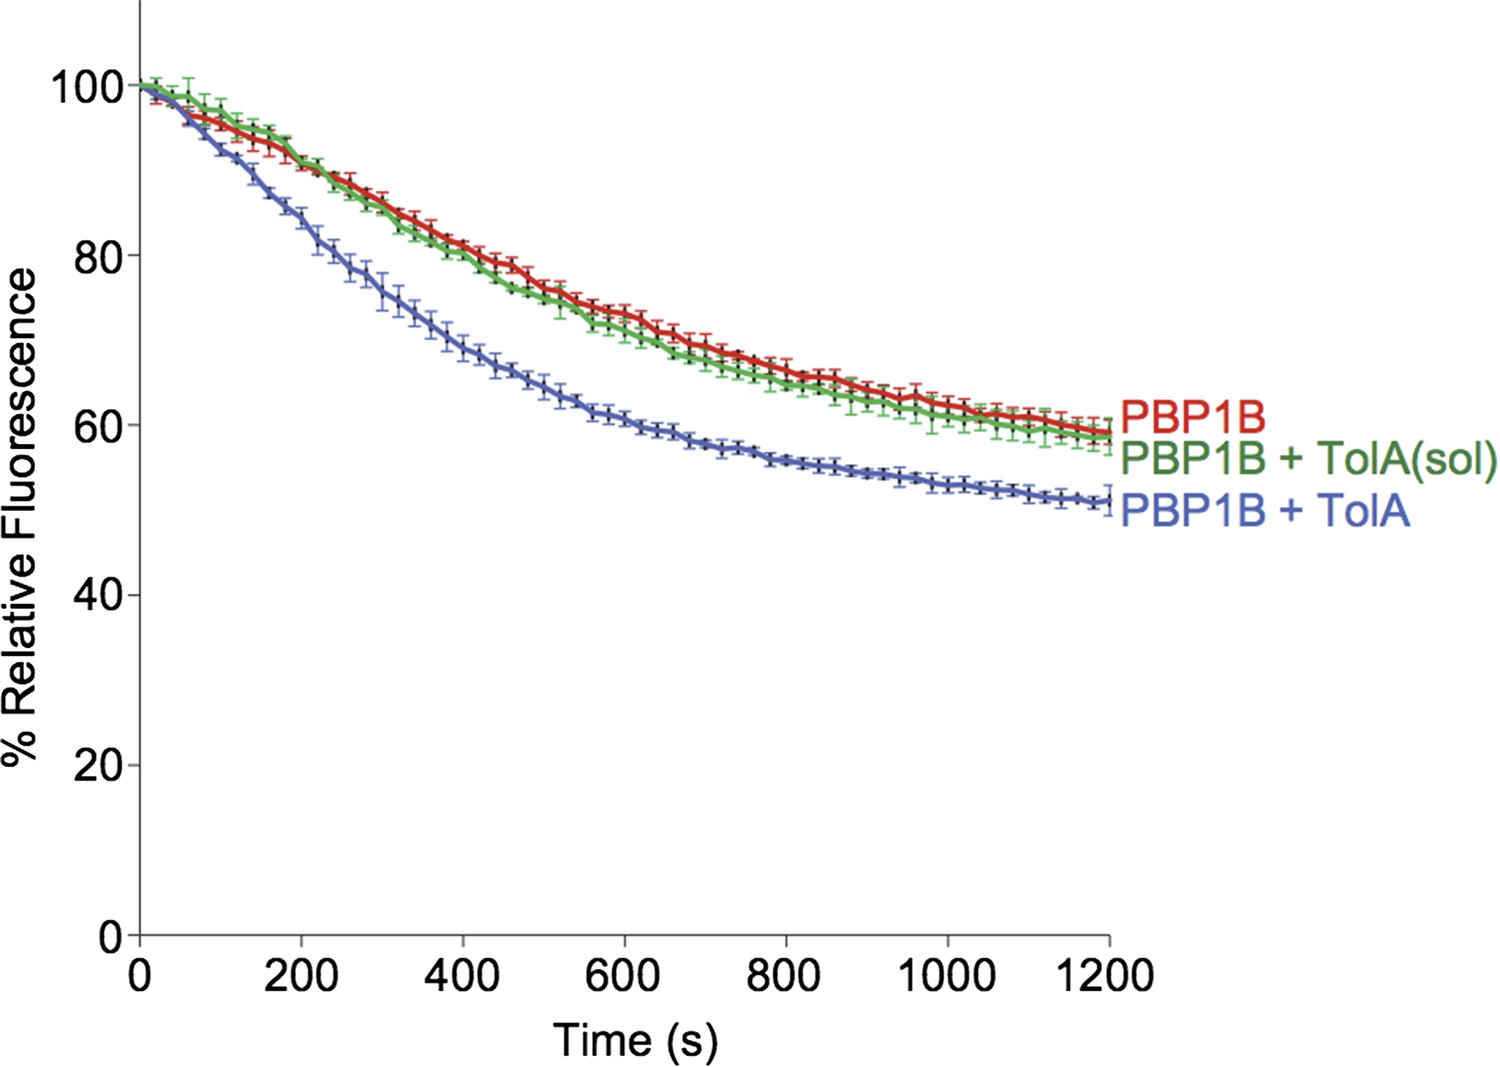
> Contineous GTase assay with dansyl-lipid II and 1 µM PBP1B with 3 µM TolA-his or TolA(sol) at 0.065% Triton, 30°C.
Tables
Table 1
His6-PBP1B pBpa—CpoB cross-linking mass spectroscopy data
| Mutant | Score* | Coverage† | Peptides‡ | PSM§ |
|---|---|---|---|---|
| T118 | 300.52 | 19.77% | 7 | 12 |
| E123 | 79.99 | 11.41% | 3 | 4 |
| T751 | 79.99 | 11.41% | 3 | 4 |
| T753 | 301.64 | 19.77% | 7 | 12 |
-
*
Addition of individual scores of the ion fragmentation spectra of the identified peptides.
-
†
Percentage of protein sequence covered by the identified peptides.
-
‡
Number of unique peptides of the protein identified in the sample.
-
§
Number of individual spectra in which the peptides were identified.
Additional files
-
Supplementary File 1
Bacterial strains and plasmids used in this study.
- https://doi.org/10.7554/eLife.07118.024
Download links
A two-part list of links to download the article, or parts of the article, in various formats.
Downloads (link to download the article as PDF)
Open citations (links to open the citations from this article in various online reference manager services)
Cite this article (links to download the citations from this article in formats compatible with various reference manager tools)
Coordination of peptidoglycan synthesis and outer membrane constriction during Escherichia coli cell division
eLife 4:e07118.
https://doi.org/10.7554/eLife.07118


