Characterization of the finch embryo supports evolutionary conservation of the naive stage of development in amniotes
- RIKEN Center for Developmental Biology, Japan
- National Center for Biological Sciences, India
Figures
Figure 1
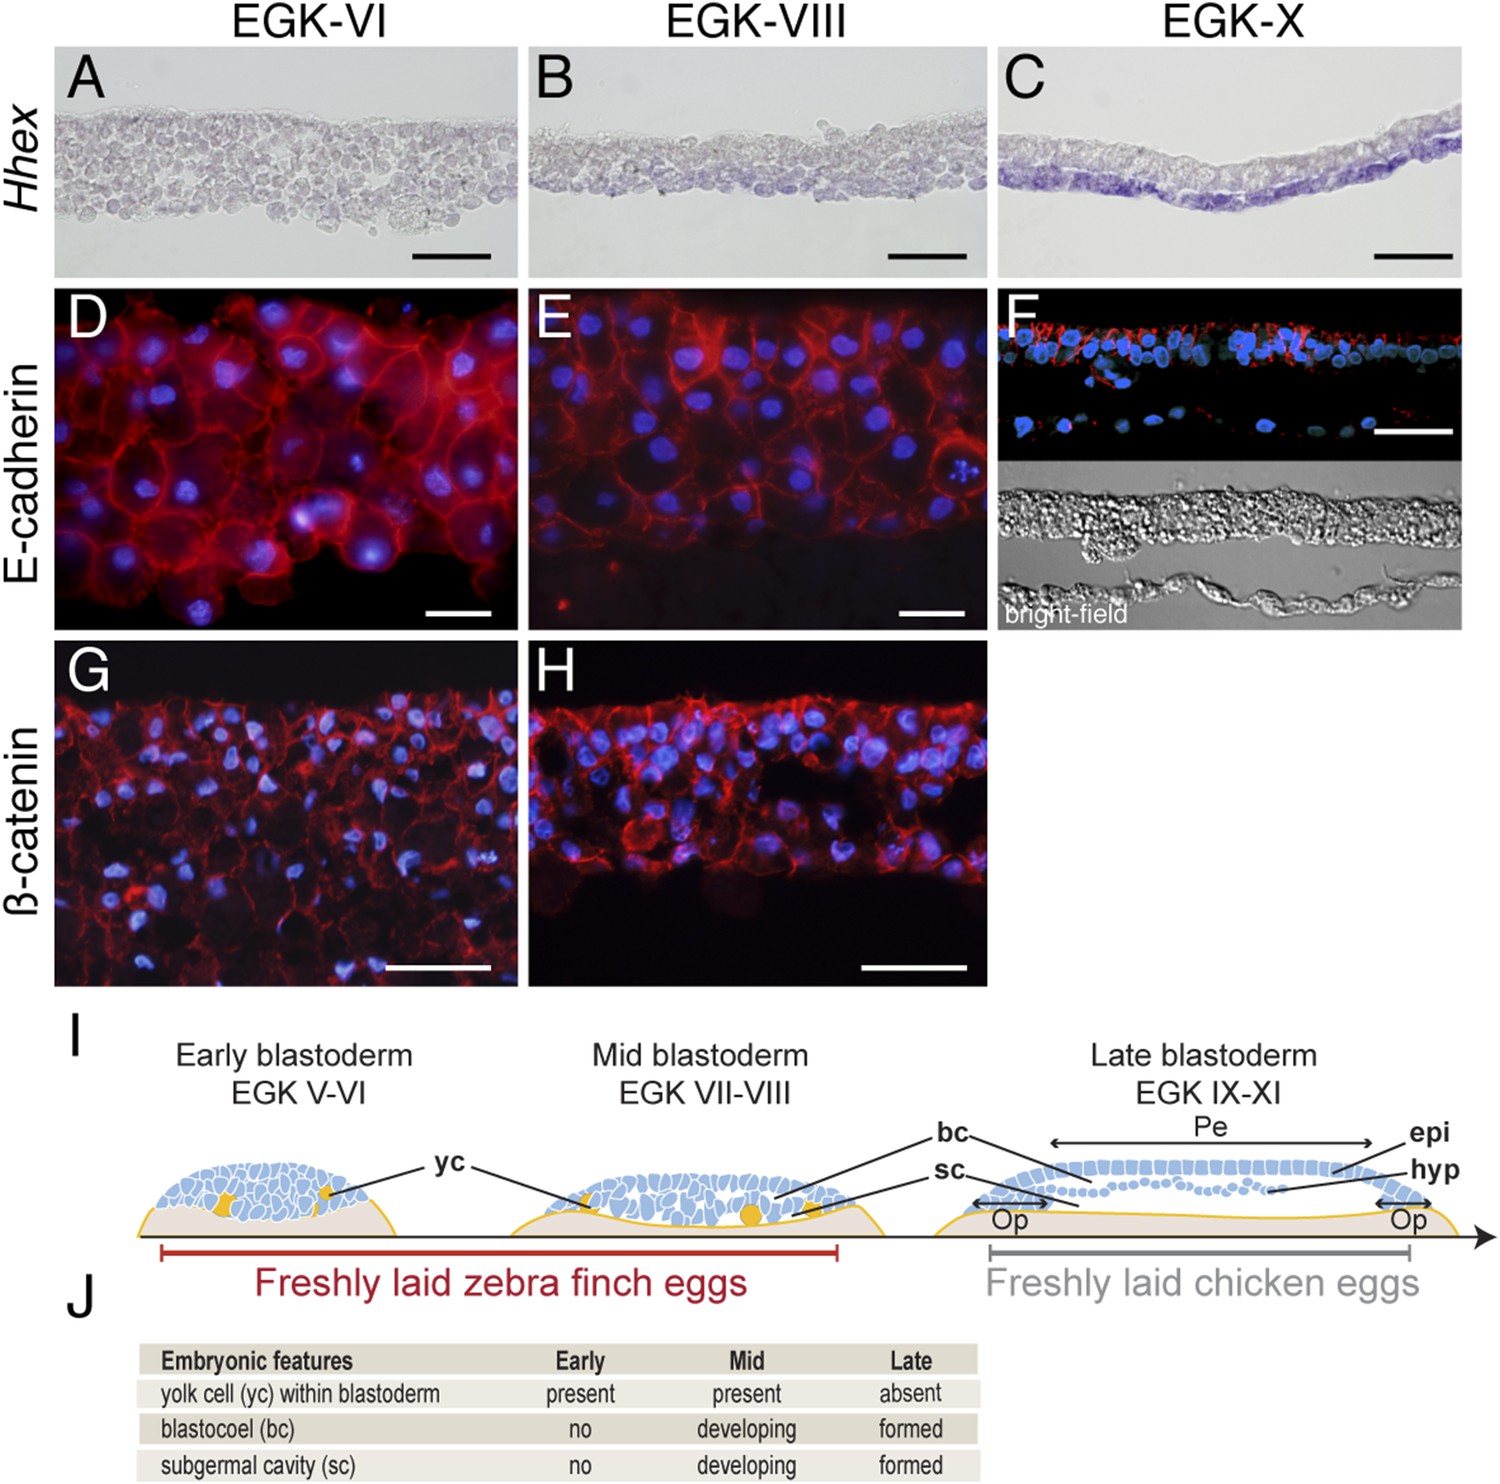
Morphology of the finch blastoderm at oviposition.
(A–C) Finch embryos were sectioned after Hhex in situ hybridization to reveal the morphology of the blastoderm. At EGK-VI the blastoderm is thick, with no sign of epithelialization, and does not express Hhex (A). The blastoderm is thinner at EGK-VIII but still has not overt epithelialisation, and express low level of Hhex transcripts in the cells of the yolk side (B). Hhex expression can be detected clearly at EGK-X and is confined to a morphologically distinct hypoblast layer (C). (D–F) Staining of E-cadherin reveals the extent of epithelialization of the finch blastoderm. At EGK-VI, most of the blastodermal cells appear unpolarized, however, express E-cadherin (D). At EGK-VII, while thinner, the blastoderm does not show any columnar cells typical of epithelial organization (E). At EGK-X, clear epithelial organization can be visualized, with polarized E-cadherin and morphological segregation in the bright-field image (F). (G, H) ß-catenin staining confirms the lack of epithetialisation at finch oviposition stages. The pattern at EGK-VI is similar to E-cadherin staining (G) as is the pattern at EGK-VIII (H). In A–G, scale bar represents 100 µm. (I) Schematic of the morphology of the early, mid, and late finch blastula: The late finch blastoderm is similar to the chick embryo at oviposition. Yc—yolk cells; bc—blastocoel; sc—subgerminal cavity; epi—epiblast; hyp—hypoblast; Op—area opaca; Pe—area pellucida. (J) Table below showing the features of the finch at early stages.
Figure 2
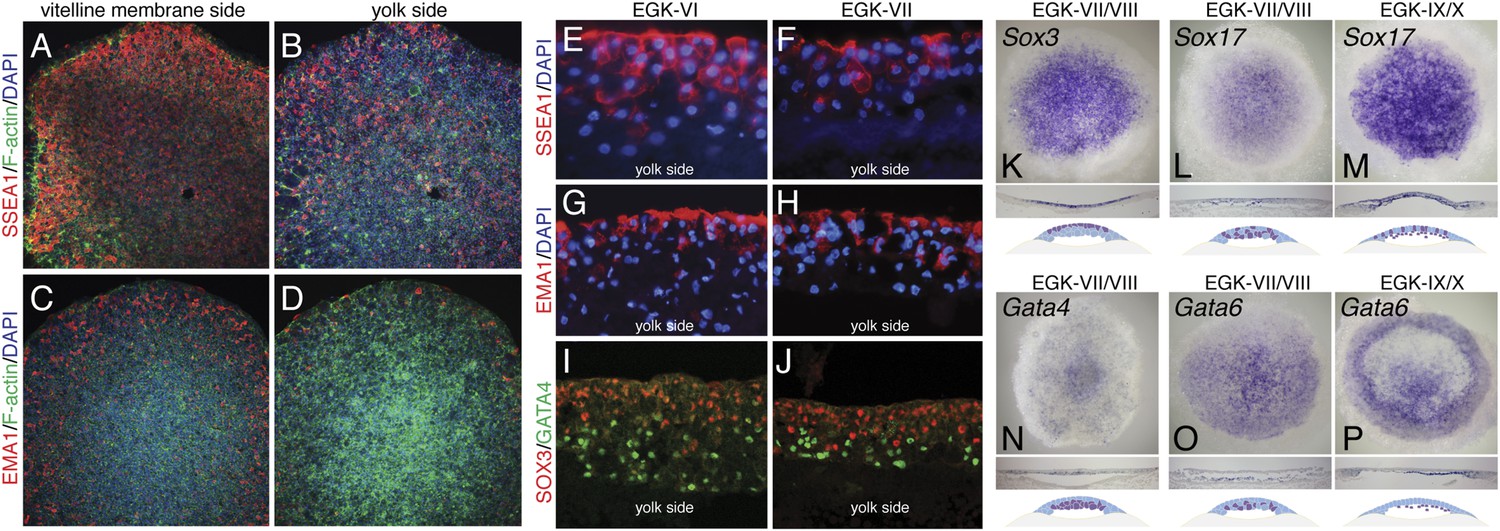
Molecular characterization of the finch blastoderm at oviposition.
(A–D) Whole-mount staining of EGK-VIII finch embryos of the distribution of putative germ cell markers SSEA-1 (A, B) and epithelial membrane antigen 1 (EMA-1) (C, D) showing views from the vitelline membrane side (A, C) and yolk (lower) side (B, D). (E, F) Sections of finch embryos at oviposition showing the distribution of SSEA-1 positive cells at EGK-VI (E) and EGK-VIII (F) to predominantly the upper side of the blastoderm. (G, H) Sections of finch embryos at oviposition showing the distribution of EMA-1 positive cells at EGK-VI (G) and EGK-VIII (H) to predominantly the upper side of the blastoderm. (I, J) Sections of finch embryos at oviposition showing the distribution of SOX3 and GATA4 protein at EGK-VI (I) and EGK-VIII (J) SOX3 and GATA4 are localized to opposite sides of the blastoderm. (K) In situ hybridization of Sox3 at oviposition in the finch blastoderm. Section analysis, summarized in the cartoon, shows transcripts are present throughout the upper layer of the blastoderm. (L, M) In situ hybridization of Sox17 together with section analysis, summarized in the accompanying cartoon, reveals expression dispersed throughout the blastoderm at oviposition (L), while at EGK-X expression is more predominant in the hypoblast with scattered epiblast cells (M). (N) In situ hybridization of Gata4 at oviposition in the finch blastoderm. Section analysis, summarized in the cartoon, shows transcripts are present throughout the lower layer of the blastoderm. (O, P) In situ hybridization of Gata6 together with section analysis, summarized in the accompanying cartoon, reveals expression more predominant in the lower layer/hypoblast at oviposition (O) and in the late blastoderm at EGK-IX/X (P).
Figure 3
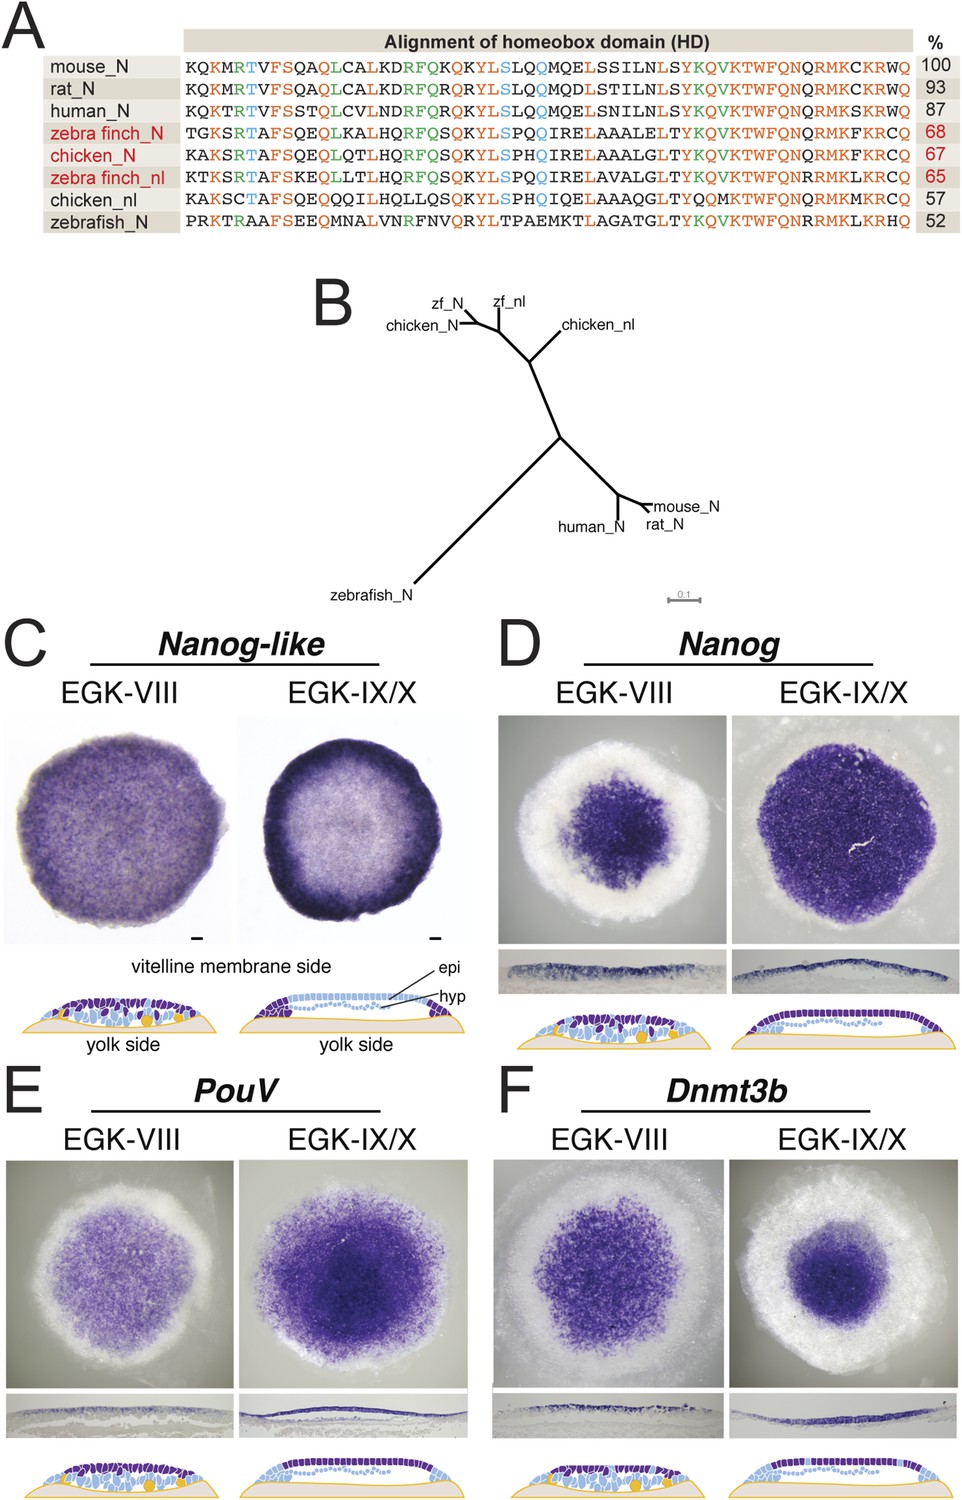
Expression of pluripotent markers in the finch embryo at oviposition.
(A) Comparison of the NANOG (N) and NANOG-LIKE (nl) homeodomains (HD) from chick and the finch compared to the NANOG HD from human, mouse, rat, and zebrafish, together with percentage identity to the mouse NANOG HD. (B) Phylogenetic analysis reveals chick and the finch NANOG and NANOG-LIKE are the result of a recent duplication in the avian lineage. (C) In situ hybridization of Nanog-like at oviposition and at EGK-X in the finch blastoderm. Expression is throughout the upper layer of the blastoderm and resolves to peripheral expression in the putative extra-embryonic region. Diagram compiles expression revealed from sections. (D) In situ hybridization of Nanog reveals expression in the central part of the upper layer at finch oviposition, which expands to cover the entire epiblast at EGK-X. This is shown in sections and detailed in the diagram shown. (E) In situ hybridization of the avian Oct4 homologue PouV shows expression throughout the upper layer/epiblast of the EGK-VIII and EGK-X finch embryos. (F) Expression of Dnmt3b shows expression throughout the upper layer of the blastula at oviposition, which resolves to central epiblast expression at EGK-X.
Figure 4

Q-PCR characterization of finch and chick blastoderm at oviposition reveals fundamental molecular differences.
Quantitative-PCR was used to assess the differences in gene expression between finch (green bars) and chick (red bars) embryos at oviposition. The markers used were associated with general pluripotency (A), naive pluripotency (B), markers of primordial germ cell development (C), fibroblast growth factors (D), and leukemia inhibitory factor (LIF) signaling (E).
Figure 5

Q-PCR characterization of finch blastoderms at oviposition and aged to EGK-X.
Quantitative-PCR was used to assess the differences in gene expression between finch blastoderms at laying (green bars) and aged to EGK-X, equivalent to chick oviposition (blue bars). The markers were used to assess general pluripotency (A), naive pluripotency (B). p-values <0.05 are labeled with an asterisk.
Figure 6
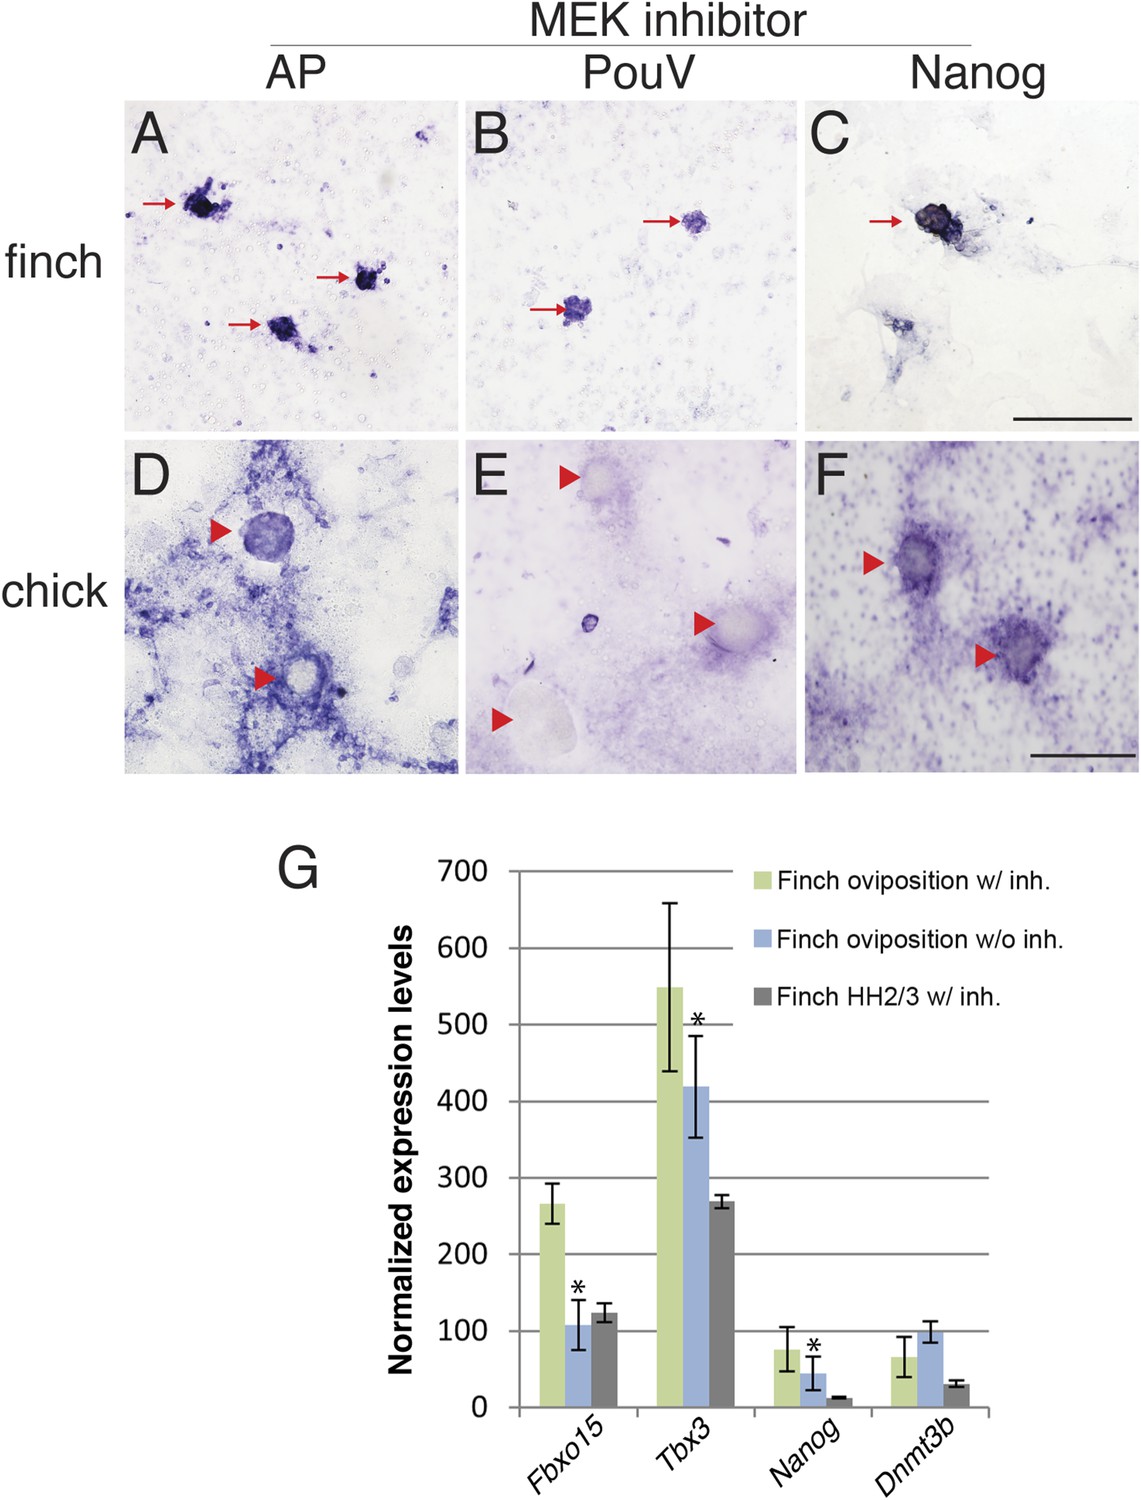
Finch blastodermal cell cultures retain markers of pluripotency even in the presence of MEK inhibitor.
Finch and chick embryos at oviposition were dissociated and cultured in the presence of LIF and the MEK inhibitor, PD0325901, for 4 days. (A–C) Finch blastodermal cells form aggregates (red arrows) that show alkaline phosphatase (AP) activity (A) as well as expression of PouV (B) and Nanog (C). (D–F) Chick blastodermal cells formed aggregates (indicated as red arrowheads), but these did not show AP activity (D) nor express PouV (E) and Nanog (F) even after extended periods of staining. (G) Q-PCR analysis of finch ovipositional blastoderms cultured in the presence of LIF and the MEK inhibitor, PD0325901, for 4 days, as well as finch blastoderm aged to HH2/3 cultured in the presence of LIF and PD0325901. Marker analysis was used to ascertain the pluripotent state of cells in each culture condition. T-tests were used to determine the significance of the difference in markers gene expression in finch ovipositional blastodermal cell culture with or without MEK inhibition. p-values <0.05 are labeled with an asterisk.
Figure 7
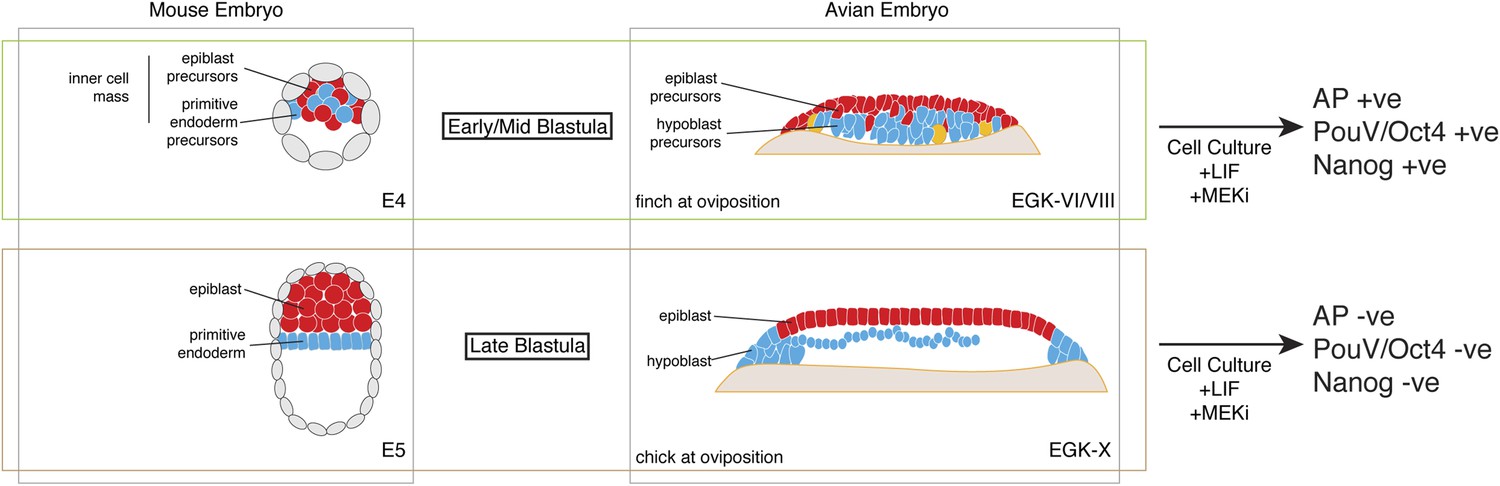
Putative conservation of the naive stage during amniote embryogenesis.
Similar to mouse pre-implantation embryos (around E4), prior to epiblast epithelialisation, zebra finch embryos at oviposition are at early–mid-blastula stages (EGK-VI/VIII) show no overt morphological segregation despite the expression of epiblast and primitive endoderm/hypoblast markers in distinct sub-populations of cells with the embryo. Cells from mouse and finch at this stage do not require ERK activation for the maintenance of pluripotent marker expression in vitro. Chick embryos at oviposition are more similar to the mouse blastula where epithelialisation has occurred. Similarly, cells from chick and mouse embryos at this stage are unable to maintain pluripotent marker expression when ERK signaling is inhibited.
Additional files
-
Supplementary file 1
(A) Details of primers that were used for generating in situ hybridization riboprobes for the zebra finch. (B) Details of primers that were used for quantitative PCR.
- https://doi.org/10.7554/eLife.07178.010
Download links
A two-part list of links to download the article, or parts of the article, in various formats.
Downloads (link to download the article as PDF)
Open citations (links to open the citations from this article in various online reference manager services)
Cite this article (links to download the citations from this article in formats compatible with various reference manager tools)
Characterization of the finch embryo supports evolutionary conservation of the naive stage of development in amniotes
eLife 4:e07178.
https://doi.org/10.7554/eLife.07178


