Stochastic modelling, Bayesian inference, and new in vivo measurements elucidate the debated mtDNA bottleneck mechanism
- Imperial College London, United Kingdom
- IFA Tulln, Austria
- University of Veterinary Medicine Vienna, Austria
- University of Veterinary Medicine, Austria
- University of Natural Resources and Life Sciences, Austria
- University of Oxford, United Kingdom
Figures
Figure 1

The mitochondrial bottleneck, and elements of a general model for bottlenecking mechanisms.
(A) The mitochondrial DNA (mtDNA) bottleneck acts to produce a population of oocytes with varying heteroplasmies from a single initial oocyte with a specific heteroplasmy value. During development, mtDNA copy number per cell decreases (by a debated amount, which we address; see Main text) then recovers, suggesting a ‘bottleneck’ of cellular mtDNA populations. (B) Cellular mtDNA populations during the bottleneck are modelled as containing wildtype and mutant mtDNAs. MtDNAs can replicate and degrade within a cell cycle, with rates λ and ν respectively. (C) At cell divisions, the mtDNA population is partitioned between two daughter cells either deterministically, binomially, or through the binomial partitioning of mtDNA clusters. (D) Symbols used to represent quantities and model parameters used in the Main text, and their biological interpretations.
Figure 2
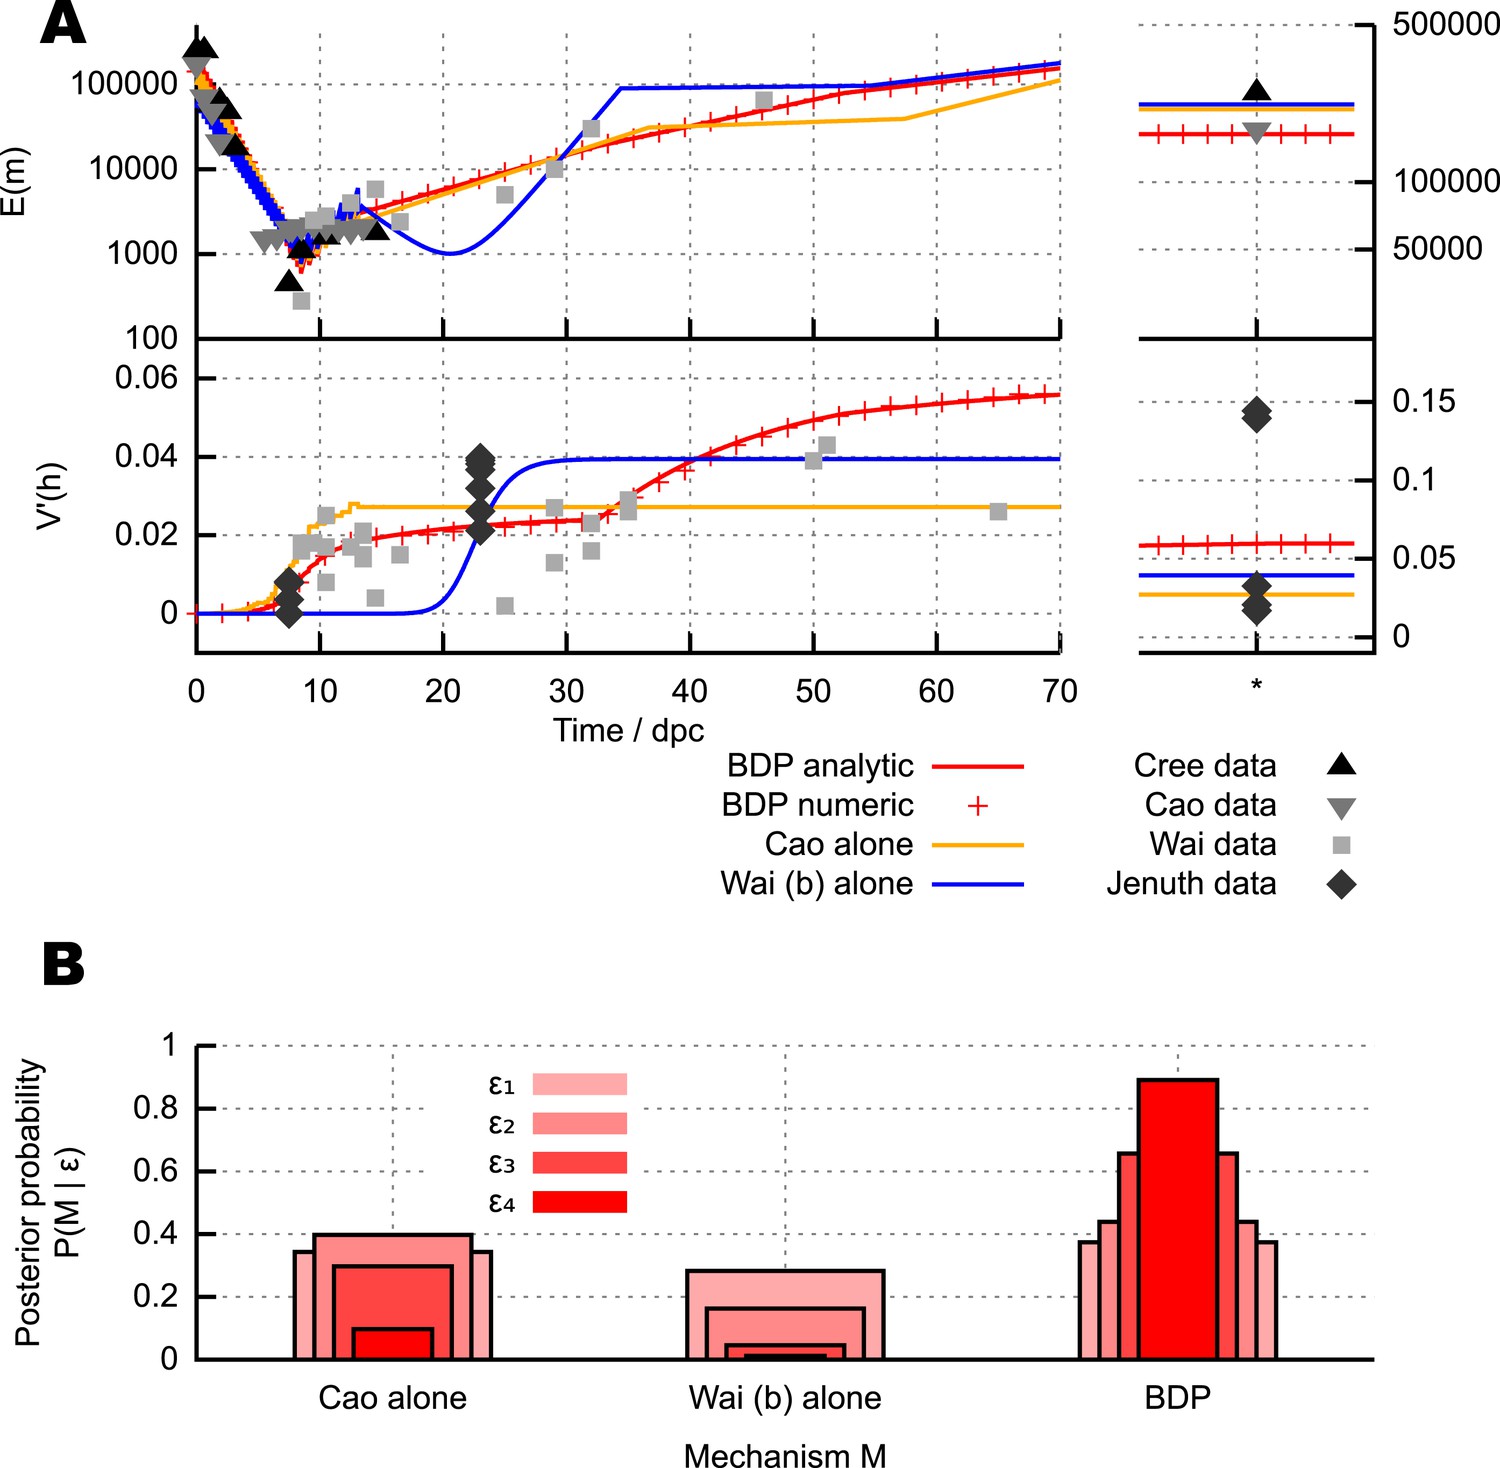
Different mechanisms for the mtDNA bottleneck.
(A) Trajectories of mean copy number and normalised heteroplasmy variance arising from the models described in the text, optimised with respect to data from experimental studies. Birth-death-partition (BDP) denotes the BDP model, encompassing Cree and Wai (A) mechanisms. Left plots show trajectories during development; right plots show behaviour in mature oocytes in the next generation. * denotes measurements in mature oocytes, modelled as 100 dpc (see ‘Materials and methods’). (B) Statistical support for different mechanisms from approximate Bayesian computation (ABC) model selection with thresholds ϵ1,2,3,4 = 75, 60, 50, 45. As the threshold decreases, forcing a stricter agreement with experiment (thinner, darker columns), support converges on the BDP model.
Figure 3
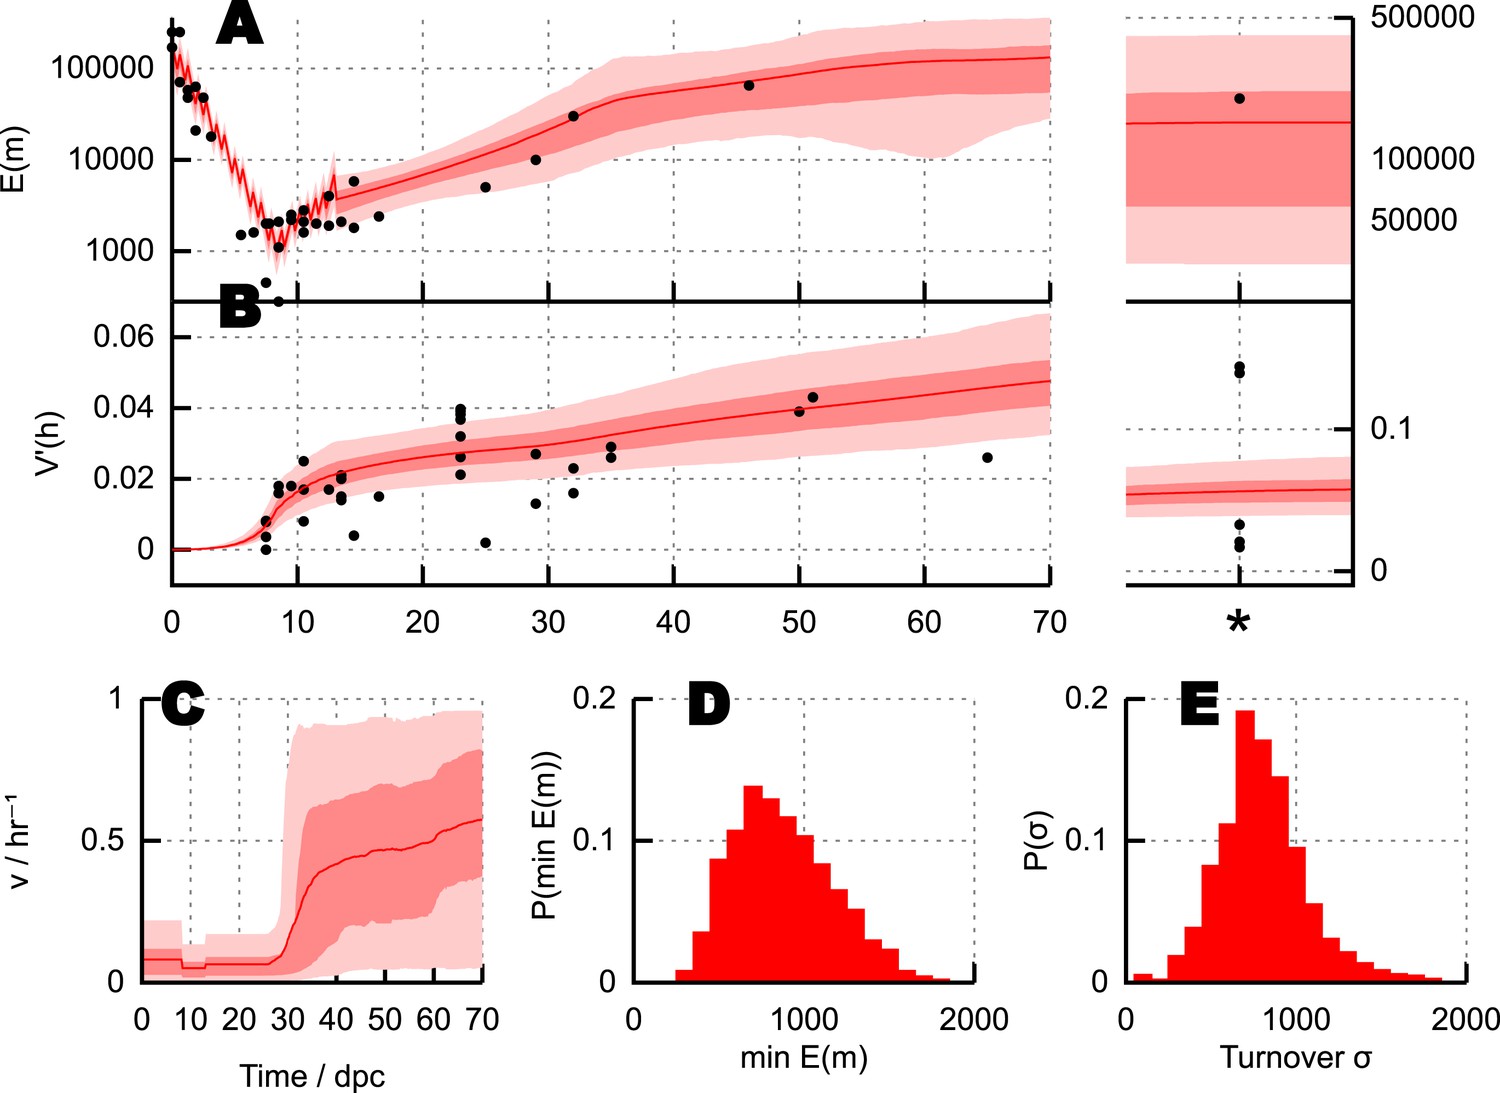
Parameterisation of the BDP model and inferred details of bottleneck mechanism.
Trajectories of (A) mean copy number and (B) normalised heteroplasmy variance resulting from BDP model parameterisations sampled using ABC with a threshold ϵ = 40. * denotes measurements in mature oocytes, modelled as 100 dpc (see ‘Materials and methods’). Note: the range in (B) does not correspond to a credibility interval on individual measurements, but rather on an expected underlying (population) variance, from which individual variance measurements are sampled. We thus expect to see, for example, several measurements lower than this range due to sampling limitations (see text). (C) Posterior distributions on mtDNA turnover ν with time. (D) Posterior distribution on min , the minimum mtDNA copy number reached during development. (E) Posterior distribution on , a measure of the total amount of mtDNA turnover.
Figure 4
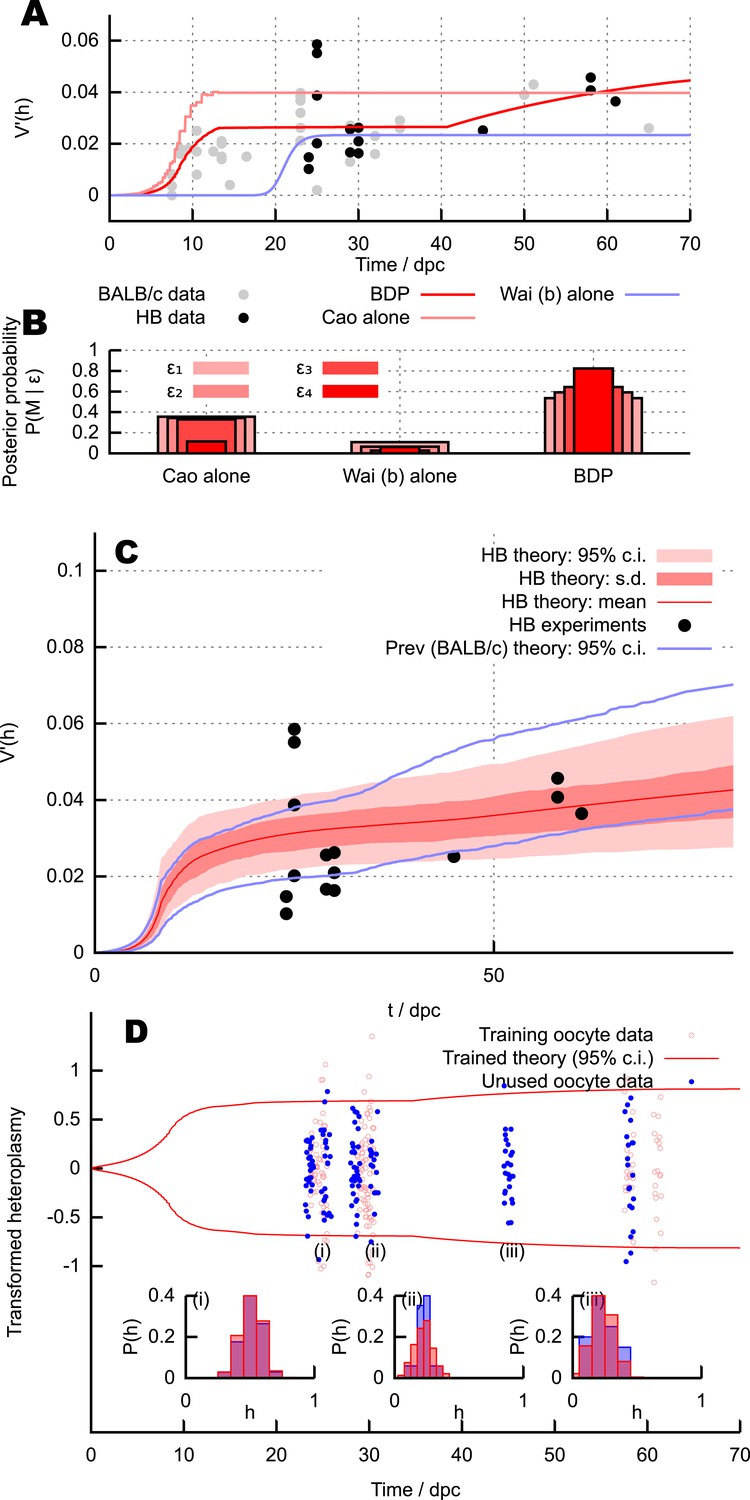
Predictions and experimental verification of the BDP model.
(A) New measurements from the HB mouse system, with optimised fits for the BDP, Wai (b) and Cao models. (B) Posterior probabilities of each model given this data under decreasing ABC threshold: ϵ = {50, 40, 30, 25}. (C) All measurements from the HB model (points) with inferred behaviour from ABC applied to the BDP model (red curves). As in Figure 3, this range does not correspond to a credibility interval on individual measurements, but rather on an expected underlying (population) variance, from which individual variance measurements are sampled. The inferred behaviour strongly overlaps with the inferred behaviour for the BALB/c system (blue curves), suggesting that the BDP model applies to a genetically diverse range of systems. (D) Heteroplasmy distributions. The transformation (Burgstaller et al., 2014) is used to compare distributions with different mean heteroplasmy. Red jitter points are samples from sets used to parameterise the BDP model; red curves show the 95% range on transformed heteroplasmy with time inferred from these samples. Blue jitter points are samples withheld independent from this parameterisation; their distributuions fall within the independently inferred range. Insets show, in untransformed space, distributions of the withheld heteroplasmy measurements (blue) compared to parameterised predictions (red); no withheld datasets show significant support against the predicted distribution (Anderson-Darling test, p < 0.05).
-
Figure 4—source data 1
Individual heteroplasmy measurements in the HB mouse model contributing to the new heteroplasmy variance data used to test our theory.
- https://doi.org/10.7554/eLife.07464.007
Figure 5
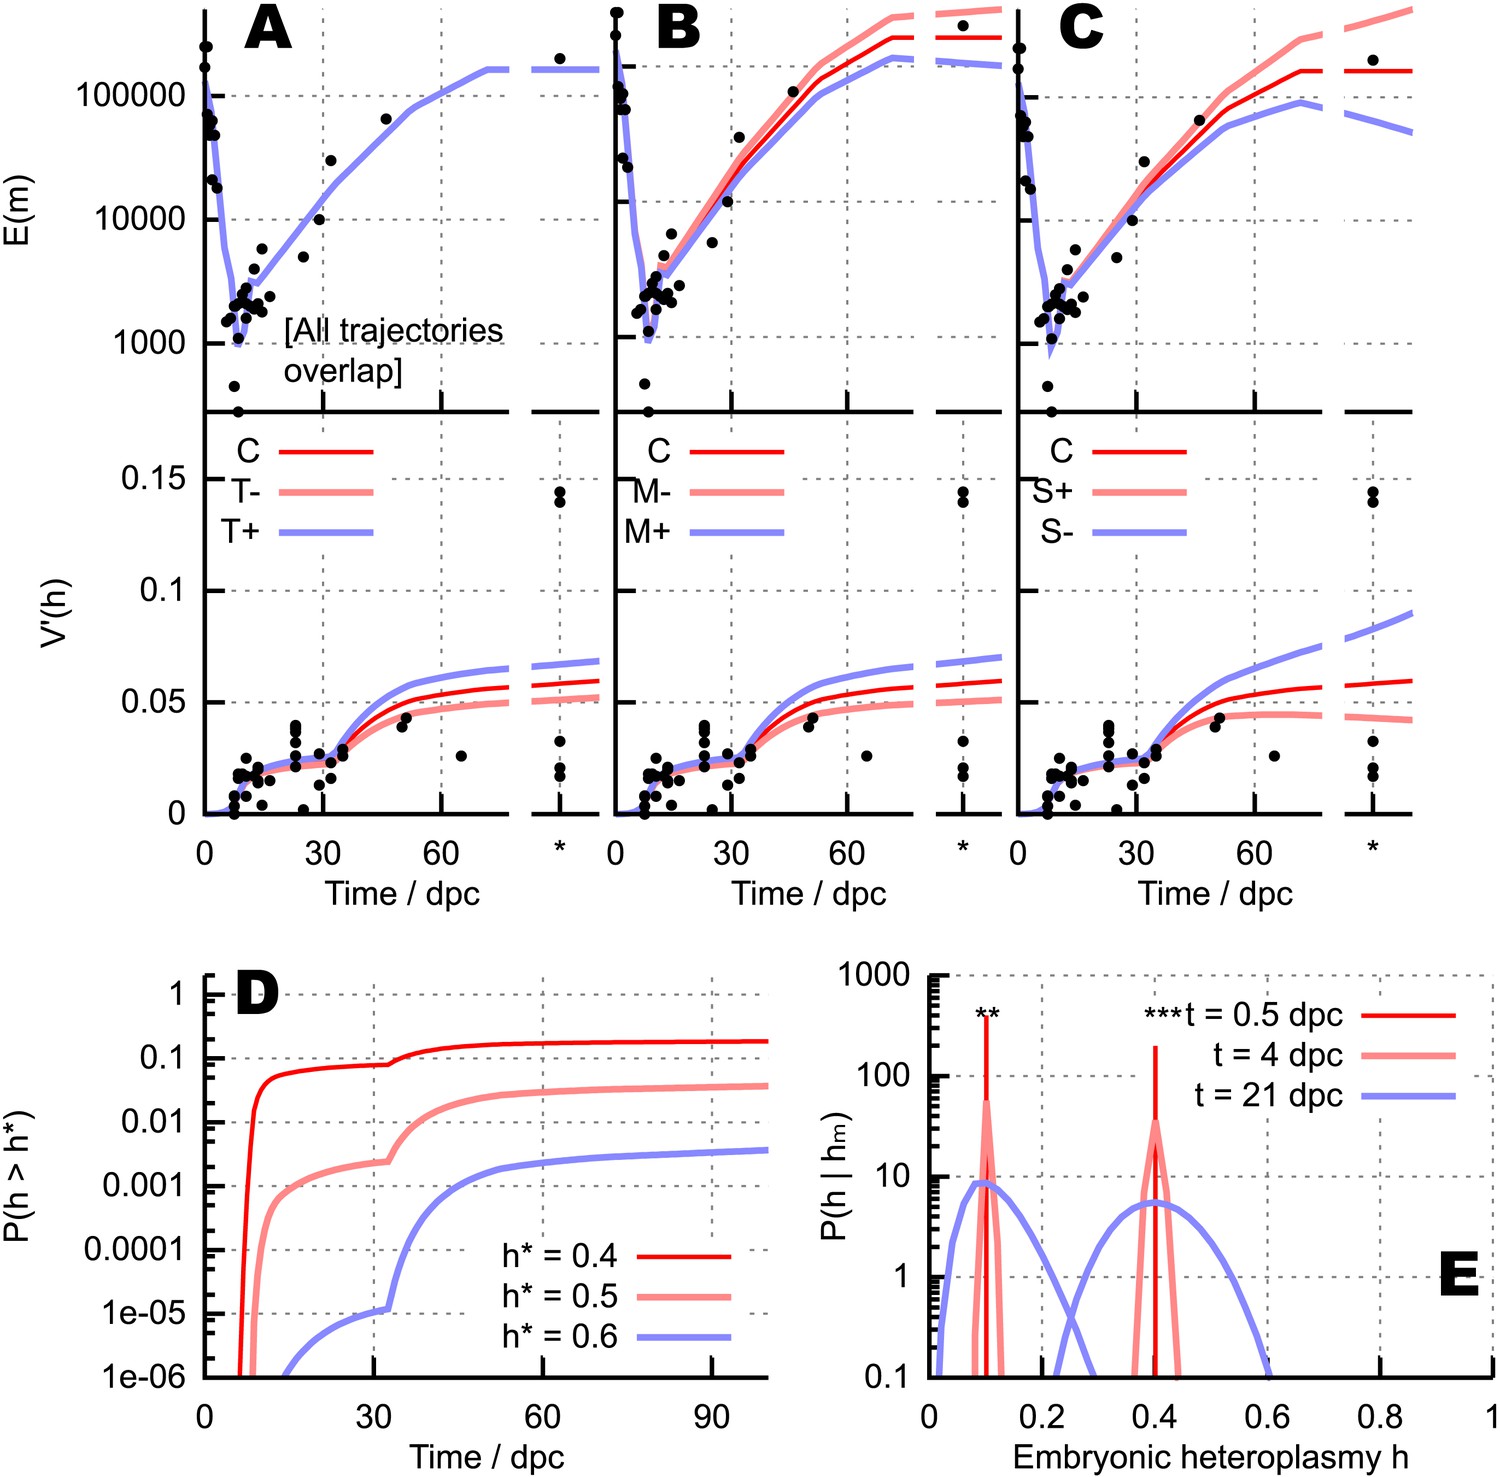
Quantitative influences and clinical results from our bottlenecking model.
(A–C) Trajectories of copy number and normalised heteroplasmy variance resulting from perturbing different physical parameters. Trajectory C labels the ‘control’ trajectory resulting from a fixed parameterisation; black dots show experimental data; * denotes measurements from primary oocytes, modelled at 100 dpc. (A) Increasing (T+) and decreasing (T−) mtDNA turnover (both mtDNA replication and degradation) by 20%. (B) Increasing (M+) and decreasing (M−) mtDNA degradation throughout development by a constant value (2 × 10⁻⁴, in units of day−1), while keeping replication constant. (C) Applying a positive (S+) and negative (S−) selective pressure to mutant mtDNA by 5 × 10⁻⁶ day−1. (D) Probability of crossing different heteroplasmy thresholds h* with time, starting with initial heteroplasmy h0 = 0.3. (E) Probability distributions over embryonic heteroplasmy h given a measurement hm from preimplantation sampling (** hm = 0.1; *** hm = 0.4) at different times.
Figure 6
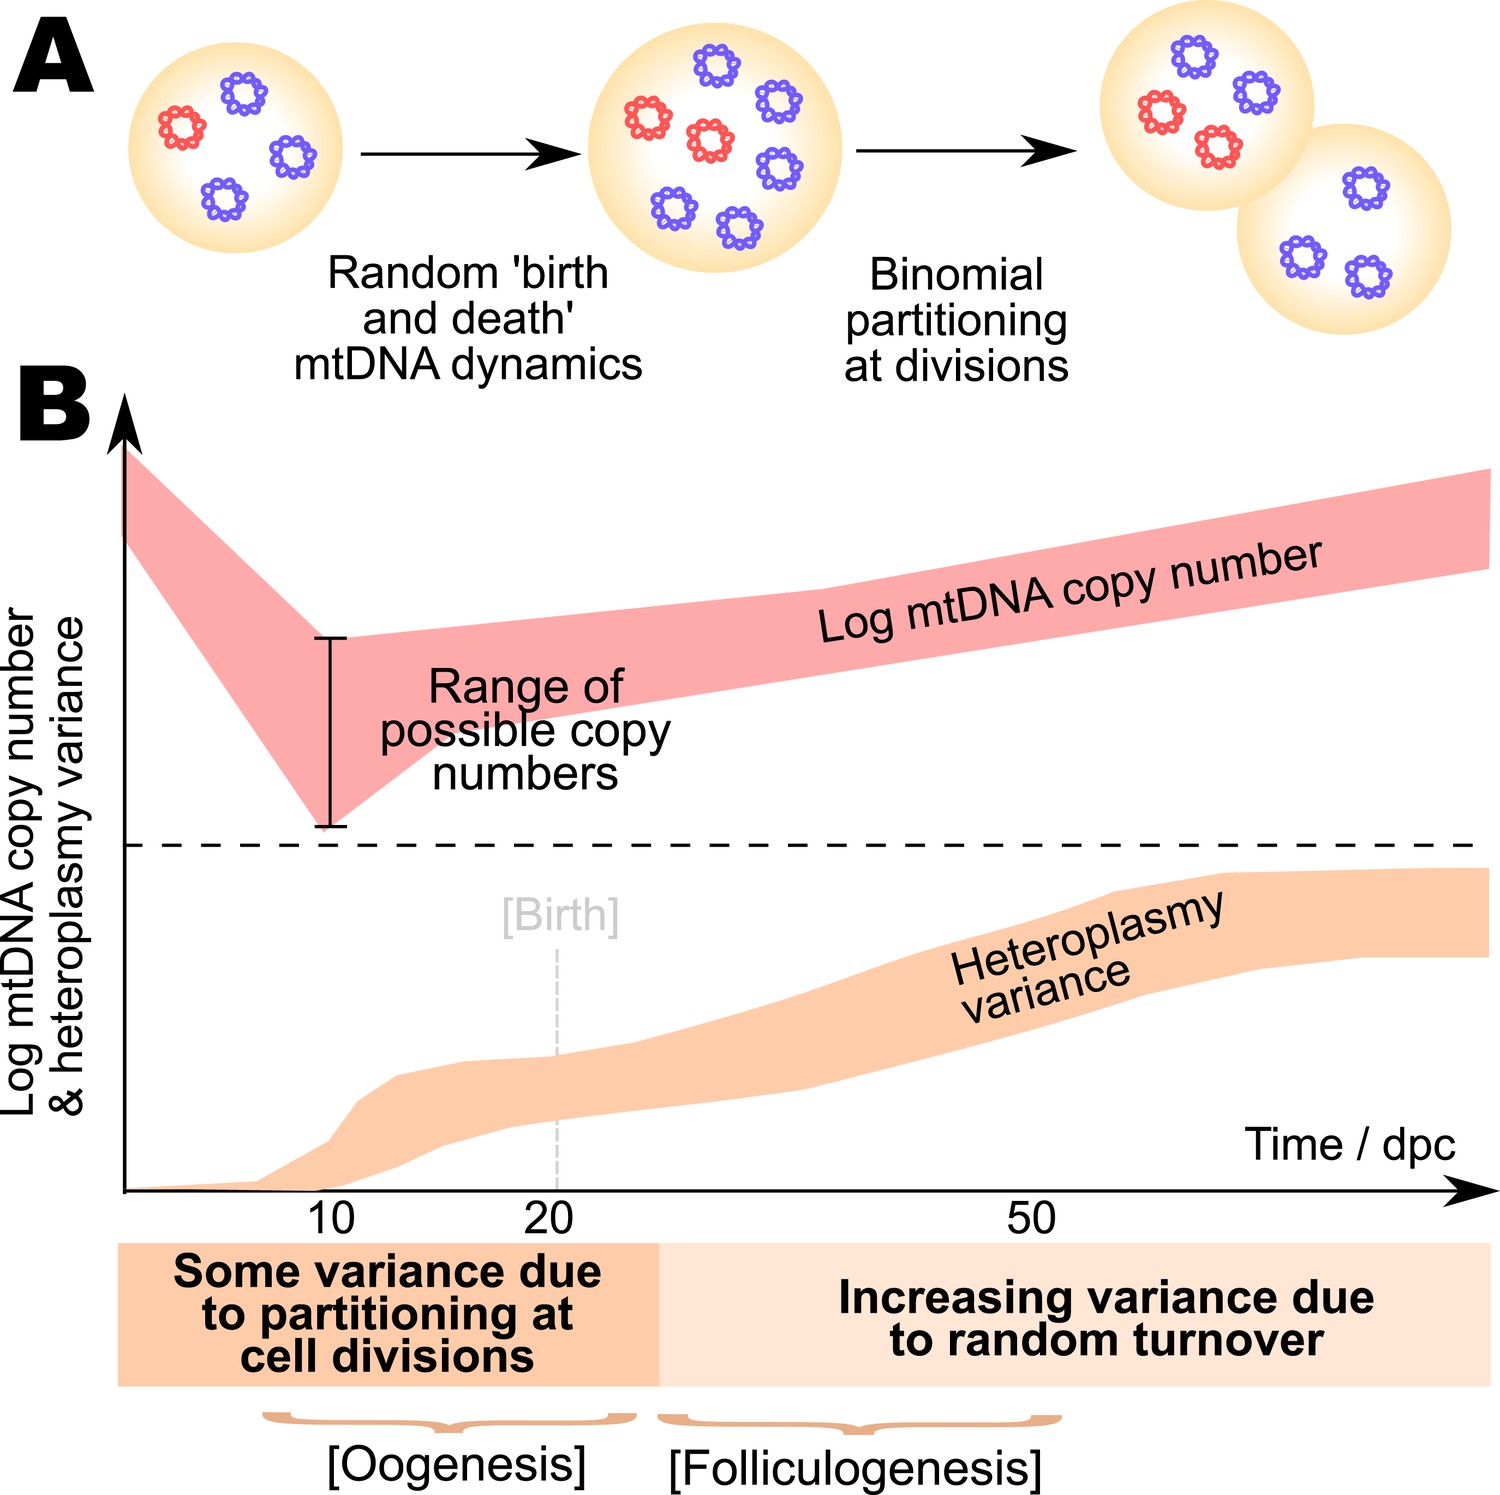
Model for the mtDNA bottleneck.
A summary of our findings. (A) There is most statistical support for a bottlenecking mechanism whereby mtDNA dynamics is stochastic within a cell cycle, involving random replication and degradation of mtDNA, and mtDNAs are binomially partitioned at cell divisions. (B) This mechanism results in heteroplasmy variance increasing both due to stochastic partitioning at divisions and due to random turnover. The absolute magnitude of the copy number bottleneck is not critical: a range of bottleneck sizes can give rise to observed dynamics. Random turnover of mtDNA increases heteroplasmy variance through folliculogenesis and germline development.
Appendix figure 1
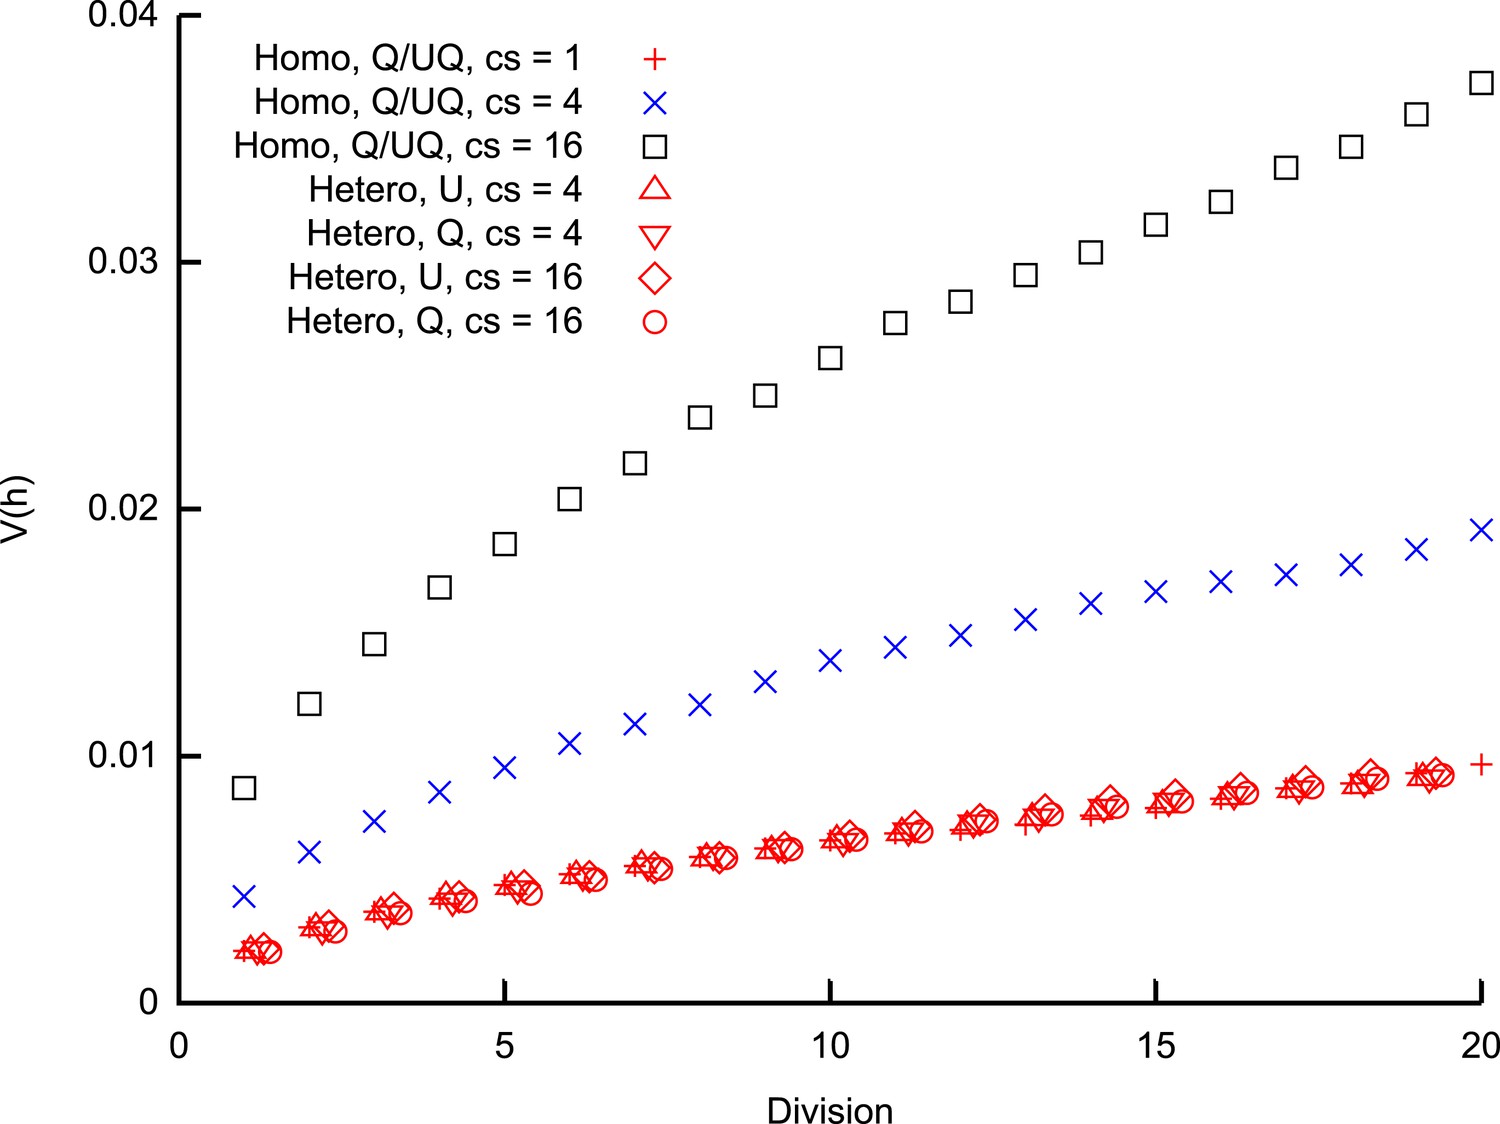
Heteroplasmy variance in a model system under several different group-inheritance regimes.
over many cell divisions when the elements of inheritance are heteroplasmic or homoplasmic groups of different size. Groups may be quenched (Q; constituents remain the same across cell divisions) or unquenched (UQ; constituents are randomly resampled from the cellular population each cell cycle); for homoplasmic clusters, an unquenched protocol yields identical results to the quenched protocol. behaviour differing from binomial partitioning (c = 1) is only observed for homoplasmic groups with c ≥ 2. Points for heteroplasmic groups are slightly offset in the x-direction for clarity.
Appendix figure 2
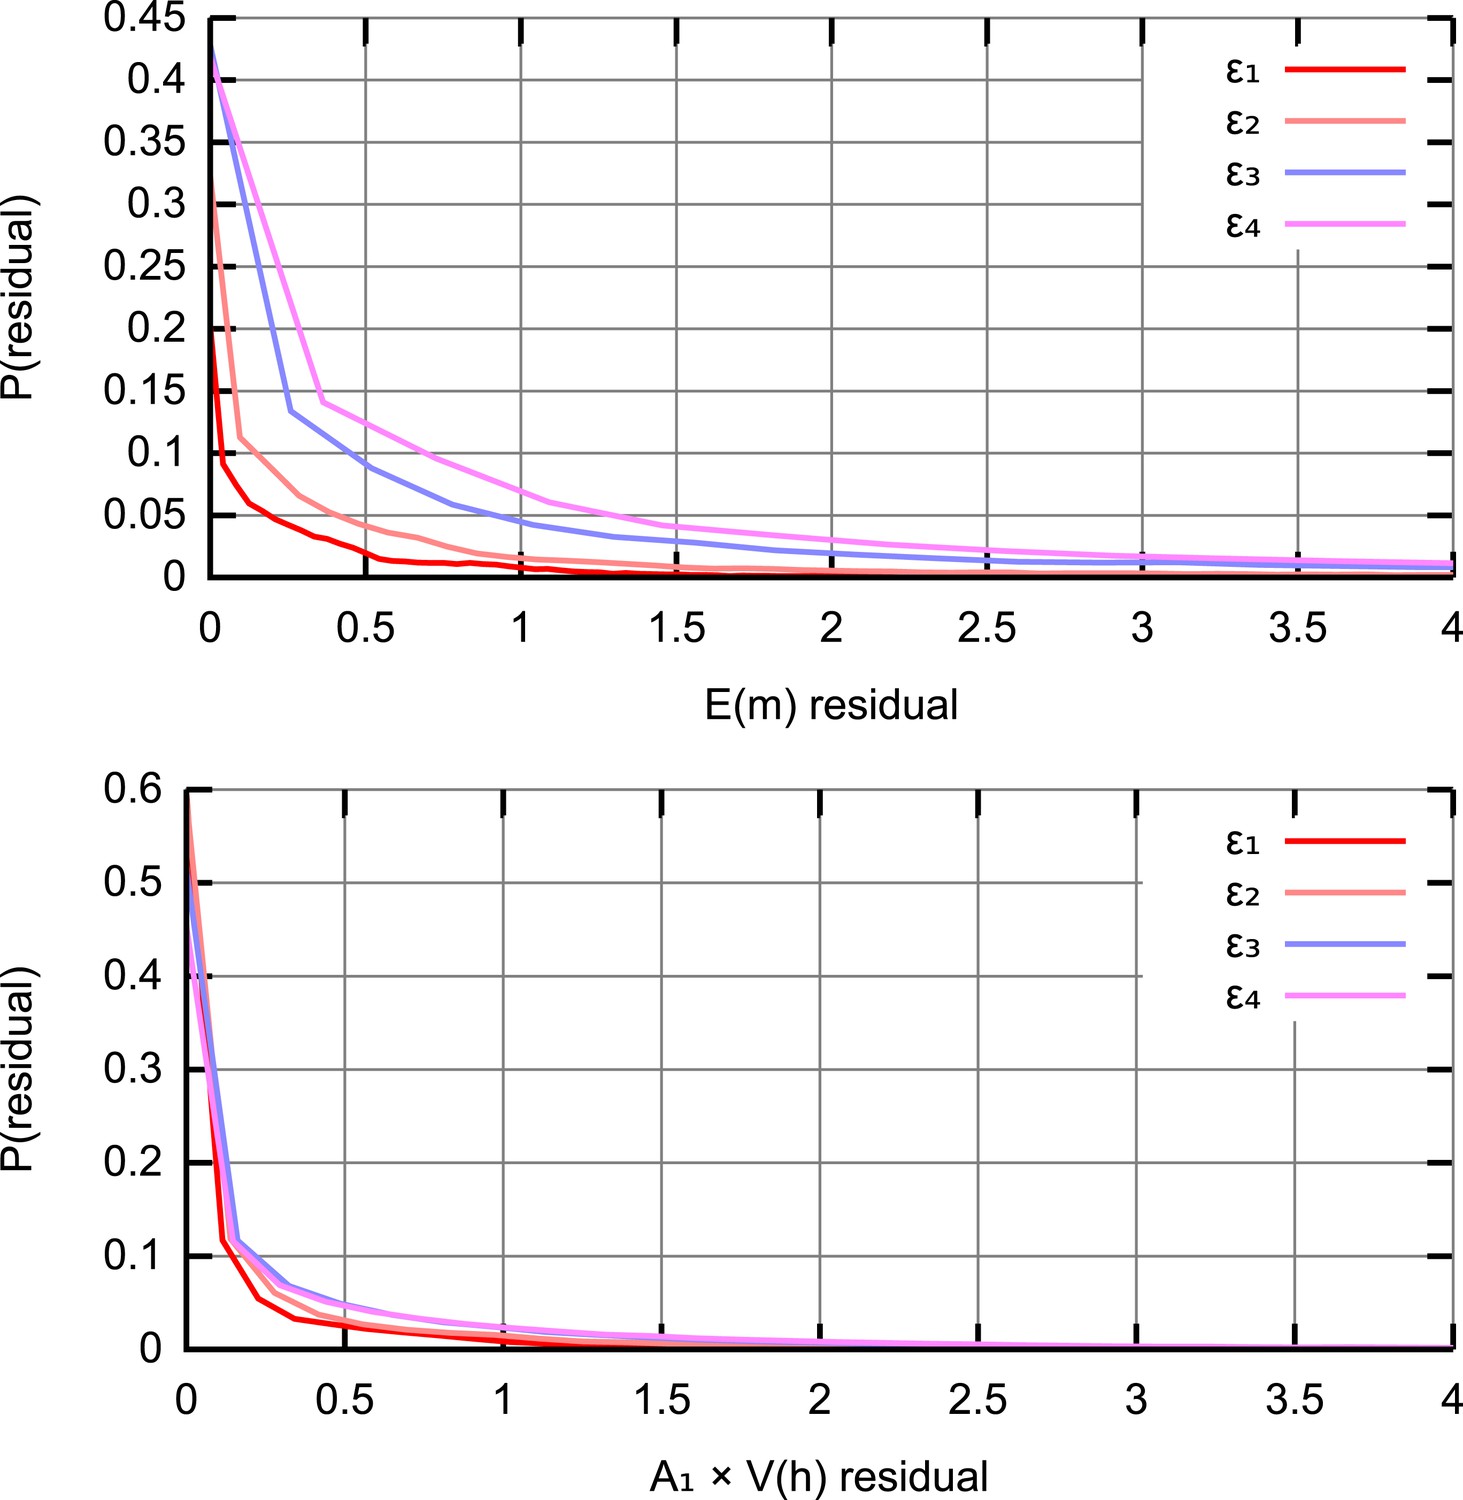
Residual distributions at different ABC thresholds ϵ.
The distribution of squared residuals corresponding to individual experimental datapoints compared to an ensemble of simulated trajectories for (top) (bottom) . The residuals are scaled by A1 = 103 to ensure that the two sets of measurements are compared on a quantitatively equal footing. As ϵ is decreased (ϵ1,2,3,4 = 40, 50, 75, 100), distributions of residuals from accepted trajectories tighten around zero.
Appendix figure 3
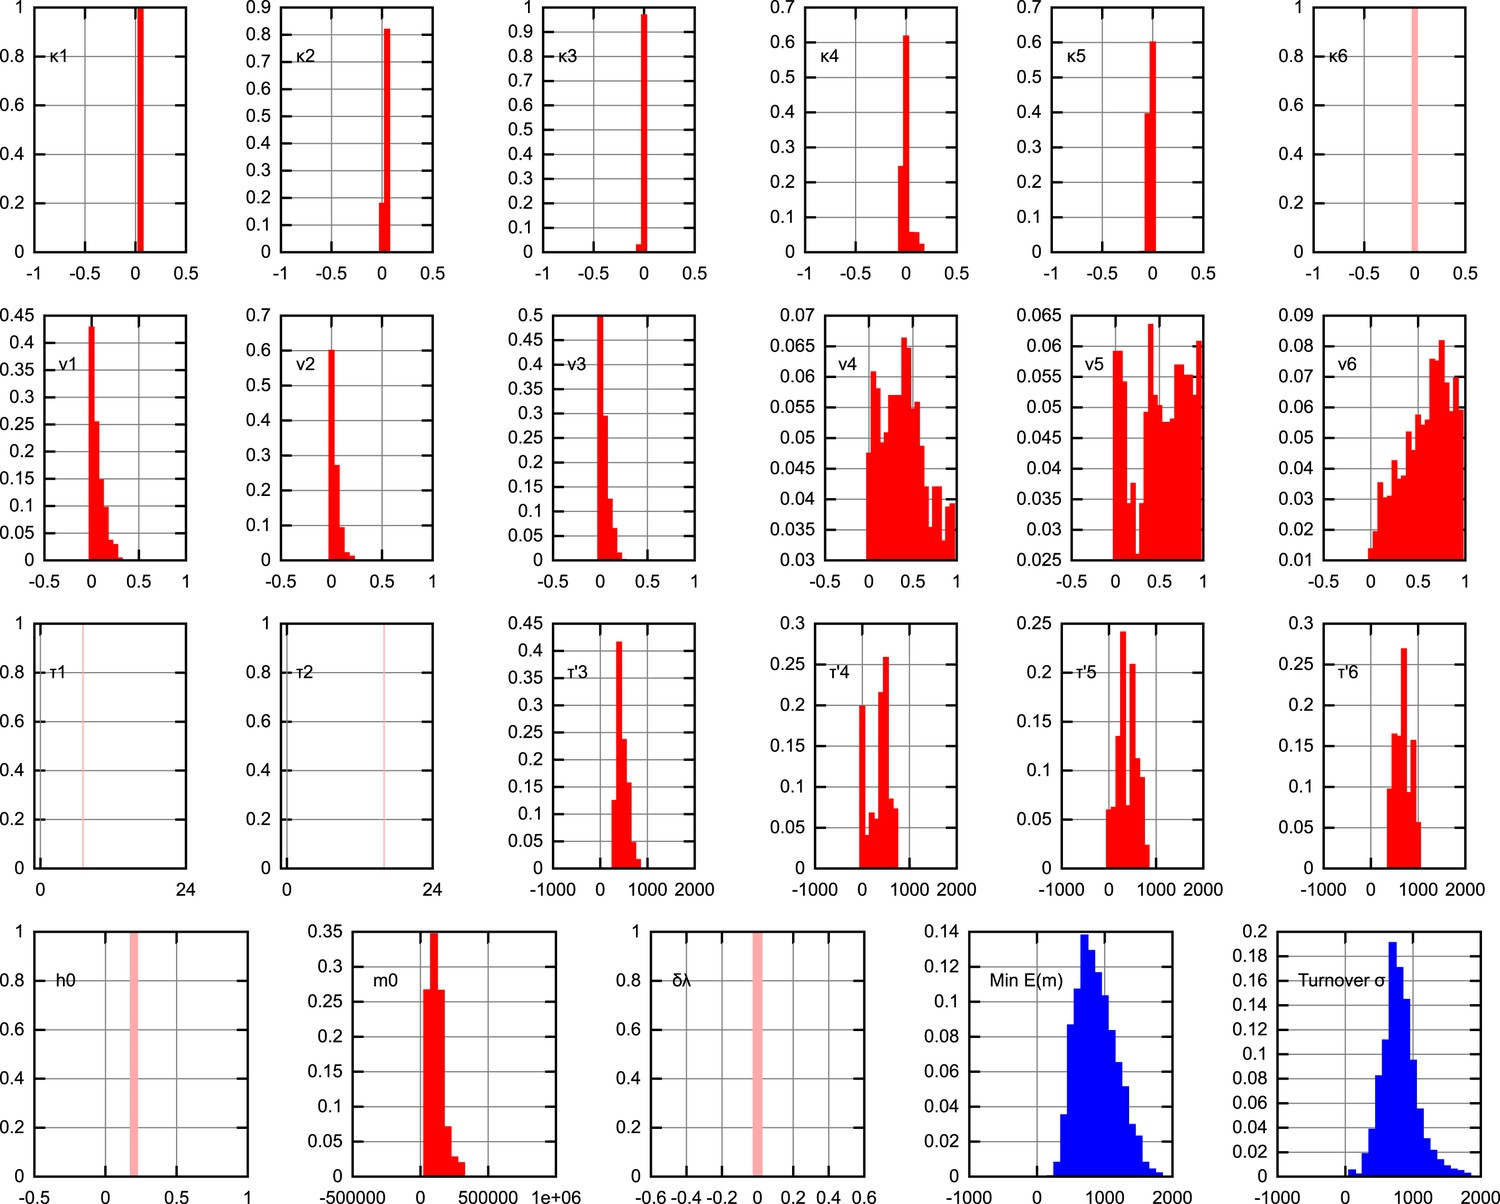
Posterior distributions on model parameters.
The posterior distributions on individual model parameters, assuming the inferred BDP bottlenecking mechanism. Replication rates are presented as κ = λ − ν, thus representing overall proliferation rates of mtDNA. Units are omitted for clarity. Pale, single-values distributions correspond to parameter values fixed within the model (κ6 = 0 to prevent mtDNA proliferation after development; τ1 = 7 hr, τ2 = 16 hr fixed by data on cell doubling times; h0 = 0.2 fixed for simplicity as heteroplasmy variances are normalised; δλ = 0 fixed to avoid varying selective pressure). The ‘turnover’ parameter, described in the text, is , a measure of the total random turnover in the mtDNA population.
Appendix figure 4

Comparison of truncated Normal approximation with exact heteroplasmy distribution.
Representations of heteroplasmy distributions at a time t = 21 dpc, with various starting heteroplasmies, using (as an example) the maximum likelihood parameterisation emerging from the inference procedure in the Main text. Dark lines and bars show exact distributions from Equation 72; pale lines and bars show distributions arising from the truncated Normal distribution described in the text.
Tables
Table 1
Source data used in this study
| Time/dpc | N | Source study | |
|---|---|---|---|
| 0 | 2.5e5 | 22 | Cree† |
| 0.29 | 2.5e5 | 18 | Cree† |
| 0.58 | 5.8e4 | 9 | Cree† |
| 0.73 | 6.3e4 | 19 | Cree† |
| 0.88 | 4.8e4 | 33 | Cree† |
| 1.31 | 1.8e4 | 11 | Cree† |
| 7.5 | 4.5e2 | 596 | Cree‡ |
| 8.5 | 1.1e3 | 165 | Cree‡ |
| 10.5 | 1.6e3 | 96 | Cree‡ |
| 14.5 | 1.8e3 | 2615 | Cree‡, § |
| 0 | 1.7e5 | 42 | Cao† |
| 0.29 | 7.1e4 | 32 | Cao† |
| 0.58 | 4.8e4 | 32 | Cao† |
| 0.88 | 2.1e4 | 32 | Cao† |
| 5.5 | 1.5e3 | 85 | Cao‡, § |
| 6.5 | 1.6e3 | 43 | Cao‡, § |
| 7.5 | 2.0e3 | 53 | Cao‡, § |
| 7.75 | 2.0e3 | 42 | Cao‡, § |
| 8.5 | 2.1e3 | 82 | Cao‡, § |
| 9.5 | 2.2e3 | 93 | Cao‡, § |
| 10.5 | 2.1e3 | 74 | Cao‡, § |
| 11.5 | 2.0e3 | 67 | Cao‡, § |
| 12.5 | 1.9e3 | 124 | Cao‡, § |
| 13.5 | 2.1e3 | 71 | Cao‡, § |
| 8.5 | 2.8e2 | 20 | Wai# |
| 9.5 | 2.5e3 | 20 | Wai# |
| 10.5 | 2.8e3 | 20 | Wai# |
| 12.5 | 4.0e3 | 20 | Wai# |
| 14.5 | 5.8e3 | 20 | Wai# |
| 16.5 | 2.4e3 | 20 | Wai# |
| 25 | 5.0e3 | 20 | Wai# |
| 29 | 1.0e4 | 20 | Wai# |
| 32 | 3.0e4 | 20 | Wai# |
| 46 | 6.5e4 | 20 | Wai# |
| Time/dpc | N | Source study | |
|---|---|---|---|
| 7.5 | 5.2e-6 | 12 | Jenuth¶ |
| 7.5 | 0.008 | 4 | Jenuth¶ |
| 7.5 | 0.004 | 3 | Jenuth¶ |
| 7.5 | 0.008 | 5 | Jenuth¶ |
| 23 | 0.039 | 40 | Jenuth¶ |
| 23 | 0.032 | 37 | Jenuth¶ |
| 23 | 0.040 | 35 | Jenuth¶ |
| 23 | 0.038 | 35 | Jenuth¶ |
| 23 | 0.037 | 34 | Jenuth¶ |
| 23 | 0.021 | 48 | Jenuth¶ |
| 23 | 0.026 | 45 | Jenuth¶ |
| * | 0.140 | 26 | Jenuth¶, ** |
| * | 0.017 | 24 | Jenuth¶, ** |
| * | 0.144 | 31 | Jenuth¶, ** |
| * | 0.021 | 49 | Jenuth¶, ** |
| * | 0.033 | 31 | Jenuth¶, ** |
| 8.5 | 0.016 | 20 | Wai††, ‡‡ |
| 8.5 | 0.018 | 20 | Wai††, ‡‡ |
| 9.5 | 0.018 | 20 | Wai††, ‡‡ |
| 10.5 | 0.017 | 20 | Wai††, ‡‡ |
| 10.5 | 0.025 | 20 | Wai††, ‡‡ |
| 10.5 | 0.008 | 20 | Wai††, ‡‡ |
| 12.5 | 0.017 | 20 | Wai††, ‡‡ |
| 13.5 | 0.014 | 20 | Wai††, ‡‡ |
| 13.5 | 0.015 | 20 | Wai††, ‡‡ |
| 13.5 | 0.020 | 20 | Wai††, ‡‡ |
| 13.5 | 0.021 | 20 | Wai††, ‡‡ |
| 14.5 | 0.004 | 20 | Wai††, ‡‡ |
| 16.5 | 0.015 | 20 | Wai††, ‡‡ |
| 25.0 | 0.002 | 20 | Wai††, ‡‡ |
| 25.0 | 0.002 | 20 | Wai††, ‡‡ |
| 29.0 | 0.013 | 20 | Wai††, ‡‡ |
| 29.0 | 0.027 | 20 | Wai††, ‡‡ |
| 32.0 | 0.016 | 20 | Wai††, ‡‡ |
| 32.0 | 0.023 | 20 | Wai††, ‡‡ |
| 35.0 | 0.026 | 20 | Wai††, ‡‡ |
| 35.0 | 0.029 | 20 | Wai††, ‡‡ |
| 50.0 | 0.039 | 20 | Wai††, ‡‡ |
| 51.1 | 0.043 | 20 | Wai††, ‡‡ |
| 65.0 | 0.026 | 20 | Wai††, ‡‡ |
-
†
Data referenced by number of cells post–conception is assigned a time measurement assuming the 7 hr → 16 hr doubling times from Lawson and Hage (1994).
-
‡
Mean copy number taken directly from tabulated data.
-
§
(Weighted) average over germline cell classes presented at this time point.
-
#
Extracted from data in figures; n not explicitly available so estimated as n = 20 from accompanying histograms and discussion.
-
¶
Manually normalised from given data.
-
**
Data from mature oocytes in next generation: time in dpc not available.
-
††
Extracted from data in figure in correspondence following study.
-
‡‡
n not explicitly available so estimated as n = 20 from accompanying histograms and discussion in original paper.
Table 2
New heteroplasmy measurements from the HB model system
| Age | 3 | 3 | 4 | 4 | 4 | 4 | 8 | 8 | 9 | 9 | 9 | 24 | 37 | 37 | 40 |
| n | 25 | 30 | 21 | 13 | 13 | 11 | 30 | 34 | 20 | 17 | 36 | 25 | 24 | 20 | 20 |
| 0.501 | 0.419 | 0.183 | 0.337 | 0.382 | 0.354 | 0.301 | 0.559 | 0.193 | 0.245 | 0.049 | 0.457 | 0.566 | 0.276 | 0.238 | |
| 0.00256 | 0.00359 | 0.00824 | 0.01308 | 0.00913 | 0.00461 | 0.00350 | 0.00631 | 0.00408 | 0.00301 | 0.00097 | 0.00625 | 0.01000 | 0.00913 | 0.00662 | |
| 0.0102 | 0.0147 | 0.0551 | 0.0585 | 0.0387 | 0.0202 | 0.0167 | 0.0256 | 0.0262 | 0.0163 | 0.0210 | 0.0252 | 0.0407 | 0.0457 | 0.0364 | |
| h × 100 | 40.8 | 26.5 | 7.4 | 16.7 | 26.9 | 25.1 | 18.2 | 38.7 | 8.3 | 13.3 | 1.7 | 32.5 | 38.0 | 12.8 | 8.9 |
| 43.4 | 30.6 | 7.6 | 23.1 | 28.8 | 25.7 | 22.0 | 41.7 | 9.3 | 16.9 | 1.7 | 32.6 | 39.2 | 13.8 | 12.1 | |
| 44.1 | 31.8 | 7.9 | 24.0 | 29.4 | 29.1 | 23.7 | 43.9 | 10.8 | 20.1 | 1.8 | 37.1 | 45.9 | 15.9 | 13.9 | |
| 44.2 | 33.2 | 9.6 | 24.4 | 29.8 | 30.8 | 23.9 | 46.4 | 13.5 | 20.2 | 1.9 | 37.1 | 50.9 | 16.6 | 15.7 | |
| 46.6 | 36.4 | 9.7 | 26.8 | 30.2 | 36.5 | 24.6 | 47.5 | 13.5 | 20.2 | 2.0 | 38.0 | 51.0 | 20.3 | 18.8 | |
| 46.7 | 37.7 | 10.3 | 27.0 | 36.7 | 36.7 | 25.9 | 47.9 | 15.8 | 21.3 | 2.8 | 39.5 | 51.7 | 20.6 | 19.1 | |
| 46.9 | 37.9 | 12.4 | 28.6 | 37.1 | 38.2 | 26.0 | 49.5 | 16.3 | 23.7 | 2.8 | 40.0 | 51.7 | 21.8 | 19.5 | |
| 47.4 | 38.7 | 14.3 | 39.8 | 40.2 | 38.3 | 26.2 | 51.4 | 16.4 | 24.9 | 2.9 | 41.1 | 51.8 | 23.6 | 20.8 | |
| 48.0 | 39.2 | 14.8 | 40.4 | 40.5 | 40.4 | 26.3 | 51.5 | 18.4 | 25.2 | 2.9 | 43.0 | 52.0 | 23.8 | 22.5 | |
| 48.4 | 39.5 | 16.0 | 41.9 | 43.6 | 43.6 | 26.9 | 52.8 | 18.7 | 26.2 | 3.0 | 43.7 | 54.1 | 26.2 | 22.7 | |
| 48.5 | 39.7 | 17.0 | 42.9 | 45.8 | 44.8 | 26.9 | 52.8 | 20.7 | 27.0 | 3.0 | 43.7 | 54.2 | 28.3 | 23.2 | |
| 48.7 | 41.4 | 17.1 | 50.1 | 46.7 | – | 27.8 | 52.9 | 20.7 | 27.3 | 3.0 | 44.2 | 54.4 | 29.6 | 23.4 | |
| 49.3 | 42.1 | 18.6 | 52.8 | 60.5 | – | 28.9 | 53.2 | 21.3 | 27.6 | 3.0 | 44.5 | 54.9 | 32.6 | 27.8 | |
| 50.3 | 42.6 | 19.7 | – | – | – | 29.1 | 53.2 | 21.8 | 27.8 | 3.3 | 46.3 | 55.3 | 33.1 | 28.9 | |
| 50.5 | 42.7 | 20.8 | – | – | – | 29.7 | 53.5 | 23.8 | 28.2 | 3.3 | 46.6 | 55.7 | 33.1 | 29.4 | |
| 50.6 | 42.7 | 25.7 | – | – | – | 29.9 | 53.9 | 24.2 | 30.0 | 3.5 | 47.0 | 57.2 | 34.5 | 30.1 | |
| 50.8 | 42.9 | 25.7 | – | – | – | 30.1 | 54.2 | 26.5 | 36.7 | 3.5 | 49.1 | 57.5 | 38.4 | 30.9 | |
| 51.2 | 43.8 | 26.4 | – | – | – | 30.7 | 55.2 | 26.5 | – | 3.7 | 49.8 | 59.9 | 40.5 | 34.8 | |
| 53.7 | 44.5 | 28.3 | – | – | – | 31.3 | 56.0 | 26.8 | – | 3.8 | 50.1 | 61.1 | 42.2 | 35.2 | |
| 54.5 | 44.7 | 35.6 | – | – | – | 31.7 | 56.2 | 32.1 | – | 3.8 | 51.8 | 64.8 | 43.9 | 39.4 | |
| 55.0 | 44.8 | 39.3 | – | – | – | 32.6 | 57.1 | – | – | 4.0 | 53.0 | 69.9 | – | – | |
| 56.2 | 45.9 | – | – | – | – | 33.0 | 57.3 | – | – | 4.0 | 54.3 | 74.1 | – | – | |
| 56.6 | 47.0 | – | – | – | – | 33.4 | 59.8 | – | – | 4.9 | 55.7 | 76.1 | – | – | |
| 59.0 | 47.6 | – | – | – | – | 33.6 | 60.0 | – | – | 5.5 | 55.7 | 76.5 | – | – | |
| 62.0 | 48.7 | – | – | – | – | 34.7 | 60.1 | – | – | 5.8 | 66.2 | – | – | – | |
| – | 48.7 | – | – | – | – | 34.9 | 61.3 | – | – | 5.9 | – | – | – | – | |
| – | 48.8 | – | – | – | – | 35.3 | 61.3 | – | – | 6.0 | – | – | – | – | |
| – | 48.9 | – | – | – | – | 35.8 | 62.1 | – | – | 6.1 | – | – | – | – | |
| – | 49.1 | – | – | – | – | 41.2 | 65.6 | – | – | 6.7 | – | – | – | – | |
| – | 49.7 | – | – | – | – | 48.5 | 67.1 | – | – | 7.9 | – | – | – | – | |
| – | – | – | – | – | – | – | 68.3 | – | – | 8.2 | – | – | – | – | |
| – | – | – | – | – | – | – | 69.2 | – | – | 8.3 | – | – | – | – | |
| – | – | – | – | – | – | – | 69.4 | – | – | 8.5 | – | – | – | – | |
| – | – | – | – | – | – | – | 70.1 | – | – | 8.8 | – | – | – | – | |
| – | – | – | – | – | – | – | – | – | – | 11.6 | – | – | – | – | |
| – | – | – | – | – | – | – | – | – | – | 16.6 | – | – | – | – |
-
Heteroplasmy measurements and statistics from the HB model system. Ages are given in days after birth.
Table 3
Experiments for further elucidation of the mtDNA bottleneck
| Measurement | Purpose |
|---|---|
| MtDNA copy number before and after cell divisions and/or variance of copy number between daughter cells | To elucidate mechanism of mtDNA partitioning and whether this partitioning is deterministic or stochastic |
| Copy number trajectories with different mtDNA heteroplasmies | To assess the modulation of copy number dynamics by mtDNA heteroplasmy via retrograde signalling |
| Measurement of mean heteroplasmy through development, with a variety of mtDNA type pairings | To assess and quantify to what extent selection modulates mtDNA dynamics during germline development |
| Copy number measurements after upregulation of mitophagy | To assess the presence and strength of compensatory mechanisms that may act to preserve mtDNA copy number—and hence whether upregulating mitophagy will act to increase mtDNA turnover or simply lower copy number |
| Heteroplasmy variance after upregulation of mitophagy | To assess the efficacy of mitophagy for increasing the power of the bottleneck |
| Heteroplasmy distribution in cells after the bottleneck from sampled/known initial heteroplasmy | To confirm predictions for threshold crossing and statistics between generations |
| BrU incorporation in oocytes between 30 and 40 dpc | To confirm the random turnover mechanism: we expect a large proportion of BrU incorporation subset of mtDNAs to be observed in this time period (see section ‘Observation of a subset of replicating genomes’) |
| Mitochondrial ultrastructure and mtDNA localisation during development | To assess and characterise any potential modulation of the size of units of mitochondrial inheritance by mitochondrial dynamics through development, in particular, investigating whether there is time-varying modulation of cluster size at points of division |
Download links
A two-part list of links to download the article, or parts of the article, in various formats.
Downloads (link to download the article as PDF)
Open citations (links to open the citations from this article in various online reference manager services)
Cite this article (links to download the citations from this article in formats compatible with various reference manager tools)
Stochastic modelling, Bayesian inference, and new in vivo measurements elucidate the debated mtDNA bottleneck mechanism
eLife 4:e07464.
https://doi.org/10.7554/eLife.07464


