A quantitative framework for whole-body coordination reveals specific deficits in freely walking ataxic mice

  1. Ana S Machado
  2. Dana M Darmohray
  3. João Fayad
  4. Hugo G Marques
  5. Megan R Carey  Is a corresponding author
  1. Champalimaud Foundation, Portugal

Abstract

The coordination of movement across the body is a fundamental, yet poorly understood aspect of motor control. Mutant mice with cerebellar circuit defects exhibit characteristic impairments in locomotor coordination; however, the fundamental features of this gait ataxia have not been effectively isolated. Here we describe a novel system (LocoMouse) for analyzing limb, head, and tail kinematics of freely walking mice. Analysis of visibly ataxic Purkinje cell degeneration (pcd) mice reveals that while differences in the forward motion of individual paws are fully accounted for by changes in walking speed and body size, more complex 3D trajectories and, especially, inter-limb and whole-body coordination are specifically impaired. Moreover, the coordination deficits in pcd are consistent with a failure to predict and compensate for the consequences of movement across the body. These results isolate specific impairments in whole-body coordination in mice and provide a quantitative framework for understanding cerebellar contributions to coordinated locomotion.

https://doi.org/10.7554/eLife.07892.001

eLife digest

Though it seems simple, walking is a complex activity. The arms, legs, body, and head all need to work together. A part of the brain called the cerebellum helps to coordinate the movements of different body parts allowing both simple and complex tasks to be carried out smoothly. But it is not known exactly how the cerebellum coordinates body movements.

Studies of mice have helped shed some light on the coordination of movement. Several mutations that naturally occur in mice can cause them to walk abnormally. These mutations often cause changes in the cerebellum. Neuroscientists studying these mutant mice often use balance beams or other challenging tasks to compare their coordination with typical mice. But studies attempting to measure specific changes in walking movements under natural conditions have yielded conflicting results.

Now, Machado, Darmohray et al. have demonstrated that an automated movement-tracking system can capture specific aspects of coordination in freely walking mice. The system, called ‘LocoMouse’, uses high-speed cameras and computers to document and analyze the paw, nose, and tail movements of mice walking through a glass hallway. In the experiments, the system was used to compare typical mice with mice that have a mutation affecting the cerebellum that causes them to walk abnormally.

Unexpectedly, Machado, Darmohray et al. found that forward steps of the mutant mice are comparable to the steps of the typical mice, if you account for the fact that the mutant mice are smaller and slower. Instead, however, the mutants were found to have specific difficulties coordinating movement across the body. The movements of the mutant mice's front and hind paws, for example, did not follow the same coordinated pattern as the typical mice. The mutant mice also swung their head and tail in an exaggerated way. Machado, Darmohray et al.'s analysis revealed that these movements likely resulted from a failure of the cerebellum of the mutant mice to predict and compensate for the motion of the rest of the body. Other scientists will now likely use the LocoMouse system to study mouse movements and how the brain controls them.

https://doi.org/10.7554/eLife.07892.002

Introduction

Our ability to engage in even the simplest motor tasks requires us to coordinate our movements in space and time across the body. For example, during walking, leg, arm, trunk, and head movements need to be coordinated to achieve a stable, smooth, and efficient gait. The cerebellum is critical for coordinated locomotion; cerebellar damage leads to characteristic gait ataxia across species. Exactly how the cerebellum contributes to motor coordination, however, remains controversial.

Mice present several advantages for understanding the role of the cerebellum in locomotor coordination. In addition to their amenability to genetic circuit dissection, their small size makes it possible to analyze even unrestrained, relatively complex whole-body actions within a laboratory setting. Moreover, several spontaneous mutants have been identified based on visible gait ataxia (Mullen et al., 1976; Walter et al., 2006; Lalonde and Strazielle, 2007; Cendelin, 2014). These mutants exhibit abnormal cell patterning within the cerebellum (Lalonde and Strazielle, 2007; Brooks and Dunnett, 2009; Kim et al., 2009; Sheets et al., 2013; Cendelin, 2014). While traditional gait analyses in ataxic mutants have reported a variety of impairments in individual limb movements and interlimb coordination (Fortier et al., 1987; Wang et al., 2006; Vinueza Veloz et al., 2014), many of these findings are not specific to ataxia and could represent secondary consequences of changes in walking speed (Batka et al., 2014). Therefore it has not been clear to what extent exisiting analyses of mouse locomotion capture the essence of the coordination deficits of ataxic mice that are so visible to the human eye (Cendelin et al., 2010).

Here we describe LocoMouse, a novel system for automated, markerless, 3D tracking of locomotor kinematics in freely walking mice. We used LocoMouse to establish a quantitative framework for locomotor coordination in mice and analyze the deficits of visibly ataxic Purkinje cell degeneration (pcd) mutants. Surprisingly, we find that the forward motion of individual paws is normal in pcd—apparent differences in basic stride parameters and forward trajectories disappeared once changes in body size and walking speed were taken into account. In contrast, 3D paw trajectories, interlimb and whole-body coordination were specifically impaired. Moreover, the prominent nose and tail oscillations observed in pcd were successfully modeled as passive consequences of the forward motion of the hind limbs, suggesting the absence of a mechanism that normally predicts and compensates for movements of other parts of the body. Taken together, these results suggest a specific failure to predict the consequences of movement across joints, limbs, and body, and are consistent with the hypothesis that the cerebellum provides a forward model for motor control (Bastian et al., 1996; Ebner and Pasalar, 2008; Kennedy et al., 2014).

Results

LocoMouse: a system for quantifying locomotor coordination

The noninvasive, markerless LocoMouse system (Figure 1) uses high-speed cameras and machine learning algorithms to automatically detect and track the position of paws, nose, and tail in 3D with high (2.5 ms) temporal resolution.

Figure 1 with 1 supplement see all
LocoMouse system for analyzing mouse locomotor coordination.

(A) LocoMouse apparatus. The mouse walks freely across a glass corridor with mirror below at a 45° angle. A single high-speed camera captures side and bottom views at 400 fps. Infrared (IR) sensors trigger data collection. (B) Machine learning algorithms identify paws, nose and tail segments and track their movements in 3D. Example ‘paw’ and ‘not paw’ training images for SVM (Support Vector Machine) feature detectors are shown for side and bottom views. (C) Continuous tracks are obtained by post-processing the feature detections with a Multi-Target Tracking algorithm. (D) Continuous forward trajectories (x position vs time) for paws, nose, and tail. The inset illustrates the color code used throughout the paper to identify individual features. (E) Continuous vertical (z) trajectories of the two front paws. (F) Side-to-side (y) position of proximal (green) to distal (yellow) tail segments vs time. (G) Individual strides were divided into swing and stance phases for further analysis. Further validation of tracking algorithm is presented in Figure 1—figure supplement 1.

https://doi.org/10.7554/eLife.07892.003

Mice walked across a glass corridor, 66.5 cm long and 4.5 cm wide (Figure 1A). A mirror was placed at 45 deg under the mouse, so that a single high-speed camera (AVT Bonito, 1440x250 pixels @400 frames per second) recorded both bottom and side views. Individual trials consisted of single crossings of the corridor. Mice freely initiated trials by walking back and forth between two dark ‘home’ boxes on each end of the corridor. Data collection was performed in LABVIEW and was automatically triggered by infrared sensors that detected when the mouse entered and exited the corridor.

After processing the images to subtract the background and correct for mirror and lens distortions, we applied a machine learning algorithm (Figure 1B) to identify and track all four paws, snout, and 15 tail segments in both bottom and side views for each trial (Figure 1C; Video 1; see ‘Materials and methods’). We then extracted the continuous forward (x), side-to-side (y), and vertical (z) trajectories for each feature from each movie (Figure 1D–F). The stride cycles of all four paws were automatically divided into swing and stance phases for subsequent analysis (Figure 1G). Validation of the tracking is provided in Figure 1—figure supplement 1.

Video 1
Automated, high-resolution locomotion tracking in freely walking mice.

High-speed (400 fps) video of a mouse crossing the LocoMouse corridor, displayed at 30 fps. Side and bottom (via mirror reflection) views of the mouse are captured in a single camera. Top: Raw video of a wild-type mouse. Bottom: Same video with the output of the machine learning tracking overlaid: nose (orange circle), paws (red: front right; blue: front left; magenta: hind right; cyan: hind left) and tail segments (green-to-yellow gradient circles).

https://doi.org/10.7554/eLife.07892.005

Paw stride parameters vary consistently with walking speed and body size

We first analyzed basic stride parameters for individual limbs of wildtype control mice (Figure 2). Parameters such as stride length (mm), cadence (strides/s), swing velocity (m/s), and stance duration (ms), along with the mouse's walking speed, were measured for each stride. The data were highly variable (Figure 2A; see also Figure 2—figure supplement 1). The walking speed of the mice was similarly variable (Figure 2B). We therefore sorted all strides for individual mice into speed bins in a stridewise manner and analyzed them with respect to the mouse's walking speed.

Figure 2 with 1 supplement see all
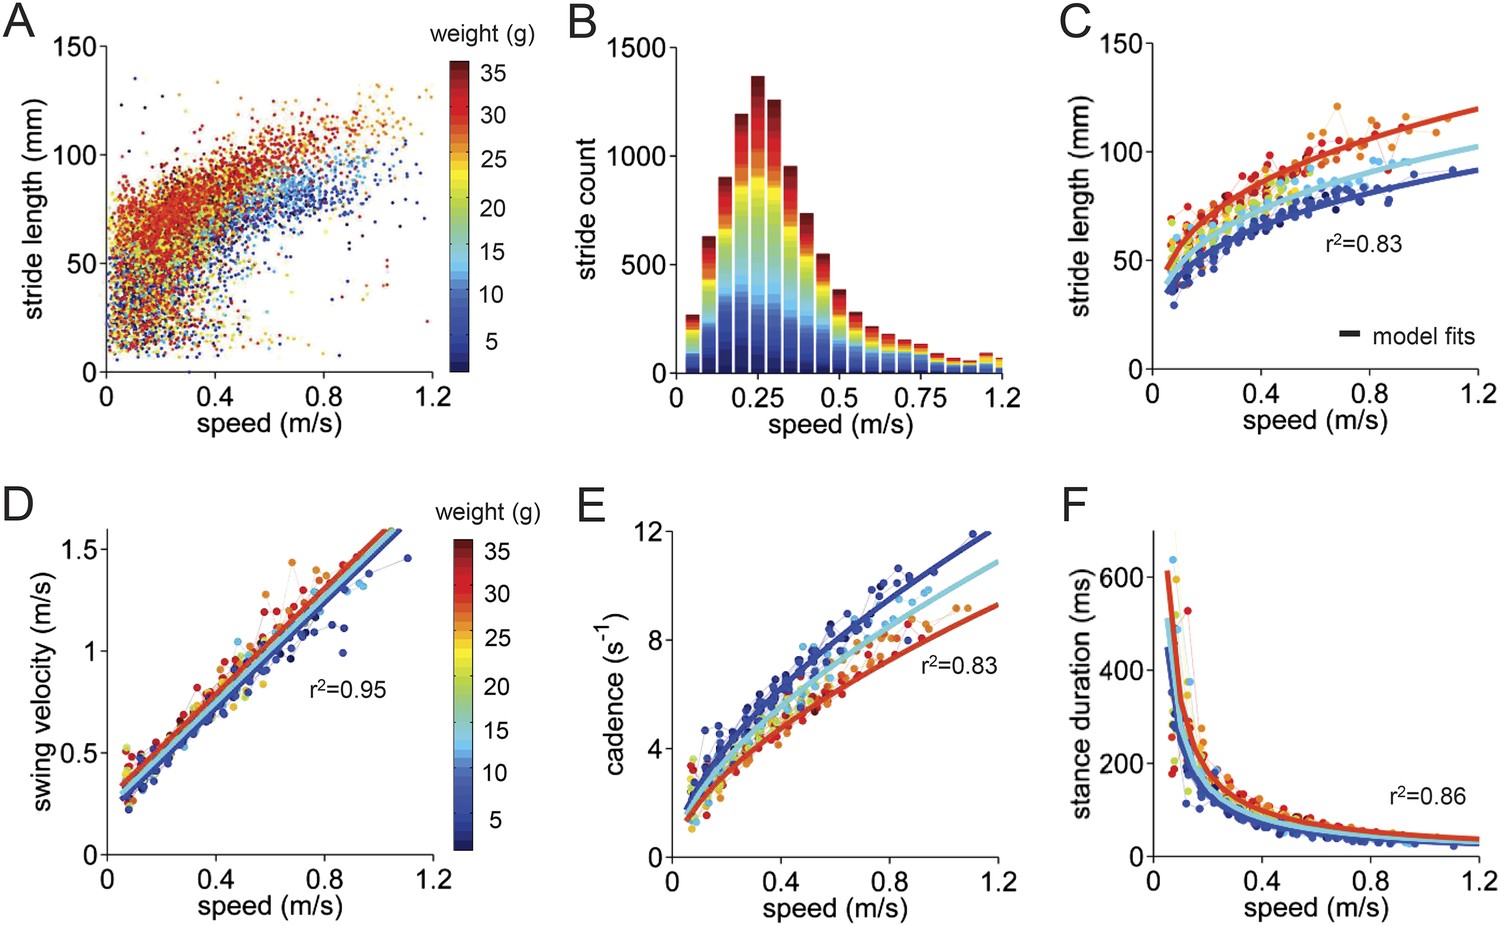
Basic stride parameters can be predicted using only walking speed and body size.

(A) Stride length vs walking speed for 9602 individual strides of the front right paws of 34 wildtype mice are color-coded by weight for each individual animal. More information on the mice can be found in Figure 2—figure supplement 1 and Figure 2—source data 1. (B) Histogram of average walking speeds for each stride from (A). Strides are divided into speed bins of 0.05 m/s. (CF) Stride length, cadence (1/stride duration), swing velocity, and stance duration vs walking speed, respectively. For each parameter, speed-binned median values are shown for each animal (solid circles, color coded by weight). Data for each animal are connected across speeds with a thin dotted line. Thick lines are the output of the linear mixed-effects model, for 3 example weights across walking speeds (blue: 9g, cyan:19g, red: 33g). Marginal R-squared values for each linear mixed model are shown for each parameter. All raw data for Figure 2 and Figure 2—figure supplement 1 can be found in Figure 2—source data 1.

https://doi.org/10.7554/eLife.07892.006
Figure 2—source data 1

Individual limb gait parameters, walking speed, and mouse metrics used to generate the linear mixed effects model in Figure 2.

Data for the four paws (FR HR FL HL) are stored in separate columns for all variables; rows are organized stride-wise. The linear mixed model shown in Figure 2 uses speed-binned data (0.05 m/s speed bins) from the FR paw, with a minimum stride count criterion of 5 strides per bin.

https://doi.org/10.7554/eLife.07892.007

The median values of stride parameters for each mouse across speed bins are shown in Figure 2C–F (dots connected by dashed lines). Each parameter measured, including stride length, cadence, swing velocity, and stance duration (Figure 2C–F), varied consistently with the walking speed of the mouse. Cadence and stride length increased with walking speed, indicating that faster walking in mice is associated with longer, more frequent strides (Clarke and Still, 1999; Lalonde and Strazielle, 2007; Batka et al., 2014). These changes, in turn, resulted from linear increases in swing velocity and steep decreases in stance duration with increasing walking speed. Further subdividing the data by the body weight of each animal (Figure 2—figure supplement 1) revealed that much of the remaining variability in each parameter could be accounted for by the mouse's body size (Figure 2, color-coded by weight).

To quantify the influence of walking speed, body size, and other potential factors on these basic stride parameters, 36,369 strides from an average of 1069 ± 266 strides in 34 mice were analyzed (Figure 2). For each parameter, we first linearized the data by fitting appropriate functions (e.g., linear, power) to the data with respect to walking speed (Figure 2—figure supplement 1). Then we generated a multilevel linear mixed-effects model that included potential predictor variables speed, weight, body length, age, and gender either alone or in combination and asked to what extent they accurately predicted the measured parameter. This analysis revealed that the value of each stride parameter was readily predicted based solely on walking speed and body weight (Figure 2—figure supplement 1). While basic stride parameters also varied with gender and age, these effects were related to differences in body size (Figure 2—figure supplement 1); adding neither age nor gender improved the predictions once body size was taken into account. The resulting best-fit models are plotted as thick lines in Figure 2C–F. These results indicate that the equations in Figure 2—figure supplement 1 provide quantitative predictions of paw stride parameters for mice of a given size, walking at a particular speed.

Purkinje cell degeneration (pcd) mice

The systematic analysis of stride parameters across mice presented above provided a starting point for quantifying locomotor deficits of ataxic mice. The Purkinje cell degeneration (pcd) mouse is a recessive mutant characterized by complete post-natal degeneration of cerebellar Purkinje cells and subsequent partial loss of cerebellar granule cells ([Chen et al., 1996; Le Marec and Lalonde, 1997; Lalonde and Strazielle, 2007; Cendelin, 2014]; The gene affected encodes ATP/GTP binding protein 1 [Fernandez-Gonzalez et al., 2002]). Pcd mice can be easily identified by eye based on their ataxic, uncoordinated movements (Mullen et al., 1976; Le Marec and Lalonde, 1997). Pcd mice exhibit impaired rotarod performance and deficits in eyelid conditioning that have been attributed to their cerebellar abnormalities (Chen et al., 1996; Le Marec and Lalonde, 1997). Perhaps surprisingly, given the severity of their anatomical phenotype, the motor deficits of pcd mice are relatively mild compared to other spontaneous ataxic mutants (Lalonde and Strazielle, 2007; Le Marec and Lalonde, 1997).

Changes in stride parameters are predicted by changes in walking speed and body size

Pcd mice were visibly ataxic when walking on the LocoMouse setup (Video 2). Consistent with previous studies of cerebellar ataxia in mice (Fortier et al., 1987; Wang et al., 2006; Cendelin et al., 2010; Vinueza Veloz et al., 2014), comparing the basic stride parameters of visibly ataxic pcd mice with littermate control mice revealed that the strides of pcd mice were, overall, quite different (Figure 3A–D). Stride lengths were shorter (Figure 3B, purple shadows), even when changes in walking speed (Figure 3A) were taken into account. Cadence and stance durations were also altered (Figure 3C,D, purple shadows).

Video 2
Purkinje cell degeneration mice are visibly ataxic.

Purkinje cell degeneration (pcd) mouse crossing the LocoMouse corridor. Pcd mice are smaller and walk more slowly than controls. They lift their paws higher and have altered patterns of interlimb coordination. The nose and tail oscillate laterally and vertically.

https://doi.org/10.7554/eLife.07892.009
Figure 3 with 2 supplements see all
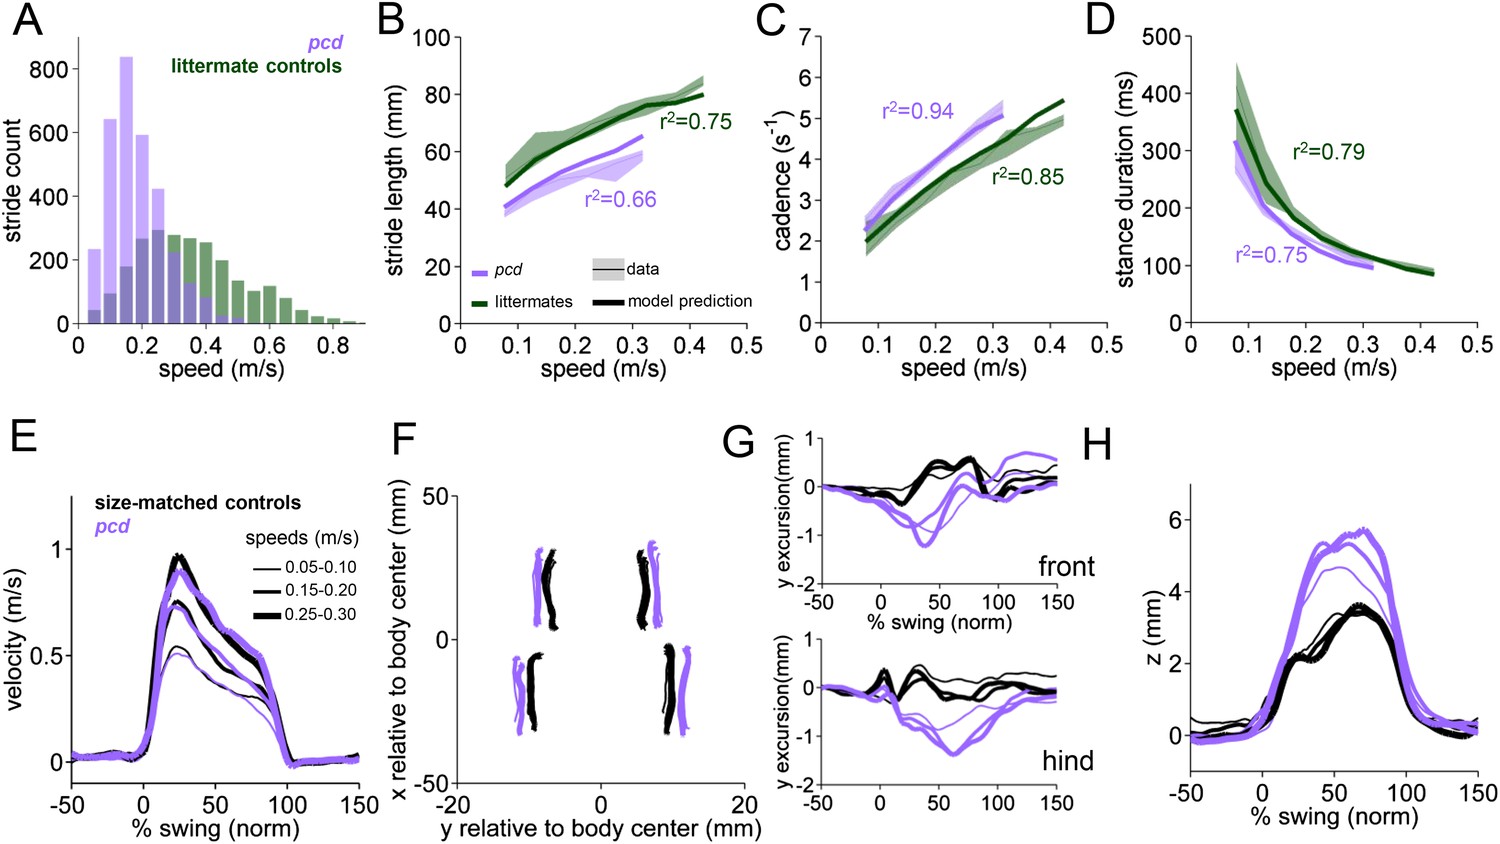
Differences in forward paw trajectories in pcd can be accounted for by walking speed and body size; impairments are restricted to off-axis movement.

(A) Histogram of walking speeds, divided into 0.05 m/s speed bins for pcd (purple N = 3 mice; n = 3052 strides) and littermate controls (green, N = 7; n = 2256 strides). (BD) Stride length (B), cadence (C, 1/stride duration) and stance duration (D) vs walking speed for pcd mice (purple) and littermate controls (green). For each parameter, the thin lines with shadows represent median values ±25th, 75th percentiles. Thick lines represent the predictions calculated using the mixed-effect models described in Figure 2 and Figure 2—figure supplement 1 (including speed and weight as predictor variables). (E) Average instantaneous forward (x) velocity of FR paw during swing phase for pcd (purple) and size-matched controls (black). Line thickness represents increasing speed. (F) x-y position of four paws relative to the body center during swing. (G) y-excursion for front and hind paws, relative to body midline. (H) Average vertical (z) position of FR paw relative to ground during swing.

https://doi.org/10.7554/eLife.07892.010

Since pcd mice, like many ataxic animals, are smaller than controls (Figure 3—figure supplement 1), and given that they walk more slowly (Figure 3A), we asked to what extent the altered stride parameters in pcd could be accounted for simply by changes in body size and walking speed. To do this we used the equations derived from the linear mixed-effects models in Figure 2 to predict stride parameters across walking speeds for mice the size of the pcd mice and their littermates. The models accurately predicted stride parameters for the littermates, which were not visibly ataxic (Figure 3B–D, green: thick lines represent model predictions). Surprisingly, we also found that the models accurately predicted stride parameters of pcd mice (Figure 3B–D, purple). Thus, although stride parameters of pcd mice were different overall from controls (Figure 3B–D, purple vs green shadows), they were comparable to those predicted for control mice of similar body size walking at similar speeds (Figure 3B–D, the thick lines representing the model predictions fall on top of the data in the shadows). Moreover, a direct comparison between stride parameters for pcd mice and size-matched controls walking at the same speeds revealed no difference between the two groups (Figure 3—figure supplement 1) (stride length F(14,1) = 0.70, p = 0.42; cadence F(14,1) = 0.004, p = 0.95; stance duration F(14,1) = 1.89, p = 0.17).

Next we investigated the possibility that there could be changes in variability of stride parameters in pcd that were not apparent in the averaged data. Analysis of the coefficient of variation revealed that swing length variability was unchanged in pcd compared to size matched controls (F(81,1)=0.14, p = 0.0.71). Surprisingly, both cadence and stance duration were less variable in pcd (cadence: F(80,1)=6.90, p < 0.05; stance duration: F(80,1)=6.90, p < 0.05).

Taken together, these results demonstrate that basic stride parameters, although altered in pcd, do not capture the ataxic symptoms of pcd mice, and highlight the importance of accounting for walking speed (Koopmans et al., 2007; Cendelin et al., 2010; Batka et al., 2014) and using size-matched control animals when analyzing locomotor parameters. For this reason pcd animals are compared with size-matched controls from here on (Figure 3—figure supplement 1).

Strides of pcd mice show specific impairments in off-axis paw trajectories

It has been previously hypothesized that detailed analysis of paw trajectories would capture the gait abnormalities of ataxic mice like pcd, but detailed 3D paw kinematics have not been described for mice. We analyzed the continuous 3D paw trajectories for both wildtype and pcd mice (Figure 3E–H; Figure 3—figure supplement 2). Surprisingly, we found that the instantaneous forward paw velocity profiles of pcd mice were not distinguishable from those of size-matched controls, across speeds (Figure 3E). Paw velocity peaked early during swing and decelerated before stance onset across walking speeds in both control and pcd mice (Figure 3E; Figure 3—figure supplement 2). Peak swing velocities increased with faster walking speeds but did not vary by genotype (F(10.97,1)=.092, p = 0.77). There was also no difference in variability of peak swing velocity between genotypes (F(81,1)=0.27, p = 0.60). This surprising result reveals that even detailed forward paw trajectories are normal in pcd mice, once changes in walking speed and body size are taken into account.

We next examined the horizontal (y) and vertical (z) movements of the paws (Figure 3F–H; Figure 3—figure supplement 2). Consistent with previous findings of ataxic mice and humans, pcd mice exhibited a wider base of support than size-matched control mice (Figure 3F) (F(15.51,1)=42.87, p <0 0.001). There were also subtle changes in side-to-side (y) paw trajectories (F(13.88,1)=20.64, p <0 0.001), especially for front limbs (F(152.95,1)=12.125, p <0 0.001; Figure 3G). Further, analysis of the vertical (z) trajectories revealed significantly larger vertical displacement of both front and hind paws of pcd mice, across speeds (F(66.84,1)=17.16, p <0 0.001) (Figure 3H; Figure 3—figure supplement 2). The variability of this vertical displacement was not different in pcd (F(81,1)=2.47, p = 0.12).

Thus, despite the visibly ataxic walking pattern of pcd mice, the results of the mixed-effects linear models and the trajectory analyses indicate that the forward motion of the paws was remarkably preserved in pcd. Alterations in individual limb movements were restricted to off-axis (horizontal and vertical) trajectories.

Front-hind interlimb coordination is specifically impaired in pcd

Analyses of mouse locomotion that have focused on quantifying the kinds of basic stride parameters presented in Figure 2 have previously failed to quantitatively capture gait ataxia in visibly ataxic mice (Cendelin et al., 2010). We reasoned that this could be because human observers are more sensitive to the patterns of movement across different parts of the body (Basso et al., 2006). Therefore we analyzed patterns of interlimb and whole body coordination in both control and pcd mice.

In our experiments, wildtype mice walked in a symmetrical trot pattern across speeds—each diagonal pair of limbs moved together and alternated with the other pair (Figure 4A, left). According to the terminology of Hildebrand (1989), at slower speeds there was a tendency toward a ‘walking trot’ (front paws in a diagonal pair touch down just before hind paws and the paws are on the ground more than 50% of the time), while at faster speeds a ‘running trot’ was observed (diagonal paw pairs strike the ground near-simultaneously and paws are on the ground less than 50% of the time) (Figure 4—figure supplement 1). There was no abrupt shift between these gait patterns—stance phases varied smoothly with walking speed and duty cycle (Figure 4A, Figure 4—figure supplement 1) (cf. Bellardita and Kiehn, 2015). We did not observe galloping or bounding even at the highest speeds (cf. Bellardita and Kiehn, 2015), probably because the mice freely initiated trials in our experiments, rather than being placed in the corridor by the experimenter at the start of each trial (Figure 4—figure supplement 1). For ease of quantification, and because of a lack of categorical gait boundaries in our data, we analyzed interlimb coordination in terms of phase values and support patterns rather than gait patterns.

Figure 4 with 1 supplement see all
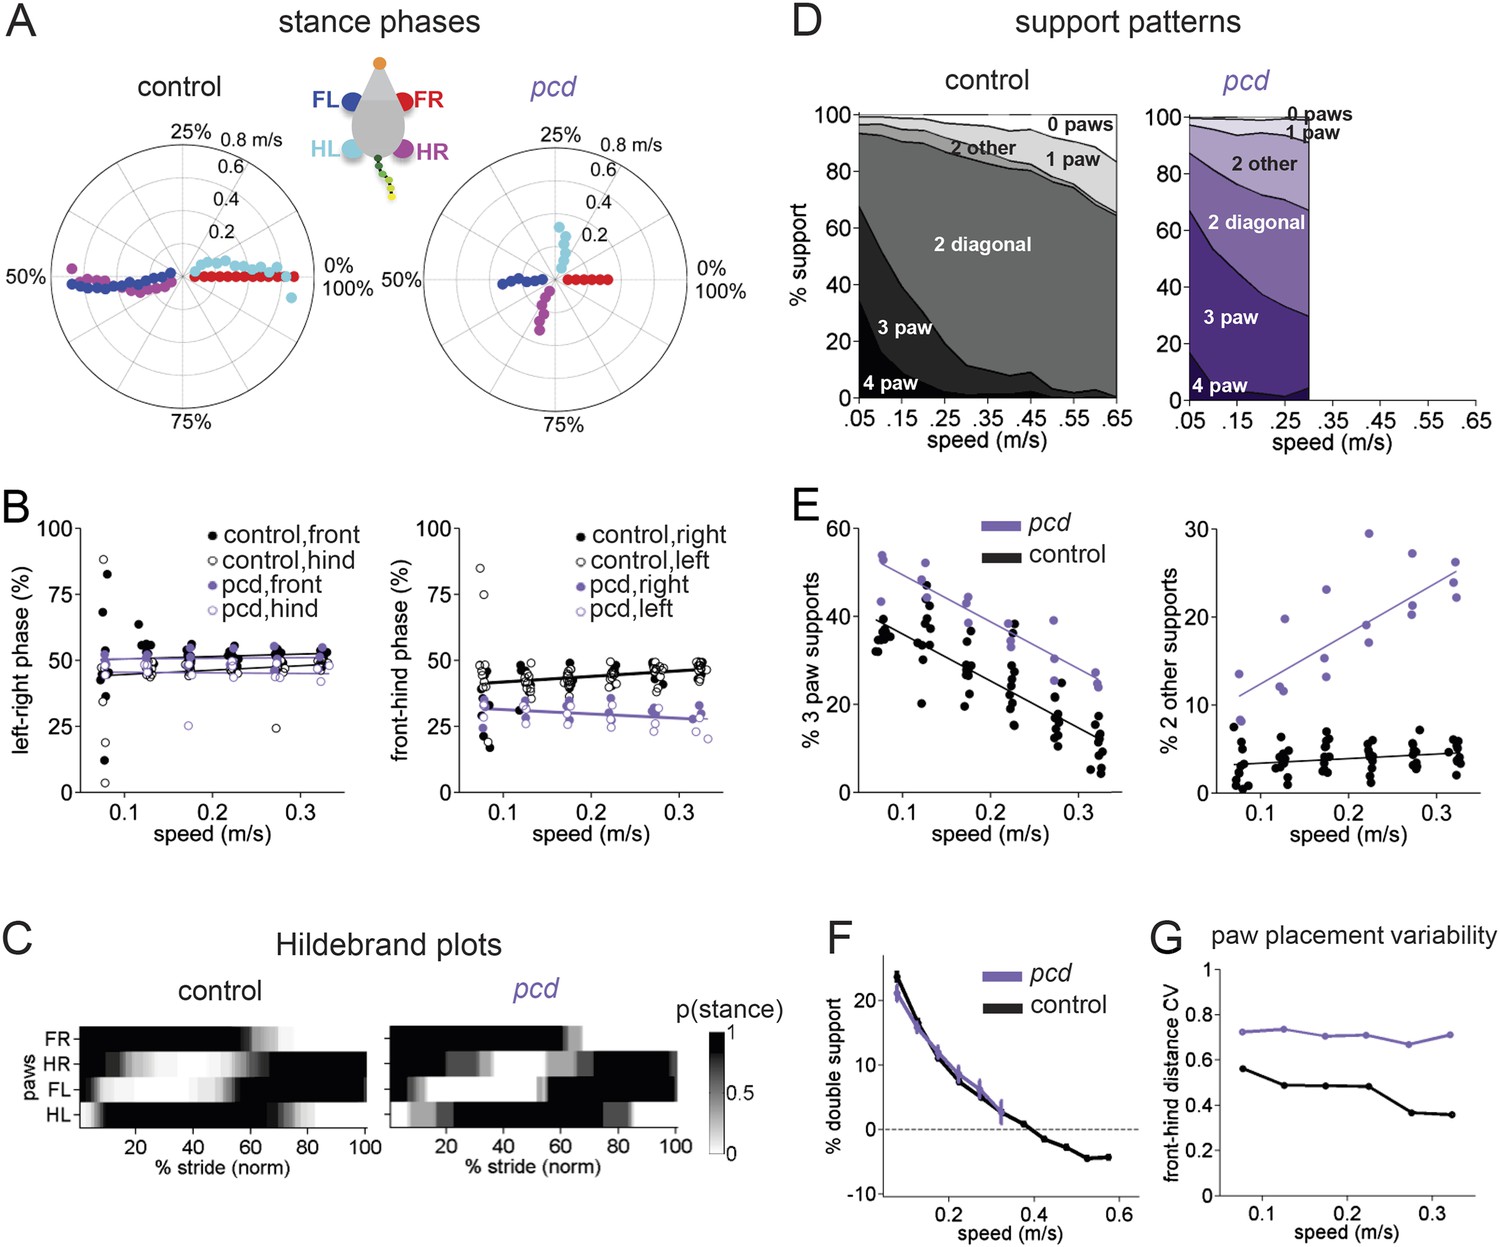
Front-hind limb coordination is specifically impaired in pcd.

(A) Polar plots indicating the phase of the step cycle in which each limb enters stance, aligned to stance onset of FR paw (red). Distance from the origin represents walking speed. Left, size-matched control mice (N = 11). Right, pcd (N = 3). (B) Left-right phase (left) and front-hind (right) phase for individual animals of pcd and size-matched controls. Circles show average values for each animal. Lines show fit of linear-mixed effects model for each variable. (C) Average Hildebrand plots aligned to FR stance onset for speeds between 0.15 and 0.20 m/s. Grayscale represents probably of stance. (D) Area plot of average paw support types as % of stride cycle, across speeds for size-matched controls (left) and pcd (right). (E) 3 paw (left) and 2-paw other (right) supports for each animal (circles). Lines show fit of linear-mixed effects model. (F) Average ±sem percent double support for hind paws of pcd and size-matched controls. (G) Coefficient of variation for paw placement distance (front-hind) for pcd and size-matched controls.

https://doi.org/10.7554/eLife.07892.013

The normal pattern of interlimb coordination was markedly disrupted in pcd, due to specific and consistent changes in the phase relationship between front and hind limbs (F(77.07,1) = 4.11, p <0 0.05; Figure 4A, right; Figure 4B). Importantly, in marked contrast to the front-hind limb coupling, left-right alternation was maintained in pcd (F(159,1) = 0.018, p=0.89; Figure 4A, right: red vs blue and cyan vs magenta; Figure 4B, left). Thus, as a result of the de-synchronization of front and hind paw movements, the diagonal limbs no longer moved in phase with each other, as illustrated in the Hildebrand plots in Figure 4C.

Support patterns, or the configuration of paws on the ground at any given time, vary systematically with walking speed (Górska et al., 1999). Typically, wildtype mice had two diagonal paws on the ground at any given time (2-paw diagonal support, Figure 4D, left), but this ranged from 3 paws on the ground during slow walking to 0 paw supports, or brief periods of flight, during running at higher speeds, due to changes in stance to swing phasing (Figure 4—figure supplement 1). Pcd mice spent more time with more paws on the ground (Figure 4D, right; Figure 4E, left) (3-paw support F(82,1) = 83.57, p < 0.001). Moreover, while % double paw support was the same for pcd and size-matched control mice walking at comparable speeds (F(167,1) = 1.06, p = 0.31), the upper limit of pcd walking speeds coincided with the transition from positive to negative % double hind limb supports (Figure 4F, see ‘Materials and methods’). In other words, it appears that the walking speed of pcd mice is limited by the need to have at least one hind paw on the ground, for postural stability (Stolze et al., 2002).

Despite their slower walking speeds and increased percent of time spent with more paws on the ground, pcd mice also showed an increase in unstable support configurations such as non-diagonal 2-paw support (Figure 4E, right; Figure 4—figure supplement 1) (F(46.78,1) = 7.76, p = 0.01), particularly at higher walking speeds (F(67.62,1) = 115.82, p < 0.001). This increased instability indicates that pcd mice are not simply switching to a more stable gait pattern as a compensatory mechanism, but rather, are unable to properly time their front-hind limb movements to generate a stable, efficient gait. Further, the changes in interlimb phasing were consistent—front-hind phasing was not more variable in pcd (F(164,1) = 2.88, p = 0.091), and in fact left-right phasing was even less variable (F(166,1) = 9.70, p = 0.0021).

Spatial patterns of paw placement were also disrupted in pcd. While the average distance between hind paw placement and previous forepaw position was the same in pcd and controls (F(14,1) = 0.44, p = 0.52), it was more variable in pcd (F(168,1) = 75.30, p < 0.001; Figure 4G), across speeds.

Taken together, these results reveal that both spatial and temporal measures of interlimb coordination during overground locomotion were altered in pcd mice.

Whole-body coordination deficits in pcd

Movements not just of the limbs, but of the entire body need to be coordinated during locomotion. In order to characterize whole-body locomotor coordination in both control and pcd mice, we analyzed their head and tail movements while they walked freely across the corridor (Figure 5; Figure 5—figure supplement 1).

Figure 5 with 2 supplements see all
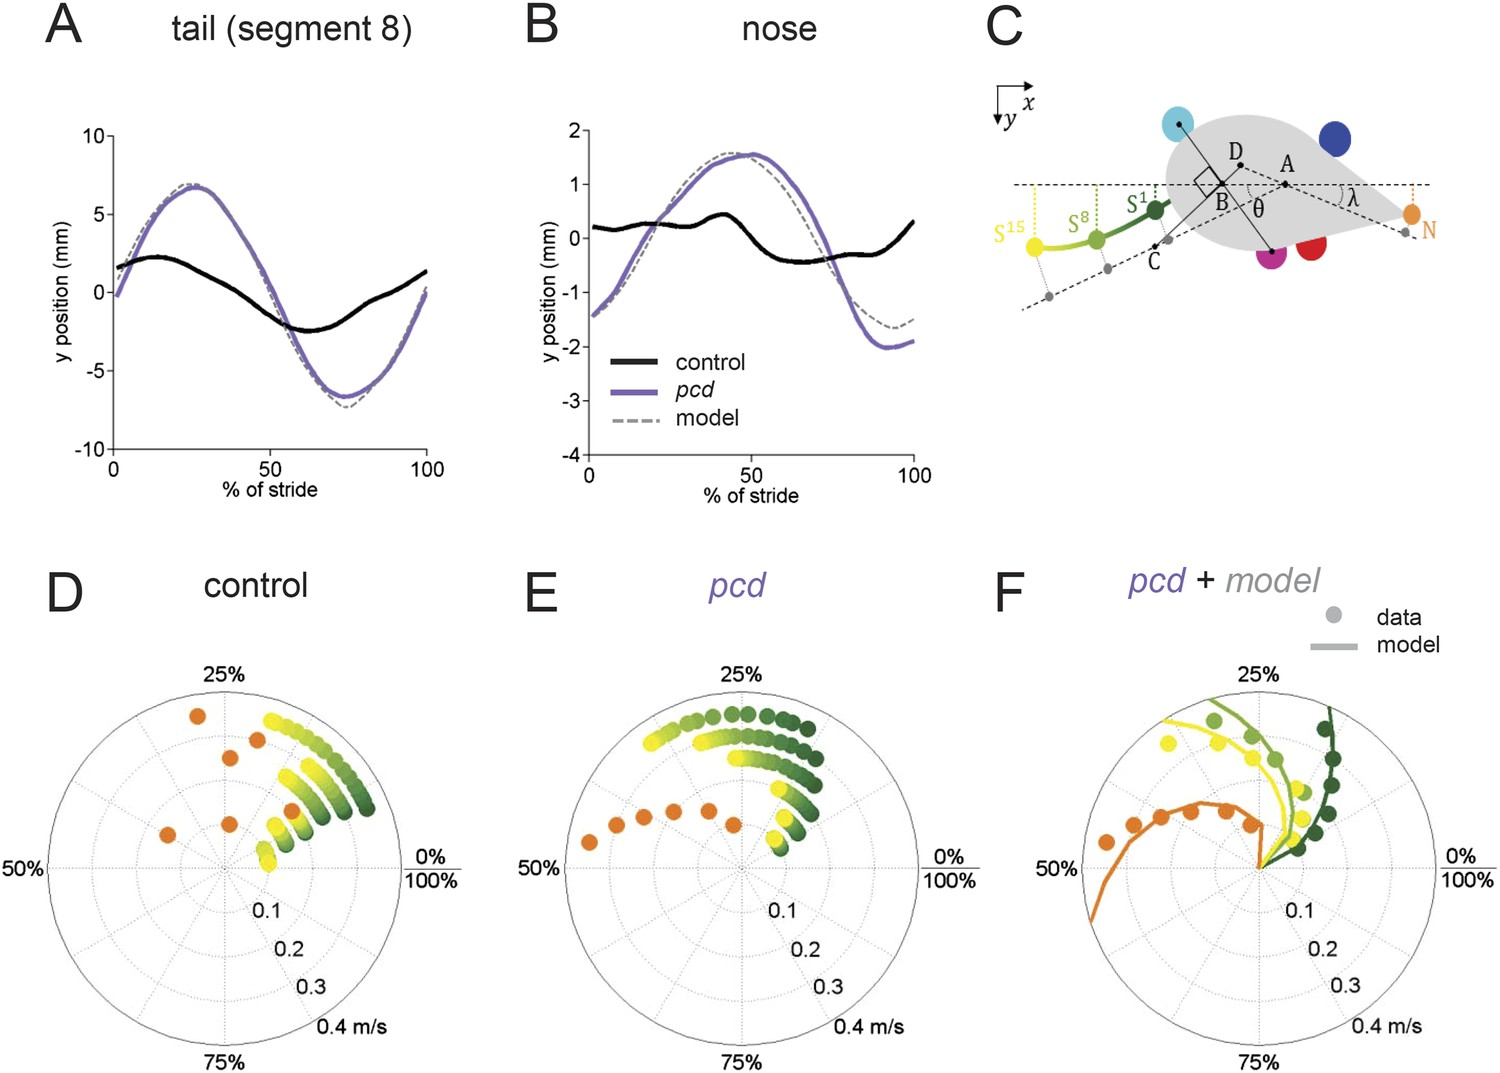
The tail and nose movements of pcd mice can be modeled as a passive consequence of the forward motion of the hind limbs.

(A, B) Averaged lateral trajectory of tail segment 8 (A) and nose (B), relative to the mid-point between the hind paws, for animals walking at 0.25–0.30 m/s, for size-matched controls (black), pcds (purple) and model (dashed gray). (C) Geometric model of the tail and nose. The lateral position of each tail segment at every time step is given by Syi =_ASisinθ, whereas the lateral position of the nose is given by Ny=_DN _sinλ. (D, E) Phase of maximum correlation between the forward position of the hind paws and the lateral trajectories of each tail segment (green-yellow gradient) and the nose (orange). (F) The maximum correlation phases of the passive geometric model (lines) are superimposed on the observed values (circles) for tail segments 1 (dark green), 8 (light green), 15 (yellow), and nose (orange).

https://doi.org/10.7554/eLife.07892.015

In control mice, lateral movements of the nose and tail were small (Figure 5A,B, black). In striking contrast, however, both the nose and the tail of pcd mice exhibited large side-to-side oscillations during the locomotor cycle (Figure 5A,B, purple; Video 2) (compared to size-matched controls: nose F(13.48,1) = 5.49, p < 0.05, tail F(415,1) = 91.01, p < 0.001).

Not just the amplitude, but also the timing of nose and tail movements relative to paw stride cycles was altered in pcd. In control mice, both the tail and nose were phase-locked to the stride cycle across walking speeds (Figure 5D). However, in pcd both nose and tail (Figure 5E) became increasingly phase-lagged at faster speeds (tail: F(401.02,1) = 5.55,p <0 0.05; nose: F(53.61,1) = 4.89,p <0 0.05 for speeds above 0.1 m/s). Interestingly, the phase relationships for both the nose and the tail in pcd were consistent with their being time-, rather than phase-locked, to the locomotor cycle (Figure 5—figure supplement 1).

The large, sinusoidal amplitude of the tail oscillations and their time-delayed relationship to hind paw movement suggested to us that tail movements in pcd could reflect passive consequences of the forward movement of the hind limbs. To investigate this possibility, we generated a simple geometrical model of a mouse (Figure 5C; ‘Materials and methods’) in which the tail was anchored at a right angle to a point that bisected a line connecting the two hind paws. We used the data from Figures 3 and 4 to model the hind paw alternation and calculated the predicted side-to-side tail trajectories across walking speeds. As illustrated in Video 3, the orthogonal coupling between the line connecting the hind paws and the tail segments caused the modeled tail to oscillate from side-to-side as the hind paws moved forward.

Video 3
Passive nose and tail model.

Passive model of nose and tail for a mouse walking at 0.2 m/s. The forward movements of the paws were modeled according to the data described in Figures 3 and 4. The lateral movements of the nose and tail segments are predicted from a model in which an orthogonal projection transforms the forward movements of the hind paws (solid white line) into lateral movements of the tail (dashed white line) and nose with a fixed time-delay for each element. As a result of this orthogonal coupling, the nose and tail oscillate laterally as a passive consequence of the forward motion of the hind paws.

https://doi.org/10.7554/eLife.07892.018

The side-to-side tail movements predicted by the passive model were strikingly similar to the tail oscillations of pcd mice (compare grey dashed lines with purple traces in Figure 5A,B). As shown in Figure 5F, the tail oscillations of pcd mice were fit very well, across walking speeds and tail segments, with a passive model that incorporated a 31 ms time delay for the base of the tail (reflecting the initial inertia of the mouse's rear) plus a fixed delay per additional tail segment (see ‘Materials and methods’). A similar model for the nose (Figure 5) was also consistent with a time-delayed (96 ms) side-to-side nose movement in pcd. Importantly, these oscillations cannot be accounted for by differences in hind limbs between control and pcd, because: (1) hindpaw alternation is unaltered in pcd (Figure 4A,B); (2) hindlimb double support is unaltered in pcd (Figure 4F); and (3) though the base of support is wider in pcd, the model predicts that this difference alone would result in smaller, not larger tail oscillations in pcd. Thus, in pcd, the tail and nose appear to move as a passive consequence of forward limb motion. Further, our results suggest that this movement must be actively canceled in wildtype mice to keep the body axis aligned for forward movement.

To visualize and quantify impairments in whole-body coordination, we compared vertical (z) trajectories for each body part, normalized to 100% of the stride cycle. Figure 6 summarizes the trajectories of individual body parts as well as interlimb and whole body coordination of speed- and size-matched control and pcd mice. During locomotion in control mice, the movement of different parts of the body is synchronized, and vertical nose and tail movements are relatively small (Figure 6A, left). In pcd, however, spatial and temporal coordination across the body is dramatically impaired (Figure 6A, right). Finally, a correlation analysis reveals that in control mice, the movement of most body parts is either strongly correlated or anti-correlated (i.e. they move either in–or out-of phase with each other; Figure 6B, left, red and blue). In pcd mice, however, the correlations are weaker and more variable (Figure 6B, right). This lack of correlational structure reflects the failure of pcd mice to synchronize the movements of different parts of the body.

Visualization of impaired whole-body coordination in pcd.

(A) Ribbon plots showing average vertical (z) trajectories for nose, paw and select tail (2, 5, 8, 11, 14) segments for size-matched control (Left, N = 11)) and pcd (Right, N = 3) mice walking at 0.20–0.25 m/s. Data are presented relative to 100% of the stride cycle of the FR paw (x-axis). Nose and paw trajectories are z position relative to floor; tail is z relative to floor with mean vertical position of the of base of the tail subtracted for clarity. (B) Matrix of correlation coefficients computed for average vertical trajectories of control (Left) and pcd (Right). Color bar is value of correlation coefficient.

https://doi.org/10.7554/eLife.07892.019

Taken together, the results of Figures 3–6 suggest that while the forward motion of individual paws is largely spared, ataxic pcd mice have specific deficits in coordinating movement in three dimensions across joints, limbs, and body.

Discussion

Establishing appropriate, sensitive, and specific behavioral measures is an essential first step for investigating relationships between brain and behavior (Clark et al., 2013; Anderson and Perona, 2014). Although deficits in locomotor coordination are readily visible to the human eye, identifying the specific, quantitative features of gait ataxia has been more difficult (Leblond et al., 2003; Cendelin et al., 2010; Krug et al., 2013). Here we used the custom-built LocoMouse system to analyze locomotor kinematics and coordination in freely walking mice. The high spatiotemporal resolution and throughput of this system provides the most comprehensive description of locomotor kinematics in freely walking mice to-date and allowed us to develop a novel analysis framework for mouse locomotion that revealed fundamental features of gait ataxia. Our main findings are (1) Basic paw stride parameters can be predicted solely based on walking speed and body size. (2) This relationship holds in visibly ataxic pcd mutants, indicating that changes in these stride parameters in ataxic mice do not reflect fundamental features of ataxia. (3) While the forward motion of the paws is spared in pcd, coordination across joints, limbs, and the body is selectively impaired. (4) The nose and tail of pcd mice oscillate as a passive consequence of forward hindlimb motion. Taken together, this pattern of deficits reveals that gait ataxia in pcd mice involves specific impairments in locomotor coordination across joints, limbs, and body parts.

LocoMouse

Because of the significant challenges associated with quantifying whole-body coordination in freely walking animals, assessments of mouse motor coordination phenotypes often rely on indirect measures (Mullen et al., 1976; Herbin et al., 2007; Lalonde and Strazielle, 2007; Guillot et al., 2008; Brooks and Dunnett, 2009; Cendelin et al., 2010; Stroobants et al., 2012; Sheets et al., 2013; Suidan et al., 2013; Camera et al., 2014), such as time to fall from a rotarod (Walter et al., 2006; Lalonde and Strazielle, 2007) or a fixed bar (Kim et al., 2009; Cendelin, 2014), or mis-steps on a ladder (Vinueza Veloz et al., 2014). While these can be sensitive markers for global motor dysfunction, they lack specificity. Moreover, performance on coordination tasks, or even on a treadmill (Hamers et al., 2001; Hoogland et al., 2015), does not necessarily correspond to the degree of gait ataxia during overground locomotion (Herbin et al., 2007; Lalonde and Strazielle, 2007; Guillot et al., 2008; Cendelin et al., 2010; Stroobants et al., 2012; Suidan et al., 2013; Camera et al., 2014).

Our goal in developing LocoMouse was to create a system that would be as useful for assessing cerebellar contributions to locomotor coordination as existing systems have been for analyzing spinal cord control of locomotor pattern generation (e.g. Crone et al., 2009; Bellardita and Kiehn, 2015). LocoMouse presents several advantages when compared to available systems for analyzing mouse locomotion (Hamers et al., 2001; Hoogland et al., 2015; Leblond et al., 2003; Kale et al., 2004; Garnier et al., 2008; Zörner et al., 2010). Mice walk freely and naturally across the corridor and throughput is maximized via fully automated data collection and analysis. The high spatiotemporal resolution provides detailed 3D paw kinematics. LocoMouse also tracks nose and tail movements during locomotion, which have not been previously reported in freely walking mice. While the automated tracking algorithm does not measure joint angles, these can be incorporated either through hand-labeling or potentially with the use of additional markers.

We exploited the large, multidimensional dataset generated by LocoMouse to establish a quantitative framework for analyzing locomotor coordination in freely walking mice. There were two key features of our approach that allowed us to isolate specific deficits of ataxia. The first was quantitatively accounting for variability across strides and mice. Although individual strides at first appeared quite variable across our diverse set of wildtype mice, we found that wildtype paw kinematics were readily and quantitatively predictable based on walking speed and body size, even down to the level of 3D trajectories (Figure 2, Figure 2—figure supplement 1). Second, we placed particular emphasis on quantifying coordination across the body.

A quantitative framework for locomotor coordination reveals fundamental features of mouse gait ataxia

The statistical models we developed based on a library of data from wildtype mice (Figure 2, Figure 2—figure supplement 1) accurately predicted the forward paw motion of ataxic pcd mice (Figure 3). This indicates that observed differences in basic stride parameters were a secondary consequence of differences in body size and walking speed. Further, the forward motion of individual paws was indistinguishable from that of size- and speed-matched controls, down to the level of detailed paw trajectories. This important result highlights that failure to account for differences in walking speed and body size when comparing data across mice and strides can lead to nonspecific effects being misinterpreted as symptoms of ataxia (Koopmans et al., 2007; Cendelin et al., 2010; Wuehr et al., 2012; Batka et al., 2014). Moreover, it is likely that by focusing primarily on the forward movement of individual paws, many existing analyses fail to capture the fundamental features of ataxia.

While differences in forward paw motion could be fully accounted for by differences in walking speed and body size, in contrast, off-axis paw trajectories, interlimb, and whole-body coordination revealed specific patterns of impairment in pcd (Figures 4–6). Differences in off-axis movements (Figure 3, Figure 3—figure supplement 1) suggest that pcd mice, like human cerebellar patients, are unable to coordinate movements across joints within the limb to perform normal strides in 3D (Earhart and Bastian, 2001; Bastian et al., 1996). Further, pcd mice exhibited impaired spatial and temporal coordination of movements across the four limbs, nose, and tail. Interestingly, while front-hind paw coupling was dramatically altered in pcd, left-right alternation was preserved entirely, consistent with the idea that such alternation is generated within the spinal cord itself (Crone et al., 2009; Kiehn, 2011; Dougherty et al., 2013). Finally, the large, oscillatory nose and tail movements observed in pcd were not just random, but were successfully modeled as a failure to predict and compensate for the passive consequences of forward motion of the hind limbs.

Cerebellar contributions to coordinated movement

The major neuroanatomical finding in pcd is the complete postnatal degeneration of cerebellar Purkinje cells and subsequent loss of granule cells and related structures (Mullen et al., 1976; Lalonde and Strazielle, 2007; Morton and Bastian, 2007). In light of these extensive anatomical defects and the existing body of literature on mouse ataxia, the remarkable preservation of forward paw motion in pcd (Figure 3E) was surprising. Moreover, previous studies have associated Purkinje cell modulation with the step cycle of individual limbs (Armstrong and Edgley, 1984; Edgley and Lidierth, 1988; Udo et al., 2004) and movement kinematics (Pasalar et al., 2006; Heiney et al., 2014). The most likely interpretation of the surprisingly intact forward paw motion in pcd is that it reflects the presence of inevitable compensatory mechanisms resulting from the chronic loss of Purkinje cells. Given this capacity for compensation, the specific and persistent impairments in multi-joint, interlimb, and whole-body coordination in pcd are particularly striking.

While many lines of evidence suggest that the cerebellum provides internal models for motor control (Wolpert et al., 1998; Ito, 2008), there has been disagreement about the nature of these models (Ebner and Pasalar, 2008; Medina, 2011). Studies from some systems, including eye movements, have suggested that the cerebellum acts as an inverse model that computes a command to achieve desired movement (Shidara et al., 1993). Other work, particularly on reaching movements, the cerebellar-like nuclei of electric fish, and locomotor adaptation, has suggested that the cerebellum provides a forward model that predicts the consequences of movements (Bastian et al., 1996; Kennedy et al., 2014) (Pasalar et al., 2006) (Morton and Bastian, 2006). These predictions can then be used to optimize joint angle combinations within a limb (Bastian et al., 1996), synchronize interlimb coordination (Figure 4), or to cancel out the unintended passive consequences of movements of other parts of the body (Figure 5). We found that while on-axis paw kinematics are preserved in the absence of cerebellar cortical output, the ability to predict and actively cancel the passive consequences of movements of other parts of the body appears to be beyond the limits of compensatory mechanisms available to pcd mice. Therefore our results raise the intriguing possibility that the absence of forward models, rather than a failure to execute appropriate movement kinematics per se, could form the basis for impaired coordination associated with gait ataxia in mice.

Although cerebellar involvement is a shared feature across ataxic mouse mutants, the details of the motor phenotypes are different for different mutations (Lalonde and Strazielle, 2007). Similarly, patients with cerebellar damage exhibit varying degrees and features of ataxia (Morton and Bastian, 2003, 2007; Yu et al., 2014). Given the diversity of cerebellar phenotypes, it is likely that the specific features of gait ataxia will vary across mouse models. The novel quantitative framework for mouse locomotion presented here highlights the importance of considering 3D, interlimb and whole-body coordination and dissociating them from the control of individual paw kinematics, particularly when analyzing cerebellar contributions to locomotion. Together with the sophisticated genetic tools available for manipulating neural circuits in mice, the current approach makes mouse locomotion a powerful system for investigating the neural control of coordinated movement and establishing relationships between neural circuit activity and behavior.

Materials and methods

Animals

All procedures were reviewed and performed in accordance with the Champalimaud Centre for the Unknown Ethics Committee guidelines, and approved by the Portuguese Direcção Geral de Veterinária (Ref. No. 0421/000/000/2015).

C57BL/6 mice were housed in institutional standard cages (3 animals per cage) on a reversed 12-hr light/12-hr dark cycle with ad libitum access to water and food. Heterozygous Purkinje cell degeneration mice on a C57BL/6 background were obtained from Jackson labs (#0537 B6.BR-Agtpbp1pcd/J).

Experiments were conducted in two groups: (a) wildtype controls (n = 9602; N = 34 mice; 23 male; 11 female; 7-33g, 30–114 days old) and (b) homozygous pcd mice (n = 3052; N = 3 mice; 2 female, 1 male; 10–16 g; run at several ages each between 41-154 days old) and their littermates (n = 2256; N = 7 mice; 3 female, 4 male; 15–40 g; 34–190 days old). Size-matched controls for pcd animals (n = 3400; N = 11 mice) were taken from the wildtype data set (Figure 2—figure supplement 1 and Figure 3—figure supplement 1).

Because of extra-cerebellar degeneration in pcd mice after postnatal day 50, we performed a separate analysis to verify that our main findings held in the youngest pcd mice (Figure 5—figure supplement 2).

LocoMouse setup

A custom-designed setup was developed to assess whole body coordination during overground locomotion in mice (Figure 1). The LocoMouse apparatus consists of a clear glass corridor, 66.5 cm long, 4.5 cm wide and 20 cm high. Mice were filmed crossing the corridor with a high-resolution, high-speed camera (Bonito CL-400B, Allied Vision Technologies, https://www.alliedvision.com). A mirror (66 cm × 16 cm) was placed below the corridor at an angle of ∼45° to allow simultaneous collection of side and bottom views in order to generate three-dimensional tracking data. Lighting consisted of a matrix of LEDs that emitted cool white light positioned to maximize contrast and reduce reflection. Infrared sensors positioned along the runway automatically triggered the camera and acquisition software once the mouse entered the corridor and stopped the acquisition once the mouse reached the other end of the corridor or after 25 s.

Data collection

Request a detailed protocol

Mice were handled by the experimenter and allowed to acclimate in the LocoMouse setup for several minutes on multiple occasions before data collection. Animals were weighed before each session. Mice walked freely between two dark boxes on either end of the glass corridor. The automatic triggering system was critical for allowing mice to self-initiate trials, which reduced animal stress without compromising the quantity of data collected. No food or water restriction or reward was used.

10-15 corridor passages (trials) were collected in each of five daily sessions. A total of 36,369 strides were collected from wildtype controls, which corresponds to 1069 ± 266 strides per mouse and 267 ± 66 strides per paw. For pcd and littermates we collected an average of 4252 ± 778 strides per pcd mouse (1063 ± 32 strides per animal per paw) and 1310 ± 934 strides per littermate mouse (328 ± 11 strides per animal per paw). Animals were not required to walk continuously throughout a trial; if the animal stopped mid-trial, the data before and after the halt were still analyzed.

Data acquisition

Request a detailed protocol

Movies were collected at 400 frames per second with a spatial resolution of 1440x250 pixels. Acquisition software was written in Labview and uses 2 National Instruments boards (PCIe 1433 and BNC 2120) to record and save the movies, in real time. The tracking algorithm and data analysis software were written in Matlab (Mathworks) and performed offline. The LocoMouse Tracker code used in this paper can be downloaded from GitHub (https://github.com/careylab/LocoMouse).

Tracking algorithm

Overview

To maximize throughput we used a computer vision algorithm to allow automatic, markerless tracking of features of interest (without the need for surface markers or manual initialization of feature tracks) (Figure 1 and Figure 1—figure supplement 1). The algorithm's output was the set of 3D coordinates of the features of interest, which were: the center of each of the four paws, the snout, and the tail divided into 15 points, for each frame of the movies. The output of the tracking system was visually inspected for each trial. Fewer than 10% of the trials were excluded due to tracking failure (typically due to exploration or grooming behavior that resulted in erroneous swing and stance point detection). Further validation of the automated tracking performance is shown in Figure 1—figure supplement 1.

We used hand labeled data to train linear Support Vector Machine (SVM) classifiers for each feature and each view (side and bottom) independently. Positive examples were hand labeled on a set of 81 images from a single training video while 10 negative examples for each feature were randomly picked from the same images. Training the 6 SVM classifiers took approximately 1 hr on a machine with an Intel Core i7-3770 CPU and 16 GB or RAM. All experiments were performed with these SVM classifiers with no need to retrain on additional data. For each trial, the candidate locations for each feature were obtained by filtering the input images with the trained detectors. For the paws and snout, the resulting image regions were clustered into a small number of point locations using a standard non-maxima suppression algorithm. Once the candidate features were identified by the SVM, we considered the temporal trajectories and selected the candidate tracks that maximized per image detection scores while minimizing frame-by-frame displacement with a method based on existing multi-target tracking frameworks (Russell et al., 2011) that formulate tracking as the maximum a posteriori probability estimation over a Bayesian network of candidate locations on each image. Best bottom view tracks (x and y) were computed first and then the best side view track (z, accounting for image distortion from the optics) that matched the bottom view track was selected. For the tail, the interest regions were matched across views and the largest resulting 3D region was picked as the final detection. The tail was detected independently for every image. Following computation of feature tracks, pixel values were converted to millimeters for further analysis.

Detailed description

Request a detailed protocol

The LocoMouse Tracker code developed and used in this paper has been deposited at GitHub (https://github.com/careylab/LocoMouse) and updated versions are available through our website. The LocoMouse tracker was developed in MATLAB R2013b (The MathWorks). Some auxiliary packages can be found at the Matlab Central File Exchange (http://www.mathworks.com/matlabcentral/fileexchange/). The method also relies on the LIBSVM library (http://www.csie.ntu.edu.tw/∼cjlin/libsvm/) for Support Vector Machines and the code from (Russell et al., 2011) for Multi-target tracking.

Removing background and correcting camera/mirror distortion
Request a detailed protocol

An image of the corridor was recorded before every session. To remove the background we subtracted this image from every frame recorded by the system. To correct for image distortion we recorded a video of a white spherical object moving along the full volume of the glass corridor. The two projections of the object were detected by thresholding the (grayscale) image at 80% (after removing the background). The horizontal line splitting the image into the bottom and side views was defined manually at this point. The corrective image transformation makes the bottom and side projections of the object match along the vertical line and was computed via least squares. The corrective transformation depends on the position of the camera relative to the setup and was performed once for every configuration. Unless stated otherwise, all steps of the algorithm are performed on corrected images.

Computing bounding box around mouse
Request a detailed protocol

We further isolated the mouse by computing a tight bounding box around it. We started by thresholding every input image at 10% and using a median filter to remove noise. For every image, the edges of the box are defined as the first and last rows and columns to have white pixels. To account for occlusions and noise, the final size of the bounding box was defined as the smaller of the mean size plus three standard deviations, and the maximum observed size. The final trajectory of the bounding box over the video was determined by filtering the box position calculated for each image with a moving average filter of width 5. All further steps in detecting the interest features were performed within the bounding box.

Training the detectors
Request a detailed protocol

Feature detectors for the paws, snout and tail were trained using the LIBSVM library. Positive examples were manually annotated on a set of 81 training images from a single movie. The size of the detectors was chosen manually such that the feature lied within the detector box. Each view was treated independently, unless otherwise stated. The sizes of the different feature detectors can be found in Table 1.

Table 1

Image feature size

https://doi.org/10.7554/eLife.07892.020
FeatureBottom view size (in pixels)Side view size (in pixels)
Paw30 x 3020 x 30
Snout40 x 4020 x 40
Tail segments30 x 3025 x 30

The system assumes mice move from left to right. Images were flipped horizontally when otherwise. For every feature, 10 negative examples were randomly extracted from within the bounding box of the mice for each of the 81 training images (excluding the positively labelled regions).

Detecting paw and snout candidates
Request a detailed protocol

The outputs of LIBSVM were used to filter the pre-processed input images. These filters provided a score representing the likelihood of a pixel being part of each feature (paw or snout). These per-pixel scores were reduced into a small number of candidate locations with a standard Non-Maximum Suppression (NMS) algorithm (http://vision.ucsd.edu/∼pdollar/toolbox/doc/) which clusters positively classified pixels into local maxima. Since on the side view there is considerable overlap between the features, we used a more conservative version of the NMS algorithm, which results in more candidate locations.

Combining bottom and side view candidates
Request a detailed protocol

The 2D candidate locations from each view were combined into 3D candidates by matching their coordinates on the shared axis (horizontal axis). As exact matches do not occur, we used a tolerance of 30% of the feature's detector size along the horizontal axis for matching.

We allowed each bottom view candidate to be matched to many side view candidates, but each side view candidate was only (generally) matched to a single bottom view candidate. In ambiguous configurations, additional information about the velocity of the candidates was used to find the best match. Candidates were classified as moving/not moving according to the pixel count within the feature box size after subtracting the previous input image to the current image. When candidates could not be disambiguated, both options were allowed to remain.

Computing feature tracks
Request a detailed protocol

We used location priors to distinguish between instances of the same class (e.g., to identify which paw was which). Based on the configuration of the corridor, the priors were defined as the inverse of the distance to the closest corner (i.e.on the bottom view, the front right paw is closer to the bottom right corner while the hind left paw is closer to the top left corner). The prior was defined on a normalized box which allows it to be fit to a bounding box of any size. Locations on the normalized box with a distance greater than 0.6 had their prior score set to zero.

Multi-target tracking
Request a detailed protocol

After processing the candidate locations at each image, tracking on the bottom view was performed using the multi-target tracking algorithm of (Russell et al., 2011). This algorithm finds the tracks over all the images which maximizes the per image detection score (weighted by the location prior) while minimizing the in-between image distance. In practice the inverse distance was considered and the problem is formulated as

maxxLN.FC(x)=o=1N[t=1FU(xo,t)+αt=1F1P(xo,t,xo,t+1)],

where x is a possible (multi-target) track, L is the number of possible locations, N is the number of objects to track, F the number of images in the video, xo,t a candidate location for object o at time t, U(.) the image detection score weighted by the location prior, P(. , .) the inverse of the image distance between two points, and α the relative weight between image detection scores and image transitions (set empirically to 0.1). In practice we discarded all transitions that exceeded v pixels between two images, where v is the sum of the (variable) displacement of the bounding box and a fixed value of 15 pixels. An additional constraint was added such that only one object could occupy the same candidate location at the same instance in time.

For the side view, we used the same approach to find the most likely Z trajectory given the already computed X and Y tracks.

Data analysis

The stride cycles of individual paws were automatically broken down into swing and stance phases based on the first derivative of the paw position trajectories. Individual strides were defined from stance onset to subsequent stance onset. For each stride, average walking speed was calculated by dividing the forward motion of the body center during that stride by the stride duration. All data was sorted into speed bins (0.05 m/s bin width) in a stridewise manner, with a minimum stride count criterion of 5 strides per bin, per animal. Individual limb movements and interlimb coordination were calculated as follows:

Individual limb parameters

Request a detailed protocol
Cadence
Request a detailed protocol

Inverse of stride duration

Swing velocity
Request a detailed protocol

x displacement of single limb during swing phase divided by swing duration.

Stride length
Request a detailed protocol

x displacement from touchdown to touchdown of single limb.

Stance duration
Request a detailed protocol

Time in milliseconds that foot is on the ground during stride.

Trajectories
Request a detailed protocol

Trajectories were aligned to swing onset and resampled to 100 equidistant points using linear interpolation. Interpolated trajectories were then binned by speed and the average trajectory was computed for each individual animal and smoothed with a Savitzky-Golay first-order filter with a 3 point window size.

Interlimb and whole-body coordination parameters

Request a detailed protocol
Stance phase
Request a detailed protocol

relative timing of limb touchdowns to stride cycle of reference paw. Calculated as: (stance time−stance timereference paw)/stride duration.

Supports
Request a detailed protocol

Support types were categorized by number of paws on ground expressed as a percentage of the total stride duration for each stride. Paw support categories are four, three, two diagonal, two other (homolateral and homologous), one, and zero.

Double support
Request a detailed protocol

Double support for each limb is defined as the percentage of the stride cycle between the touch down of a reference paw to lift-off of the contralateral paw. Because at higher speeds (running), the opposing limb lifts off before the reference paw touches down, we included negative double support by looking backwards in time by 25% of the stride cycle duration. Positive values of double support indicate that contralateral lift-off occurred after reference paw touch down, and negative values indicate that contralateral lift-off occurred before reference paw touch down.

Paw distance
Request a detailed protocol

The x,y distance from where the front paw lifted off to where the ipsilateral hind paw touched down on the subsequent stride.

Tail and nose phases
Request a detailed protocol

For each speed bin we correlate the stridewise tail and nose trajectories with the trajectory given by the difference between the forward position of the hind right paw and the forward position of the hind left paw (also normalized to the stride). The phase is then calculated by the delay in which this correlation is maximized.

Correlation matrices
Request a detailed protocol

Correlation coefficients were computed for average z trajectories normalized to 100% of the FR stride cycle.

Multi-level linear mixed-effects models and statistical analysis

Request a detailed protocol

Because of the complex nature of the data set, including nested data with varying number of trials per animal and data points per speed bin, data analysis and statistical comparisons were performed with linear mixed effects models.

Modeling stride parameters across control mice

Request a detailed protocol

We used linear mixed effects models (Bates et al., 2013) to analyze our data and quantify the relationship between fixed (speed, gender, weight, length, age) and random (subject) effects and values for each stride parameter.

To linearize data for inclusion in the model, we first plotted the values of each stride parameter vs walking speed and generated fits to the data. Different fitting curves (linear, quadratic, cubic, inverse, logarithmic, exponential, power) were tested and selected based on the distribution of residuals and R2 values. The curves that provided the best fits to each parameter are given in Figure 2—figure supplement 1.

After transforming the data according to these best fit curves, we next asked to what extent the fixed and random effects contributed to remaining variability in the values of each parameter. For the fixed terms, we tested different equations, using additive and interaction properties. Random terms took into consideration differences in both slopes and intercepts. The equations were selected based on the following criteria: R2 values (marginal and conditional, (Nakagawa and Schielzeth, 2012), likelihood ratio tests (comparing goodness of fit across equations) and collinearity of effects (Figure 2—figure supplement 1). Due to collinearity, in many cases body length (measured directly from the movies) and weight provided good fits to the data. We chose to use weight throughout because it provided a platform-independent metric for body size that should be more reproducible.

Statistical analyses

Request a detailed protocol

Statistical analyses were done in Matlab and R. For all comparisons, models were selected by comparing equations specifying additive fixed-effects terms with those specifying n-way interaction terms using a likelihood-ratio test and inspection of statistical significance of included terms. Depending on the comparison, fixed-effects terms included a subset of the following variables: speed, genotype and paw. All models were random-intercepts models with subject as a random covariate. Unless otherwise indicated, results are reported as conditional F tests with Satterthwaite degrees of freedom correction. All variability analyses were based on coefficients of variation (CV).

Geometric model of the tail and nose

Request a detailed protocol

The simulations of the lateral movements of the tail and nose were carried out in three steps. (1) First, we estimated the desired stride parameters for each hind paw. The temporal parameters of the stride (swing, stance and stride durations) were taken from Figure 2, calculated for an animal of 15g (small animal control). We calculated the stride lengths by estimating the final desired position of the paw (relative to the nose of the animal) at the end of the stride; this value was also taken from small animal control data. (2) We calculated the forward trajectory for each paw using a constant swing velocity model given by the stride length divided by the swing duration. We then calculated the periodic forward oscillations of the two hind paws by calculating the difference between their forward trajectories. The phasing of hind paw alternation was taken from the small animal control data (Figure 4A). (3) Finally, we converted the forward movements of the paws into lateral movements of the tail and nose. We calculated tail and nose trajectories that would be predicted from a purely passive coupling of forward motion of the hind paws with lateral tail/nose motion through the geometric relations BC LR and BD LR (Figure 5A). We bisected the line segment that connects the two hind paws, with an orthogonal line segment (CD). For each tail segment Si, at each timestep t, we define a vector with constant length, originating in A, along the direction AC (gray points along the line AC). The lateral position of each segment of the tail was then given by Syi = Li sin θ, where Li is the distance between the center of tail oscillation (A) and segment i, and θ is the angle between segment (AC) and the anterior–posterior axis of the animal. Similarly, for the nose, we defined a vector with constant length, originating in A, along the direction DA. The position of the nose was given by Ny = L sin λ, where L is the distance between the center of nose oscillation (A) and the nose, and λ is the angle between segment (DA) and the anterior–posterior axis of the animal. The final position of each tail segment Si  and nose N were then given by each of these vectors delayed by a fixed amount. The time delays for the nose and base of the tail were estimated by linear regression on a plot of phase as a function of stride frequency (cadence) (Figure 5—figure supplement 1H). Delays between subsequent tail segments decreased according to the equation delay = −0.23 *i + 3.97, where i is the segment number, starting at the base of the tail.

References

    1. Bastian AJ
    2. Martin TA
    3. Keating JG
    4. Thach WT
    (1996)
    Cerebellar ataxia: abnormal control of interaction torques across multiple joints
    Journal of Neurophysiology 76:492–509.
    1. Bates D
    2. Maechler M
    3. Bolker B
    4. Walker S
    (2013)
    lme4: Linear mixed-effects models using Eigen and S4. R package version 1.0-5
    lme4: Linear mixed-effects models using Eigen and S4. R package version 1.0-5.
    1. Cendelin J
    (2014)
    From mice to men: lessons from mutant ataxic mice
    From mice to men: lessons from mutant ataxic mice, Cerebellum & Ataxias, 10.1186/2053-8871-1-4.
    1. Chen L
    2. Bao S
    3. Lockard JM
    4. Kim JK
    5. Thompson RF
    (1996)
    Impaired classical eyeblink conditioning in cerebellar-lesioned and Purkinje cell degeneration (pcd) mutant mice
    The Journal of Neuroscience 16:2829–2838.
    1. Earhart GM
    2. Bastian AJ
    (2001)
    Selection and coordination of human locomotor forms following cerebellar damage
    Journal of Neurophysiology 85:759–769.
    1. Fortier PA
    2. Smith AM
    3. Rossignol S
    (1987)
    Locomotor deficits in the mutant mouse, Lurcher
    Experimental Brain Research 66:271–286.
    1. Górska T
    2. Zmysłowski W
    3. Majczyński H
    (1999)
    Overground locomotion in intact rats: interlimb coordination, support patterns and support phases duration
    Acta Neurobiologiae Experimentalis 59:131–144.
    1. Leblond H
    2. L'Esperance M
    3. Orsal D
    4. Rossignol S
    (2003)
    Treadmill locomotion in the intact and spinal mouse
    Journal of Neuroscience 23:11411–11419.
  1. Book
    1. Russell C
    2. Agapito L
    3. Setti F
    (2011)
    Efficient second order multi-target tracking with exclusion constraints
    British Machine Vision Association.
    1. Udo M
    2. Matsukawa K
    3. Kamei H
    4. Minoda K
    5. Oda Y
    (2004)
    Simple and complex spike activities of Purkinje cells during locomotion in the cerebellar vermal zones of decerebrate cats
    Experimental Brain Research 41:292–300.
    1. Wolpert DM
    2. Miall RC
    3. Kawato M
    (1998)
    Internal models in the cerebellum
    Trends in Cognitive Sciences 2:338–347.

Decision letter

  1. Indira M Raman
    Reviewing Editor; Northwestern University, United States

eLife posts the editorial decision letter and author response on a selection of the published articles (subject to the approval of the authors). An edited version of the letter sent to the authors after peer review is shown, indicating the substantive concerns or comments; minor concerns are not usually shown. Reviewers have the opportunity to discuss the decision before the letter is sent (see review process). Similarly, the author response typically shows only responses to the major concerns raised by the reviewers.

[Editors’ note: this article was originally rejected after discussions between the reviewers, but the authors were invited to resubmit after an appeal against the decision.]

Thank you for choosing to send your work entitled "A quantitative framework for whole-body coordination reveals specific deficits in freely walking ataxic mice" for consideration at eLife. Your full submission has been evaluated by Eve Marder (Senior Editor) and three peer reviewers, one of whom is a member of our Board of Reviewing Editors, and the decision was reached after discussions between the reviewers. Based on our discussions and the individual reviews below, we regret to inform you that your work will not be considered further for publication in eLife.

All the reviewers find that the study is very interesting and that the method presented for monitoring locomotion in relation to the cerebellar motor function and other motor functions is potentially strong. There are, however, concerns whether the automation procedure is making correct assessments of the locomotor parameters, that gaits are not taken into accounts in the description, that there is a lack of statistical evaluation of intra-limb coordination, and that the differences in full body movements may not account completely for the phenotype. To meet these concerns would require substantial reanalysis of the data and reconsidering the main conclusions of the study. Even with a new analysis there is a feeling that the results presented will mainly be a technical advance rather than a conceptual advance for cerebellar motor function or the locomotor field at large. The reasons for this are that there already are cerebellar specific mutants that have been analyzed in similar ways and that the locomotor data in wild-type are confirmative and lacking gait parameters. For these reasons the manuscript as presently configured is not suitable as a regular paper in eLife. The details of the concerns and suggestions for improvements are detailed in the attached review reports.

eLife has "Tools and Resources" that present methods papers. If you feel that you will be able to reanalyze the data as outlined and make a case that this method is better and more usable than other methods already published it might be an option for you to consider submitting your work in this form to eLife.

Reviewer #1:

The paper of Machado et al. introduces a camera-based motion capture system for the analysis of walking movements in the mouse. The heart of the system is machine learning operating on resampled images of high speed cameras for mice walking in a glass corridor. To illustrate its applicability, the paper compares the walking movements of wildtype and Purkinje cell degeneration (pcd) mice.

In general, for a paper introducing a novel analysis tool, I think it must be assessed whether the method provides measurements of highly useful parameters, with high explanatory value, that goes well beyond what has been attainable before. For instance, there was a very recent paper by Hoogland et al. (2015, Curr Biol.) introducing a method that is closely related to the present one (camera-based, measuring the paw positions as well as the whole body angle) and other measurement systems applied to locomotion exist in abundance, typically published alongside main scientific findings (for example, Kiehn 2013). To be clear, I think the authors have made a very careful and high-quality job, but I am doubtful that the advances provided here represent a major leap rather than a minor incremental change to the state-of-the art.

The paper promises to demonstrate a tool that can be used to monitor whole body coordination and 3D limb kinematics. But I find that the analysis of the whole body coordination boils down to computing the angle of the mid-body axis by utilizing the recorded position of the nose and tail, which is not particularly useful from a neuroscience perspective, as the angle is determined by the interplay of a very large number of muscles that could potentially change in different ways in a large number of deficits. In addition, data on the whole body movement is already provided in the solution of Hoogland et al. (2015). I also find that the stated monitoring of the 3D limb kinematics boils down to a monitoring of the 3D spatial position of the paw. But each position could theoretically be accomplished by many different configurations in the muscles of the limb, and the latter is the type of information that one would need to obtain a useful tool. Figure 3H seem at first glance to indicate that there is indeed some information on the limb joints – however, when I read the paper and the Methods, there are no indications that the joints are actually measured. Hence, I assume that the joint angles are computed out of the 3D paw data, which is problematic. First, if these angles are not measured but computed, the authors must explain where the data in their Figure 3H comes from. For the paper as a whole, this is a major problem since the main applicability of this setup would be if the user could actually track joint angles. Relying on computational models to deduce the 3D limb kinematics is very different from actually measuring it, and reduces the value of this method.

There are also some statements made about the analysis of pcd mice, claiming that this analysis supports that the cerebellum provides an internal model. But there is no evidence here that the cerebellum provides an internal model of any kind. What is seen here is only that block of the normal information processing pathway of various motor systems perturbs the capability of the central nervous system to rely on internal models. On the other hand, all biological motor control is feed-forward in nature, as it needs to deal with long delays, and feed-forward control can be solved only by using internal models. So the only thing learned from this study is that the normal function of the central nervous system in locomotion is dependent on a normally operating cerebellum. The internal models could be generated elsewhere, with the perturbed Purkinje cells destroying the capacity of the system as a whole by removing an otherwise permissive signal to any other system hypothetically responsible for generating/providing the internal model.

Reviewer #2:

The authors developed a very nice method to quantify motor performance during free locomotion in mice. They show that in cerebellar ataxia coordination rather than individual movements are affected. This is an elegant and thorough study, but a number of points require attention:

1) The authors used Purkinje cell degeneration (pcd) mice to test for cerebellar ataxia. Pcd mice start to lose their Purkinje cells during early adulthood – however, later on, other defects appear e.g. the loss of thalamic neurons after P50 and subsequently more widespread neurodegeneration (see Fernandez-Gonzalez, Science 2002 and references cited therein). The use of pcd mice at ages varying between p41 and p154, therefore, is expected to result in heterogeneous stages of neurodegeneration. This is not addressed experimentally. Therefore, the authors have to present their data separately for different age groups – especially for mice younger than p50 (no extra-cerebellar neurodegeneration expected) and older (including thalamic and maybe even more neurodegeneration).

2) Dependence of gait parameters of individual limbs on weight and speed.

The authors provide an elegant analysis of the correlations between weight, speed and specific parameters of single-limb movements. As expected, many (if not all) parameters depend on speed. The effect of weight, however, is more prominent in some parameters than in others (e.g. compare Figures 2C and 2E). The authors conclude that, given body weight and speed, they can make reasonably accurate predictions for single-limb movement parameters. However, the authors do not directly disentangle the impact of body weight vs. speed for each parameter. In other words, how much of the variation is explained by either one? Were there also gender- and/or age-related differences, or were these fully explained by variations in body weight (see Figure 2–figure supplement 2)?

3) Impact of speed for analyzing individual limb gait parameters in pcd mice.

The authors show in Figure 3 that pcd mice make smaller, slower steps than wildtype littermates. They argue that, despite the actual values being different from controls, individual limb parameters are largely in line with those from control mice at similar speed and with similar weight. This is an important finding, but it would be informative to show the impact of body weight alone. In other words: it seems that the (on-axis) trajectory of single limbs is not really different between pcd and control mice, but what about the timing?

In addition, the off-axis movements do seem to be affected, but it is not fully clear to me to what extent corrections for body size and speed have been applied here. In the Discussion, I feel that a better balance between the preserved on-axis parameters and the affected off-axis parameters in the discussion would be warranted.

4) I feel that the remark "the failure of existing systems to quantitatively capture gait ataxia" (in the subsection “Interlimb and whole-body coordination are specifically impaired in pcd”) is a bit too strong and does not acknowledge the merits of previous quantifications (e.g. Erasmus Ladder and transparent disk treadmill, which both can also quantify interlimb coordination). Although the authors show that the trajectory of individual limbs is not grossly affected in pcd mice, the speed is (Figure 3A). And the speed is in turn related to the velocity of single limbs (Figure 2E). Thus, without neglecting the importance of the current study, stating that previous studies were not able to quantitate features of gait ataxia or interlimb coordination is in my opinion too strong. For possibilities of transparent disk treadmill to study interlimb coordination, please refer to Hoogland et al., 2015, Current Biol). Here, the level of ataxia in tottering is not only quantified (including interlimb coordination), but also related to the level of complex spike synchrony. Please discuss this neurobiological mechanism upfront as well as the advantages and disadvantages of the technical possibilities of this disk treadmill system with respect to the current locomouse technology.

5) The authors show (in Figure 5) that tail lateral movements of control mice have a sinusoidal appearance, related to the stride phase. This movement is largely exaggerated in pcd mice. Whereas the lateral movements in control mice are coupled to the stride phase, in the pcd mice there seems to be more of a coupling to the time. The tail movements could be either a compensatory mechanism to counteract imbalance due to improper limb control or they could be affected themselves, contributing to further imbalance. Currently, the variations in tail movements are not really taken into account. Could the authors provide a more solid analysis showing whether tail movements are compensatory or affected by themselves?

6) In the Discussion, the authors mention that previous studies lack the fine-grained detail used in this work and therefore focused on "markers for global motor dysfunction [but] they lack specificity" (subsection “A quantitative framework for locomotor coordination”). Now that the authors have developed such a beautiful system: what is the effect of cerebellar ataxia? How does this separate from other motor dysfunctions (e.g. muscular dystrophy)?

7) In Figure 4, the authors showed the step-cycle for four limb movements by indicating the stance onset for each paw (Figure 4A) and the support pattern (Figure 4C). However, I find it still difficult to understand the phase relationship between limbs with regard to swing and stance phase. For example, to what extent does the onset of the swing phase of the forelimb occur during the swing or stance phase of the ipsilateral hindlimb? In order to have a better interpretation of inter-limb coordination, it might be worthwhile to add an additional figure with swing and stance phase indicated for each individual limb.

Reviewer #3:

The authors of this study have developed an automated kinematic analysis of locomotion in mice. They use it for locomotor analysis in freely moving wild-type mice. A detailed description of locomotor parameters allowed them to create a mathematical model to predict most of the parameters knowing just the walking speed and the body size of the animal. They extend this analysis to a mouse model for Purkinje cell degeneration (pcd). They conclude that the traditional locomotor parameters (stride length, cadence, intra-limb coordination) and forward trajectories are not different in wild-type mice and pcd mice. In contrast they conclude that the whole-body coordination is specifically impaired in pcd mice. Furthermore, a specific description of nose and tail oscillations in pcd mice were modeled as passive consequences of the forward motion of the hindlimbs. The main conclusions from the study are: a) only by studying whole-body coordination will it be possible to reveal the ataxic locomotor phenotype, and b) the observed locomotor changes are consistent with the hypothesis that the cerebellum provides a forward model for motor control. Although I find the study of great interest there are a number of issues that are problematic for the interpretation of the data. The authors will have to address these issues to avoid making incorrect statements about the findings and the method used.

1) The authors make a big deal out of using machine learning as an 'objective' way of measuring locomotor parameters. But there seems to be a lot of noise in the detection. This is seen in Figure 1E. Where is the level set for step onset and offset? Figure 2A is an even stronger case. At very low speed (<0.4) the stride length varies with a factor of 10 from 1 cm to 10 cm. 10 cm long stride lengths are not common at these speeds in mice. It must be a detection mistake. Also there are many values with very low stride lengths spread over all speeds. One would like to know how much irrelevant noise that the automated procedure introduces for example by showing traces from the low speed locomotion with 1 cm and 10 cm stride lengths. Everything in Figure 2 is known from many previous studies of rodent locomotion – so there is nothing new about it except that the authors have analyzed a large amount of steps.

2) The authors make a point out of not seeing any intralimb differences between wild-type and pcd mice. Looking at Figure 3 this referee is not convinced, and it seems that this statement that is likely to be wrong. There seems to be clear differences in almost all parameters. Statistical tests will be needed to support the claims.

3) A main conclusion is that the interlimb coordination changes from wild-type to pcd mice. More specifically from a trot to a walk pattern. Walking and trotting patterns have been described for tetrapods to be distinct gaits by many different studies. They are visible at different speeds of locomotion. In your experiments wild-type mice exhibited trot as unique gait used at all speeds, even at the lowest ones when the speed is below 0.2 m/s and the support limbs are three or four (Figure 4C and 4D). In contrast the pcd mutant mice exhibit only walk, reaching a maximum speed of 0.25 m/s. What is odd about this difference is that walk is clearly found in wild-type mice by all others than these investigators. I believe that it is present even in the present study but that it has been missed (how can you have trot with 3 or 4 limb on the ground?). Since the pcd mice locomote slower than the wild-type mice the change in coordination could simply be caused by a change in gait patterns that is speed dependent. It is known for many animal models (mouse as well) that the inter-limb and whole body coordination change when the animal uses different gaits. At the mechanical level different models have been used to explain the different body coordination of walking and trotting gaits (Mechanical work in terrestrial locomotion: two basic mechanisms for minimizing energy expenditure, Cavagna et al., 1977, American Journal of Physiology). Thus, most of the differences you describe between wild-type and mutant mice could be due just to the comparison of mice using two different gaits that clearly rely on different inter-limb and whole body coordination (e.g. Figure 4A, 4C, 6A and 6B). Indeed you have clear indications that walk is also expressed in wild-type mice at low speed (Figure 4A and 4C). The data should be reanalyzed to address this issue. I am convinced that if the data are reanalysed, walk will show up in wild-type mice as well. This will dramatically change the conclusion of the story.

4) The discussion about the superiority of the present method to others needs to be toned down. The general statement that the automated analysis described in the study provides a robust way for locomotor analysis avoiding "false positive findings that permeate the mouse locomotor literature" is not true and likely to offend the locomotor field at large. I strongly recommend that the authors consider gaits (walk, trot, gallop and bound) in their analysis. Since you have done an incredible work using size-matched controls, it will be helpful if the difference between wild-type and pcd mutant mice account just for the degeneration of the Purkinje cells and not for errors due to a comparison between mice using two different gaits.

5) To my knowledge pcd mice showed not only a degeneration of the Purkinje cells but also the slower degeneration of the photoreceptor cells of the retina and mitral cells of the olfactory bulb. Since you have used animals between 41 and 154 days old, could it be that a shorter range of speed is the result of a disorganization of the visual system and not only due to an impairment of the neural control of the locomotion? They walk slower because they are half blind?

[Editors’ note: what now follows is the decision letter after the authors submitted for further consideration.]

Thank you for submitting your work entitled "A quantitative framework for whole-body coordination reveals specific deficits in freely walking ataxic mice" for peer review at eLife. Your submission has been favorably evaluated by Eve Marder (Senior Editor), a Reviewing Editor, and three reviewers.

The reviewers have discussed the reviews with one another and the Reviewing Editor has drafted this decision to help you prepare a revised submission.

The reviewers all appreciated the fact that the novel LocoMouse tool permits automated analysis with high resolution of locomotion of freely walking mice, and they judged that this method has the potential to be of value to the field. They provide a number of comments for strengthening the manuscript, which are included below. These comments center on the being more explicit about the limits of the work, its interpretation (especially regarding the mutants), and comparison to other studies, providing more information about certain analyses, and addressing some points for clarity of presentation and communication. Specifically:

1) Toning down the claims about the superiority and power of the new method, perhaps providing a more explicit comparison to commercial packages.

2) Toning down the claims about providing direct evidence for forward models, perhaps simply by shifting these ideas to the Discussion.

3) Limiting the claims about changes and the lack of changes in the mutant, perhaps by focusing on the idea that one kinematic measure was preserved while others (interlimb and intralimb) were not.

4) Providing a better description of the construction of the passive model, and (if feasible) providing a physical model (or explaining why this was not done).

5) Addressing the point either experimentally or with clarification of the (apparently) very low N (=3) for the pcd mice.

6) Improving presentation of the results/figures/sequence of calling figures, as indicated in the reviews.

Reviewer #1:

1) The authors emphasize in several places that 'traditional' measures of kinematics are unimpaired in mutants. I found this to be overly-simplistic, at least based on the results presented here. As I understand it, the main consistency is in the x-axis forward paw motion, while there are changes in vertical and mediolateral paw motion and in joint angles. Changes in vertical paw trajectory and joint angles are hardly 'non-traditional', 'complex', or even '3D' and all measures are definitely 'individual-limb'. This point is made several times in the text (see points below) and seems unwarranted. I'm not saying the results aren't interesting, nor do I think that these conclusions are necessary for the impact of the paper – I just don't think that this conclusion as stated is supported.

2) On a similar point, it's not clear to me that any of their measures are really looking at within-limb coordination, at least as this is usually considered. Most of the measures relate to paw movement, whereas traditionally issues of coordination (e.g. in studies examining the role of the cerebellum, as cited in the paper) consider interactions between joints. Yet these analyses really aren't done here. They show that joint angles are apparently different in the animals, but these are for single joints as opposed to joint angle relationships (and what those angles are is unclear, see below). I don't think that the results shown here rule out a possible deficit in traditional, within-limb coordination. I think this is mainly an issue of presentation, however, rather than one of substance. As stated above, I don't think the impact of the paper relies on this conclusion and it could be made more precise without loss of significance.

3) I potentially like the analysis of nose and tail passive movements very much, but I did have a few issues with it. First, although the results are consistent with a role of the cerebellum in predictive control based on forward models, they're not really a direct demonstration thereof. A more direct demonstration might involve examining adaptations to perturbations, e.g. adding a weight to the tail and seeing that initially control animals look like mutants but then learn to predict and compensate for this, whereas mutants never do so. Also, could the results simply be interpreted as one of a limited capacity for motor control? e.g. mutants have limited capacity for producing locomotion and expend most of it on x-axis movement of the paw since it's critical for task performance, whereas other aspects of behavior are allowed to vary? I appreciate the authors are careful on this point to say that the results are 'consistent' with this idea, but alternative explanations might be considered more directly.

4) For the nose/tail passive analysis, I originally thought that this was an actual physical model, rather than the geometric model used here. It seems clear that a physical model is the better way to do this. Why wasn't it done? The geometric model, with its assumptions of lags taken from data which is actually observed, seems more indirect and therefore less compelling. Finally, as I understand it (and I might have missed it), this analysis was only done for the mutants. It would be very good to have done the same analysis for the control animals and show that the tail/nose movements are inconsistent with passive movement, e.g. it could have been that the movement of the pelvic girdle was different in controls, leading to less tail movement (even though the hindlimbs are in alternation for both controls and mutants).

Reviewer #2:

The paper by Machado et al. examines gait patterns in wildtype and Purkinje cell degeneration (pcd) mice using a novel system for tracking locomotor kinematics in freely walking mice. The authors conclude that the individual limb kinematics of pcd mice are normal when the weight and the walking speed of the mice are taken into account. In contrast, pcd mice have impaired coordination of movements across joints, limbs and body. These results are interpreted as evidence that the cerebellum provides a forward model. This is a strong paper. I commend the authors for wrestling with a complex dataset and extracting from it a number of thought-provoking findings. I personally found many of the results exciting, but I must admit that I'm not an expert in the field of locomotion or ataxia. It was not always clear if a particular result in the paper was a major advance or just confirmation of something we already knew. For this reason, I think that it's important for the authors to clarify and emphasize the significance of their results throughout the text. I've given two examples below:

1) It is remarkable that in wildtype mice, one can account for upwards of 80% of the variance in kinematic parameters like stride length, swing velocity and cadence, simply by taking into account the walking speed and the weight of the mouse. Is this a new approach? In their rebuttal, the authors mention that the Cendelin et al. (2010) paper found that all the gait differences between lurcher and control mice disappeared when they corrected for walking speed. Did Cendelin et al. make the correction using a similar modeling approach?

2) One of the main findings is that individual limb movements of pcd mice are relatively spared (when weight and walking speed are taken into account), whereas interlimb coordination is impaired. It is not clear how much of this we already knew. For example, in the subsection “Front-hind Interlimb coordination is specifically impaired in pcd”, the authors mention that previous studies in ataxic mice have failed to detect any impairments in the kinematic parameters of individual limbs. Did those studies not examine interlimb coordination as well? If the authors are the first to show that mice with cerebellar deficits have a specific impairment in locomotor coordination but not in movement of individual limbs, this is a big deal.

Additional recommendations to help make an already strong paper even stronger:

3) Drop the emphasis on forward models. The authors argue that the deficits they've uncovered point to a lack of a forward model in pcd mice. Although I found some of the evidence presented intriguing (for example the analysis of tail movements), it is far from conclusive. Furthermore, it is difficult to reconcile the normal individual limb kinematics with a faulty forward model – individual limbs are controlled by multiple agonist/antagonist muscles whose coordination requires well-calibrated forward models. I think the authors can still interpret their results in the context of forward/inverse models, but I strongly recommend that they save this interpretation for the Discussion, tone it down a bit and address the limitations. The paper would be stronger if the second paragraph of the Introduction is rewritten to highlight the main questions to be addressed in the paper, instead of offering to resolve controversies about forward vs inverse cerebellar models.

4) Analysis of variability: All the analyses are based on average data. For example, Figure 3B-E shows that there is no difference in the individual limb kinematics of pcd mice and sized-matched controls. But this is done only for the average kinematic values. Is it not possible that pcd mice might show increased trial-to-trial variability in their movements relative to sized-matched controls? How would such a finding change the authors' conclusions?

Reviewer #3:

The authors developed a machine learning algorithm to track the individual limbs as well as the nose and tail of mice in 3D during natural, voluntary locomotion. They provide a very detailed analysis of locomotion parameters in control and ataxic Purkinje cell degeneration (pcd) mice, revealing that individual limb kinematics in pcd mice are not different from control mice when accounting for the mouse's weight and speed, but that pcd mice present multi-joint and inter-limb-coordination deficits. The study has been carefully conducted and provides new and useful tools for measuring and analyzing specific features of locomotion and ataxia with unprecedented accuracy.

1) The construction of the "passive model" (Figure 5) is unclear. For example, does this model take into account the mass of the tail? Please describe in more detail how the passive prediction is calculated.

2) The authors contrast the forward model with an inverse kinematic model in the Introduction. What do they think the inverse kinematic model would predict and how does this contrast with their findings?

[Editors' note: further revisions were requested prior to acceptance, as described below.]

Thank you for resubmitting your work entitled "A quantitative framework for whole-body coordination reveals specific deficits in freely walking ataxic mice" for further consideration at eLife. Your revised article has been favorably evaluated by Eve Marder (Senior Editor), a Reviewing Editor, and three reviewers. The manuscript has been greatly improved and the revision was met with enthusiasm. There are only a few remaining issues that need to be addressed before acceptance, as outlined below:

In particular, the manual joint-angle analysis shown in Figure 3H seems limited by the single animal in each condition, and discussion among reviewers and editors led to the consensus that it could simply be dropped without major impact on the manuscript. We therefore recommend cutting this one measurement and illustration. Alternatively, if there is some reason why a single animal in each category is of value, please justify the experiment clearly. This point is explained further below.

In the subsection “Individual limb parameters”, the description makes it seem like one pcd animal and one control were used for this analysis. If so, this seems very questionable and underpowered. I'd be willing to bet that, with enough n, it would be possible to find a significant difference between two different weight matched controls. I'm not sure how the stats behave in this situation, but it's not clear to me how mixed models would be able to partition variance due to random effects (individual subjects) from the fixed effects (mutation) if there were only one animal in each group. It seems that for other comparisons with weight matched controls much larger N's are used, whereas this analysis is limited because of the need to hand mark frames. It might be easiest to simply drop this joint angle analysis – I don't think its omission would change the impact of the paper. Also, shouldn't it be ‘knee, heel, toe’? And here it's stated that the angle of the foot and arm relative to the ground are quantified – I might have missed it, but I wasn't sure where that was reported in the Results.

https://doi.org/10.7554/eLife.07892.021

Author response

[Editors’ note: the author responses to the first round of peer review follow.]

We are confident that we have addressed the reviewers’ concerns, without further experiments or substantial re-analysis of the data. Moreover, we are grateful for constructive criticism and were happy to revise the manuscript to address the concerns and questions raised by all three reviewers. However, while many of the specific comments were helpful, we have some issues with nearly every point raised in the summary paragraph that provides the rationale for the decision on our manuscript.

Specifically, we note that our reviewers heavily refer (both explicitly and implicitly) to two papers that came out in press in Current Biology after we first submitted our paper to eLife. While any rejection is difficult, we feel that our case warrants an appeal. Please find a detailed response to the concerns raised during review below.

All the reviewers find that the study is very interesting and that the method presented for monitoring locomotion in relation to the cerebellar motor function and other motor functions is potentially strong. There are, however, concerns whether the automation procedure is making correct assessments of the locomotor parameters […]

We address this point in detail below in response to Reviewer #3.

[…] that gaits are not taken into accounts in the description,

We address the issue of categorizing interlimb coordination with gaits in detail below in response to Reviewer #3.

[…] that there is a lack of statistical evaluation of intra-limb coordination,

Figures 2 and 3 and their supplements are entirely devoted to the statistical evaluation of intra-limb coordination. We address this very important point below in response to the reviewers’ specific comments.

[…] and that the differences in full body movements may not account completely for the phenotype.

We address these very important points in more detail below. To be clear, we agree that there are clearly differences in individual limb movements in pcd, as is shown in Figure 3. However, we also show that many of these differences (specifically, all of the ones related to forward paw motion) are fully accounted for by the statistical models derived in Figure 2 that predict gait parameters based solely on walking speed and body size. The thick lines in Figure 3 are not fits to the data, they are the values of gait parameters that are predicted based on the models generated in Figure 2, for this new set of mice, walking at these speeds. The fact that they match the data for both pcd and littermates, demonstrates that the differences in these parameters in pcd (while real!) do not depend on nor account for the ataxic phenotype. In contrast, the off-axis difference in pcd cannot be accounted for by differences in walking speed or body size, and so do reflect ataxia.

To meet these concerns would require substantial reanalysis of the data and reconsidering the main conclusions of the study.

We don’t think it does. We had already performed nearly all of the requested analyses – most we had not included simply out of concern for length. We have now also performed additional analyses to address specific concerns, many of which we include here to show that the main conclusions of the study are not changed.

Even with a new analysis there is a feeling that the results presented will mainly be a technical advance rather than a conceptual advance for cerebellar motor function or the locomotor field at large.

We respectfully, yet strongly, disagree. We believe that our mathematical modeling approach, our quantitative treatment of interlimb phasing, the passive geometric modeling of nose and tail oscillations (which perfectly match those of pcd), and our correlation analysis of coordination across the body, all provide an entirely new quantitative and conceptual framework for understanding mouse locomotor coordination. This framework allowed us not just to capture but also isolate specific deficits in multijoint, interlimb, and whole-body coordination in ataxia. We started with a messy, entirely unconstrained dataset, but through the application of quantitative principles, it revealed a very specific deficit in pcd mice – an absence of forward models that allow the mouse to control the movements of individual parts of the body (joints, limbs, head, and tail) through the use of predictions about the movements other parts of the body (joints, limbs). The major effort here, and the major advance, was in using quantitative analysis to establish a conceptual framework that yields meaningful insights into biological data.

Reasons for this are that there already are cerebellar specific mutants that have been analyzed in similar ways […]

We are of course, happy to update the manuscript and include this recent paper (Hoogland et al.), as requested by Reviewer #2. However, we also point out that our paper – in its goals, approach, and conclusions – is quite different from that of Hoogland et al., not least because we are concerned with analyzing locomotor coordination in freely walking mice. Moreover, beyond being against eLife’s policy of assessing novelty, since the papers were near-simultaneous, the analyses in the two papers are so different that we’re not sure how anyone who has read both papers can argue that they are similar enough to interfere with the conclusions of our paper.

[…] and that the locomotor data in wild-type are confirmative and lacking gait parameters.

We disagree and outline our arguments in detail below in response to Reviewer 3.

For these reasons the manuscript as presently configured is not suitable as a regular paper in eLife. The details of the concerns and suggestions for improvements are detailed in the attached review reports.

eLife has "Tools and Resources" that present methods papers. If you feel that you will be able to reanalyze the data as outlined and make a case that this method is better and more usable than other methods already published it might be an option for you to consider submitting your work in this form to eLife.

Thank you. We appreciate that this paper could be seen as either a Tools or a Research Article. We hope, given the present clarification of our rationale and the fact that we have now addressed the reviewers’ specific concerns, through clarification of misunderstandings, additional analyses, and revisions to the manuscript (outlined point-by-point below), that you will be willing to provide us guidance on how to proceed with possible publication in eLife, in whichever format you find appropriate.

Reviewer #1:

The paper of Machado et al. introduces a camera-based motion capture system for the analysis of walking movements in the mouse. The heart of the system is machine learning operating on resampled images of high speed cameras for mice walking in a glass corridor. To illustrate its applicability, the paper compares the walking movements of wildtype and Purkinje cell degeneration (pcd) mice.

In general, for a paper introducing a novel analysis tool, I think it must be assessed whether the method provides measurements of highly useful parameters, with high explanatory value, that goes well beyond what has been attainable before. For instance, there was a very recent paper by Hoogland et al. (2015, Curr Biol.) introducing a method that is closely related to the present one (camera-based, measuring the paw positions as well as the whole body angle) and other measurement systems applied to locomotion exist in abundance, typically published alongside main scientific findings (for example, Kiehn 2013). To be clear, I think the authors have made a very careful and high-quality job, but I am doubtful that the advances provided here represent a major leap rather than a minor incremental change to the state-of-the art.

We point out that this paragraph makes the implicit assumption that the tracking system we introduce is meant to be the main advance in the paper. For us the tracking system was a tool that we needed (and that did not and does not to our knowledge exist) to establish a quantitative framework for whole-body coordination in freely walking mice. We provide the full details of our system because we want it to be of use to other labs interested in the neural control of coordinated movement. But to be very clear, we think the major advance here is a new conceptual framework for mouse locomotor coordination. It was made possible by the increased resolution and throughput of the new tracking system that we describe, but more importantly, the isolation of specific features of ataxia in freely walking mice provides novel insights into mouse locomotor coordination that challenge the existing state-of-the art.

At the same time, we admit that we had previously failed to express that we recognize the value of existing systems for measuring locomotion and we know that these have been used successfully to analyze contributions of the spinal cord, in particular, to the generation of locomotor patterns. We have edited the text of the manuscript to reflect this appreciation more explicitly (in the subsection “LocoMouse”). However, critically, these approaches have not been nearly as successful in providing insights into cerebellar contributions to locomotion. The point we are trying to make here is that these failures have been for three main reasons: 1) a failure to distinguish between specific features of ataxia vs. secondary consequences of slower walking speeds and smaller body sizes, 2) a lack of detailed, 3D kinematic data, and 3) a lack of emphasis on coordination across joints, limbs, and body, which are so particularly sensitive to cerebellar damage and which are not the main focus of most off-the-shelf locomotor assays. We hope that our revisions make our position more clear on these points.

The paper promises to demonstrate a tool that can be used to monitor whole body coordination and 3D limb kinematics. But I find that the analysis of the whole body coordination boils down to computing the angle of the mid-body axis by utilizing the recorded position of the nose and tail, which is not particularly useful from a neuroscience perspective, as the angle is determined by the interplay of a very large number of muscles that could potentially change in different ways in a large number of deficits.

First, we use whole-body coordination here not just to mean measuring nose and tail movements, but also the spatiotemporal relationships across various body elements, as in Figure 6. Here, whole-body coordination is demonstrated by the ribbon plots and correlation matrices in a way that is meant to highlight that the spatiotemporal relationships of movements across the body are impaired in pcd (in contrast to the forward paw motion, which is intact, Figure 3E). We have changed the headings in the Results to be more consistent with our true meaning.

Second, we are confused by the reviewer’s claim that our “analysis of whole-body coordination boils down to computing the angle of the mid-body axis”, as this is not something we report. Perhaps they have confused our analysis with that of Hoogland et al., to which this comment more readily applies? Or perhaps they were misled by looking at Figure 5A (now 5C)? To clarify, Figure 5A(C) does not show how we measured the tail, but rather, shows how we derived the equations predicting what passive oscillations of the tail would look like if they resulted solely from the orthogonal coupling between the forward motion of the hindlimbs and side-to-side tail movement. Our measurements of tail movements were, as described in the methods and figure legend, 3D position values for 15 individual tail segments. We completely agree that the movements of the tail could potentially change in different ways in a large number of deficits, which is precisely why the demonstration that the tail oscillates as a passive consequence of hind limb motion in pcd is so important. This wasn’t at all trivial and together with the off-axis/multijoint impairments of individual limbs, points to a specific lack of ability to predict the consequences of movements of other parts of the body.

Finally, we respectfully disagree with the reviewers’ apparent position that quantitative analysis of kinematics is not useful for neuroscience. While ultimately, of course, movements are effected by muscles, kinematic analysis has been fundamental to the understanding of the neural control of movement, and kinematic representations have been found in many motor areas, in particular in Purkinje cells, where they have been dissociated from muscle activity/dynamics (Pasalar et al. 2006). Moreover, our analyses of 3D paw trajectories and joint angles actually highlight the fact that yes, absolutely, there are different ways to achieve the same movement, and our finding that pcd mice achieve the same forward movements of the paws with different off-axis movements and different joint angles, we would argue, is in itself an argument for the importance of the kind of detailed kinematic analysis that we provide.

In addition, data on the whole body movement is already provided in the solution of Hoogland et al. (2015).

We now cite the now-published Hoogland et al. paper from the De Zeeuw group in our manuscript. However we point out a very meaningful difference between our study and theirs, which is that ours is in freely walking mice. There are likely to be critical differences in whole-body coordination in these different setups. Moreover, again, we do not see the only advance in our paper as being the measurement of movement per se, but rather emphasize the quantitative and conceptual framework we use to analyze it.

I also find that the stated monitoring of the 3D limb kinematics boils down to a monitoring of the 3D spatial position of the paw. But each position could theoretically be accomplished by many different configurations in the muscles of the limb, and the latter is the type of information that one would need to obtain a useful tool.

We take the reviewer’s point to be more clear in the text about when we are referring to limb vs. paw kinematics, and have changed several sentences accordingly. However, we also reiterate our belief, stated above, that kinematic analysis has been generally useful for motor control and that the specificity of the tail and 3D paw findings in pcd are themselves strong arguments that detailed kinematic analysis can provide important insights.

Figure 3H seem at first glance to indicate that there is indeed some information on the limb joints – however, when I read the paper and the Methods, there are no indications that the joints are actually measured. Hence, I assume that the joint angles are computed out of the 3D paw data, which is problematic. First, if these angles are not measured but computed, the authors must explain where the data in their Figure 3H comes from. For the paper as a whole, this is a major problem since the main applicability of this setup would be if the user could actually track joint angles. Relying on computational models to deduce the 3D limb kinematics is very different from actually measuring it, and reduces the value of this method.

We apologize that we were not clear about this. The joint angles were absolutely measured, not computed. We agree that this would have been problematic. We have added the joint angles to the list of measurements in the Methods and have rewritten the relevant paragraph in the subsection “Single-limb deficits in pcd are restricted to off-axis paw trajectories and joint angles”. The joint angles were computed manually by clicking on movie frames.

While more labor intensive than our other analyses, the only way we could have made the joint tracking automatic would have been to use markers, and we think the advantages of a markerless system outweigh any potential concerns about reduced throughput – and in fact the throughput here is similar to other non-automated systems (eg Motorater, Zorner et al.).

There are also some statements made about the analysis of pcd mice, claiming that this analysis supports that the cerebellum provides an internal model. But there is no evidence here that the cerebellum provides an internal model of any kind. What is seen here is only that block of the normal information processing pathway of various motor systems perturbs the capability of the central nervous system to rely on internal models. On the other hand, all biological motor control is feed-forward in nature, as it needs to deal with long delays, and feed-forward control can be solved only by using internal models. So the only thing learned from this study is that the normal function of the central nervous system in locomotion is dependent on a normally operating cerebellum. The internal models could be generated elsewhere, with the perturbed Purkinje cells destroying the capacity of the system as a whole by removing an otherwise permissive signal to any other system hypothetically responsible for generating/providing the internal model.

a) We respectfully disagree that all biological motor control is feedforward – feedback is often used to adjust ongoing movements, albeit with a delay.

b) Although we personally agree with the reviewer about the importance of internal models for motor control, there is significant controversy on this point within the cerebellar field, in terms of whether the cerebellum provides inverse or forward models, or both, or neither. See, for example, the second paragraph of our Introduction, and the references within it.

c) Our data point specifically to a lack of a forward (but not inverse) model in ataxic pcd mice. Why? Because i) Forward paw kinematics are normal, which would not be the case if there was a failure in an inverse model. ii) Previous studies have argued that a lack of a forward model leads to deficits in multijoint coordination in ataxic patients (e.g. Bastian et al. 1996), very like what we see here in Figure 3C) The passive oscillation of the tail in pcd reveals the lack of a mechanism that normally predicts and actively cancels this oscillation in wildtype mice. We have edited this portion of the discussion to be more specific on these points.

d) While it is true that cerebellar output could be permissive for the function of a forward model rather than generating/providing that model per se, the hypothesis that it actually generates it has been influential in the field. We had tried to be careful with our wording to avoid going beyond our data on this point (e.g. from the subsection “Cerebellar contributions to coordinated movement”: “The changes in multijoint and interlimb coordination, and the apparent passive oscillations of the nose and tail in pcd can be interpreted as a failure to predict the consequences of movements of other parts of the body, an idea that is consistent with forward model theories of cerebellar function (Bastian et al., 1996; Ebner and Pasalar, 2008; Ito, 2008; Kennedy et al., 2014; Wolpert et al., 1998).” We have edited several other statements to avoid words like “generating” as the reviewer suggests. Still we emphasize that the fact that all of the deficits we observe can be interpreted as the failure of a forward model points to this being an important aspect of cerebellar function, permissive or not.

e) We think the statement, “the only thing learned from this study is that the normal function of the central nervous system in locomotion is dependent on a normally operating cerebellum” is unfair. The point of this paper is to overturn that notion and show that actually, locomotion is affected in very specific ways in pcd. The preservation of forward paw kinematics was completely unexpected based on the existing literature and it changes the way we think about ataxia. It also reveals that while Purkinje cell activity often correlates with movement kinematics, this may not be its essential function – at the very least, other parts of the brain can compensate. However other parts of the brain do not appear to compensate for the loss of a forward model.

Reviewer #2:

The authors developed a very nice method to quantify motor performance during free locomotion in mice. They show that in cerebellar ataxia coordination rather than individual movements are affected. This is an elegant and thorough study, but a number of points require attention:

Thank you and we address all of these points below.

1) The authors used Purkinje cell degeneration (pcd) mice to test for cerebellar ataxia. Pcd mice start to lose their Purkinje cells during early adulthood – however, later on, other defects appear e.g. the loss of thalamic neurons after P50 and subsequently more widespread neurodegeneration (see Fernandez-Gonzalez, Science 2002 and references cited therein). The use of pcd mice at ages varying between p41 and p154, therefore, is expected to result in heterogeneous stages of neurodegeneration. This is not addressed experimentally. Therefore, the authors have to present their data separately for different age groups – especially for mice younger than p50 (no extra-cerebellar neurodegeneration expected) and older (including thalamic and maybe even more neurodegeneration).

Yes, we agree that it is an important consideration and we have done this. We have added some graphs as a figure supplement (Figure 5–figure supplement 2) that show that the main conclusions of our study hold in the youngest pcd mice (<p50).

2) Dependence of gait parameters of individual limbs on weight and speed.

The authors provide an elegant analysis of the correlations between weight, speed and specific parameters of single-limb movements. As expected, many (if not all) parameters depend on speed. The effect of weight, however, is more prominent in some parameters than in others (e.g. compare Figures 2C and 2E). The authors conclude that, given body weight and speed, they can make reasonably accurate predictions for single-limb movement parameters. However, the authors do not directly disentangle the impact of body weight vs. speed for each parameter. In other words, how much of the variation is explained by either one? Were there also gender- and/or age-related differences, or were these fully explained by variations in body weight (see Figure 2–figure supplement 2)?

We apologize that we were not more clear on this point, because we did in fact directly quantify the relative contributions of body weight, speed, age and gender. These were reported in Figure 2–figure supplement 2, but clearly we should have been more explicit. To address this, we have edited the treatment of this issue in the subsection “Gait parameters for individual limbs vary consistently with walking speed and body size” and rewritten the Legend for the figure supplement to explain in less technical terms what we had done. We have also added specific demonstrations of the failure of the additional factors of gender or age to improve the predictions above and beyond body weight and walking speed alone, both to the tables in the supplement and in the text.

3) Impact of speed for analyzing individual limb gait parameters in pcd mice.

The authors show in Figure 3 that pcd mice make smaller, slower steps than wildtype littermates. They argue that, despite the actual values being different from controls, individual limb parameters are largely in line with those from control mice at similar speed and with similar weight. This is an important finding, but it would be informative to show the impact of body weight alone. In other words: it seems that the (on-axis) trajectory of single limbs is not really different between pcd and control mice, but what about the timing?

First, thank you for pointing out the importance of this finding, which we agree is a major contribution of the paper. In terms of showing the impact of body weight alone, we point out that in Figure 3B-D, the differences in the model predictions (thick lines) for the two sets of mice are due entirely to body weight differences, since speed and weight were the only two factors included in the predictions, and the data are plotted as a function of speed. We don’t understand the last sentence, however, about the timing – if you mean interlimb timing, we address that point in Figure 4 (and below in response to Reviewer 3). Or do you mean the temporal profile of the trajectories themselves? Those are shown in Figure 3E, for pcd and size- matched controls.

To emphasize the role of body weight alone, and to further illustrate the fact that changes in body weight and walking speed together can fully account for the changes in forward limb movement in pcd, we have added a Figure Supplement to Figure 3 that compares the gait parameters of pcd, littermates, and size-matched controls.

In addition, the off-axis movements do seem to be affected; but it is not fully clear to me to what extent corrections for body size and speed have been applied here.

This is an important point, but please note that the last line of the legend for Figure 3 states, “For E-H controls are size-matched control […] see Figure 2–figure supplement 1”, and that at the end of the subsection “Changes in gait parameters for individual limbs are predicted by changes in walking speed and body size” we state: “pcd animals are compared with size-matched controls from here on.” Similarly, speed is indicated by the line thicknesses on each trajectory plot and the legend for Figure 3E states “line thickness represents increasing speed”. To be sure to avoid any misunderstanding on this important point, however, we changed the color-coding in Figure 3 to distinguish between littermates and size-matched controls and we have added the words “size-matched” before “controls” at many places in the text and legends. We also now specify that the line thickness legend in the panel of Figure 3E refers also to 3F and 3G.

In the Discussion, I feel that a better balance between the preserved on-axis parameters and the affected off-axis parameters in the discussion would be warranted.

Yes, we agree, and we have revised this part of the Discussion, based on the feedback from this reviewer and Reviewer #3. We also added a new, separate heading to the Results.

4) I feel that the remark "the failure of existing systems to quantitatively capture gait ataxia" (in the subsection “Interlimb and whole-body coordination are specifically impaired in pcd”) is a bit too strong and does not acknowledge the merits of previous quantifications (e.g. Erasmus Ladder and transparent disk treadmill, which both can also quantify interlimb coordination). Although the authors show that the trajectory of individual limbs is not grossly affected in pcd mice, the speed is (Figure 3A). And the speed is in turn related to the velocity of single limbs (Figure 2E). Thus, without neglecting the importance of the current study, stating that previous studies were not able to quantitate features of gait ataxia or interlimb coordination is in my opinion too strong.

We have toned this down in several ways. First, we are more explicit about the contributions of the other methods, such as the ones mentioned by the reviewer. Second, we are more explicit about when we are referring specifically to gait patterns of freely walking mice, which neither the Erasmus ladder nor the transparent disk treadmill address. Third, and most importantly, we clarify several places in the text to make it more clear that out that our point is not that other studies have not measured changes associated with gait ataxia, but rather that: a) those changes do not necessarily relate to ataxia per se, beyond reflecting changes in walking speed alone, which are not specific and b) that here, we not only measure changes associated with ataxia that have not previously been reported (3D trajectories, specific front-hind interlimb coordination deficits, and tail movements), but we also isolate them from the non-specific effects of altered walking speed. Finally, we point out that the specific sentence mentioned by the reviewer, was meant to refer specifically to the reference within it (Cendelin et al., 2010), which attempted to quantify ataxia in freely walking lurcher mice with the CatWalk system, and found that all the differences between lurcher and control mice that they observed disappeared when they corrected for walking speed. But we didn’t say this explicitly and we realize that not everyone who reads our paper will be familiar with that work – hence the changes to the text that we have made in response to the reviewers.

For possibilities of transparent disk treadmill to study interlimb coordination, please refer to Hoogland et al., 2015, Current Biol). Here, the level of ataxia in tottering is not only quantified (including interlimb ccordination), but also related to the level of complex spike synchrony. Please discuss this neurobiological mechanism upfront as well as the advantages and disadvantages of the technical possibilities of this disk treadmill system with respect to the current locomouse technology.

We have added the now-published Hoogland et al. (2015) to our revision.

5) The authors show (in Figure 5) that tail lateral movements of control mice have a sinusoidal appearance, related to the stride phase. This movement is largely exaggerated in pcd mice. Whereas the lateral movements in control mice are coupled to the stride phase, in the pcd mice there seems to be more of a coupling to the time. The tail movements could be either a compensatory mechanism to counteract imbalance due to improper limb control or they could be affected themselves, contributing to further imbalance. Currently, the variations in tail movements are not really taken into account. Could the authors provide a more solid analysis showing whether tail movements are compensatory or affected by themselves?

We have edited the text of the results to make it more clear that our geometrical model addresses the reviewer’s point quite nicely. The model, shown by the grey dashed lines in Figure 5B and C and the thick lines in Figure 5F, calculates predictions of what passive oscillations of the tail would look like if they resulted solely from the orthogonal coupling between the forward motion of the hindlimbs and side-to-side tail movement. The fact that the grey dashed lines in Figure 5B and C and the thick lines in Figure 5F match the pcd data, reveals that the side-to-side tail oscillation in pcd is exactly what is predicted as a passive consequence of forward hindlimb motion. Criticallly, we emphasize that hindlimb alternation is unaltered in pcd (Figure 4A and B), and so these changes in tail movement cannot result from changes in hindlimb oscillation. (On a side note, however, the increased oscillations certainly contribute to imbalance, and in fact we think this may be a major reason for the characteristic increased base of support in ataxia that we observe in Figure 3.)

We recognize that we did not adequately explain/emphasize the importance of the passive tail model with our previous submission. To emphasize this important finding, we have reordered the panels in Figure 5, rewritten the description of Figure 5 in the main text to go more slowly through it, and added a movie of the model, to show just how well passive deflections of the tail and nose based solely on perpendicular coupling to forward motion of hindlimbs captures the gestalt of the ataxia in pcd.

6) In the Discussion, the authors mention that previous studies lack the fine-grained detail used in this work and therefore focused on "markers for global motor dysfunction [but] they lack specificity" (subsection “A quantitative framework for locomotor coordination”). Now that the authors have developed such a beautiful system: what is the effect of cerebellar ataxia? How does this separate from other motor dysfunctions (e.g. muscular dystrophy)?

This is an important point that highlights the potential impact of our approach. Clearly we have isolated specific deficits in coordination across joints, limbs, and body in pcd. We very much hope that the current paper will help many groups interested in mouse models of various diseases to identify and isolate specific features of motor function that are affected in their systems. We would speculate, for example, that the sparing of forward paw trajectories in pcd would not be expected in the muscular dystrophy example, but interlimb coordination could be spared. We are currently analyzing several other mouse mutants with extra-cerebellar phenotypes and while those studies are in preliminary stages and outside of the scope of the current paper, the results are quite different from those we report here. We further note that it is not just the tracking system itself that allows for this specificity, it comes especially from the quantitative framework we use to analyze the data.

7) In Figure 4, the authors showed the step-cycle for four limb movements by indicating the stance onset for each paw (Figure 4A) and the support pattern (Figure 4C). However, I find it still difficult to understand the phase relationship between limbs with regard to swing and stance phase. For example, to what extent does the onset of the swing phase of the forelimb occur during the swing or stance phase of the ipsilateral hindlimb? In order to have a better interpretation of inter-limb coordination, it might be worthwhile to add an additional figure with swing and stance phase indicated for each individual limb.

Yes, we agree that this is complicated and we had focused on stance phases (Figure 4A) together with the support patterns (Figure 4C) out of space concerns. There are also changes in stance-swing phasing in pcd, which are what cause the changes in support patterns (Author response image 1).

Author response image 1
Stance to swing phases for size-matched controls and all pcd.
https://doi.org/10.7554/eLife.07892.023

We recognize that this is still complicated. There are more traditional Hildebrand-style plots for pcd and size-matched controls, for 3 speed bins (speed increasing from top to bottom panels).

Author response image 2
Average Hildebrand plots aligned to FR stance onset.
https://doi.org/10.7554/eLife.07892.024

We hope this makes it more clear. We have added Hildebrand plots to Figure 4.

Reviewer #3:

The authors of this study have developed an automated kinematic analysis of locomotion in mice. They use it for locomotor analysis in freely moving wild-type mice. A detailed description of locomotor parameters allowed them to create a mathematical model to predict most of the parameters knowing just the walking speed and the body size of the animal. They extend this analysis to a mouse model for Purkinje cell degeneration (pcd). They conclude that the traditional locomotor parameters (stride length, cadence, intra-limb coordination) and forward trajectories are not different in wild-type mice and pcd mice.

This last sentence is not quite accurate and we need to clarify here that we do find that these parameters are different in pcd mice, but that these differences disappear when we take changes in walking speed and body size into account. This is an incredibly important point that changes the entire message of the paper.

In contrast they conclude that the whole-body coordination is specifically impaired in pcd mice. Furthermore, a specific description of nose and tail oscillations in pcd mice were modeled as passive consequences of the forward motion of the hindlimbs. The main conclusions from the study are: a) only by studying whole-body coordination will it be possible to reveal the ataxic locomotor phenotype, and b) the observed locomotor changes are consistent with the hypothesis that the cerebellum provides a forward model for motor control. Although I find the study of great interest there are a number of issues that are problematic for the interpretation of the data. The authors will have to address these issues to avoid making incorrect statements about the findings and the method used.

Thank you and we address all of these issues, below.

1) The authors make a big deal out of using machine learning as an 'objective' way of measuring locomotor parameters. But there seems to be a lot of noise in the detection. This is seen in Figure 1E. Where is the level set for step onset and offset?

The swing and stance onsets are calculated from the bottom view, not the side view data and so were plotted in Figure 1D. We point out that the noise in the detection was quantified in Figure 1–figure supplement 1 where we compared manual clicking on each paw on each frame with the automated detection for 11 movies. Here you can see a few important points. Importantly, Figure 1E, which the reviewer singles out as “noisy” represents vertical (z) axis tracking, which is typically not measured at all in other papers. In the figure supplement you can see that the “z” tracking is noisier than x and y tracking, for several reasons. First, because of the very small vertical movements of the paws, the movements are only a few pixels high – the apparent “noise” in the detection in Figure 1E is generally less than 1mm, which corresponds to 2.5 pixels even on our high resolution movies. Second, because of the relatively large size of the paws compared to the vertical displacement, most of the apparent discrepancies between manual and automated tracking are within the size of a paw (all black data points in the supplement). Thus this “noise” is actually largely biological – the paw position is defined as the center of the paw, and as you can see in the movies, the center of the paws moves vertically even during the “stance” phase. Thus it is difficult/moot to say whether the discrepancies between detection and manual clicking in these cases are from automated errors or human ones. Finally, we refer the reviewer to the movies where you can evaluate the automated tracking performance (again, focusing on the bottom view, which forms the basis for all stride analyses, because of these considerations) first hand.

Figure 2A is an even stronger case. At very low speed (<0.4) the stride length varies with a factor of 10 from 1 cm to 10 cm. 10 cm long stride lengths are not common at these speeds in mice. It must be a detection mistake. Also there are many values with very low stride lengths spread over all speeds. One would like to know how much irrelevant noise that the automated procedure introduces for example by showing traces from the low speed locomotion with 1 cm and 10 cm stride lengths.

Exactly, these values are not common at these speeds in mice. Please keep in mind that in Figure 2A, nearly 10,000 strides are plotted. We shared our raw data exactly to emphasize the point of how noisy this unconstrained, virtually unfiltered dataset was, and how important it was to account for this variability. As the reviewer points out, there are some outliers. However, the assumption that this “noise” must result from tracking mistakes is incorrect.

The specific examples the reviewer requests, of short and long stride lengths at slow walking speeds, are almost always accounted for by the fact that we calculated walking speed stride-wise, from stance onset to stance onset. Because we did not filter our data for continuous walking (because stopping and starting may be an important feature of some motor phenotypes, e.g. basal ganglia), there were sometimes long stance periods when the animal paused just before re-initiating locomotion (Figure 1–figure supplement 1C, on the right). Figure 1–figure supplement 1C shows examples (as requested) of very short (left) and very long (right) stride lengths at slow walking speeds, that show that these “outliers” are not, as the reviewer assumes, due to detection mistakes, but rather to sudden changes in walking speed.

On the other hand, we do not claim that our tracking or swing/stance point detection are perfect (see e.g. green points in Figure 1–figure supplement 1). However we point out that the total number of outliers in Figure 2A – including not just tracking failures but also the kinds of biological variability shown in the figures above – is 130 out of 9,602 total strides. Thus tracking or swing/stance detection errors are affecting at most ∼1% of strides. Given our multi-level modeling approach to analyzing the data, these points do not pose a significant contamination threat. Further, we think that the major benefits that come from using automation and avoiding data selection and filtering more than compensate for any occasional imperfections.

Everything in Figure 2 is known from many previous studies of rodent locomotion – so there is nothing new about it except that the authors have analyzed a large amount of steps.

This is not true. Please keep in mind that the thick lines in Figure 2 are the outputs of equations that predict gait parameters as a function of walking speed and body size, which is entirely new. In the words of Reviewer 2, in Figure 2 “The authors provide an elegant analysis of the correlations between weight, speed and specific parameters of single-limb movement […] The authors conclude that, given body weight and speed, they can make reasonably accurate predictions for single-limb movement parameters.” This is very important – Figure 2 and its supplements show the derivation of equations that predict movement parameters of individual limbs for a mouse of a given size walking at a given speed – and the littermate data in Figure 3 validates these predictions for a new cohort of animals. Without this analysis, which is new, we would not have been able to isolate specific deficits in ataxia.

Moreover, the 3D paw, nose, and tail trajectories during locomotion at a range of speeds in freely walking mice that we present are, to our knowledge, entirely new. To emphasize this, we have pulled this data out of the supplement to Figure 3 and included the forepaw kinematics in Figure 2 and hindpaw kinematics in Figure 3.

2) The authors make a point out of not seeing any intralimb differences between wild-type and pcd mice. Looking at Figure 3 this referee is not convinced, and it seems that this statement that is likely to be wrong. There seems to be clear differences in almost all parameters. Statistical tests will be needed to support the claims.

Unfortunately it seems that the reviewer’s misunderstanding of Figure 2 has permeated into this interpretation of Figure 3. To clarify, as we state in multiple places in the text (for example, in the subsection “Changes in gait parameters for individual limbs are predicted by changes in walking speed and body size”), “the gait parameters of individual limbs of pcd mice were, overall, quite different” and “although they were different from control mice, individual limb parameters for pcd were comparable to the values for control mice of similar body size walking at similar speeds”. Also in the subsection “A quantitative framework for locomotor coordination reveals fundamental features of mouse gait ataxia” we emphasize that “observed differences in traditional gait parameters were a secondary consequence of differences in body size and walking speed”; there are real differences in individual limb movements in pcd. However, the thick lines in Figure 3B-D are model predictions, not fits to the data and so the differences in those graphs the reviewer points out, while real, actually do not reflect ataxia. To make this point more clear we have added a new Figure 3–figure supplement 1 which directly compares pcd and size-matched controls and the statistics are provided in panel E (none are significant).

The only panel in Figure 3 where we claim that pcd and controls are the same is the forward paw trajectories shown in Figure 3E. There are differences between control and pcd in Figure 3F-H – these are the off-axis movements and joint angles and we fully agree that these reflect ataxia, which is why we refer specifically to “forward” or “on-axis” trajectories vs. “3D” or “off-axis” trajectories throughout the Results and Discussion. To make this point more clear and separate the results from the forward paw motion results, we have added an additional heading “Single-limb deficits in pcd are restricted to off-axis paw trajectories and joint angles” to the relevant section of the Results.

3) A main conclusion is that the interlimb coordination changes from wild-type to pcd mice. More specifically from a trot to a walk pattern. Walking and trotting patterns have been described for tetrapods to be distinct gaits by many different studies. They are visible at different speeds of locomotion. In your experiments wild-type mice exhibited trot as unique gait used at all speeds, even at the lowest ones when the speed is below 0.2 m/s and the support limbs are three or four (Figure 4C and 4D). In contrast the pcd mutant mice exhibit only walk, reaching a maximum speed of 0.25 m/s. What is odd about this difference is that walk is clearly found in wild-type mice by all others than these investigators. I believe that it is present even in the present study but that it has been missed (how can you have trot with 3 or 4 limb on the ground?).

We recognize that it is traditional to conceptualize interlimb coordination in terms of gait categories, and we have changed our treatment of this topic in the text to be more clear and to emphasize what we are, and what we are not, trying to claim. However, our perspective differs meaningfully from the reviewer’s on this point. We actually spent quite a long time wrestling with this data and trying to analyze it in terms of categorical gait patterns such as trot and walk (not to mention cruciate vs. alternate patterns a la Cheng et al. 1997 in the rat), but it didn’t work, and we think these plots of stance phase density as a function of walking speed give a sense of why (Figure 4–figure supplement 1C).

On the left, the stance phases of all of the strides of size-matched controls are shown in a density plot – values around 0 on the y-axis would be a trot, while values above the x-axis would be a walk. Stride count density is color-coded. The first thing that pops out from this analysis is that there is no category boundary between a walk and a trot in mice – the data vary continuously along the x and y axes. We realize that this is different from the case in many tetrapods, and even in flies (Mendes et al, eLife 2013) – but this is the data. We agree with the reviewer that mice are more likely to “walk” at lower speeds, but without a category boundary between walking and trotting, we find that analyzing phase values is the only appropriate quantitative way to deal with this data – how far from zero would the phase value need to be for us to call it a walk? How close to zero to call it a trot?

We have reworded our language in the paper about wildtype mice to de-emphasize the trot and instead focus on diagonal alternation patterns. We have also included the density plots above (as well as similar L-R phase analysis).

So with this as the background (and we have altered the text and include this figure in the paper), we clarify: we are not trying to overturn existing data or claim categorically that wildtype mice don’t walk – but what is clear is that pcd mice don’t trot, even when they do locomote at higher speeds.

Further, to answer the question of “how you can have a trot with more than 2 paws on the ground?”, as the reviewer surely knows, and according to the terminology of Hildebrand (1989), this depends on the duty cycle and the stance to swing transitions (see Hildebrand plot and stance-to-swing phasing above in response to Reviewer 2). Diagonal pairs can still enter stance simultaneously with either a running trot or a walking trot, and in both cases, the primary support pattern will be 2-paw diagonal. What will change will be whether there is some 0-1 or some 3-4 paw support at the transition points. Our new supplemental figure addresses this directly.

Since the pcd mice locomote slower than the wild-type mice the change in coordination could simply be caused by a change in gait patterns that is speed dependent.

Actually, no, it can’t. This is very important – all of the analyses comparing coordination in pcd vs. control were both size- and speed-matched. And, as we pointed out above, the tail oscillation in pcd is successfully modeled as a passive consequence of the forward motion of the hind limbs only, which does not change in pcd. Also, we show in the interlimb coordination figure that hind limb double support ratios do not change in pcd. We have clarified this in the subsection “Whole-body coordination deficits in pcd”.

It is known for many animal models (mouse as well) that the inter-limb and whole body coordination change when the animal uses different gaits. At the mechanical level different models have been used to explain the different body coordination of walking and trotting gaits (Mechanical work in terrestrial locomotion: two basic mechanisms for minimizing energy expenditure, Cavagna et al., 1977, American Journal of Physiology). Thus, most of the differences you describe between wild-type and mutant mice could be due just to the comparison of mice using two different gaits that clearly rely on different inter-limb and whole body coordination (e.g. Figure 4A, 4C, 6A and 6B). Indeed you have clear indications that walk is also expressed in wild-type mice at low speed (Figure 4A and 4C). The data should be reanalyzed to address this issue. I am convinced that if the data are reanalysed, walk will show up in wild-type mice as well. This will dramatically change the conclusion of the story.

The fact that walk does show up in wildtype mice (explained above, and as the reviewer points out you could already see this from our Figure 4A) absolutely does not change the conclusions of our paper. All coordination analyses were size- and speed-matched. Moreover, although there are no categorical gait transitions, the coordination results hold across speeds, regardless of whether wild-type gait patterns are more walk-like or more trot-like.

4) The discussion about the superiority of the present method to others needs to be toned down. The general statement that the automated analysis described in the study provides a robust way for locomotor analysis avoiding "false positive findings that permeate the mouse locomotor literature" is not true and likely to offend the locomotor field at large.

We sincerely apologize for any offense (which was certainly not intended) and have completely changed our language on this point (see also response to point #4 of Reviewer 2, above). However we also hope that our clarifications about the content of Figures 2 and 3 have helped the reviewer understand what we meant by “false positives” – the gait parameters are different in pcd, but these differences are accounted for by walking speed and body size and therefore do not reflect ataxia per se.

I strongly recommend that the authors consider gaits (walk, trot, gallop and bound) in their analysis. Since you have done an incredible work using size-matched controls, it will be helpful if the difference between wild-type and pcd mutant mice account just for the degeneration of the Purkinje cells and not for errors due to a comparison between mice using two different gaits.

We wrote our response to Major Comment #3, above, before the recent paper by Bellardita and Kiehn (in press), came out. We now also refer directly to the new paper in our Results section (in the subsection “Front-hind Interlimb coordination is specifically impaired in pcd”):

“In our experiments, wildtype mice walked in a symmetrical trot pattern across speeds – each diagonal pair of limbs moved together and alternated with the other pair (Figure 4A, left). […] This increased instability indicates that pcd mice are not simply switching to a more stable gait pattern, but rather, are unable to properly time their front-hind limb movements to generate a stable, efficient gait.”

5) To my knowledge pcd mice showed not only a degeneration of the Purkinje cells but also the slower degeneration of the photoreceptor cells of the retina and mitral cells of the olfactory bulb. Since you have used animals between 41 and 154 days old, could it be that a shorter range of speed is the result of a disorganization of the visual system and not only due to an impairment of the neural control of the locomotion? They walk slower because they are half blind?

Please see our response (including the new Figure 5–figure supplement 2) to a similar point raised in point #1 of Reviewer 2, above. The new figure shows that results hold in pcd mice less than 50 days old, before extracerebellar degeneration. Also, separately, we have measured locomotion in blind mice and we do not see the alterations reported here, and we note that even if they did walk more slowly for this reason, our analyses were all speed matched so this alone could not account for our findings.

[Editors’ note: the author responses to the re-review follow.]

The reviewers have discussed the reviews with one another and the Reviewing editor has drafted this decision to help you prepare a revised submission.

The reviewers all appreciated the fact that the novel LocoMouse tool permits automated analysis with high resolution of locomotion of freely walking mice, and they judged that this method has the potential to be of value to the field. They provide a number of comments for strengthening the manuscript, which are included below. These comments center on the being more explicit about the limits of the work, its interpretation (especially regarding the mutants), and comparison to other studies; providing more information about certain analyses; and addressing some points for clarity of presentation and communication. Specifically:

1) Toning down the claims about the superiority and power of the new method, perhaps providing a more explicit comparison to commercial packages;

2) Toning down the claims about providing direct evidence for forward models, perhaps simply by shifting these ideas to the Discussion;

3) Limiting the claims about changes and the lack of changes in the mutant, perhaps by focusing on the idea that one kinematic measure was preserved while others (interlimb and intralimb) were not.

4) Providing a better description of the construction of the passive model, and (if feasible) providing a physical model (or explaining why this was not done);

5) Addressing the point either experimentally or with clarification of the (apparently) very low N (=3) for the pcd mice;

6) Improving presentation of the results/figures/sequence of calling figures, as indicated in the reviews.

We sincerely thank the reviewers and editors for their thoughtful and constructive comments on our manuscript. We address each of these six points and our corresponding revisions in detail below, in response to the specific concerns raised by the reviewers.

Reviewer #1:

1) The authors emphasize in several places that 'traditional' measures of kinematics are unimpaired in mutants. I found this to be overly-simplistic, at least based on the results presented here. As I understand it, the main consistency is in the x-axis forward paw motion, while there are changes in vertical and mediolateral paw motion and in joint angles. Changes in vertical paw trajectory and joint angles are hardly 'non-traditional', 'complex', or even '3D' and all measures are definitely 'individual-limb'. This point is made several times in the text (see points below) and seems unwarranted. I'm not saying the results aren't interesting, nor do I think that these conclusions are necessary for the impact of the paper – I just don't think that this conclusion as stated is supported.

We apologize for not being more clear. We do not intend to claim that individual limb movements are intact in pcd mutants (they clearly are not). The reviewer is correct that we were trying to emphasize the preservation of forward motion of the paws. Our use of the subjective term “traditional” was misleading and we have removed it. We were using “traditional” to refer to stance-based analyses from paw print analyses and popular commercial systems for mouse locomotion such as CatWalk. However, clearly joint measurements and vertical trajectories (both affected in pcd) are traditional measures for ataxia in other species. We have clarified our terminology throughout the text to reflect more accurately our intended meaning, which is that the parameters that are usually reported as evidence for gait ataxia in mice were only different in pcd in ways that had nothing to do with ataxia (because they were associated with changes in body size and walking speed). Specifically, we now refer to the parameters depicted in Figure 2 as “basic stride parameters” rather than “traditional gait parameters”, because not only was the use of “traditional” problematic, but there is a critical distinction between the effects of ataxia on strides (Figures. 2 and 3) and gait (which also includes the interlimb and whole-body coordination shown in Figures 4-7, for example). When we refer to both the stride parameters from Figure 2 and the forward trajectories of the paws shown in Figure 3E (such as in the Abstract) we have replaced “traditional, individual-limb parameters” with “forward motion of individual paws.”

2) On a similar point, it's not clear to me that any of their measures are really looking at within-limb coordination, at least as this is usually considered. Most of the measures relate to paw movement, whereas traditionally issues of coordination (e.g. in studies examining the role of the cerebellum, as cited in the paper) consider interactions between joints. Yet these analyses really aren't done here. They show that joint angles are apparently different in the animals, but these are for single joints as opposed to joint angle relationships (and what those angles are is unclear, see below). I don't think that the results shown here rule out a possible deficit in traditional, within-limb coordination. I think this is mainly an issue of presentation, however, rather than one of substance. As stated above, I don't think the impact of the paper relies on this conclusion and it could be made more precise without loss of significance.

Indeed, this was also an issue of clarity on our part – we do not intend to rule out intralimb coordination deficits in pcd. In fact we think the altered y and z trajectories and restricted joint angles do represent deficits in within-limb coordination. The changes in language described in response to point 1, above, should help clarify this.

3) I potentially like the analysis of nose and tail passive movements very much, but I did have a few issues with it. First, although the results are consistent with a role of the cerebellum in predictive control based on forward models, they're not really a direct demonstration thereof. A more direct demonstration might involve examining adaptations to perturbations, e.g. adding a weight to the tail and seeing that initially control animals look like mutants but then learn to predict and compensate for this, whereas mutants never do so. Also, could the results simply be interpreted as one of a limited capacity for motor control? e.g. mutants have limited capacity for producing locomotion and expend most of it on x-axis movement of the paw since it's critical for task performance, whereas other aspects of behavior are allowed to vary? I appreciate the authors are careful on this point to say that the results are 'consistent' with this idea, but alternative explanations might be considered more directly.

We have toned down and revised the forward model interpretation in response to this and other comments from the reviewers. To address the reviewer’s point directly, we don’t think the alternative of a limited capacity for motor control in pcd can fully explain our data. First, there is generally not an increase in variability in pcd. Second, although it could explain why the tail/nose movements are larger in pcd, we don’t see how it could explain the systematic shift from phase locking/leading in control animals to phase lags (that are consistent with time-delayed movements) in pcd, a phenomenon that we observed not just in the nose/tail movements but also in the patterns of interlimb coordination.

4) For the nose/tail passive analysis, I originally thought that this was an actual physical model, rather than the geometric model used here. It seems clear that a physical model is the better way to do this. Why wasn't it done? The geometric model, with its assumptions of lags taken from data which is actually observed, seems more indirect and therefore less compelling.

Our intuition was initially the same as the reviewer’s and we actually began by constructing a physical model. However, the physical modeling required us to make multiple assumptions about the biomechanics of the tail, and we wanted to avoid simply tweaking parameters to achieve a model that would fit the data. We therefore decided to ask whether a very simple geometric model with as few assumptions as possible might do just as well. The passive geometrical model had just two assumptions. First, that passive nose and tail movements would result directly from orthogonal coupling to the forward oscillations of the hind paws – this was the key insight. Second, that these movements would occur time-delayed relative to the hind paw oscillation (and that the time delays would be longest for the mouse’s rump and become progressively smaller for each more distal segment, due to decreasing mass). It is readily apparent from the data (Figure 5D-F, Figure 5–figure supplement 1H) that the assumption of time-delayed movements only holds true for pcd mice, and not controls. However the correspondence between the passive model predictions and the nose and tail movements of pcd mice was also striking at the level of the waveforms themselves (Figure 5, A, B). We were surprised at how well this simple model fit the pcd data and found the simplicity of this approach to be quite powerful. However given that biomechanics can be counterintuitive we have also implemented a simplified, 3-segment physical model of the tail as a proof of principle. In Author response image 3 we show the results of this physical model, which are in general agreement with those of the geometrical model.

Author response image 3
Physical model.

The physical model of the tail consists of three masses 1, 2 and 3 (the later being the most distal) connected via an angualar spring-damper system. The masses of each segment were estimated from measurements of a real mouse tail (10g, 0.6g, 0.001g for segments 1, 2 and 3 respectively). The springs and dampers were estimated manually (k1=13e-6 Nm/deg, c1=0.95e-6 Nms/deg, k2=5e-6 Nm/deg, c2=0.7e-6 Nms/deg and k3=20e-6 Nm/deg, c3=0.2e-6 Nms/deg). The model was implemented and tested in SimMechanics MATLAB 2015a. (A) The phases of segments 1, 2 and 3 in the model (lines) superimposed over segments of 18 and 15 of the pcd tail. (B) Trajectories of tail segment 8 for controls (black), and pcd (purple), and tail segment 2 for the physical model.

https://doi.org/10.7554/eLife.07892.025

Finally, as I understand it (and I might have missed it), this analysis was only done for the mutants. It would be very good to have done the same analysis for the control animals and show that the tail/nose movements are inconsistent with passive movement. E.g. it could have been that the movement of the pelvic girdle was different in controls, leading to less tail movement (even though the hindlimbs are in alternation for both controls and mutants).

This is an important point and we were not as clear about it as we should have been. We have revised the Materials and methods section and now provide more detail about the geometric model. The stride parameters were taken from the statistical stride models in Figure 2, for a small mouse (15g). Because these stride parameters were indistinguishable between pcd and small controls, the key point here is that the passive geometric model is not a model for either the mutants or the controls. The model traces in Figure 5A, B, F are based on stride data that did not vary by genotype, plus the fixed time delays. The model fits the pcd data better than control data because only the pcd tail/nose moved time-delayed and directly orthogonally-coupled to the hind paws. Also note that in terms of differences in pelvic girdle between the two mice, the only factor that could influence the amplitude of tail movement in our model would be the wider base of support in pcd (Figure 3F) – which would actually predict that pcd mice would exhibit smaller amplitude tail oscillations than controls (because of smaller angular excursion of the hind paw axis). Further, this would not account for any differences in phasing between the two groups of mice.

Reviewer #2:

The paper by Machado et al. examines gait patterns in wildtype and Purkinje cell degeneration (pcd) mice using a novel system for tracking locomotor kinematics in freely walking mice. The authors conclude that the individual limb kinematics of pcd mice are normal when the weight and the walking speed of the mice are taken into account. In contrast, pcd mice have impaired coordination of movements across joints, limbs and body. These results are interpreted as evidence that the cerebellum provides a forward model. This is a strong paper. I commend the authors for wrestling with a complex dataset and extracting from it a number of thought-provoking findings. I personally found many of the results exciting, but I must admit that I'm not an expert in the field of locomotion or ataxia. It was not always clear if a particular result in the paper was a major advance or just confirmation of something we already knew. For this reason, I think that it's important for the authors to clarify and emphasize the significance of their results throughout the text. I've given two examples below:

Thank you. We have rewritten several sections to be more explicit about the specific findings of previous studies and to provide context for our results (see specific instances below).

1) It is remarkable that in wildtype mice, one can account for upwards of 80% of the variance in kinematic parameters like stride length, swing velocity and cadence, simply by taking into account the walking speed and the weight of the mouse. Is this a new approach? In their rebuttal, the authors mention that the Cendelin et al. (2010) paper found that all the gait differences between lurcher and control mice disappeared when they corrected for walking speed. Did Cendelin et al. make the correction using a similar modeling approach?

No, they did not. Cendelin et al. (2010) used the CatWalk system to measure stride parameters in visibly ataxic lurcher mice and found while they were different in lurchers and controls overall, the values for the fastest lurcher trials and the slowest control trials were comparable. They did not deal with body weight and they used speed grouping rather than statistical modeling to identify speed effects. They hypothesized that CatWalk analysis was not able to detect gait ataxia because it resulted from “titubations, pro-, retro- and latero-pulsions” not captured by CatWalk, while “the coordination of limb movements is affected minimally” in ataxia. Our finding that the differences in stride parameters in pcd can be accounted for by changes in walking speed and body size is consistent with their results. We extend this finding by providing quantitative predictions for these stride parameters across mice and trials, incorporating body weight, and analyzing swing kinematics, interlimb coordination, and head and tail movements to identify which of these features truly represent ataxia vs. changes in walking speed and body size. In the end we reach conclusions that differ from their predictions regarding the nature of ataxia, but their study and their statement, “The fact that almost all differences in gait parameters are markedly dependent on walking speed seems surprising because the difference between a walking Lurcher mutant and a wild type mouse is clearly visible with the naked eye”, provided a major motivation for our study – to see if we could quantitatively capture the fundamental features of ataxia in freely walking mice.

Batka et al. (2014) used a mixed-effects modeling approach to analyze the relationship between stride parameters and walking speed, but did not assess the other possible factors of body size, gender, age, etc., nor did they consider ataxia. Also to our knowledge no one has presented predictive models for stride parameters as we do here and we think this, together with the large dataset we provide, is a useful resource for future mouse locomotion studies.

We have revised several sections of the manuscript (notably the rewritten Introduction) to put our findings more explicitly within the context of these two important previous studies.

2) One of the main findings is that individual limb movements of pcd mice are relatively spared (when weight and walking speed are taken into account), whereas interlimb coordination is impaired. It is not clear how much of this we already knew. For example, in the subsection “Front-hind Interlimb coordination is specifically impaired in pcd”, the authors mention that previous studies in ataxic mice have failed to detect any impairments in the kinematic parameters of individual limbs. Did those studies not examine interlimb coordination as well? If the authors are the first to show that mice with cerebellar deficits have a specific impairment in locomotor coordination but not in movement of individual limbs, this is a big deal.

Nearly all papers using overground locomotion to assess ataxia in mice have reported differences in paw stride parameters (which are real, but are artifacts of walking speed and body size) at face value. The reference was to the Cendelin et al. (2010) paper just described, which is unusual in its consideration of walking speed. Other papers have shown deficits in both stride parameters of individual limbs and interlimb coordination in ataxic mutants (e.g. Vinueza-Veloz 2014). To our knowledge we are the first to isolate impairments in coordination (across joints, limbs, and body) from the non-specific changes in stride parameters and forward motion of the paws.

Additional recommendations to help make an already strong paper even stronger:

3) Drop the emphasis on forward models. The authors argue that the deficits they've uncovered point to a lack of a forward model in pcd mice. Although I found some of the evidence presented intriguing (for example the analysis of tail movements), it is far from conclusive. Furthermore, it is difficult to reconcile the normal individual limb kinematics with a faulty forward model – individual limbs are controlled by multiple agonist/antagonist muscles whose coordination requires well-calibrated forward models. I think the authors can still interpret their results in the context of forward/inverse models, but I strongly recommend that they save this interpretation for the Discussion, tone it down a bit and address the limitations. The paper would be stronger if the second paragraph of the Introduction is rewritten to highlight the main questions to be addressed in the paper, instead of offering to resolve controversies about forward vs inverse cerebellar models.

We have moved the treatment of internal models to the Discussion, edited it (both toning down and shortening), and rewritten the second paragraph of the Introduction as requested.

4) Analysis of variability: All the analyses are based on average data. For example, Figure 3B-E shows that there is no difference in the individual limb kinematics of pcd mice and sized-matched controls. But this is done only for the average kinematic values. Is it not possible that pcd mice might show increased trial-to-trial variability in their movements relative to sized-matched controls? How would such a finding change the authors' conclusions?

We, like the reviewer, fully expected to observe increased variability in pcd. However, aside from the increased variability in hind paw placement that we reported in Figure 4G, we actually found that the movements of pcd mice were either equally, or in several cases, even less variable than controls. To be honest we didn’t know what to make of this finding, and didn’t want to make strong claims about a surprising lack of variability. However leaving it out was probably not the best choice either, and so we have now included the other variability analyses (including those corresponding to Figure 3B-E) in the text of the paper. (Also note that the density plots, now in Figure 4–figure supplement 1, do show the full range of data for limb phasing.)

Reviewer #3:

The authors developed a machine learning algorithm to track the individual limbs as well as the nose and tail of mice in 3D during natural, voluntary locomotion. They provide a very detailed analysis of locomotion parameters in control and ataxic Purkinje cell degeneration (pcd) mice, revealing that individual limb kinematics in pcd mice are not different from control mice when accounting for the mouse's weight and speed, but that pcd mice present multi-joint and inter-limb-coordination deficits. The study has been carefully conducted and provides new and useful tools for measuring and analyzing specific features of locomotion and ataxia with unprecedented accuracy.

Thank you.

1) The construction of the "passive model" (Figure 5) is unclear. For example, does this model take into account the mass of the tail? Please describe in more detail how the passive prediction is calculated.

We rewrote the Materials and methods paragraph describing the model. Please also see the responses to Reviewer 1 point 4, above.

2) The authors contrast the forward model with an inverse kinematic model in the Introduction. What do they think the inverse kinematic model would predict and how does this contrast with their findings?

We expected that a failure of an inverse kinematic model would cause changes in forward paw trajectories, which were surprisingly intact in pcd (Figure 3E). We have now de-emphasized the internal model interpretation in part by moving it to the Discussion as suggested above.

[Editors' note: further revisions were requested prior to acceptance, as described below.]

There are only a few remaining issues that need to be addressed before acceptance, as outlined below:

In particular, the manual joint-angle analysis shown in Figure 3H seems limited by the single animal in each condition, and discussion among reviewers and editors led to the consensus that it could simply be dropped without major impact on the manuscript. We therefore recommend cutting this one measurement and illustration. Alternatively, if there is some reason why a single animal in each category is of value, please justify the experiment clearly. This point is explained further below.

We have removed the joint angle analysis from the paper.

In the subsection “Individual limb parameters”: This description makes it seem like one pcd animal and one control were used for this analysis. If so, this seems very questionable and underpowered. I'd be willing to bet that, with enough n, it would be possible to find a significant difference between two different weight matched controls. I'm not sure how the stats behave in this situation, but it's not clear to me how mixed models would be able to partition variance due to random effects (individual subjects) from the fixed effects (mutation) if there were only one animal in each group. It seems that for other comparisons with weight matched controls much larger N's are used, whereas this analysis is limited because of the need to hand mark frames. It might be easiest to simply drop this joint angle analysis – I don't think its omission would change the impact of the paper. Also, shouldn't it be 'knee, heel, toe’? And here it's stated that the angle of the foot and arm relative to the ground are quantified – I might have missed it, but I wasn't sure where that was reported in the Results.

We have removed the joint angle analysis from the paper.

https://doi.org/10.7554/eLife.07892.022

Article and author information

Author details

  1. Ana S Machado

    Champalimaud Neuroscience Programme, Champalimaud Centre for the Unknown, Champalimaud Foundation, Lisbon, Portugal
    Contribution
    ASM, Conception and design, Acquisition of data, Analysis and interpretation of data, Drafting or revising the article
    Contributed equally with
    Dana M Darmohray
    Competing interests
    The authors declare that no competing interests exist.
  2. Dana M Darmohray

    Champalimaud Neuroscience Programme, Champalimaud Centre for the Unknown, Champalimaud Foundation, Lisbon, Portugal
    Contribution
    DMD, Conception and design, Analysis and interpretation of data, Drafting or revising the article
    Contributed equally with
    Ana S Machado
    Competing interests
    The authors declare that no competing interests exist.
  3. João Fayad

    Champalimaud Neuroscience Programme, Champalimaud Centre for the Unknown, Champalimaud Foundation, Lisbon, Portugal
    Contribution
    JF, Developed tracking algorithm, Conception and design, Analysis and interpretation of data, Drafting or revising the article
    Competing interests
    The authors declare that no competing interests exist.
  4. Hugo G Marques

    Champalimaud Neuroscience Programme, Champalimaud Centre for the Unknown, Champalimaud Foundation, Lisbon, Portugal
    Contribution
    HGM, Analysis and interpretation of data, Drafting or revising the article
    Competing interests
    The authors declare that no competing interests exist.
  5. Megan R Carey

    Champalimaud Neuroscience Programme, Champalimaud Centre for the Unknown, Champalimaud Foundation, Lisbon, Portugal
    Contribution
    MRC, Conception and design, Analysis and interpretation of data, Drafting or revising the article
    For correspondence
    megan.carey@neuro.fchampalimaud.org
    Competing interests
    The authors declare that no competing interests exist.
    ORCID icon "This ORCID iD identifies the author of this article:" 0000-0002-4499-1657

Funding

European Research Council (ERC) (Starting Grant)

  • Megan R Carey

Howard Hughes Medical Institute (HHMI) (International Early Career Scientist)

  • Megan R Carey

Fundação para a Ciência e a Tecnologia (FCT) (Graduate Student Fellowship)

  • Dana M Darmohray
  • Ana S Machado

The funders had no role in study design, data collection and interpretation, or the decision to submit the work for publication.

Acknowledgements

We thank Carla Matos for her valuable contributions to the early phases of this project, visiting students J Pascoal, V Jayaram, and I Prata for technical assistance, and S Lisberger, S Sober, and members of the Carey lab and the Champalimaud Neuroscience Program for useful discussion and comments on a previous version of the manuscript. This work was supported by an International Early Career Scientist grant from the Howard Hughes Medical Institute, a Starting Grant from the European Research Council (both to MRC), and predoctoral fellowships from the Portuguese Foundation for Science and Technology to ASM and DMD.

Ethics

Animal experimentation: All procedures were reviewed and performed in accordance with the Champalimaud Centre for the Unknown Ethics Committee guidelines, and approved by the Portuguese Direcção Geral de Veterinária (Ref. No. 0421/000/000/2015).

Reviewing Editor

  1. Indira M Raman, Northwestern University, United States

Publication history

  1. Received: April 2, 2015
  2. Accepted: October 2, 2015
  3. Accepted Manuscript published: October 3, 2015 (version 1)
  4. Version of Record published: November 10, 2015 (version 2)

Copyright

© 2015, Machado et al.

This article is distributed under the terms of the Creative Commons Attribution License, which permits unrestricted use and redistribution provided that the original author and source are credited.

Metrics

  • 9,470
    Page views
  • 1,388
    Downloads
  • 97
    Citations

Article citation count generated by polling the highest count across the following sources: Scopus, Crossref, PubMed Central.

Download links

A two-part list of links to download the article, or parts of the article, in various formats.

Downloads (link to download the article as PDF)

Open citations (links to open the citations from this article in various online reference manager services)

Cite this article (links to download the citations from this article in formats compatible with various reference manager tools)

  1. Ana S Machado
  2. Dana M Darmohray
  3. João Fayad
  4. Hugo G Marques
  5. Megan R Carey
(2015)
A quantitative framework for whole-body coordination reveals specific deficits in freely walking ataxic mice
eLife 4:e07892.
https://doi.org/10.7554/eLife.07892

Further reading

    1. Computational and Systems Biology
    2. Neuroscience
    George A Spirou, Matthew G Kersting ... Paul B Manis
    Research Article

    Globular bushy cells (GBCs) of the cochlear nucleus play central roles in the temporal processing of sound. Despite investigation over many decades, fundamental questions remain about their dendrite structure, afferent innervation, and integration of synaptic inputs. Here, we use volume electron microscopy (EM) of the mouse cochlear nucleus to construct synaptic maps that precisely specify convergence ratios and synaptic weights for auditory- nerve innervation and accurate surface areas of all postsynaptic compartments. Detailed biophysically-based compartmental models can help develop hypotheses regarding how GBCs integrate inputs to yield their recorded responses to sound. We established a pipeline to export a precise reconstruction of auditory nerve axons and their endbulb terminals together with high-resolution dendrite, soma, and axon reconstructions into biophysically-detailed compartmental models that could be activated by a standard cochlear transduction model. With these constraints, the models predict auditory nerve input profiles whereby all endbulbs onto a GBC are subthreshold (coincidence detection mode), or one or two inputs are suprathreshold (mixed mode). The models also predict the relative importance of dendrite geometry, soma size, and axon initial segment length in setting action potential threshold and generating heterogeneity in sound-evoked responses, and thereby propose mechanisms by which GBCs may homeostatically adjust their excitability. Volume EM also reveals new dendritic structures and dendrites that lack innervation. This framework defines a pathway from subcellular morphology to synaptic connectivity, and facilitates investigation into the roles of specific cellular features in sound encoding. We also clarify the need for new experimental measurements to provide missing cellular parameters, and predict responses to sound for further in vivo studies, thereby serving as a template for investigation of other neuron classes.

    1. Genetics and Genomics
    2. Neuroscience
    Carolyn Elya, Danylo Lavrentovich ... Benjamin de Bivort
    Research Article Updated

    For at least two centuries, scientists have been enthralled by the “zombie” behaviors induced by mind-controlling parasites. Despite this interest, the mechanistic bases of these uncanny processes have remained mostly a mystery. Here, we leverage the Entomophthora muscae-Drosophila melanogaster “zombie fly” system to reveal the mechanistic underpinnings of summit disease, a manipulated behavior evoked by many fungal parasites. Using a high-throughput approach to measure summiting, we discovered that summiting behavior is characterized by a burst of locomotion and requires the host circadian and neurosecretory systems, specifically DN1p circadian neurons, pars intercerebralis to corpora allata projecting (PI-CA) neurons and corpora allata (CA), the latter being solely responsible for juvenile hormone (JH) synthesis and release. Using a machine learning classifier to identify summiting animals in real time, we observed that PI-CA neurons and CA appeared intact in summiting animals, despite invasion of adjacent regions of the “zombie fly” brain by E. muscae cells and extensive host tissue damage in the body cavity. The blood-brain barrier of flies late in their infection was significantly permeabilized, suggesting that factors in the hemolymph may have greater access to the central nervous system during summiting. Metabolomic analysis of hemolymph from summiting flies revealed differential abundance of several compounds compared to non-summiting flies. Transfusing the hemolymph of summiting flies into non-summiting recipients induced a burst of locomotion, demonstrating that factor(s) in the hemolymph likely cause summiting behavior. Altogether, our work reveals a neuro-mechanistic model for summiting wherein fungal cells perturb the fly’s hemolymph, activating a neurohormonal pathway linking clock neurons to juvenile hormone production in the CA, ultimately inducing locomotor activity in their host.