CryoEM and computer simulations reveal a novel kinase conformational switch in bacterial chemotaxis signaling
- University of Illinois at Urbana-Champaign, United States
- University of Pittsburgh School of Medicine, United States
Figures
Figure 1
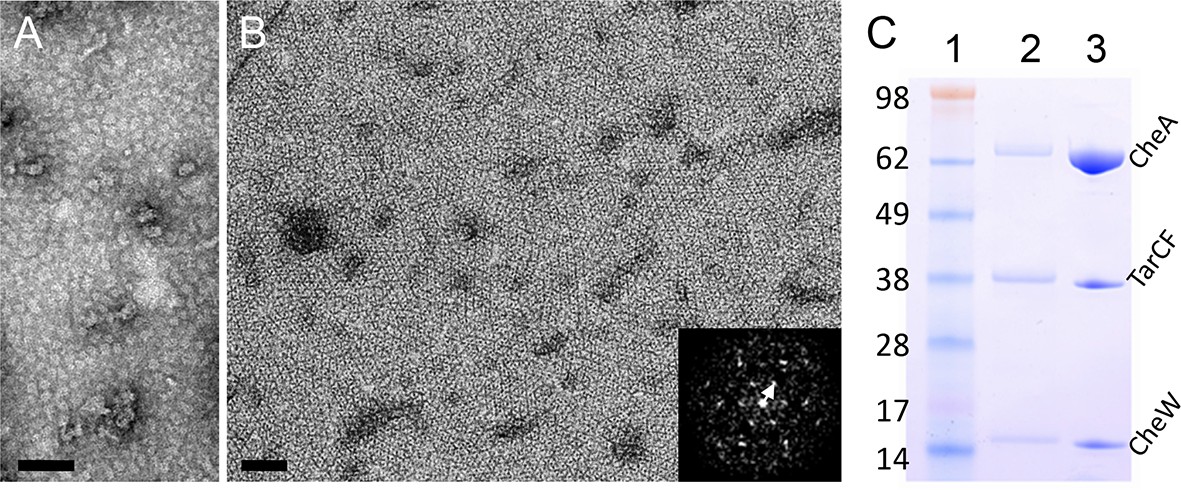
Reconstitution of 2D arrays of the receptor signaling complex on lipid monolayers.
(A&B) Negatively stained electron micrographs of reconstituted lipid monolayers with TarCF only (A) or with TarCF/CheA/CheW (B). Inset, Fourier transform of a region from the monolayer array, indicating a hexagonal lattice with a 12 nm repeat (white arrow). Scale bars, 100 nm. (C) SDS-PAGE gel analysis of the reconstituted monolayer sample (lane 2) and the protein solution (input mixture) used to generate the monolayer arrays (lane 3). Molecular weight markers are indicated (lane 1), and the input mixture contained TarCF:CheA:CheW in a ratio of 9:18:18 μM.
Figure 2 with 2 supplements

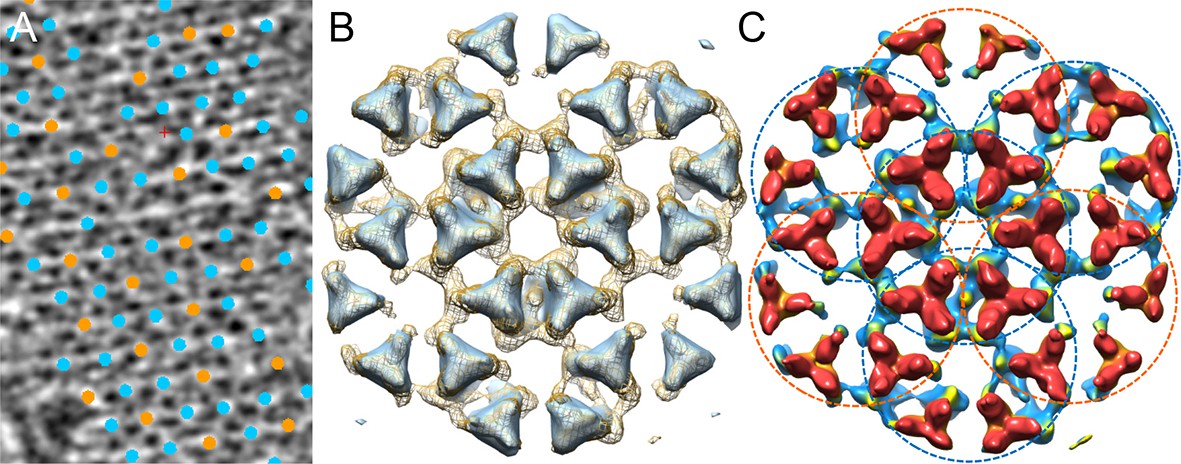
CryoET of monolayer arrays of TarCF/CheA/CheW ternary signaling complex.
(A) A tomographic slice (1.2 nm thick) through the reconstituted monolayer arrays of TarCF/CheA/CheW, without CTF correction. Inset, The Fourier transform of a selected region, displaying Thon rings with information extended to at least 22 Å resolution (arrow). (B&C) Averaged density maps of two sub-volume classes containing receptor hexagons (6 TODs) (red), one with a trimer of CheA dimers (CheA2-trimer) (B) and the other with a hexamer of CheA dimers (CheA2-hexamer) (C). Maps were generated following sub-tomogram volume classification and class-averaging, are contoured at 1.5σ, and are colored according to the height, from the receptor at the top (red) to CheA (blue) below. (D) Spatial arrangement of the CheA2-trimer (cyan) and CheA2-hexamer (orange) in the monolayer lattice array, after mapping the classified sub-volumes back onto the tomogram. The array is formed by interlocking CheA2-trimer and CheA2-hexamer subunits. (E) A schematic lattice model for the chemosensory arrays. Small circles represent receptor dimers; arrows represent CheA dimers (CheA2). Dashed cyan and orange circles highlight a CheA2-trimer and CheA2-hexamer respectively. The lattice unit cell is outlined in black. Related to Figure 2—figure supplement 1 and 2.
Figure 2—figure supplement 1
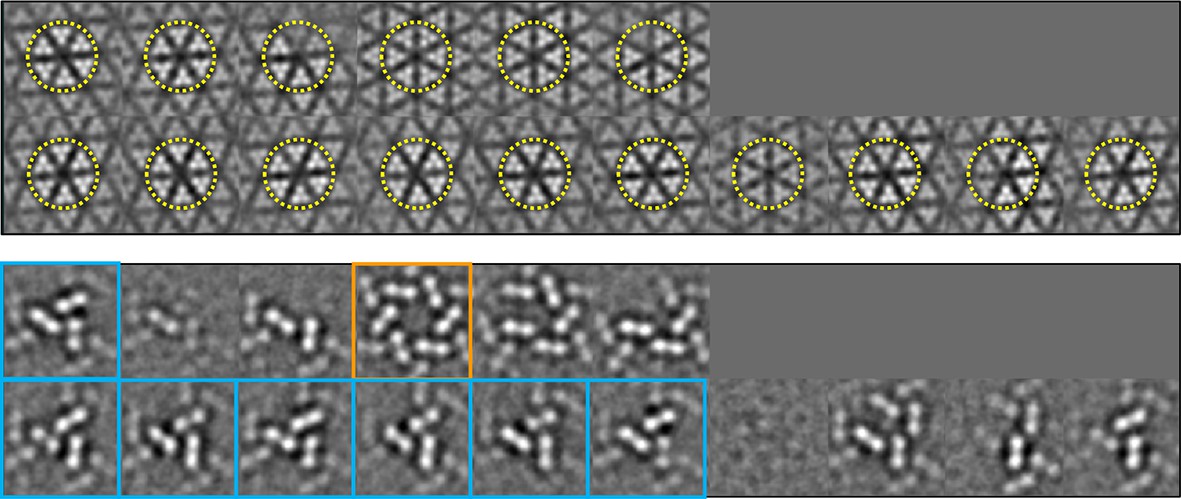
Classification of the sub-tomogram volumes.
The sub-tomograms containing the receptor hexagon (6 TODs, yellow circles) were subjected to alignment and classification. Sections of the sub-tomogram classes are shown at the receptor region (top row in each set) and the CheA region (bottom row in each set). Two major configurations emerged, one with a trimer of CheA dimers (CheA2-trimer, cyan boxes) and the other with a hexamer of CheA dimers (CheA2-hexamer, orange box). All the CheA2-trimer classes were combined for final refinement of the density map.
Figure 2—figure supplement 2
Comparison of the chemotaxis arrays from native cells and from in vitro reconstituted monolayers.
(A) A tomographic slice (5.2 nm thick) of the native chemotaxis arrays from wild-type E. coli cells, overlaid with the positions of each sub-tomogram classified as either the CheA2-trimer unit (cyan) or the CheA2-hexamer unit (orange). The lattice organization with interlocking CheA2-trimer and CheA2-hexamer is the same as the reconstituted arrays (see Figure 2A). (B) Sub-tomogram averaged density maps of the extended lattice (CheA2-trimer surrounded by six interlocking CheA2-hexamers) from native clusters (light blue surface rendering, contoured at 2σ), overlaid with the extended lattice from reconstituted monolayer arrays (mesh surface, contoured at 1.5σ). The two lattices match very well. (C) Surface rendering of the sub-tomogram averaged extended lattice map from reconstituted monolayer arrays at 18 Å resolution, showing the interlocking CheA2-trimer (cyan dashed circles) and CheA2-hexamer (orange dashed circles). The map is contoured at 1.5σ and colored according to the height, from receptor (red) to CheA (blue).
Figure 3 with 3 supplements
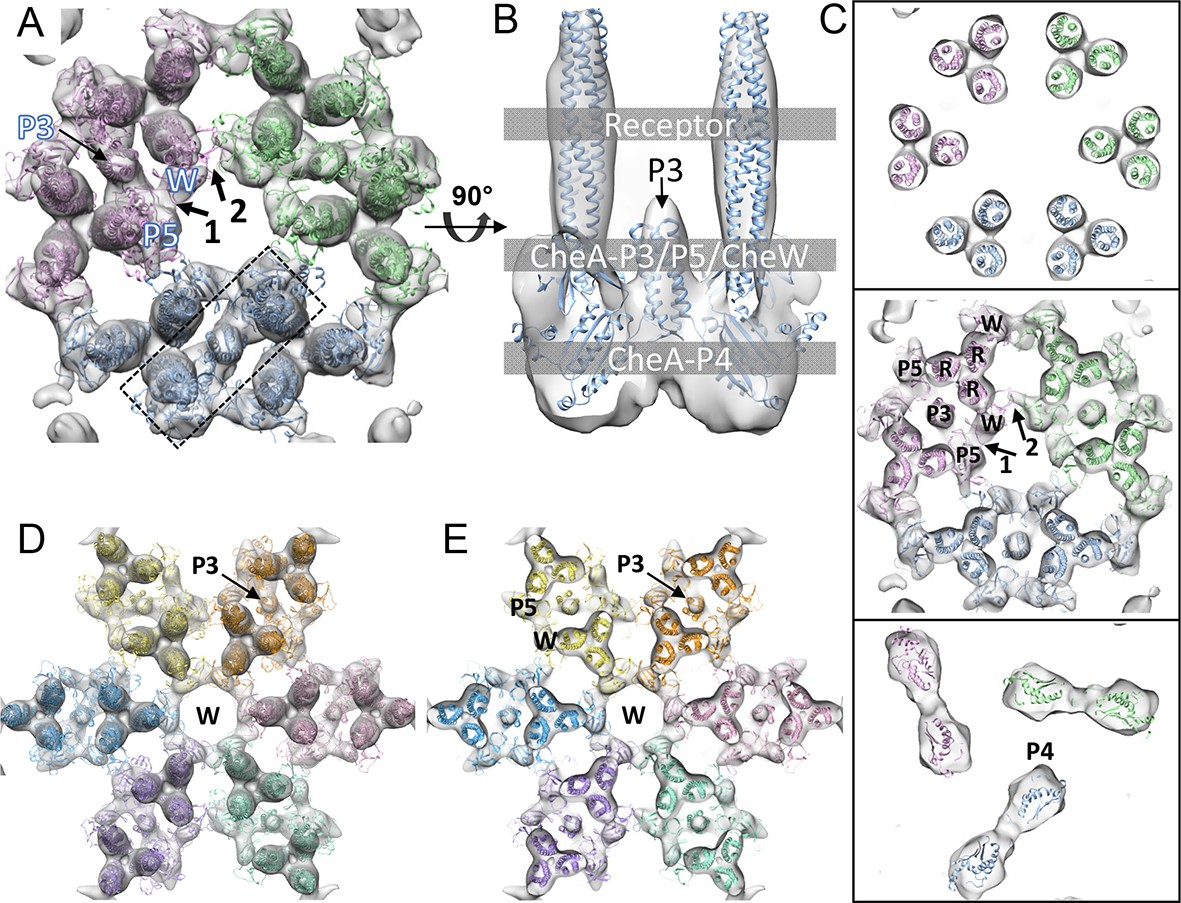
CheA2-trimer and CheA2-hexamer density maps with molecular dynamics flexible fitting (MDFF) of computationally constructed T. maritima subunit models.
(A) Overall fitting of the CheA2-trimer density map contoured at 1.5σ. The three core signaling complexes are colored in pink, blue and green. (B) A sectional view of the boxed region in A, rotated 90°. The protein components are labeled at the indicated height of the complex (gray boxes). (C) Sectional views of the gray-boxed regions in B at the receptor level (top), the CheA-P3 and P5/CheW ring region (middle), and CheA-P4 region (bottom). (D) Overall fitting of the CheA2-hexamer density map contoured at 1.5σ. (E) A sectional view at the CheA-P3 and CheW-ring region of the CheA2-hexamer density map. In (A-E), CheA-P3, P4, P5, CheW and receptor are labeled as P3, P4, P5, W and R, respectively, and the CheA-P5/CheW interfaces 1 and 2 are indicated. Related to Figure 3—figure supplement 1.
Figure 3—figure supplement 1
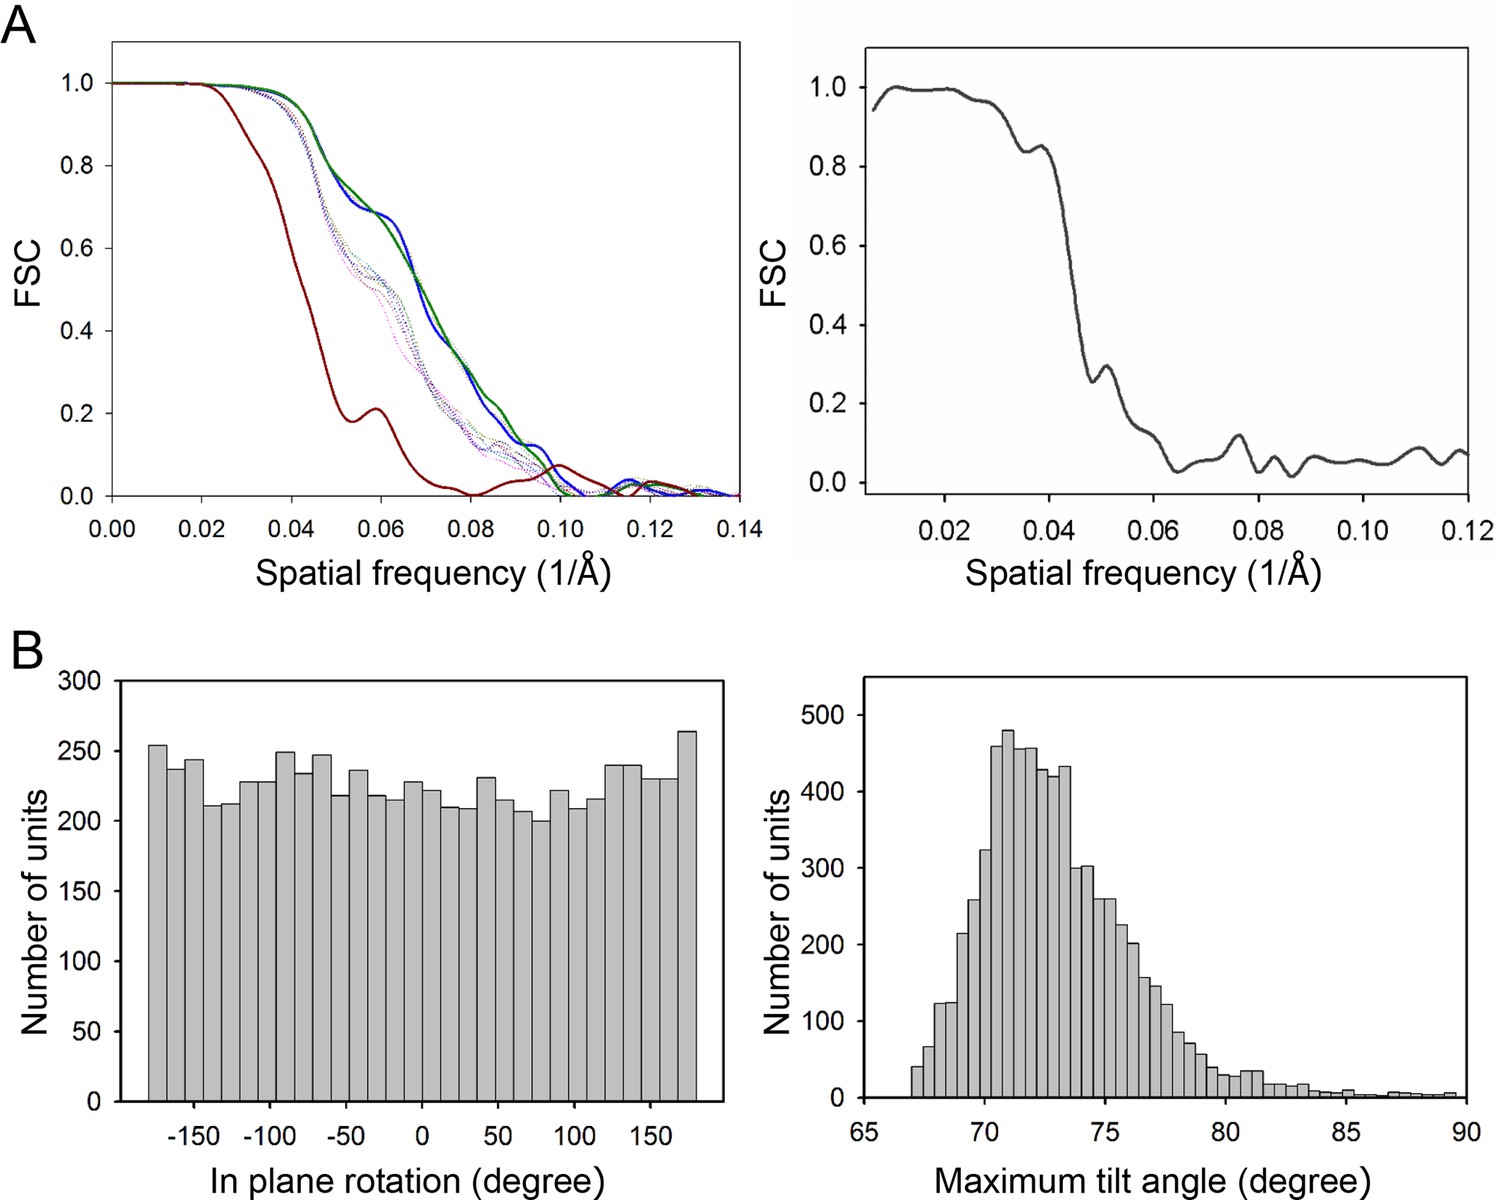
Resolutions of the density maps.
(A) Gold-standard Fourier shell correlation (FSC) of the CheA2-trimer (left) and CheA2-hexamer (right) density maps. At FSC=0.143, the overall resolution of the CheA2-trimer map is 11.3 Å and that of the CheA2-hexamer is 17.5 Å. The FSC curves for the conical Fourier shells along the X, Y, and Z directions are in solid green, blue and dark-red, respectively, and along the 10 other directions are in dotted lines. The CheA2-trimer map was calculated from two independent data sets of 3000 sub-volumes each, and the CheA2-hexamer was from two independent data sets of 300 sub-volumes each. (B) Angular distributions of contributing sub-tomograms for the in-plane rotation angle (left) and the maximum tilt angle relative to electron beam direction (right).
Figure 3—figure supplement 2

X-Z sectional views of the CheA2-trimer density map with MDFF model.
The positions of the sections are indicated in the last panel with an orthogonal view (X-Y plane).
Figure 3—figure supplement 3
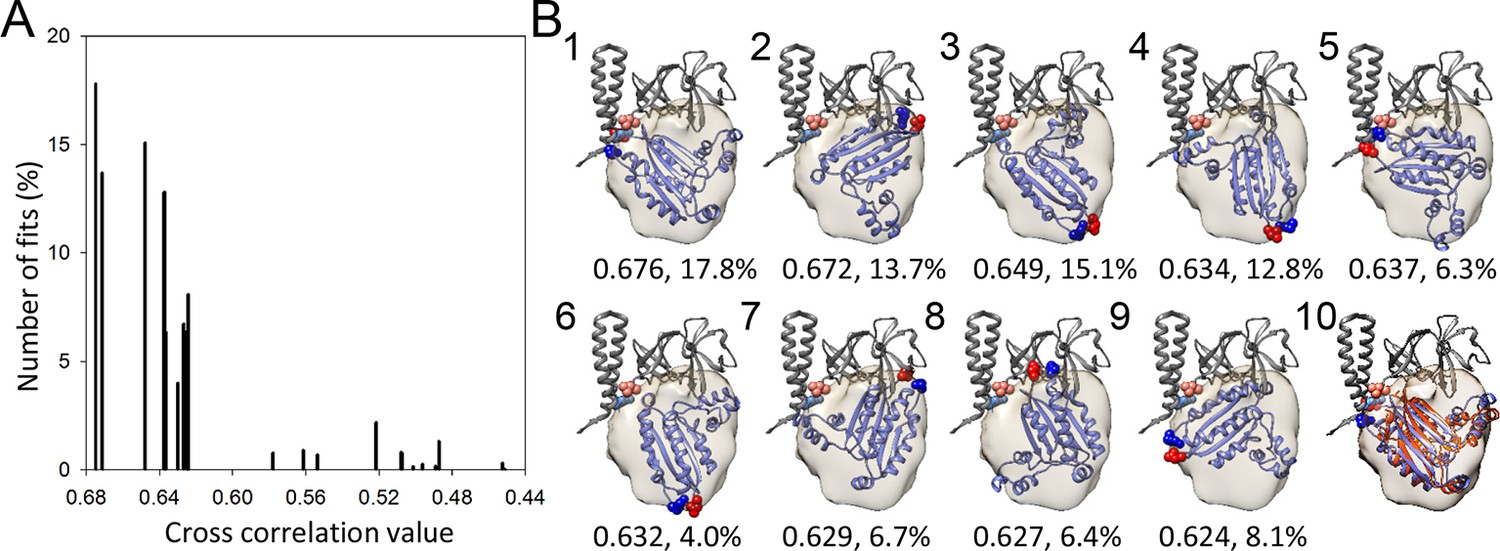
A metric for the goodness of fit for the docking of the CheA-P4 domain.
(A) Distribution of 23 classes of fits for the P4 domain starting from random orientations. (B) The models from the top 9 highest cross-correlation classes are shown in panels1-9, with the cross-correlation values and number of contributing fits (%) indicated below. These 9 classes constitute 90.1% of total fits. Panel 10 is an overlay of the #1 fit (blue) with the MDFF model (orange). The red and blue spheres indicate the N and C termini of P4, respectively. The corresponding connecting termini from P3 and P5 are in light blue and pink, respectively. P3 and P5 domains are in gray.
Figure 4 with 5 supplements
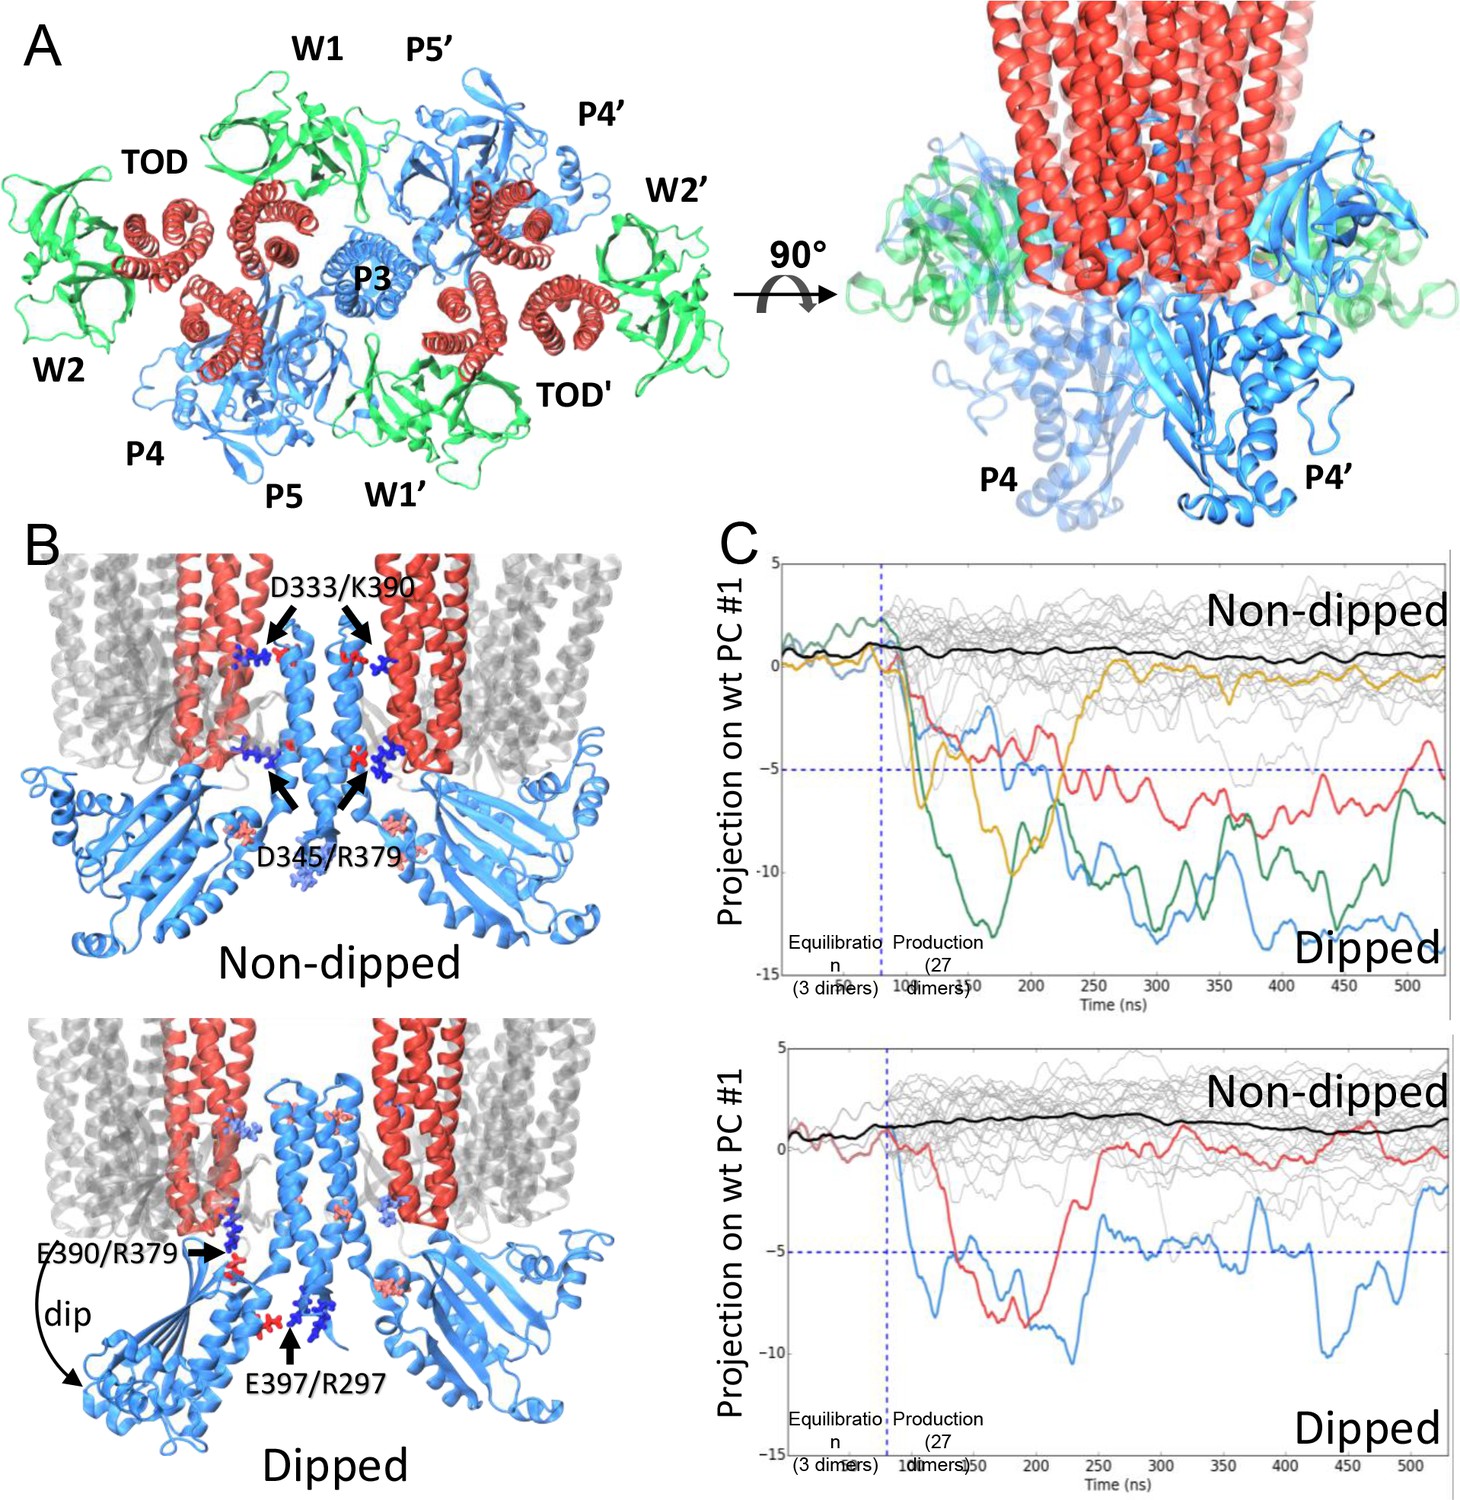
CheA dimer conformational switch.
(A) Top and side views of the core-signaling unit, consisting of two receptor TODs (red), a single CheA dimer (blue), and four CheW monomers (green). (B) Two distinct classes, undipped (top) and dipped (bottom), of core-signaling unit structures are present in our MD simulations. Classes differ especially in the orientation of CheA-P4 domain with respect to the rest of the CheA dimer and core signaling unit. Specific contacts that stabilize either conformation are indicated for T. maritima and in parentheses for the corresponding residues in E. coli. CheA-P5 and CheW have been removed for clarity. (C) Time series of CheA dimer conformations extracted from unit cell simulations.. Traces track the projection of the conformations of 27 CheA dimers from the wt (top) and R297A mutant (bottom) unit cell simulations onto the first principal component of the 'dipping' motion. Colored traces track CheA dimers that undergo an extended (>10 ns) 'dipping' motion. Horizontal dashed lines visually demarcate the undipped and dipped CheA dimer classes. Vertical dashed lines separate the initial 80 ns equilibration simulation from nine 450 ns production simulations. Related to Figure 4—figure supplement 1, 2, 3, 4 and 5, and Supplementary file 1.
Figure 4—figure supplement 1
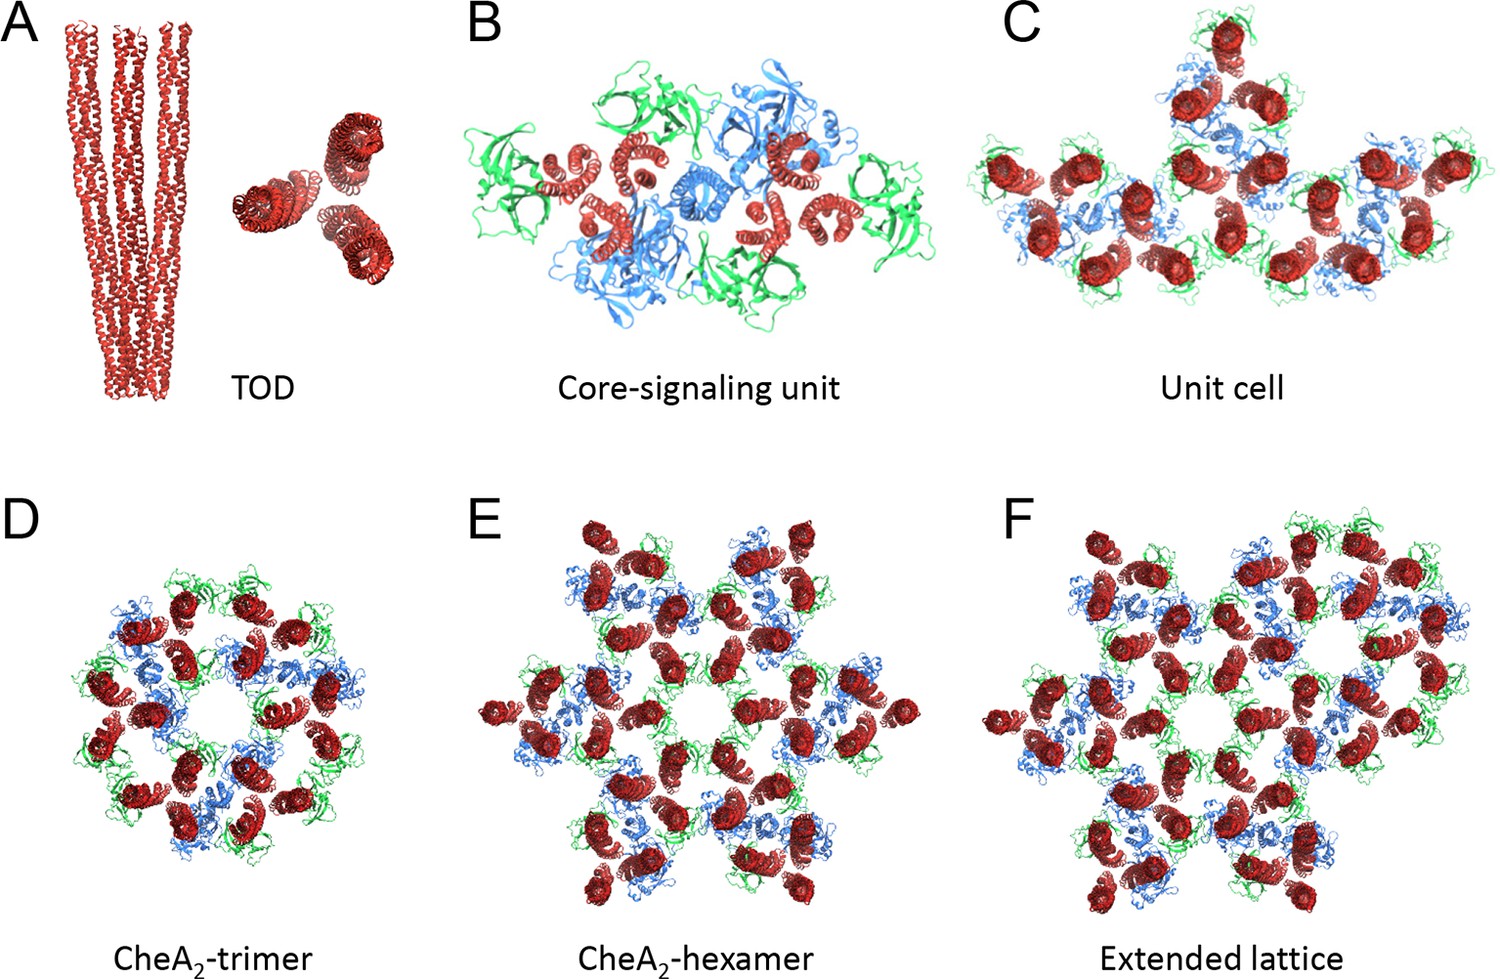
Nomenclatures.
(A) TOD: receptor trimer of dimers. (B) Core-signaling unit/complex: 2 TOD, 1 CheA dimer, 4 CheW. (C) Unit cell: 3 coupled core-signaling units. (D) CheA2-trimer: 3 core-signaling units, pseudo three-fold symmetry. (E) CheA2-hexamer: 6 core-signaling units, pseudo six-fold symmetry. (F) Extended lattice: interlocked CheA2-trimer and CheA2-hexamer.
Figure 4—figure supplement 2
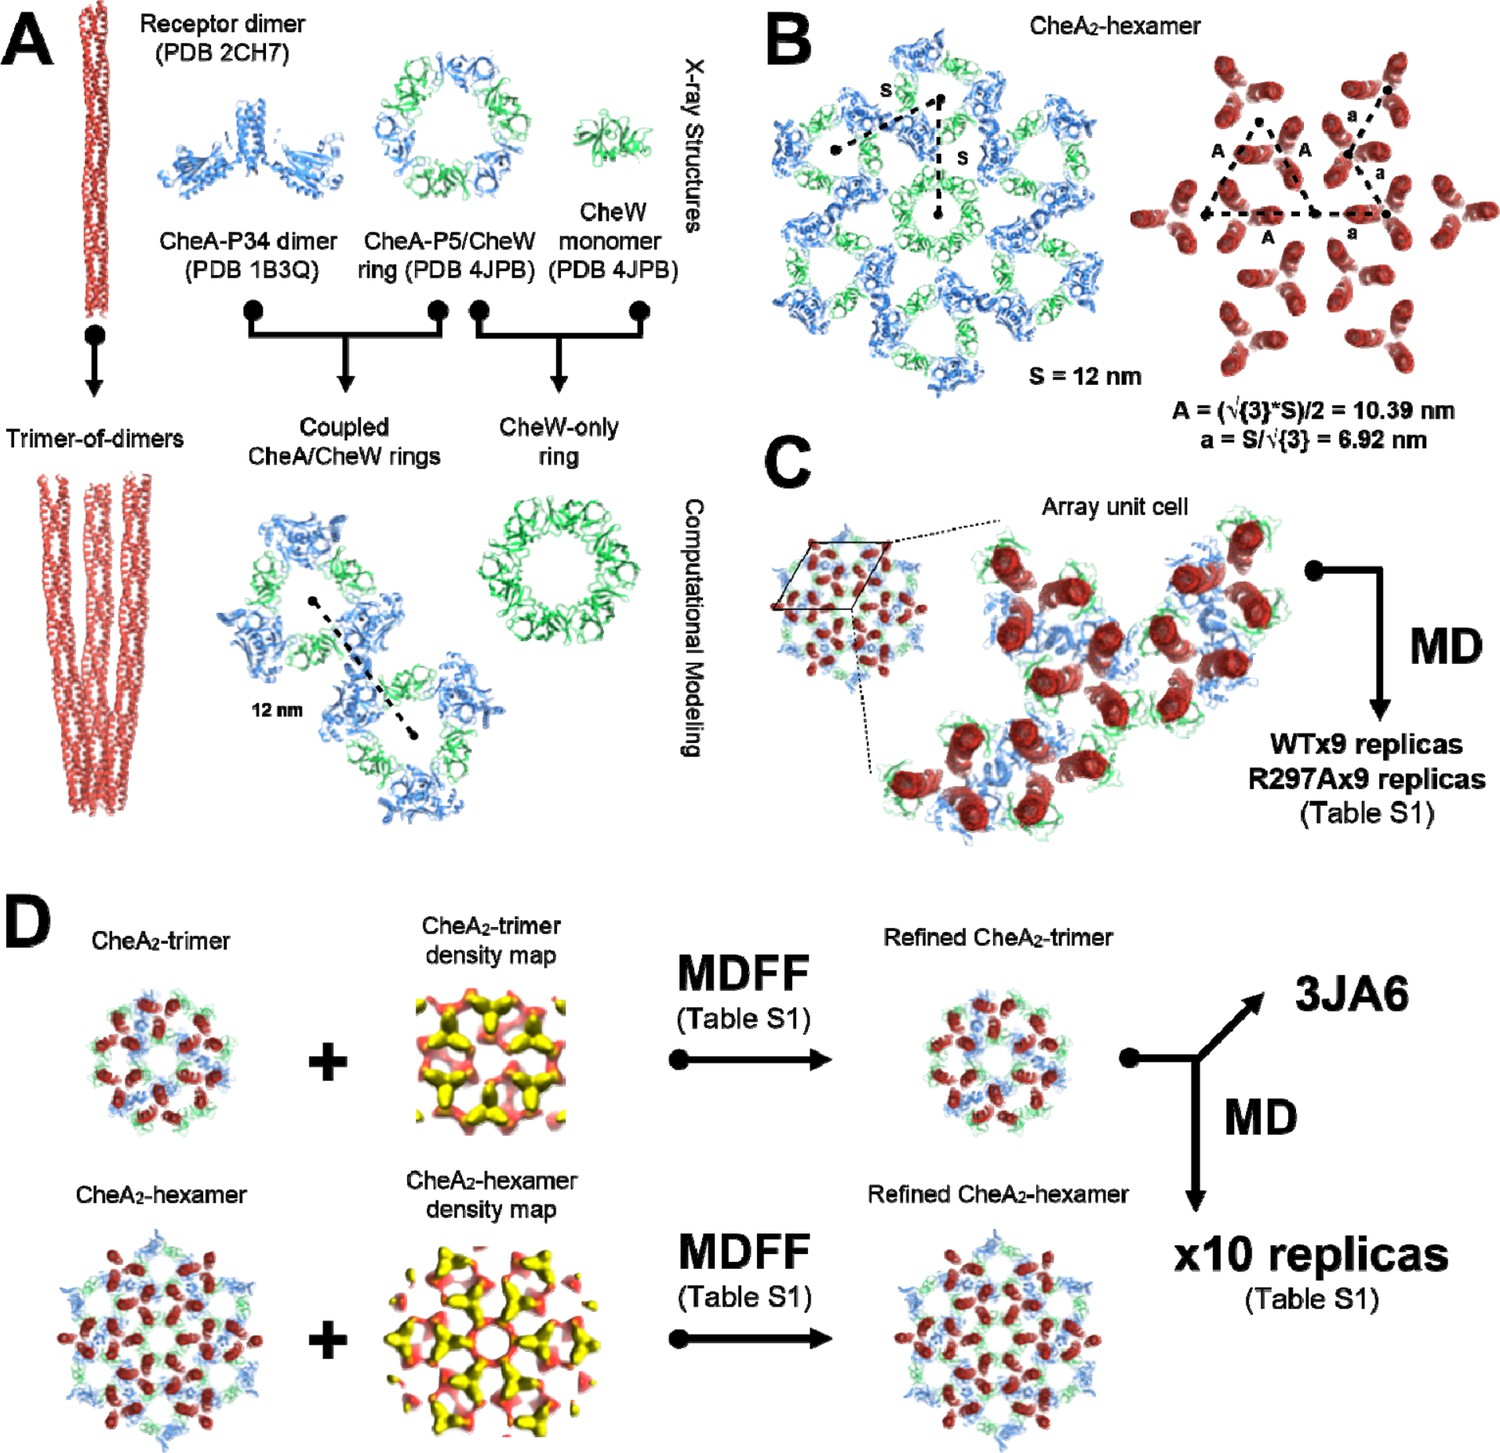
Overview of molecular modeling and simulation strategy taken in this study.
(A) High resolution X-ray structures from T. maritima were taken as inputs for the generation of models corresponding to the array’s core components, namely the receptor trimer-of-dimers, coupled CheA/CheW rings, and CheW-only ring. (B) The resulting core-component models were arranged heuristically, assuming a 12 nm lattice constant, to produce models of the CheA2-hexamer and CheA2-trimer array substructures. For simplicity, only the CheA2-hexamer organization is shown. (C) A portion of the heuristically-constructed CheA2-hexamer model corresponding to the array unit cell was extracted for further study with all-atom MD simulations. (D) MDFF simulations were conducted to refine the CheA2-hexamer and CheA2-trimer models utilizing their respective density maps. A core-signaling unit was taken from the MDFF-refined CheA2-trimer model and deposited in the PDB data bank under accession code 3JA6. The full MDFF-refined CheA2-trimer model was subjected to further investigation using all-atom MD simulations.
Figure 4—figure supplement 3
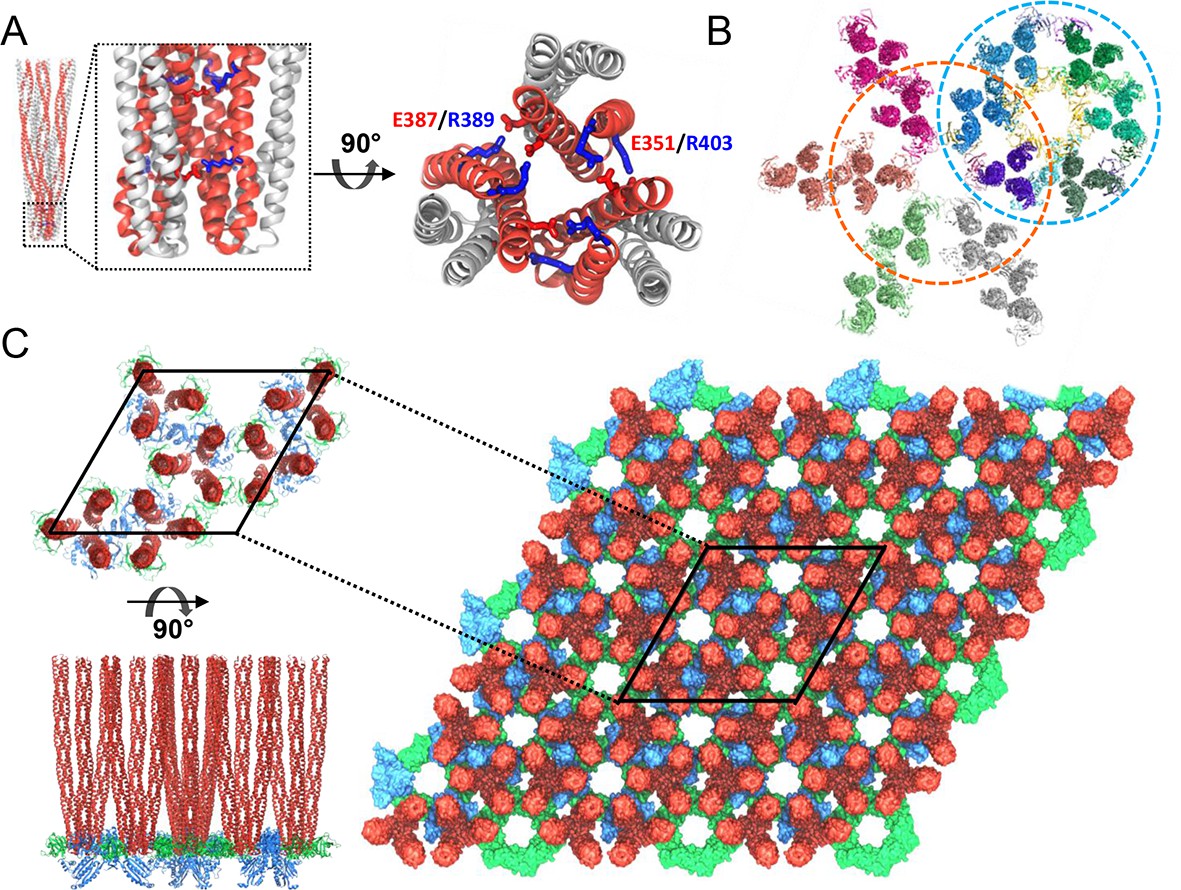
Computational modeling of the extended chemosensory array structure.
(A) Molecular dynamics (MD) simulations show that T. maritima receptors form a stable trimer-of-dimers (TOD). Side view (left) and top view (right) of the highly conserved protein interaction tip, highlighting the inter-receptor salt bridge network formed by E351/R403 and E387/R389. Symmetry-related monomers within individual receptor dimers are distinguished by red and grey coloring. (B) MDFF-refined, all-atom model of the array subunits combining CheA2-trimer (cyan circle) and CheA2-hexamer (orange circle) maps. (C) All-atom model of the T. maritima lattice containing 3 x 3 unit cells. A portion of the lattice corresponding to a single unit cell is outlined in black. Top (top left) and side (bottom left) views of the array unit cell model arranged as three coupled core-signaling units. Receptor TODs are shown in red, CheA dimers in blue, and CheW monomers in green.
Figure 4—figure supplement 4
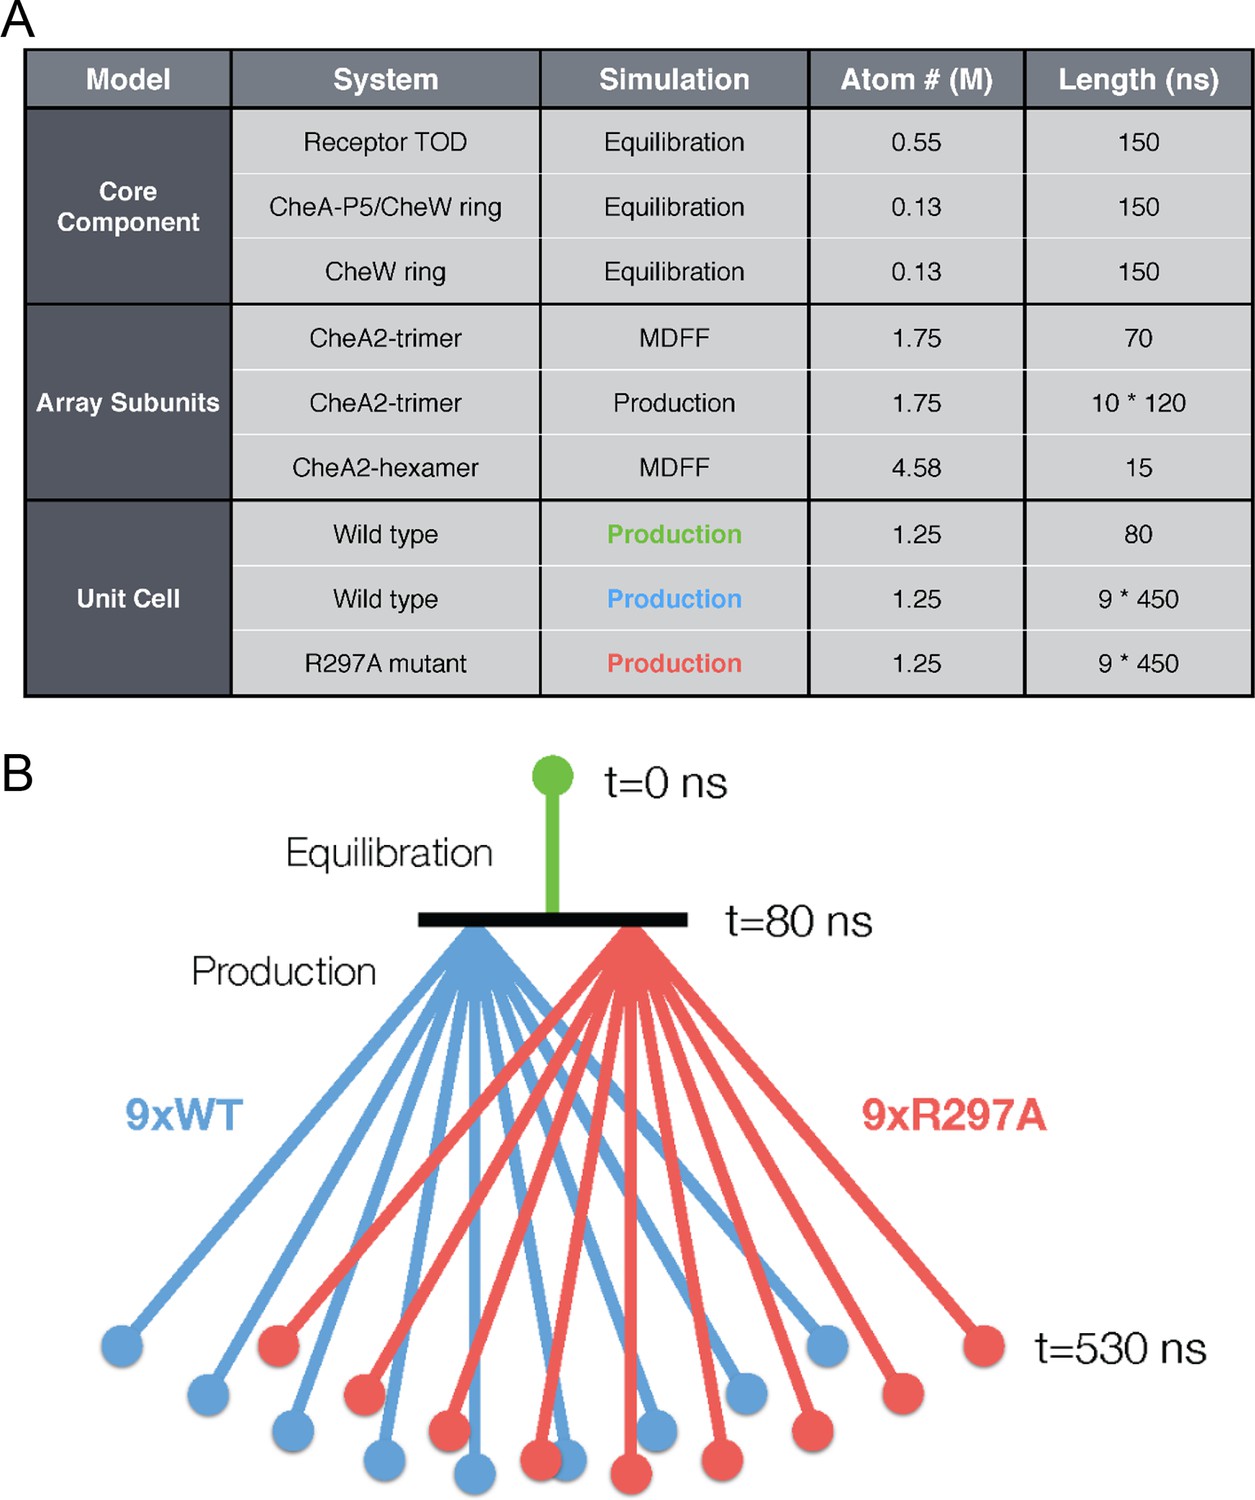
Overview of key all-atom molecular dynamics simulations conducted in this study.
(A) Table summarizing simulations for each molecular system with atom number reported roughly in millions (M) of atoms (including protein, solvent, and ions) and simulation duration in nanoseconds (ns). (B) Schematic detailing the organization of unit cell simulations. An initial equilibration simulation of 80 ns provided a base structure from which nine wild type (purple) and nine R297A mutant (red) unit cell simulations were subsequently launched in parallel. Each of the 18 production simulations were 450 ns in length, totaling over 8 microseconds of sampling on the unit cell system.
Figure 4—figure supplement 5

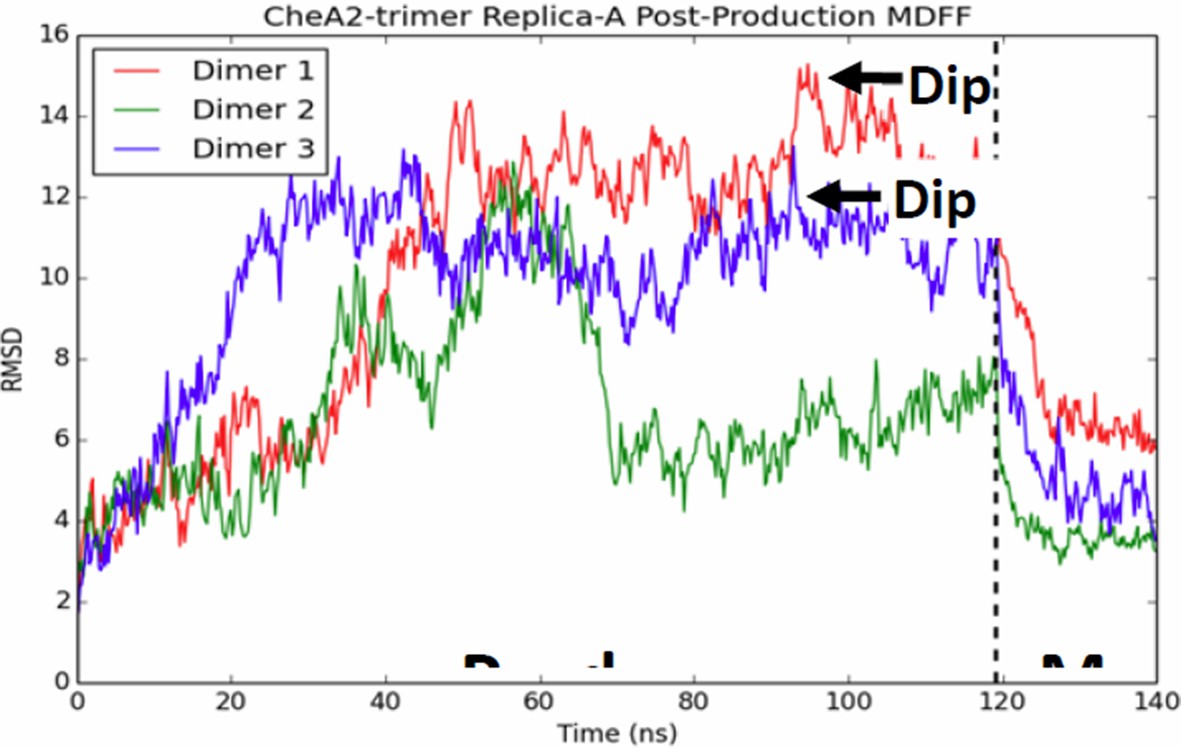
Time series of CheA dimer conformations extracted from CheA2-trimer simulations.
Traces track the projection of the conformations of 30 CheA dimers onto the first principal component of the 'dipping' motion. Colored traces track CheA dimers that undergo an extended (>10 ns) 'dipping' motion. Horizontal dashed line visually demarcates the undipped and dipped CheA dimer classes. Vertical dashed line separates initial 70 ns MDFF simulation from ten, 120 ns production simulations.
Figure 5 with 1 supplement
Biochemical validation of alternative CheA conformations in E. coli.
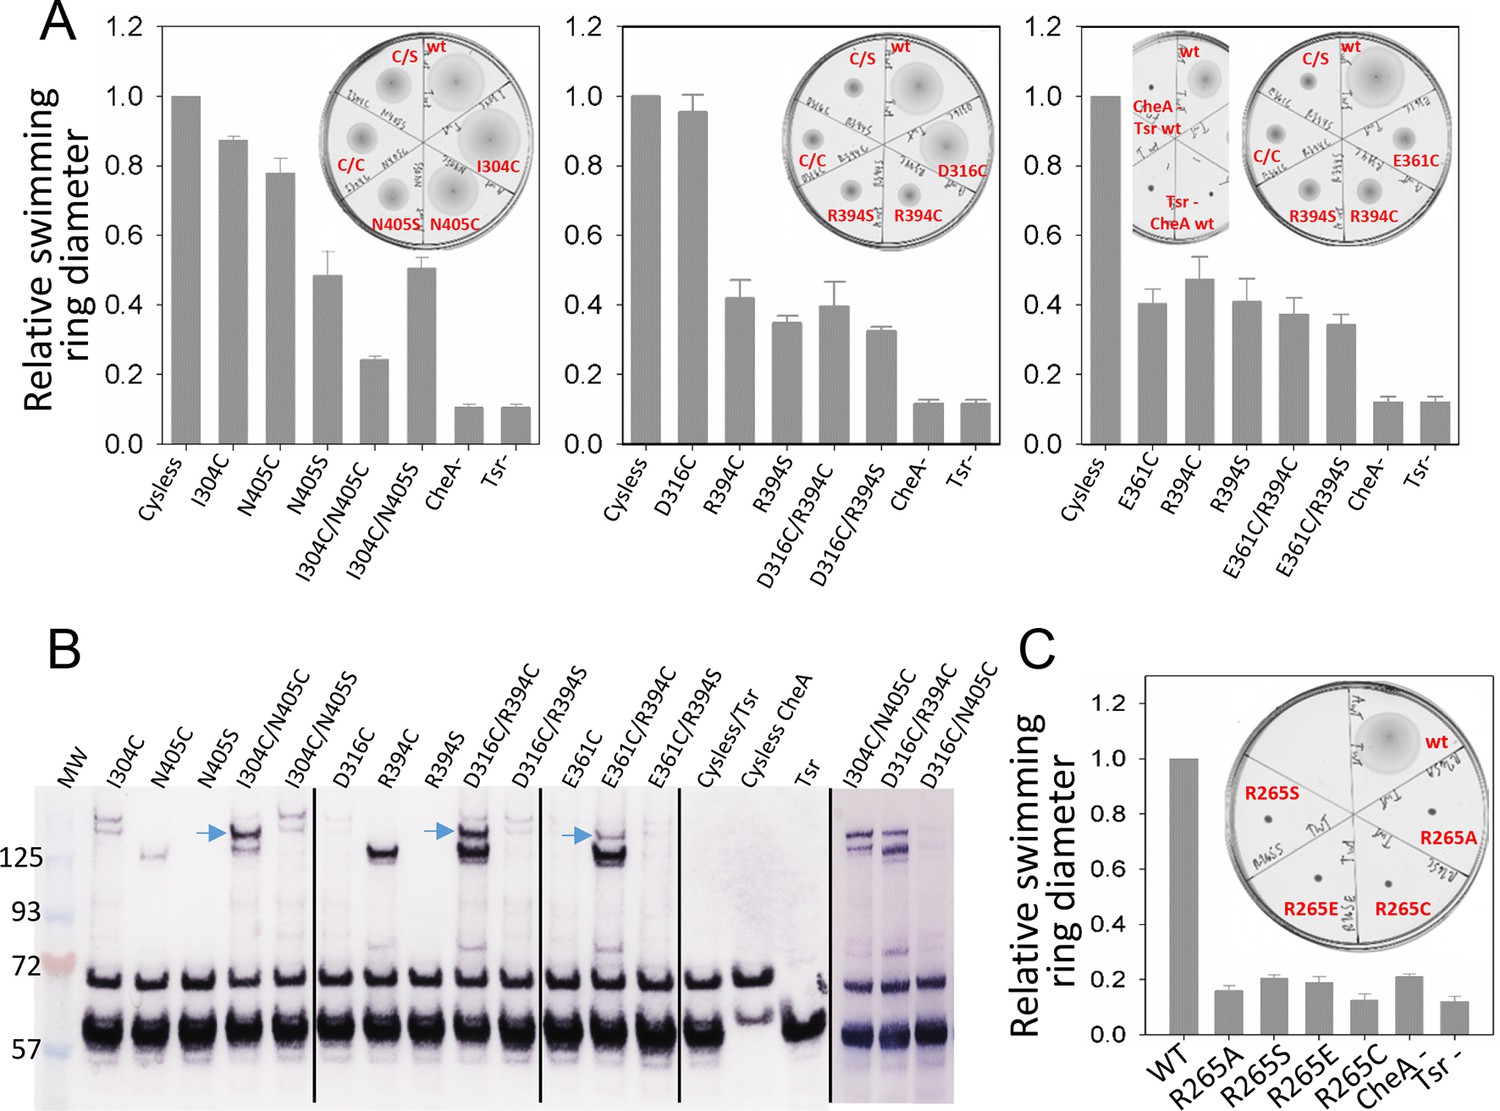
(A) Swimming ability of E. coli cells with mutations in the CheA-P3 and Tsr interface (I304/N405 and D316/R394) and in the 'dipped' CheA-P4 and Tsr interface (E361/R394). Swimming activities are normalized to the cysless CheA and wt Tsr, ± standard deviation (n=6). Inset, representative images of soft agar plates for swimming ability, with specific constructs labeled in red. (B) Disulphide cross-linking of the CheA-P3 and Tsr interface (I304C/N405C and D316C/R394C) in the undipped CheA dimer conformation (top panel of Figure 5B) and the CheA-P4 and Tsr interface (E361C/R394C) occurring in the dipped CheA-P4 'dipped' conformation (bottom panel of Figure 5B). Non-reducing (top) and reducing (bottom) SDS-PAGE gels were analyzed by immunoblotting for Tsr and CheA. Cross-linked species were indicated with blue arrows. (C) Swimming ability of E. coli cells with mutations at R265 of CheA-P3 domain, normalized to the wt, ± standard deviation (n=8). Related to Figure 5—figure supplement 1.
Figure 5—figure supplement 1
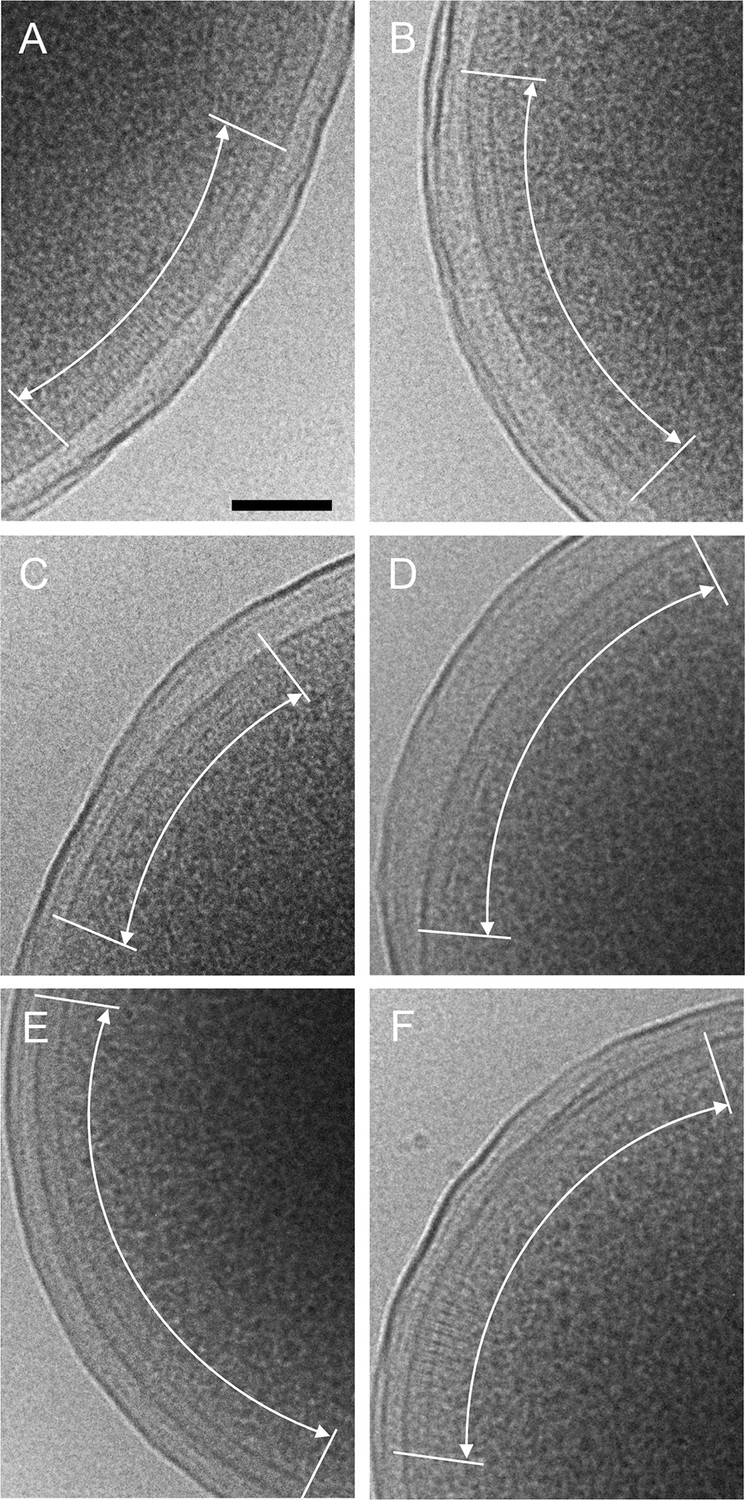
CryoEM images of plunge-frozen E.
coli cells expressing WT Tsr and WT CheA (A&B), R265A CheA (C), R265C CheA (D), R265S CheA (E), and R265E CheA (F). The arrays are marked with white curved arrows. Scale bars, 100 nm.
Author response image 1
Effect of missing cone on the tomography density map.
Shown in gray solid surface, the ideal density map without missing cone, and maps with different amount of missing cone applied (colored meshes). Left, green mesh 12° cone (this study, Figure 3–figure supplement 1). Right, yellow mesh, 30° cone as would be found in other typical tomography studies. Density maps are all contoured at 1.5σ.
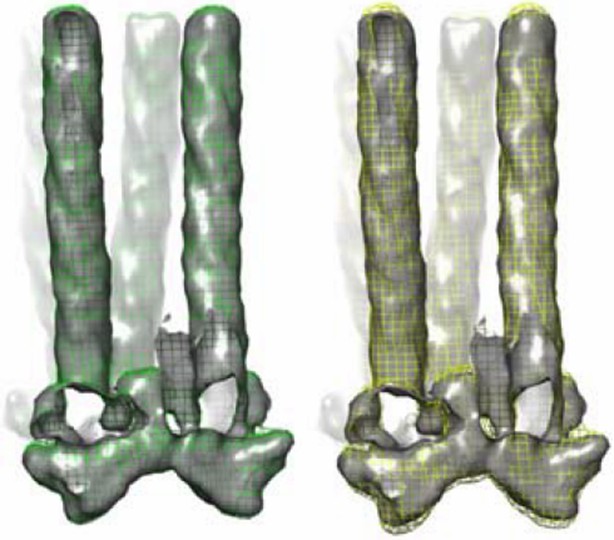
Author response image 2
CheA dimers from multiple initial conformations converge to same fitted model.
Red, blue, and green traces track RMSD of CheA dimers as measured from the initial MDFF-refined model. Though, the dimer conformations diversity during the 120 ns production run, a 20 ns MDFF simulations returns them to their initial MDFF-refined state.
Author response image 3
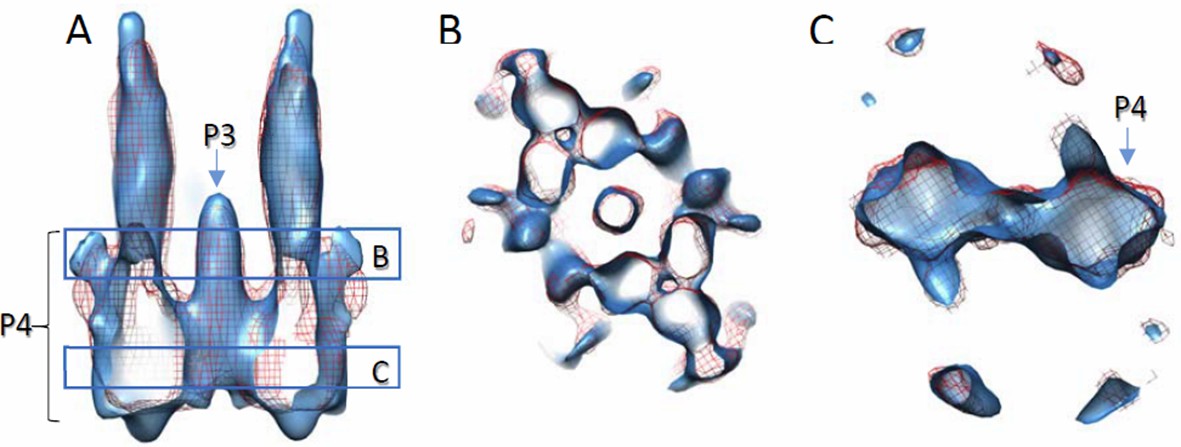
Comparison of density maps containing full-length wt CheA and wt CheA-P345.
Densities are contoured at 2σ. Solid blue, with wt CheA-P345; red mesh, with full-length wt CheA. The density with CheA-P345 appears elongated along the Z direction, due to the missing wedge effect and limited amount of data. (A) Side view of the volume slab. (B and C) Top views of volume slabs at the height indicated in A.
Author response image 4
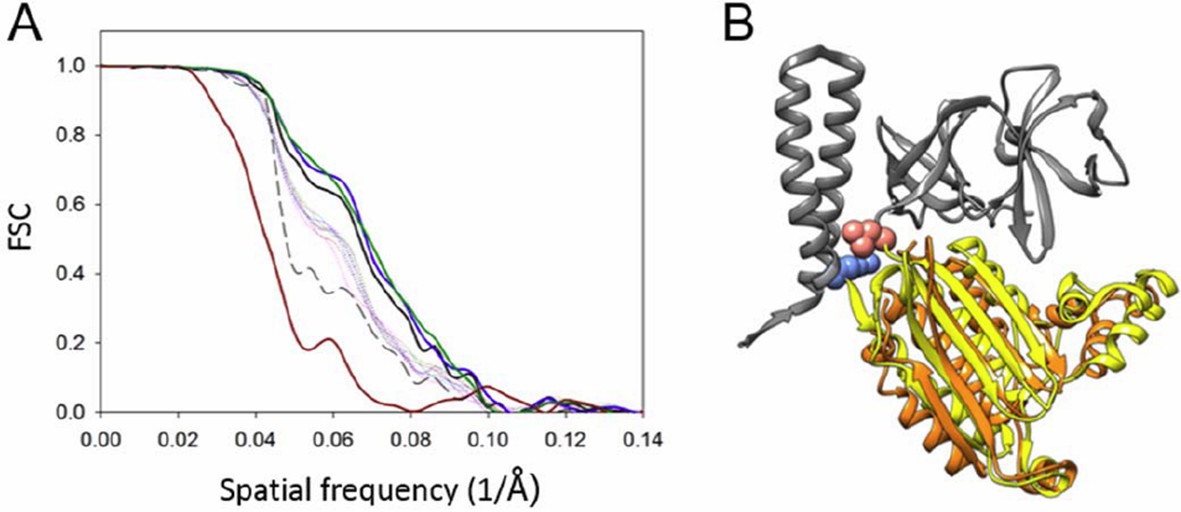
Resolution anisotropy.
(A) Gold-standard Fourier shell correlation (FSC) of the CheA2-trimer density map. The overall FSC of the map is plotted as a solid black line. The FSC curves for the conical Fourier shells along the X, Y, and Z directions are in solid green, blue and dark-red, respectively, and along the 10 other directions are in dotted lines. The previous FSC (dashed black line) was calculated from the same map but with a more extended mask. (B) MDFF model of the CheA-P4 domain from the anisotropic FSC filtered density map (orange), overlapped with the previous MDFF model (yellow). The pink and light blue spheres indicate the P3-C and P5-N termini, respectively. CheA-P3 and CheA-P5 domains are in gray.
Author response image 5

A metric for the goodness of fit for the docking of the CheA-P4 domain.
(A) Distribution of 23 classes of fits for the P4 domain starting from random orientations. (B) The models from the top 9 highest cross-correlation classes are shown in panels 1-9, with the cross-correlation values and number of contributing fits (%) indicated below. These 9 classes constitute 90.1% of total fits. Panel 10 is an overlay of the #1 fit (blue) with the MDFF model (orange). The red and blue spheres indicate the N and C termini of P4, respectively. The corresponding connecting termini from P3 and P5 are in light blue and pink, respectively. P3 and P5 domains are in gray.
Videos
Video 1
Tomographic slices of monolayer arrays.
Related to Figure 2.
Video 2
MDFF model fitting of the CheA2-trimer density map.
Related to Figure 3.
Video 3
Molecular dynamics simulation of array unit cell.
Shown here is a 75 ns clip of a wild type unit cell trajectory, illustrating the dynamics of the 1.2 million atom model, including 6 receptor TODs (red), 3 CheA dimers (blue), and 12 CheW monomers (green). Periodic images, shown here with reduced opacity, enforce the boundary conditions of the extended array architecture but are not simulated explicitly. Solvent and ions have been removed for clarity. Related to Figure 4.
Video 4
Molecular dynamics simulations reveal conformational switch in CheA P4 domain.
Shown here is one of four 'dipping' events observed in the wild type unit cell simulations, leading to modified contacts between the CheA dimer and receptor TODs. Strong contacts between P3 and neighboring receptor dimers (D333/K390 shown here with licorice representation) are disrupted in favor of new contacts between P3/P4 and P4/receptor stabilizing the dipped state (R297/E397 and E390/R379 respectively, shown here with licorice representation). Related to Figure 4.
Additional files
-
Supplementary file 1
Summary of protein-protein interactions at key interfaces of equilibrated T. maritima unit cell model.
Residues participating in a given interface but not associated with particular partners are listed separately for each domain. Residues that interact significantly (>50% of frames) are listed as a pair in a separate row. Interactions unique to this study are listed in green. Where ambiguous, residue pairs involving a receptor bound to CheA-P5, CheW from a CheA-P4/CheW ring or CheW from a CheW-only ring are denoted with a (1), (2) or (3) respectively. ** Signifies interfaces taken directly from experimental structures. Recent references pertaining to each protein-protein interface are given.
- https://doi.org/10.7554/eLife.08419.023
Download links
A two-part list of links to download the article, or parts of the article, in various formats.
Downloads (link to download the article as PDF)
Open citations (links to open the citations from this article in various online reference manager services)
Cite this article (links to download the citations from this article in formats compatible with various reference manager tools)
CryoEM and computer simulations reveal a novel kinase conformational switch in bacterial chemotaxis signaling
eLife 4:e08419.
https://doi.org/10.7554/eLife.08419


