Muscle niche-driven Insulin-Notch-Myc cascade reactivates dormant Adult Muscle Precursors in Drosophila
- INSERM U1103, CNRS UMR6293, France
Figures
Figure 1 with 1 supplement
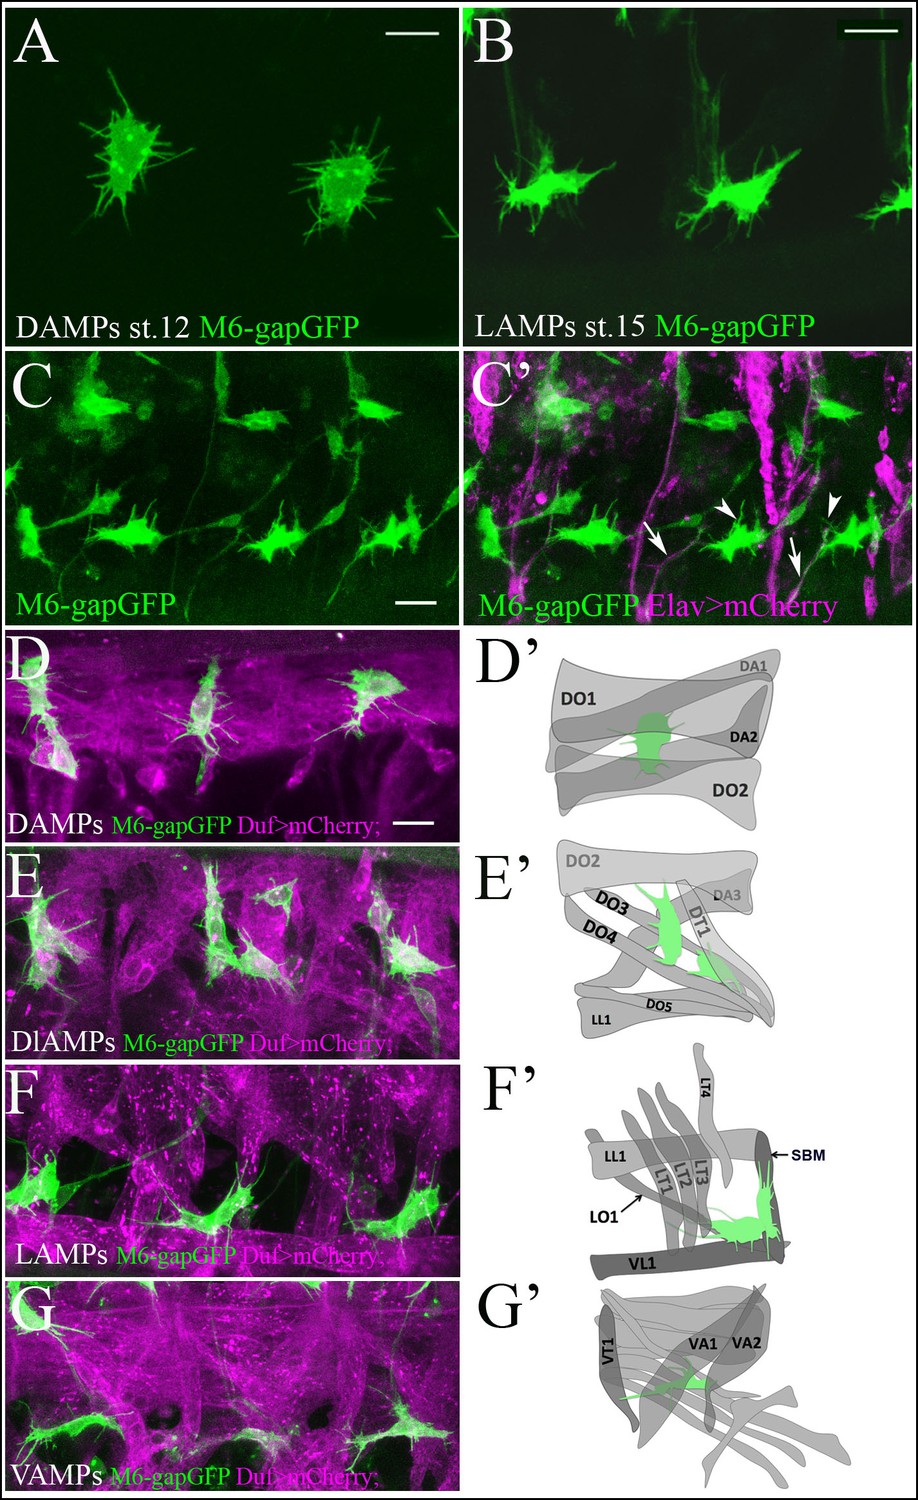
Quiescent AMP cells are tightly associated with surrounding muscles.
(A, B) A zoomed view of quiescent dorsal (A) and lateral (B) AMPs bearing numerous thin filopodia. (A) Newly-specified AMPs at embryonic stage 12 display a random pattern of filopodia. (B) Mid-stage embryo AMPs become elongated and send out filopodia in an directionally-oriented way. Filopodia pattern of AMPs in m6-gapGFP embryos was revealed by anti-GFP staining of membrane-targeted GFP. (C, C’) A lateral view of three hemisegments of stage-15 embryo from the sensor driver line m6-gapGFP; Elav-GAL4; UAS-mCD8mCherry, driving mCherry with a membrane localization signal in all neurons. Arrows point to cytoplasmic extensions connecting the AMPs (green) and aligned with the PNS nerves (magenta). Arrowheads denote thin filopodia that are not connected to the PNS nerves. (D–G) Dual-color in vivo views of three hemisegments of stage-15 embryos from the m6-gapGFP; Duf-GAL4; UAS-mCD8mCherry line. mCherry (magenta) reveals embryonic muscles and GFP (green) reveals AMPs. Dorsal (D), dorsolateral (E), lateral (F) and ventral (G) groups of AMPs are shown. Note that AMPs connect to the embryonic muscles with numerous filopodia. (D’–G’) Schemes represent all observed AMP-muscle connections. AMPs connect to a defined set of muscles. (D’) Dorsal AMP connects to DO1 and DA2 and optionally to DA1 and DO2. (E’) Dorsolateral AMPs connect to DT1, DO3, DO4 and DO2. (F’) Lateral AMPs connect to SBM, LT1, LT2, LT3 and to LO1 and VL1. (G’) Ventral AMP interacts with VA2, VT1 and VA1. Scale bar in (A, B): 4 microns, in (C–G): 9 microns.
Figure 1—figure supplement 1
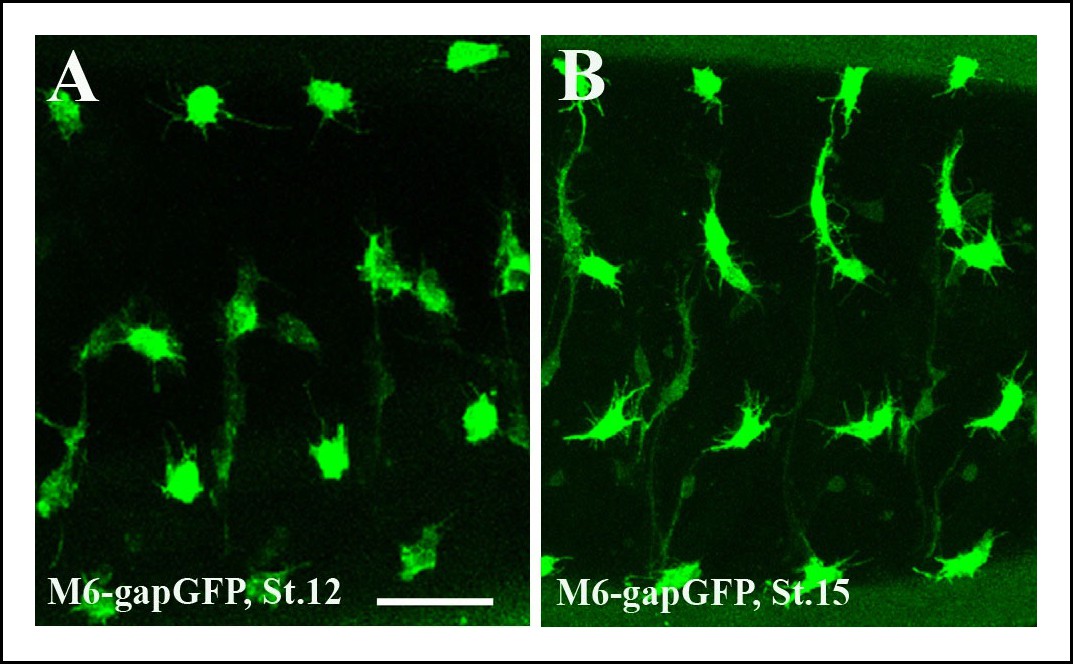
Segmental pattern of embryonic AMPs.
(A,B) Pattern of ventral, lateral, dorso-lateral and dorsal AMPs of stage 12 (A) and (B) stage 15 embryos. Four abdominal hemisegments are shown. Notice that newly specified AMPs at stage 12 (A) are of rounded shapes whereas the AMPs at embryonic stage 15 (B) adopt elongated and more irregular shapes. Both early and mid stage embryo AMPs produce numerous filopodia. Scale bar: 30 microns.
Figure 2
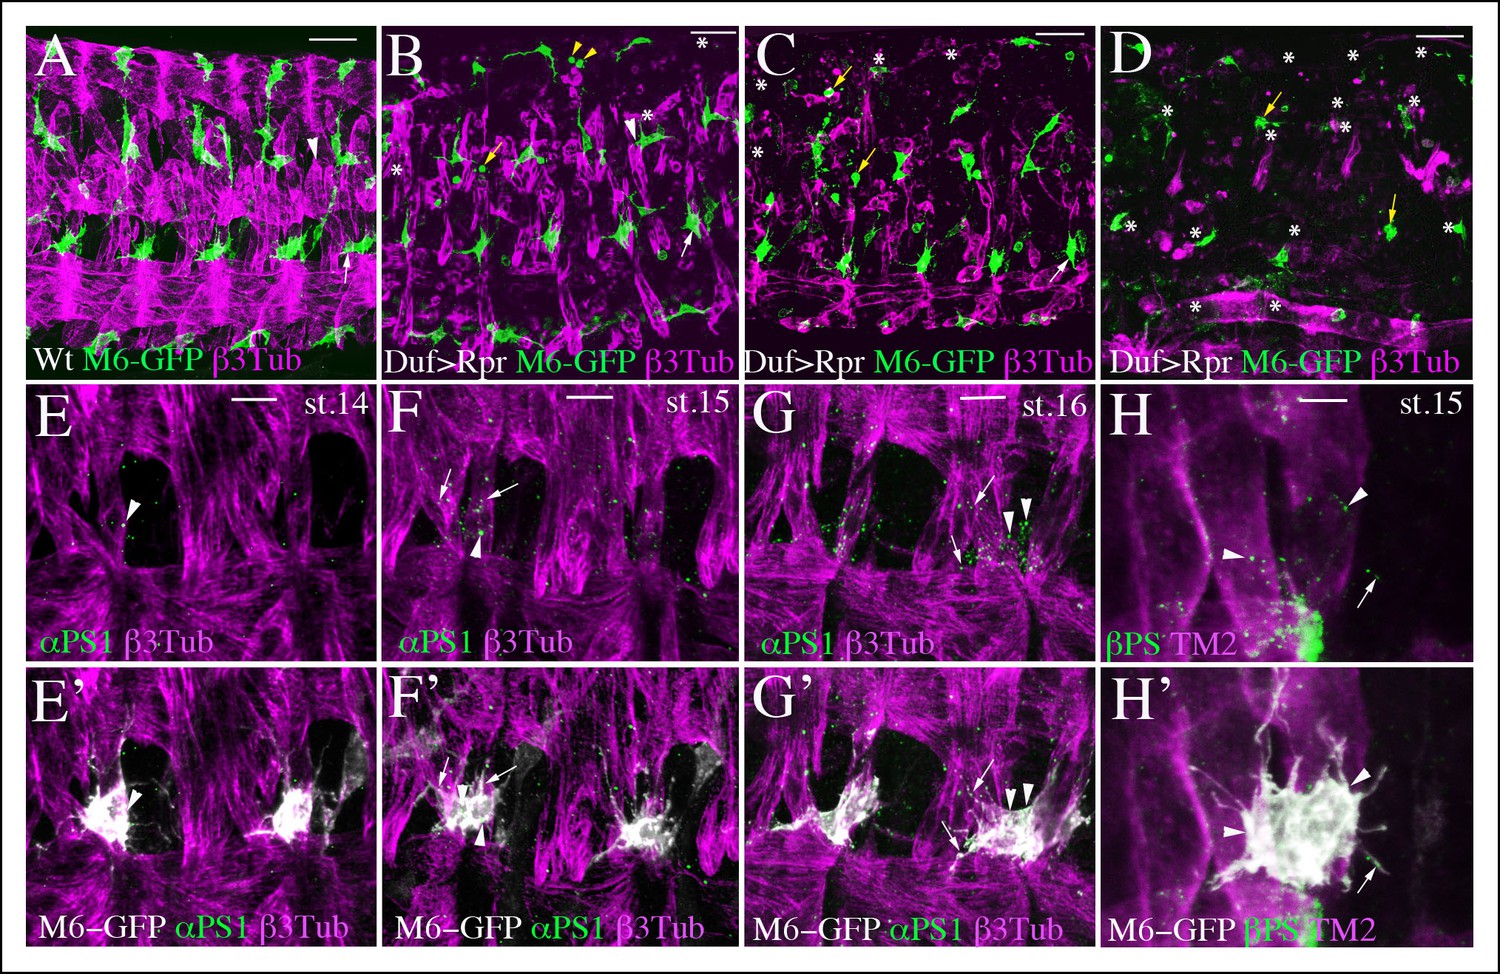
AMP-muscle connections display spatially-restricted plasticity and are decorated by integrin expression.
(A) A wild-type view of AMPs and muscles from mid-stage m6-gapGFP embryo. (B–D) Similar views from m6-gapGFP;Duf-GAL4;UAS-Rpr embryos with (B) weak, (C) intermediate, and (D) strong muscle ablation phenotypes. In segments with partial loss of lateral muscles, the anterior lateral AMP, which normally extends anteriorly (white arrow in A) remained tightly associated with the posterior lateral AMP and interacted mainly with SBM muscle – (white arrows in B and C). In segments with loss of dorsal and dorso-lateral muscles and with some lateral muscles persisting, (B) the dorso-lateral AMPs interacted with remaining lateral muscles (arrowhead in B) to which they do not connect in the wild-type context (arrowhead in A). This indicates a degree of plasticity in AMP connections. In segments with a pronounced loss of dorsolateral and lateral muscles (B and C), the dorsal and dorso-lateral AMPs adopted rounded shapes (yellow arrows) and were unable to migrate to other segments or to the ventral region where muscles were still present. In embryos with total muscle ablation, the majority of remaining AMPs adopted rounded shapes (yellow arrows in D). The number of AMPs detected was drastically reduced (asterisks indicate lacking AMPs). (E–H’) Zoomed views of lateral AMPs stained for (E-G’) α-PS1 and (H, H’) βPS integrin. The first α-PS1 dotty signals associated with AMPs appear at late-stage 14 (E, E’) and are progressively enriched at stages 15 and 16 (F-G’). A punctate α-PS1 pattern is seen, associated with AMP cell bodies (arrowheads) but also aligned with filopodia (arrows in F–G’). A similar β-PS1 pattern denoted by arrows and arrowheads is also observed, starting from embryonic stage 15 (H-H’). Scale bars in (A-D): 30 microns; in (E-G): 10 microns; in (H): 6 microns.
Figure 3 with 1 supplement

AMPs stay connected to surrounding muscles until reactivation.
(A) A dorso-lateral view of two hemisegments in mid-stage embryo showing lateral, dorso-lateral and dorsal AMPs (green) and embryonic muscles (blue). Two lateral AMPs (white and yellow arrows) send numerous filopodia to lateral muscle fibers. Note that one of the lateral AMPs (yellow arrow) extends along the segment border muscle (SBM). (B) A zoomed view of two lateral AMPs from the early second larval instar. The AMP indicated by the yellow arrow stays connected to the SBM and sends two long cellular extensions (yellow arrowheads) along the SBM. The second lateral AMP (white arrow) still produces filopodia (white arrowheads) linking it with the SBM and the LO1 muscle. The number of filopodia-based AMP-to-muscle connections is reduced compared to embryonic stages. Nuclei of AMPs (red) are revealed by anti-Twi staining. (C) A similar view of lateral AMPs from mid-second larval instar undergoing first cellular division. Note that the reactivated AMPs indicated by two white and two yellow arrows keep their extended shapes and filopodia-based connections (white and yellow arrowheads) to the SBM and LO1 muscles. (D) Proliferating lateral AMPs from third instar larva labeled with anti-Twist (red) to reveal their nuclei and anti-GFP (green) to reveal their shapes. The remaining cellular extension (yellow arrowhead) is still shown connecting one of lateral AMPs to the SBM muscle. The cells originating from the AMP connected to the LO1 muscle are aligned along this muscle (white arrowhead). Note that proliferating AMPs form clusters of tightly-associated cells. Scale bars in (A): 12 microns; in (B, C): 25 microns; in (D): 36 microns.
Figure 3—figure supplement 1
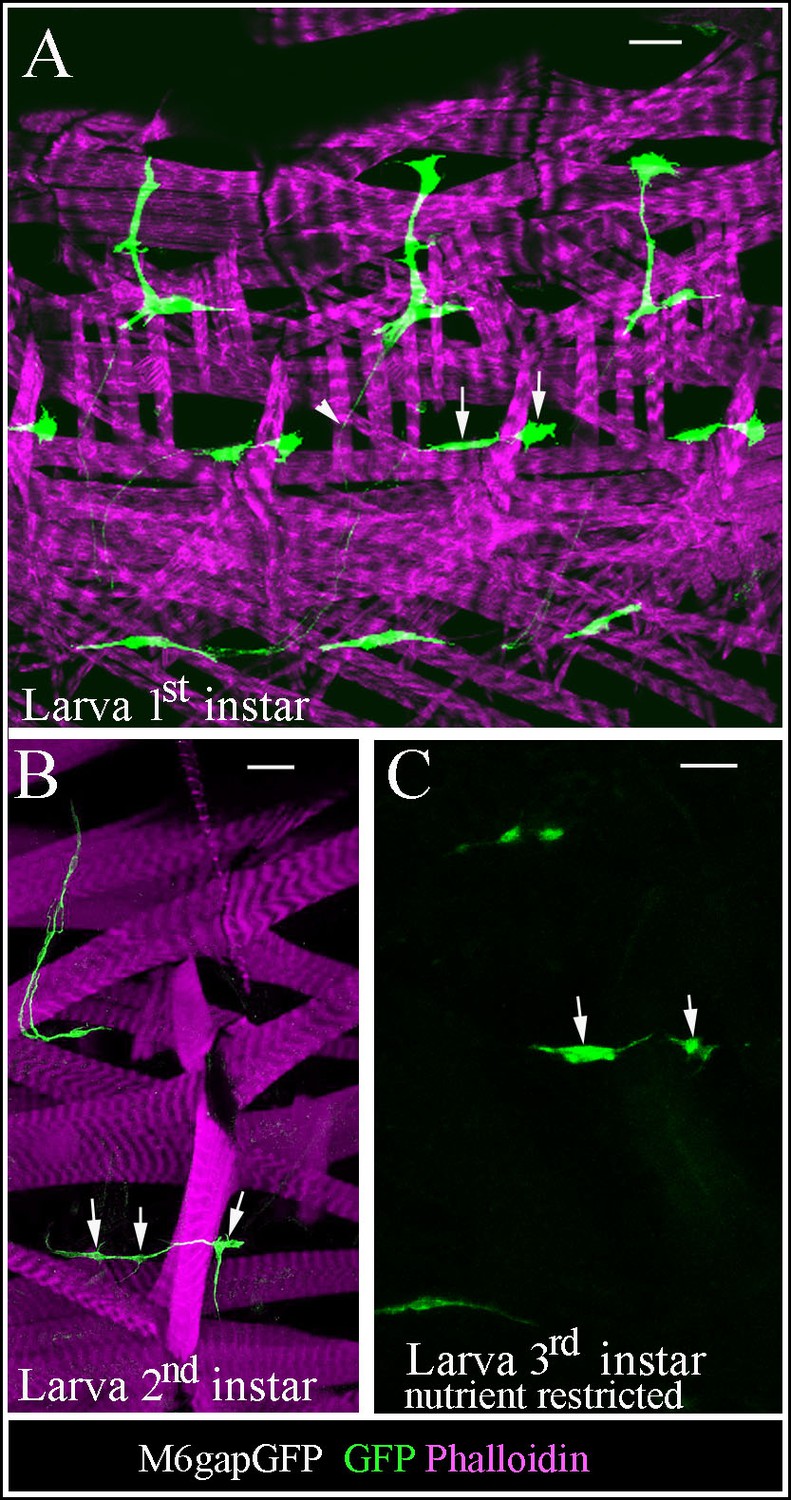
Larval AMPs adapt their shapes and keep associated to rapidly growing muscles.
(A) Flat preparation of first-instar M6gapGFP larvae stained for GFP (green) to reveal AMPs and phalloidin (magenta) to label muscles. Notice the elongated shapes of AMPs and persisting interconnections (arrowhead). Arrows indicate two lateral AMPs. (B) At second larval instar AMPs continue to elongate and adapt their shapes to keep connected with growing muscles. Arrows point to lateral AMPs among which the anterior one has already divided. (C) Nutrient restricted conditions prevent reactivation of AMPs. Arrows point to two lateral AMPs, which keep quiescent in third-instar larvae grown with nutrient restriction. Note that ~16 lateral AMP cells are detected in normal nutrient condition at this stage. Scale bars in (A, C): 15 microns; in (B): 30 microns.
Figure 4 with 2 supplements

Insulin/TOR and Notch pathways control AMP reactivation in larval stages.
(A–I) Flat preparations of the mid-stage matched third-instar larvae stained for Twist (green) labeling AMP nuclei and stained for Phalloidin (magenta) labeling the larval muscles. The abdominal lateral group of AMPs is shown in (A) representative control larva (M6-Gal4) and (B–I) in larvae with modified Insulin, TOR, Notch and Myc expression. M6-Gal4 driver is used to AMP-specifically drive the expression of: (B) PTEN, an inhibitor of the Insulin pathway; (C) InR-CAAX, a constitutively activated form of insulin receptor; (D) RHEB, an activator of the TOR pathway; (E) TSC1, TSC2, a complex of two proteins that inhibits the TOR pathway; (F) NICD, Notch intracellular domain that constitutively activates the Notch pathway; (G) dsRNA against Notch transcript; (H) overexpression of dMyc; (I) dsRNA against dMyc transcript. (J) Graphical representation of the mean number of lateral AMPs in the different genetic contexts shown in (A–I). (***) indicates P≤0.001. Scale bar: 36 microns. (K) A scheme illustrating the promoter influence of Insulin and Notch pathways and Myc on AMP reactivation.
-
Figure 4—source data 1
Table showing mean number of dorsal, lateral and ventral AMPs in the abdominal segments from the genotypes shown in Figure 4A–I and Figure 4—figure supplement 1.
For each genotype, the average number of cells ± standard error mean is shown. Sample size (n) is indicated in brackets (Rebay et al., 1993).
- https://doi.org/10.7554/eLife.08497.015
Figure 4—figure supplement 1

Influence of Insulin, TOR, Notch and Numb on AMP cell number in larval stages and in embryos.
(A, B) Graphs representing the mean number of AMPs from the dorsal and ventral abdominal groups of mid-3rd instar larvae from the genotypes shown in Figure 4A–I. (***), (**) and (*) indicate P≤0.001, P≤0.01 and P≤0.05, respectively. P-values were computed using t test and Prism software with Gal4 as a control sample. (C-I) and (C-II) Flat preparation of a mid-stage matched Numb-CD2-GFP 3rd-instar larva stained for Numb-GFP (green), Twist (red) and Phalloidin (blue). Note the absence of Numb-GFP in AMPs. (D) A graph showing mean number of dorsal, lateral and ventral AMPs from the mid-stage 3rd-instar control larvae (M6-GAL4) and from the larvae with AMP-targeted attenuation of numb. (E) Lateral views of stage 15 embryos. Targeted activation of Notch (E-I), Insulin (E-II), and TOR pathway (E-III) in AMPs does not lead to precocious reactivation of AMPs in embryos. Embryos are stained for GFP (green) to visualise the AMPs and for proliferation marker PH3 (magenta). Note that no expression of PH3 is seen in AMPs in these contexts. Scale bars in (C): 36 microns; in (E): 30 microns.
Figure 4—figure supplement 2
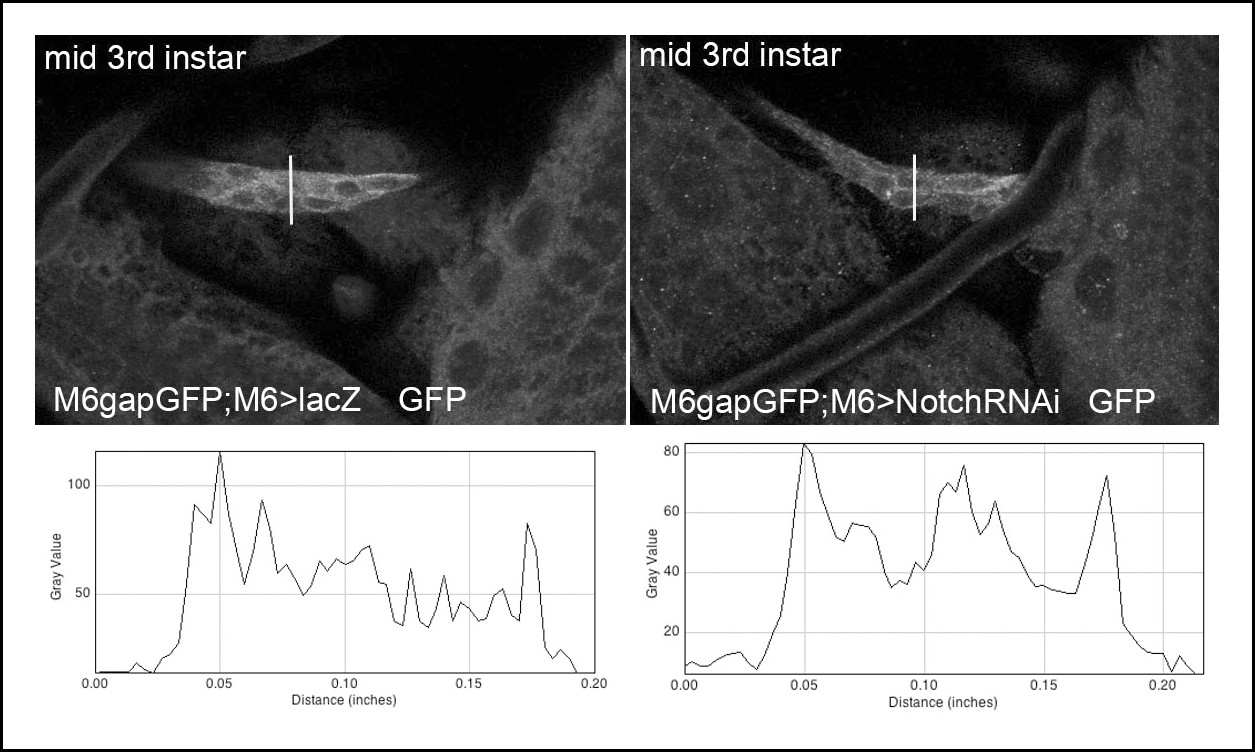
M6-Gal4 driver keeps active in Notch attenuation context.
Representative images showing m6-driven GFP signal associated with the anterior cluster of lateral AMPs in wt (lacZ context) and in larvae with reduced Notch (Notch RNAi context) acquired with the same confocal settings. Graphs of fluorescence intensity made with ImageJ Plot plugin (along the traced lines) are shown below. Notice that mean fluorescence signal in Notch RNAi context when compared to wt is reduced of about 10%.
Figure 5 with 1 supplement
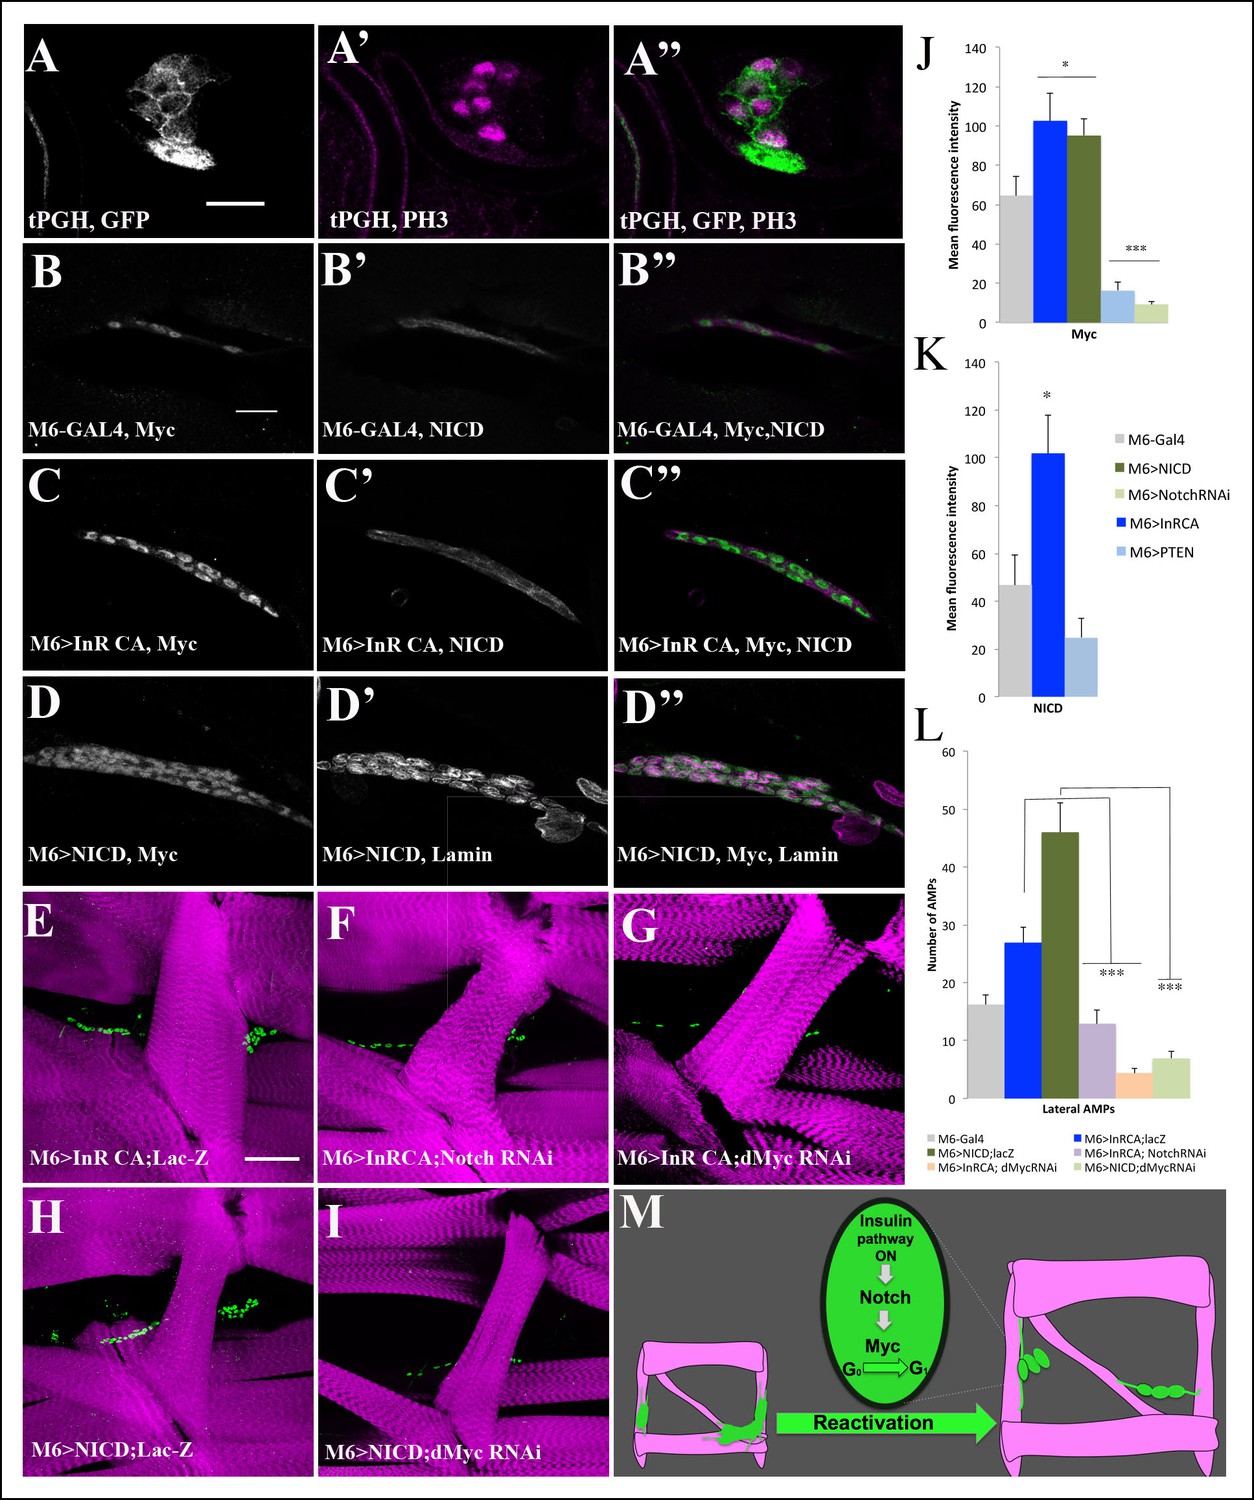
Myc acts downstream of Insulin and Notch pathways during AMP reactivation.
(A, A”) A single cluster of AMPs from the tPGH third-instar larvae stained for GFP to reveal activation of PI3K/Insulin pathway and for phospho-histone H3 (PH3) to identify AMPs that undergo proliferation. Note that PH-GFP localizes to the cell membranes, indicating the activity of PI3K/Insulin signaling in AMPs that proliferate. (B–D”) Single clusters of third-instar larva lateral AMPs stained for dMyc and NICD (B–C”) and for dMyc and Lamin (D–D’’). (B, B”) Control m6-GAL4 larva. (C, C”) m6-GAL4-driven expression of Inr-CAAX in AMPs upregulates dMyc and NICD expression. (D, D”) Targeted expression of NICD in AMPs results in an increased dMyc signal in AMPs. (E–I) Double transgenic mutant contexts and their effects on number of lateral AMPs. Attenuations of Notch (F) and dMyc (G) rescue the InRCA-induced overproliferation phenotype. Similarly, attenuating dMyc in AMPs expressing NICD dramatically reduces AMP numbers (I) compared to NICD context (H). (J) Mean fluorescence intensity of the dMyc signal detected in loss- and gain-of-function contexts for Insulin and Notch pathway components. (K) Mean fluorescence intensity of the NICD signal detected in InRCA and PTEN contexts. (L) Mean number of lateral AMPs counted in different genetic contexts shown in (E–I). (***) and (**) indicate P≤ 0.001 and P≤ 0.01, respectively. Scale bars are (A, A”): 9 microns; (B–D”): 15 microns; (E–I): 45 microns. (M) Schematic illustration of genetic hierarchy between Insulin, Notch and Myc during AMP reactivation.
-
Figure 5—source data 1
Table showing mean number of dorsal, lateral and ventral AMPs in the abdominal segments from the genotypes shown in Figure 5E–I,L and Figure 5—figure supplement 1.
For each genotype, the average number of cells ± standard error mean is shown. Sample size (n) is indicated in brackets. Below a table with mean signal intensity measurements for Myc and NICD in lateral AMP cluster from the genotypes shown in Figure 5B–D'',J,K. For each genotype, the average signal intensity value ± standard error mean is shown. Sample size (n) is indicated in brackets.
- https://doi.org/10.7554/eLife.08497.019
Figure 5—figure supplement 1
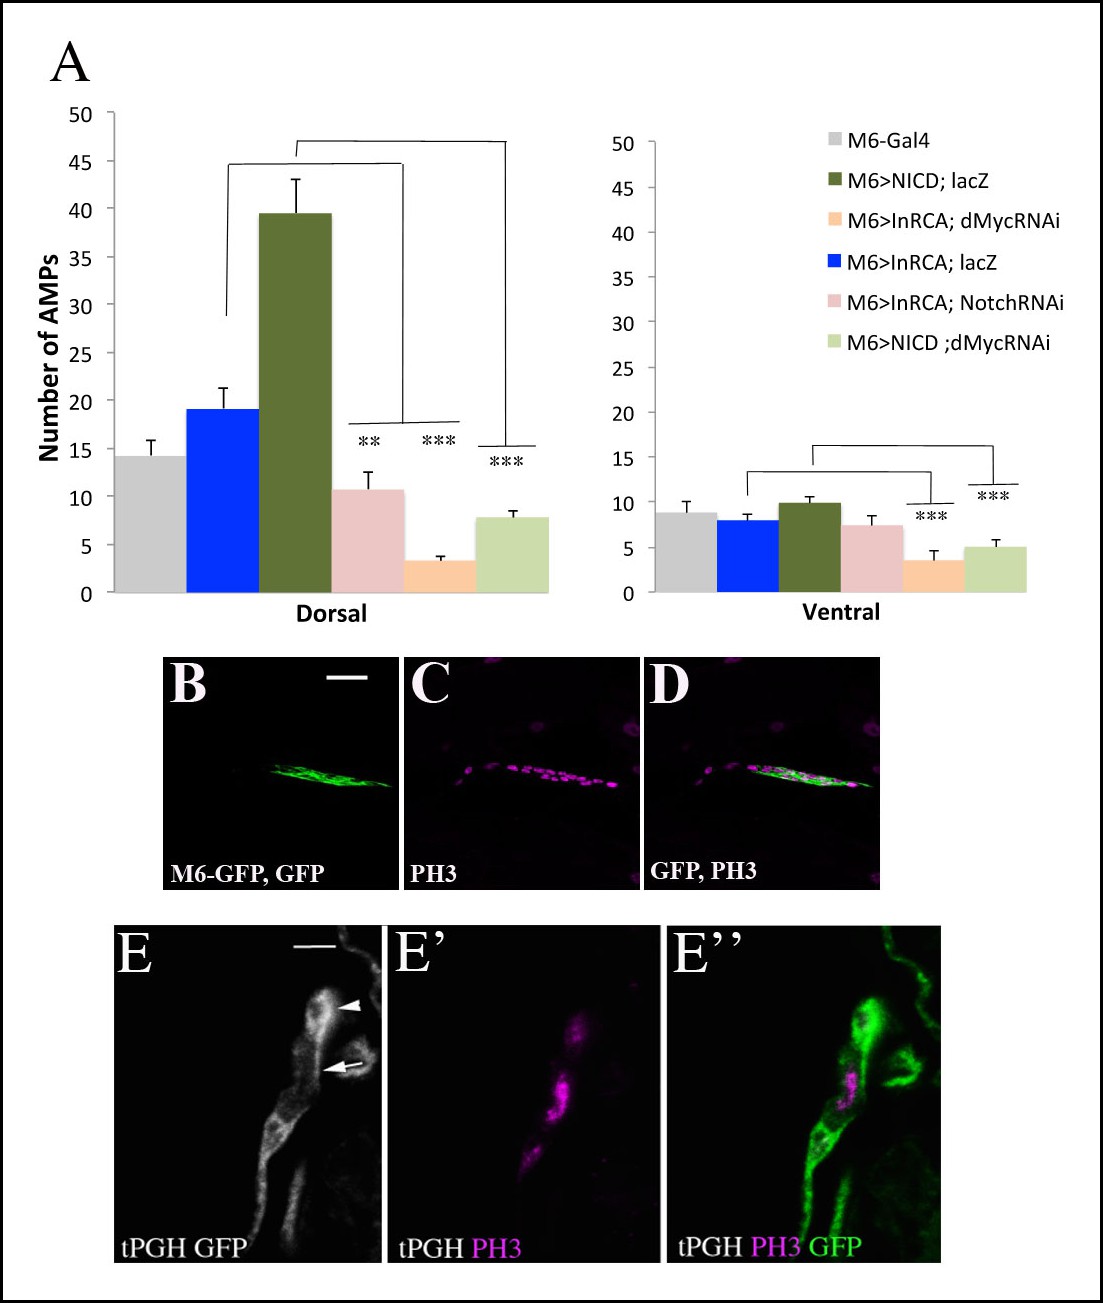
Proliferation of AMPs is positively regulated by Insulin, Notch and their downstream target Myc.
(A) A graph representing the mean number of AMPs from the dorsal and ventral abdominal groups of mid-third-instar larvae from the genotypes shown in Figure 5E–I. Notice that ventral AMPs reactivation appears independent of Insulin and Notch but dependent on Myc. (***) and (**) indicate P≤0.001 and P≤0.01, respectively. P-values were computed using t test and Prism software with Gal4 as a control sample. (B-D) A single cluster of AMPs from the lateral group of M6-gapGFP early third-instar larvae stained for GFP (green) visualizing the AMPs and for proliferation marker PH3 (magenta). (E-E”) Cluster of lateral AMPs from early third-instar t-PGH larvae stained for GFP, gray (E) to reveal subcellular PGH localisation and (E’) for PH3 (magenta). (E”) merged view. Arrow indicates membrane localized PGH in cell with a high level of PH3 and arrowhead points to a cell with faint PH3 staining and with ubiquitously distributed PGH. Scale bar in (B): 15 microns; in (E): 9 microns.
Figure 6 with 2 supplements
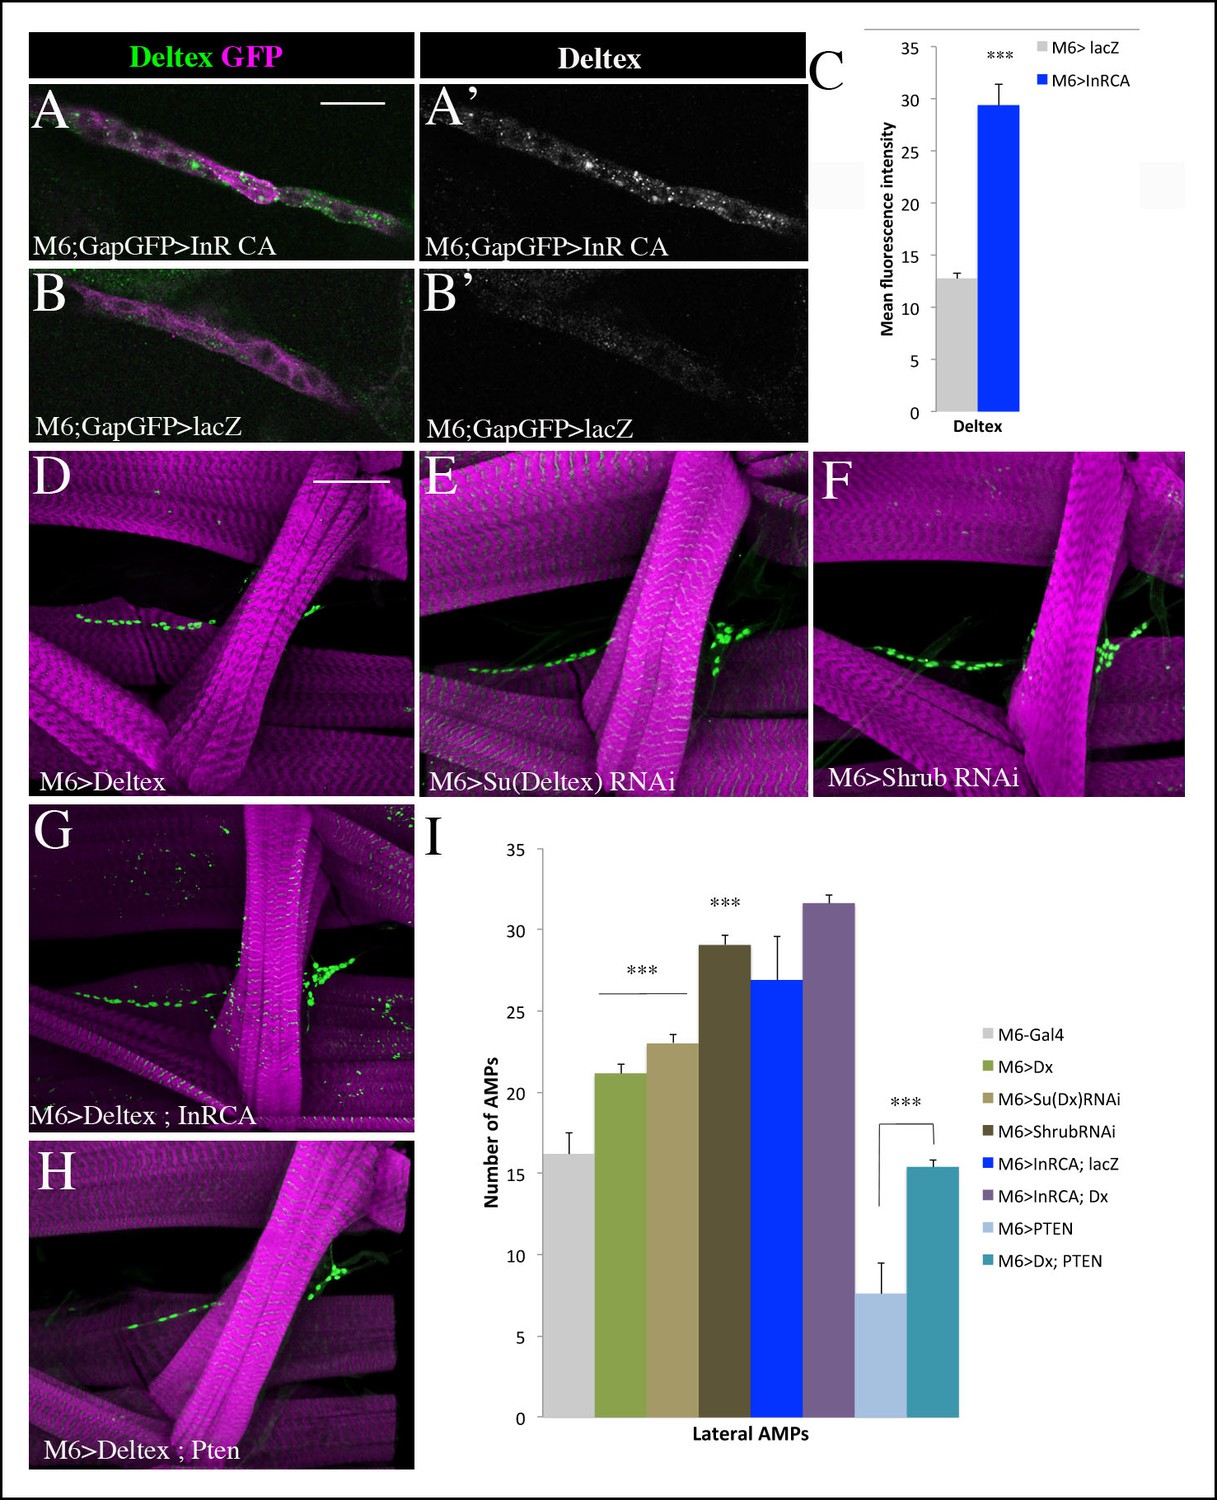
Insulin-driven Notch activation in AMPs involves Deltex.
(A-B’) Single clusters of third-instar larva lateral AMPs stained for Deltex and GFP. (A–A’) There is greater punctate Deltex expression in AMPs expressing constitutively activated InR than in control larva (B-B’) expressing lacZ. (C) Mean fluorescence intensity of the Deltex signal detected in gain-of-function context for Insulin versus wild-type. (D-F) Components of ligand-independent Notch activation have impacts on AMP cell numbers. AMP-targeted expression of Deltex (D), attenuation of Su (Deltex) (E) or attenuation of Shrub (F) all lead to an AMP overproliferation phenotype. The key role of Deltex as an activator of AMP proliferation is confirmed by an increased number of AMPs in embryos with M6-targeted expression of InRCA and Deltex (G) and further supported by partial rescue of AMP number when co-expressing Deltex with the PTEN Insulin pathway inhibitor (H). (I) Graphical representations of mean number of lateral AMPs in genetic contexts shown in (D-H). (***) indicates P ≤ 0.001. Scale bars are (A, B’): 15 microns; (D–H): 45 microns.
-
Figure 6—source data 1
Table showing mean number of AMPs in the abdominal segments from the genotypes shown in Figure 6D–I and Figure 6—figure supplement 1 and 2.
For each genotype, the average number of cells ± standard error mean is shown. Sample size (n) is indicated in brackets. Below, a table with mean Deltex signal intensity measurements in lateral AMP cluster from the genotypes shown in Figure 6A–C. For each genotype, the average signal intensity value ± standard error mean is shown. Sample size (n) is indicated in brackets.
- https://doi.org/10.7554/eLife.08497.022
Figure 6—figure supplement 1
Ligand independent activation of Notch promotes proliferation of AMPs.
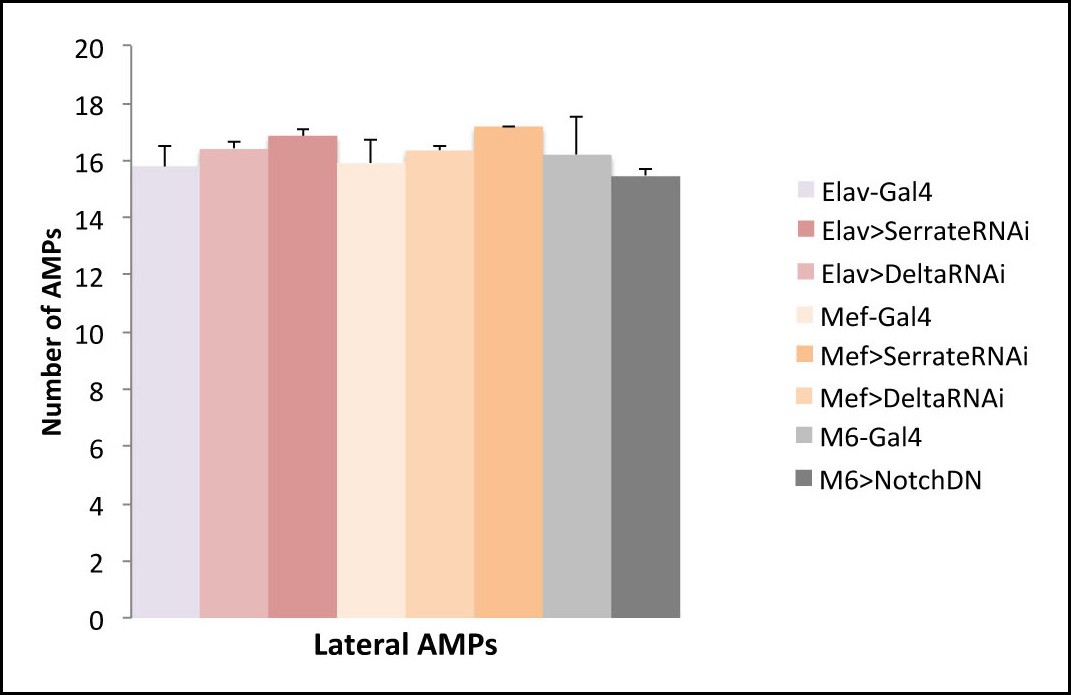
(A) A scheme representing potential sources of Notch ligands (Delta and Serrate). Notch signalling requires cell-cell contact and is activated in AMPs downstream of Insulin. This implies that the activated AMP cell (surrounded by red line) via so far unknown signal X promotes Delta or Serrate expression in cells that are direct AMP neighbours: PNS neurons (in yellow) or muscles (in blue). (B) Notch ligands attenuation in PNS neurons or in muscles and AMP-targeted expression of dominant-negative form of Notch receptor (that binds to ligand but is lacking intracellular domain and thus is unable to activate Notch targets) have no impact on AMP cell number suggesting that Notch activation in AMPs downstream of Insulin receptor is ligand independent.
Figure 6—figure supplement 2
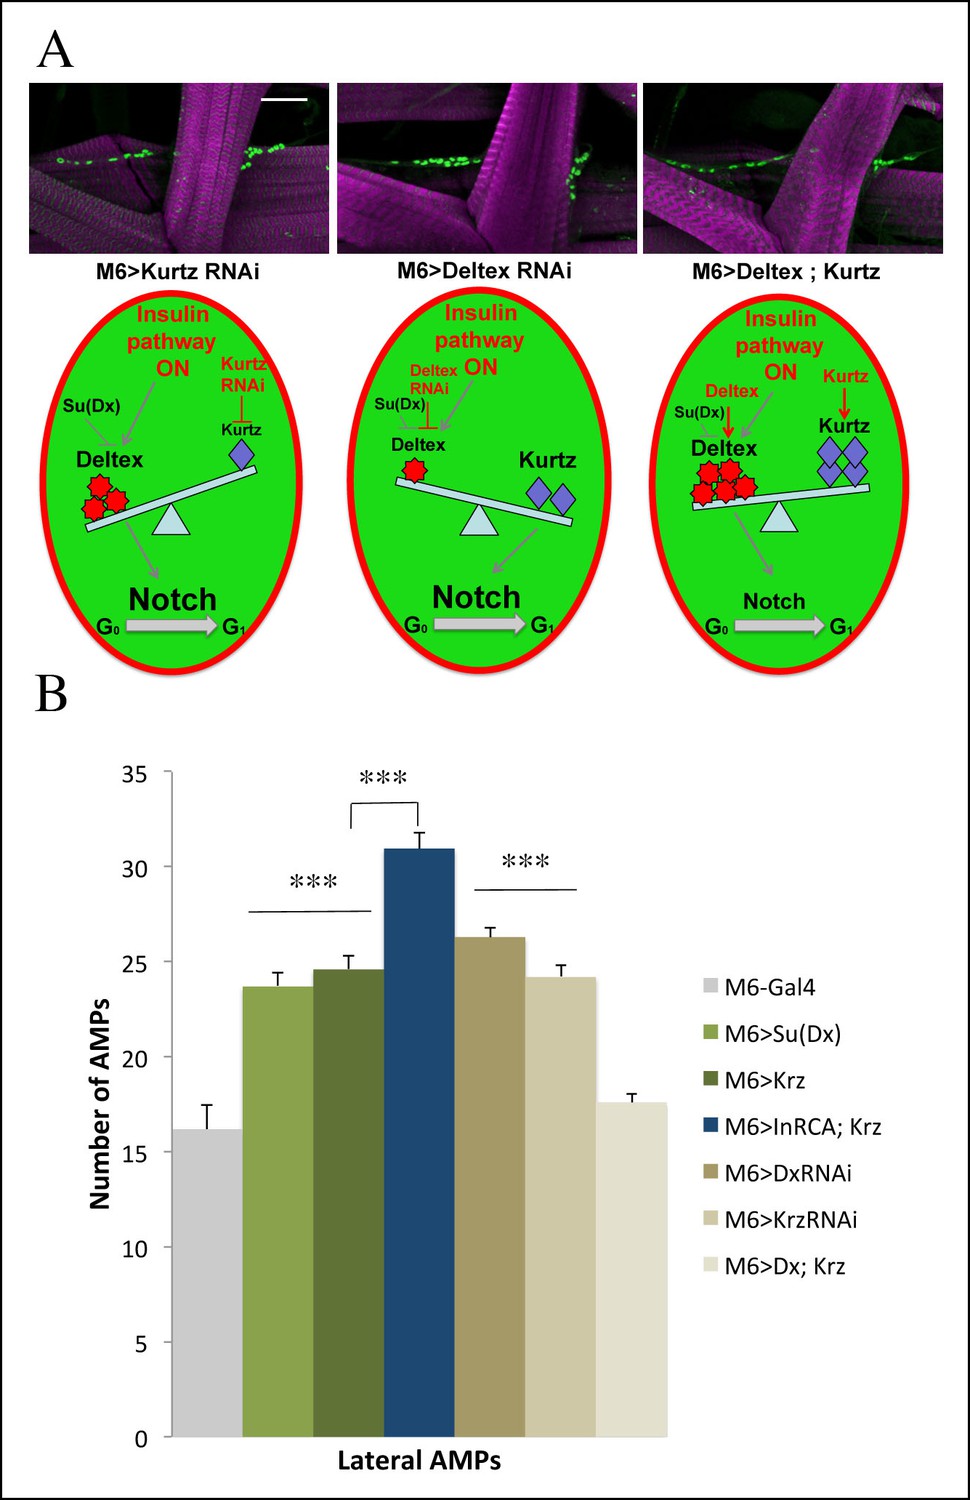
Role of Kurtz and Deltex in reactivation of AMPs.
(A) Levels of Deltex versus Kurtz play important role in ligand independent activation of Notch during reactivation of AMPs. Notice that attenuation of Kurtz or Deltex results in an increased number of AMPs whereas simultaneous over-expression of Kurtz and Deltex has no effect on AMP cell number. Schemes below illustrate effects of Deltex and Kurtz levels on Notch activation in an AMP activated by the Insulin pathway. Scale bar: 30 microns. (B) A graph representing the mean number of lateral AMPs of mid third-instar larvae from the genotypes shown in (A) and larvae over expressing in AMPs Su (Deltex), Kurtz and those overexpressing both InrCA and Kurtz. (***) indicates P≤0.001. P-values were computed using t test and Prism software with Gal4 as a control sample except those linked on the graph.
Figure 7 with 1 supplement
Larval muscles regulate AMP proliferation via Insulin-like peptide dIlp6.
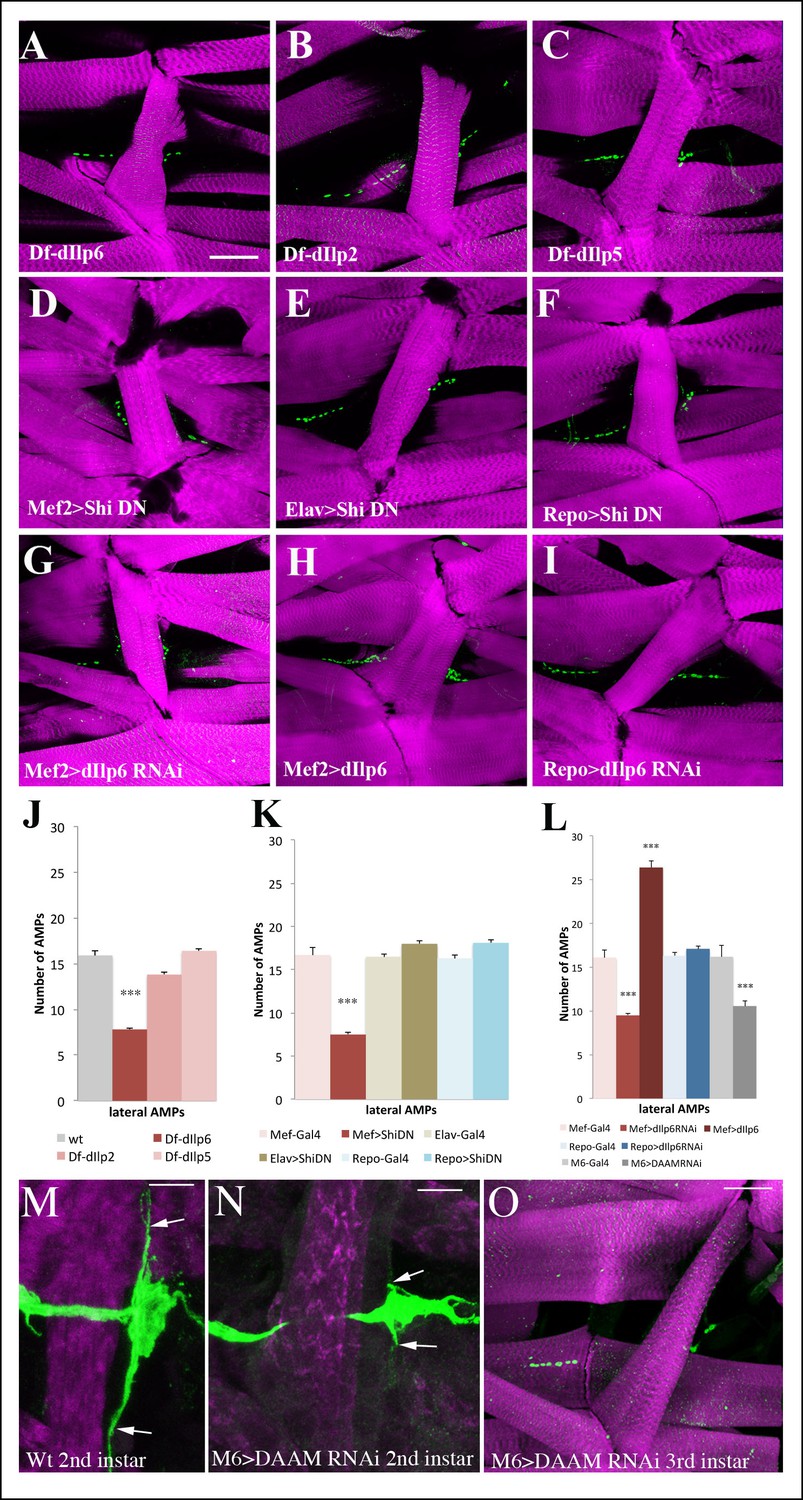
(A–I) Flat preparations of the mid-stage matched third instar larvae stained for Twist (green) labeling AMP nuclei and Phalloidin (magenta) labeling larval muscles. One abdominal lateral group of AMPs is shown. (A) Larvae mutant for dIlp6 (Df-Ilp6) shows a lower AMP count. (B, C) No changes in AMP number are observed in dIlp2 or dIlp5 mutant larvae. (D) Muscle-targeted expression of the dominant-negative form of shibire (DN-shi) leads to a decrease in AMP cell number. (E, F) Elav-Gal4-driven expression of DN-shi in neural cells or Repo-Gal4-driven expression in glial cells have no effects on AMP number. (G) Attenuation of dIlp6 in larval muscle leads to a decrease in AMP number while (H) muscle-specific gain-of-function of dIlp6 leads to an increase in AMP number. (I) No change in AMP number is observed after RNAi-based attenuation of dIlp6 in glial cells. (J) Mean number of lateral AMPs counted in different genetic contexts shown in A–I and O. (***) indicates P≤0.001. (K) Posterior lateral AMP revealed by GFP staining (green) of M6-gapGFP second-instar larvae. Arrows indicate long AMP filopodia extending along the segment border muscle (Phalloidin staining, in magenta). (L) A similar view of posterior lateral AMP from second instar DAAM-RNAi larvae. Arrows point to short filopodia. (M) Reduced AMP numbers in third instar larvae induced by M6-targeted attenuation of DAAM. Scale bar in (A–I) and (O): 45 microns; in (M, N): 25 microns.
-
Figure 7—source data 1
Table showing mean number of dorsal, lateral and ventral AMPs in the abdominal segments from the genotypes shown in Figure 7A–L and Figure 7—figure supplement 1.
For each genotype, the average number of cells ± standard error mean is shown. Sample size (n) is indicated in brackets.
- https://doi.org/10.7554/eLife.08497.026
Figure 7—figure supplement 1
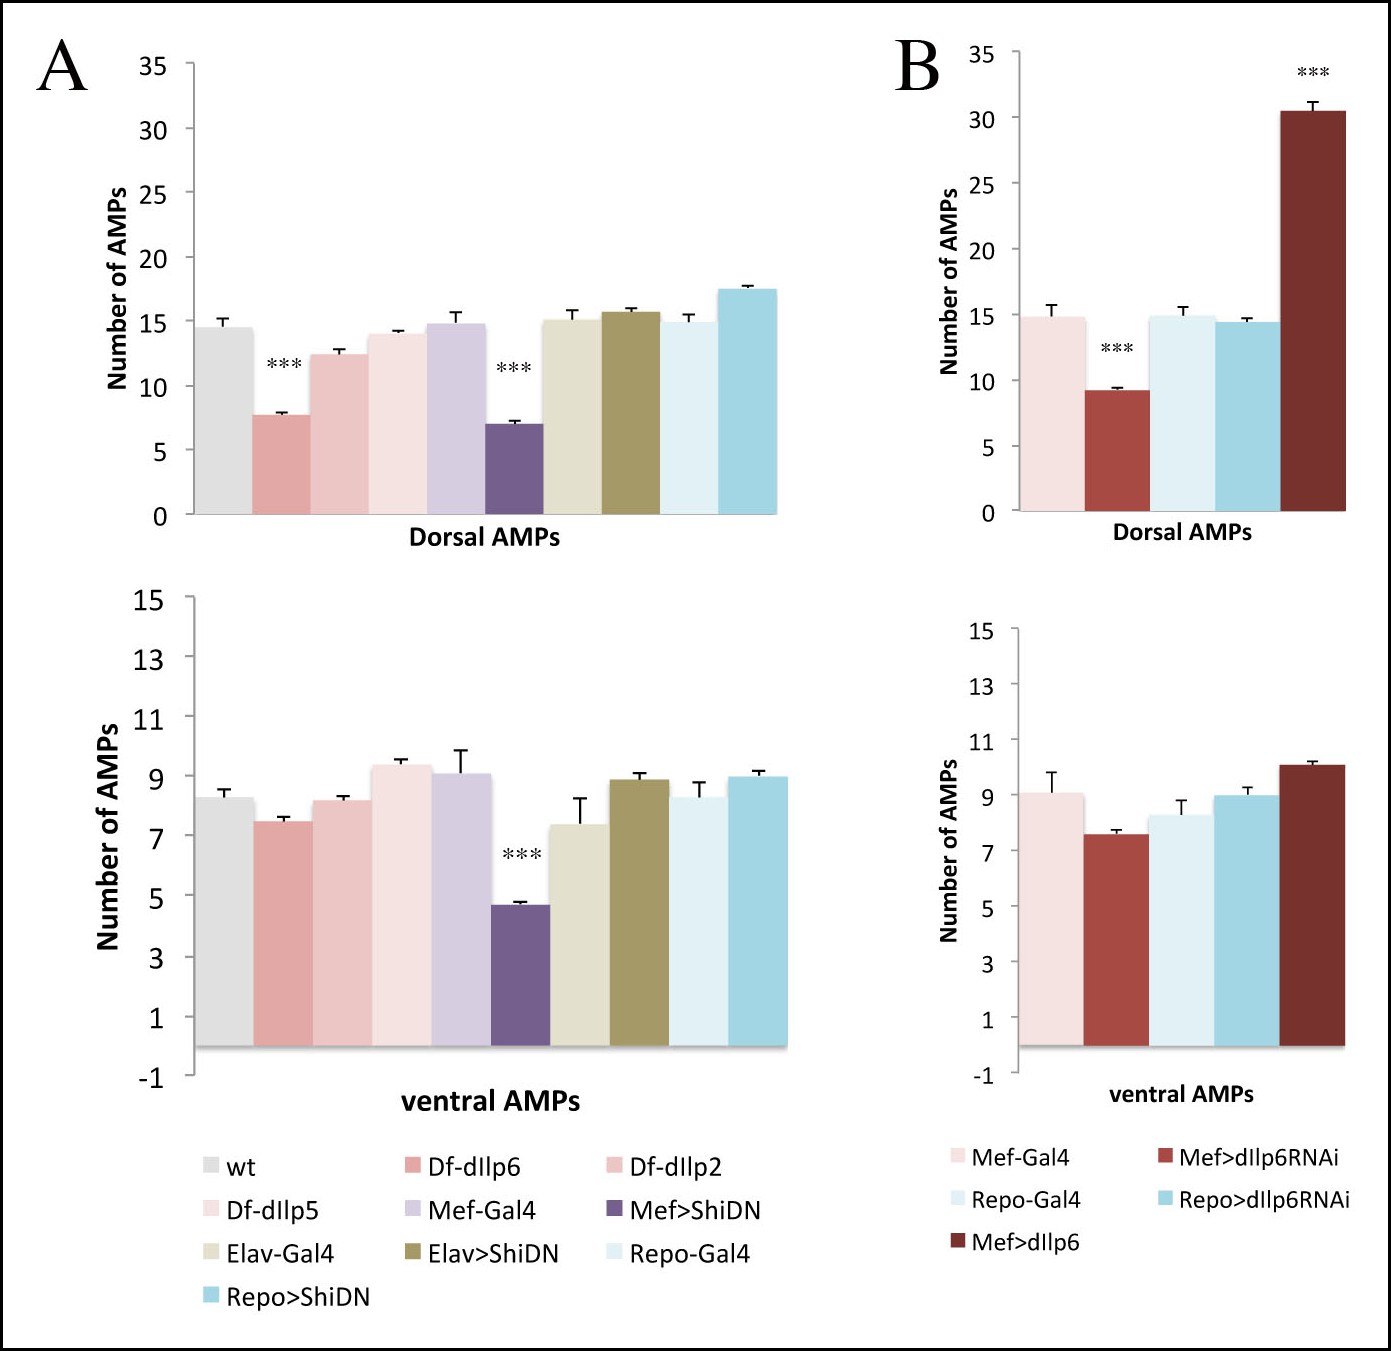
Muscle released dIlp6 is required for the activation of dorsal and lateral but not ventral AMPs.
(A, B) Graphical representation of mean number of AMPs from the dorsal and ventral abdominal groups of mid third-instar larvae for the genotypes shown in Figure 7A–L. Notice that muscle released signal is required for activation of both dorsal and ventral AMPs; however, dIlp6, which is required for Insulin pathway activation in lateral and dorsal AMPs, has no effect on ventral AMPs. (***) indicates P≤0.001. P-values were computed using t test and Prism software with different control samples: wt (Canton S) for dIlp deficiencies, Mef-Gal4 for Mef-driven genotypes, Elav-Gal4, for Elav-driven genotypes, and Repo-Gal4 for Repo-driven genotypes.
Figure 8
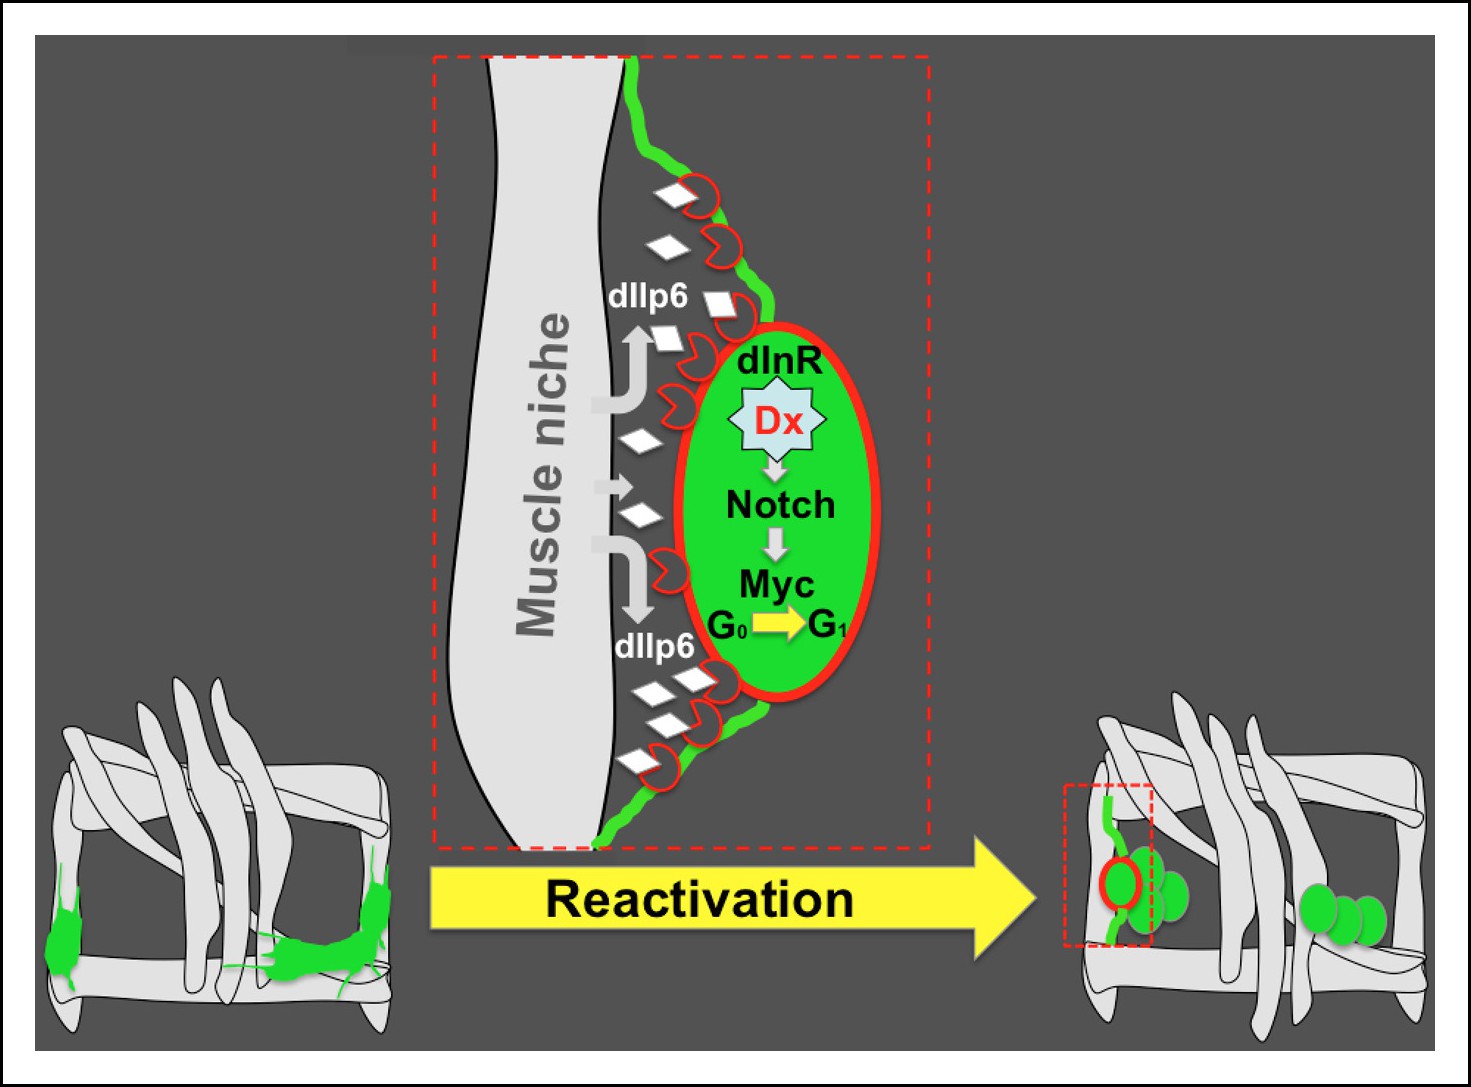
Niche role of muscle in AMP reactivation.
Scheme illustrating the muscle niche-induced Insulin/Notch/dMyc cascade governing the reactivation of dormant AMPs. During embryonic stages, quiescent AMPs send out filopodia and make contact with neighboring muscles. These AMP-to-muscle ties persist until the AMPs are reactivated at mid-second larval instar, facilitating the reception of the inductive dIlp6 signal emitted by the muscle niche. In reactivated AMP (depicted in red), activation of the Insulin pathway leads to a Deltex-involving activation of Notch and induces AMP proliferation through the Notch target Myc.
Videos
Video 1
A 3D-reconstruction of the lateral AMPs and surrounding muscles of the stage 15 embryos M6-gapGFP; Duf-GAL4; UAS-mCD8mCherry embryos.
Note that all the small filopodia sent by AMPs (green) connect to the muscles (red).
Video 2
AMPs localization with respect to external/internal muscle layers in stage 14 embryo.
A Z-stack movie of M6-gapGFP embryos stained for muscles (β3-tubulin - magenta) and AMPs (GFP - green). The ventral, lateral, dorso-lateral and dorsal AMPs have distinct internal/external locations. The lateral AMPs (lAMPs) extend from the external to internal layer. The posterior lAMP (arrowhead) lies the most externally and is seen at the same optical level that the external lateral muscles (ExtLM: LT muscles). The anterior lAMP (arrow) lies more internally, mainly at the level of internal lateral muscles (IntLM: LO1 and SBM). The ventral AMPs (vAMPs) are located in between external ventral muscles (ExtVM: VA1 and VA2) and intermediary ventral muscles (ImVM: VO3-VO6) but they send cellular extensions externally and are seen at the level of VA1 and VA2. The dorso-lateral AMPs (dlAMPs) are clearly located under the external DT1 and lie mainly in between the intermediary dorsal muscles (InDM: DO3 and DO4) and internal dorsal muscles (IntDM: DA3). Finally, the dorsal AMPs (dAMPs) are located in between the external (ExtDM: DO1 and DO2) and internal dorsal muscles (IntDM: DA1, DA2). Note: view movie frame by frame to appreciate AMPs positioning and to see corresponding annotations.
Video 3
AMPs localization with respect to external/internal muscle layers in stage 15 embryo.
A Z-stack movie of M6-gapGFP embryostained for muscles (β3-tubulin - magenta) and AMPs (GFP - green). Refer to the legend of Video 2. Note: view movie frame by frame to appreciate AMPs positioning and to see corresponding annotations.
Video 4
Lifetime imaging of AMPs filopodia dynamics.
A lateral view of M6-gapGFP stage 15 embryo is shown. Z-stacks were taken each 1 min during the period of 35 min. The filopodia of lateral AMPs from one segment were annotated. To follow the number of filopodia and the direction of their projection we labeled the extremities of all filopodia at each time point (indicated by yellow open circles). We found that the lateral AMPs send filopodia non-randomly in directions, which correlate with location of muscles to which they are connected by stage 16. We observed that 6 to 9 filopodia are visible at each time point. Some of filopodia appear more stable than others (indicated by arrowheads). Filopodia projecting in dorsal direction (denoted by the arrowhead) does not acquire stable state. Note: A frame by frame viewing of the movie will allow to count number of filopodia per time point and appreciate filopodia extension and retraction events.
Video 5
αPS1 integrin decorates AMP cell bodies and filopodia projections.
Two-channel Z-stack movie showing punctate decoration of lateral AMPs by αPS1 integrin at embryonic stage 16. The AMP cell bodies (arrowheads) and filopodia-associated αPS1 dots (arrows) are annotated.
Video 6
αPS1 integrin decorates AMP cell bodies and filopodia projections.
Three-channel Z-stack movie showing punctate decoration of lateral AMPs by αPS1 integrin at embryonic stage 16. The AMP cell bodies (arrowheads) and filopodia-associated αPS1 dots (arrows) are annotated. Note: view Videos 5 and 6 movies in parallel and frame by frame to follow αPS1 dots associated with the AMPs and corresponding annotations.
Download links
A two-part list of links to download the article, or parts of the article, in various formats.
Downloads (link to download the article as PDF)
Open citations (links to open the citations from this article in various online reference manager services)
Cite this article (links to download the citations from this article in formats compatible with various reference manager tools)
Muscle niche-driven Insulin-Notch-Myc cascade reactivates dormant Adult Muscle Precursors in Drosophila
eLife 4:e08497.
https://doi.org/10.7554/eLife.08497


