Dynamics and heterogeneity of a fate determinant during transition towards cell differentiation
- Northwestern University, United States
- Howard Hughes Medical Institute, University Northwestern, United States
- University of Chicago, United States
Figures
Figure 1 with 4 supplements
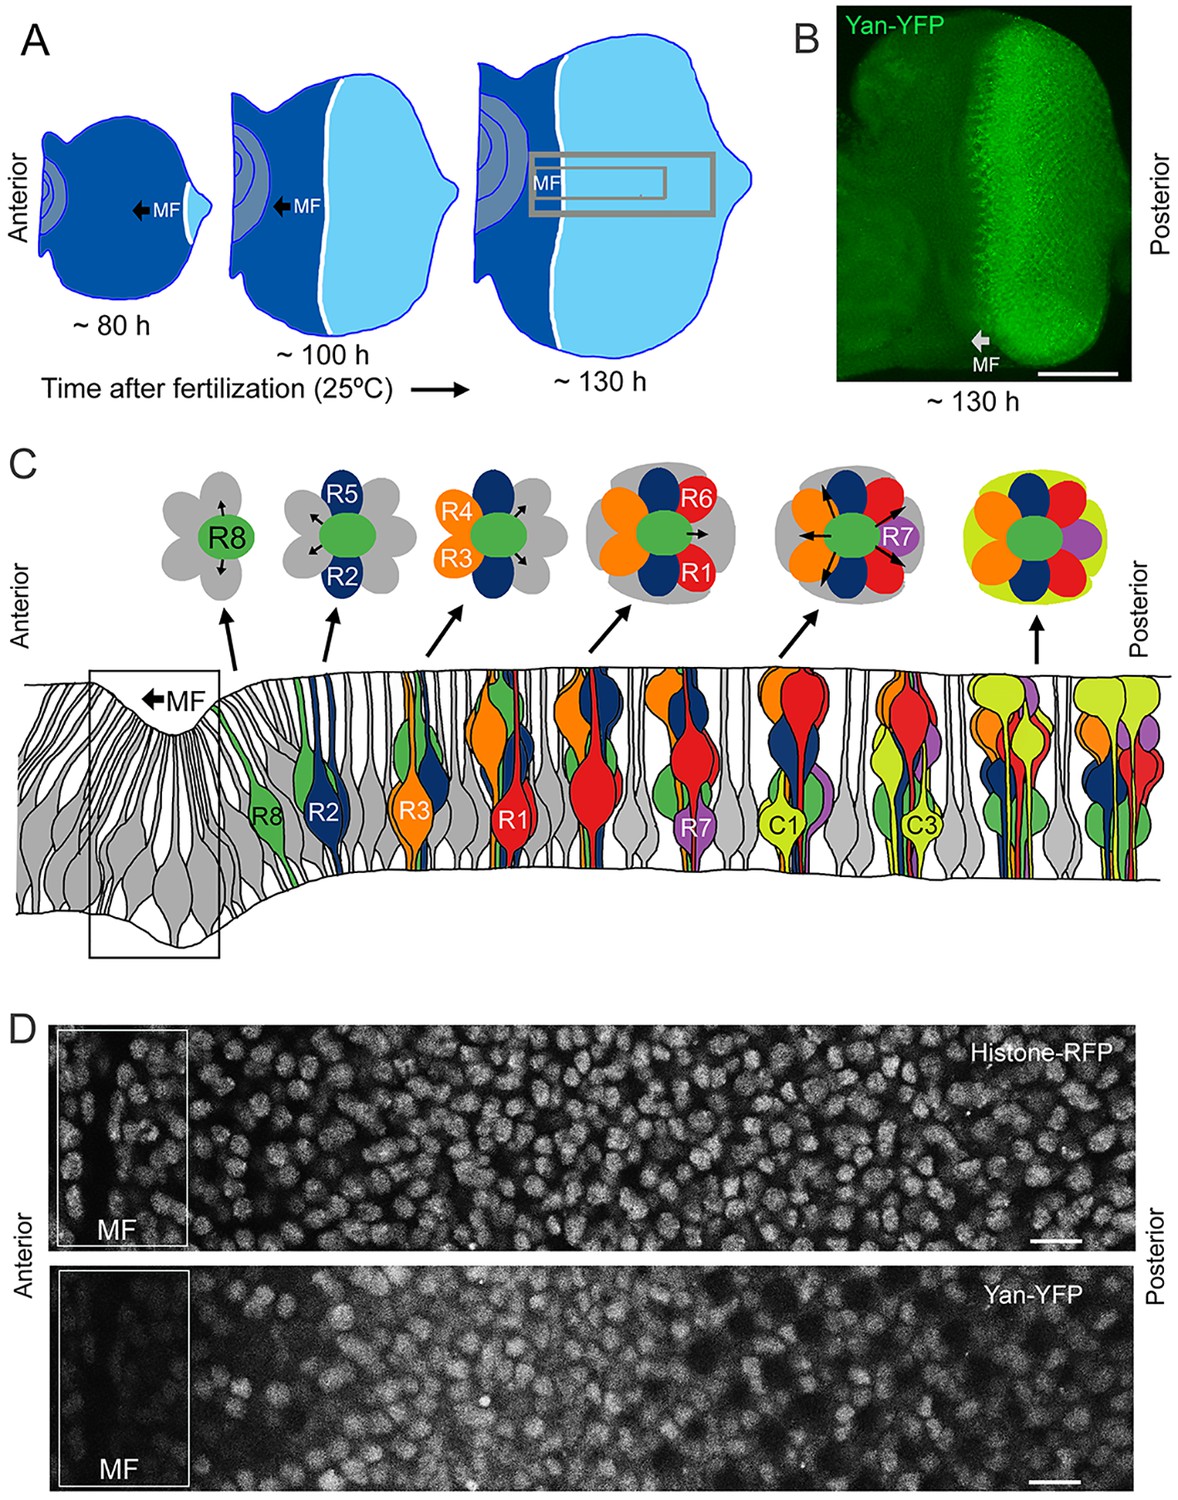
Development and patterning of the compound eye.
(A) Differentiation is initiated in the developing eye by the MF, which moves across the eye epithelium. On the furrow’s posterior side, G1-arrested progenitor cells undergo differentiation (light blue). On the anterior side, progenitor cells are still proliferating (dark blue). The large grey rectangle outlines the region that was analyzed for Yan levels; the small rectangle corresponds to the developmental sequence outlined in panel C (B) A maximal projection of Yan-YFP fluorescence in an eye. Bar = 100 μm. (C) Top, an apical view of the sequential differentiation of eight photoreceptor (R1-R8) and four cone cell types (C1-C4) from multipotent progenitor cells (grey) in an ommatidium. Arrows denote inductive signal transmitted from the R8 to activate EGFR on nearby cells. Bottom, a cross-section view through an eye disc adapted after Wolff and Ready (1993). Note the progenitor cell nuclei are basally positioned, and as they transition into a differentiated state, their nuclei migrate apically. C1/C2 cells are positioned anterior and posterior in the ommatidium while C3/C4 cells are positioned equatorial and polar in the ommatidium. (D) Top, an optical slice of H2Av-mRFP fluorescence in an eye disc at a plane that bisects progenitor cell nuclei. Bottom, the same optical slice imaged for Yan-YFP fluorescence. Bars = 8 μm.
Figure 1—figure supplement 1
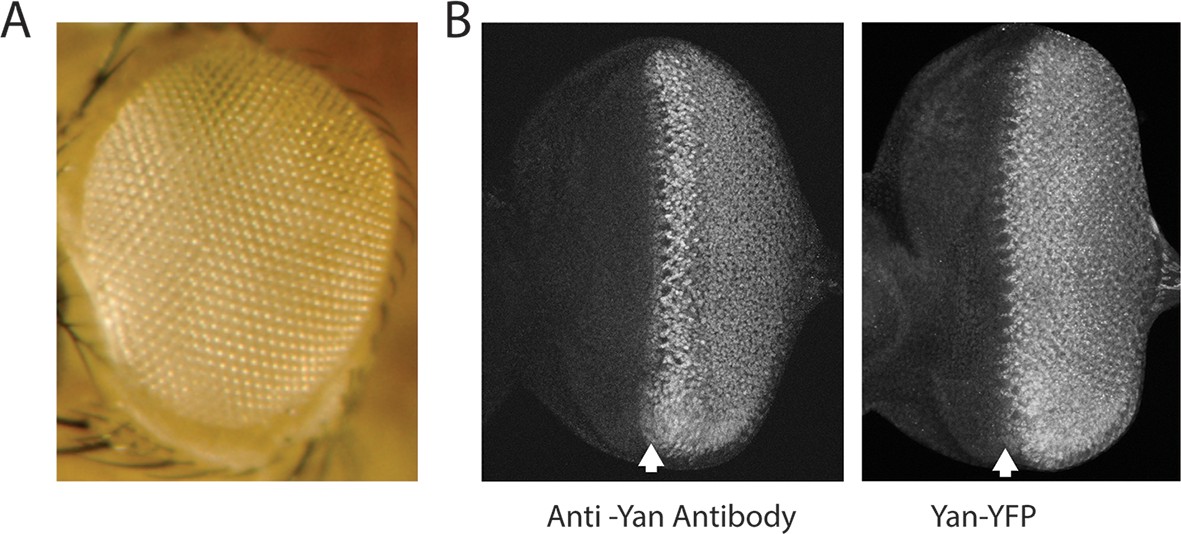
Expression and activity of the Yan-YFP transgene.
Anterior is to left. (A) Adult eye of animal carrying the Yan-YFP transgene in a yan null mutant background (yanER443/yanE884). (B) Anti-Yan fluorescence pattern (left) compared to Yan-YFP fluorescence pattern (right) in eye imaginal discs. Arrows mark the MF.
Figure 1—figure supplement 2

Segmentation and identification of cell nuclei in eye discs.
(A) An optical section of His2Av-mRFP fluorescence after nuclear segmentation. Segmented contours are shown in yellow, and the inset shows a magnified view of the region bounded by white rectangle. (B) Same optical section as in A with both His2Av-mRFP (red) and Yan-YFP (green) fluorescence shown. (C) An optical section with ID labels assigned to certain nuclei. These labels are stored with the data records for the relevant segmented nucleus. Anterior is to left.
Figure 1—figure supplement 3
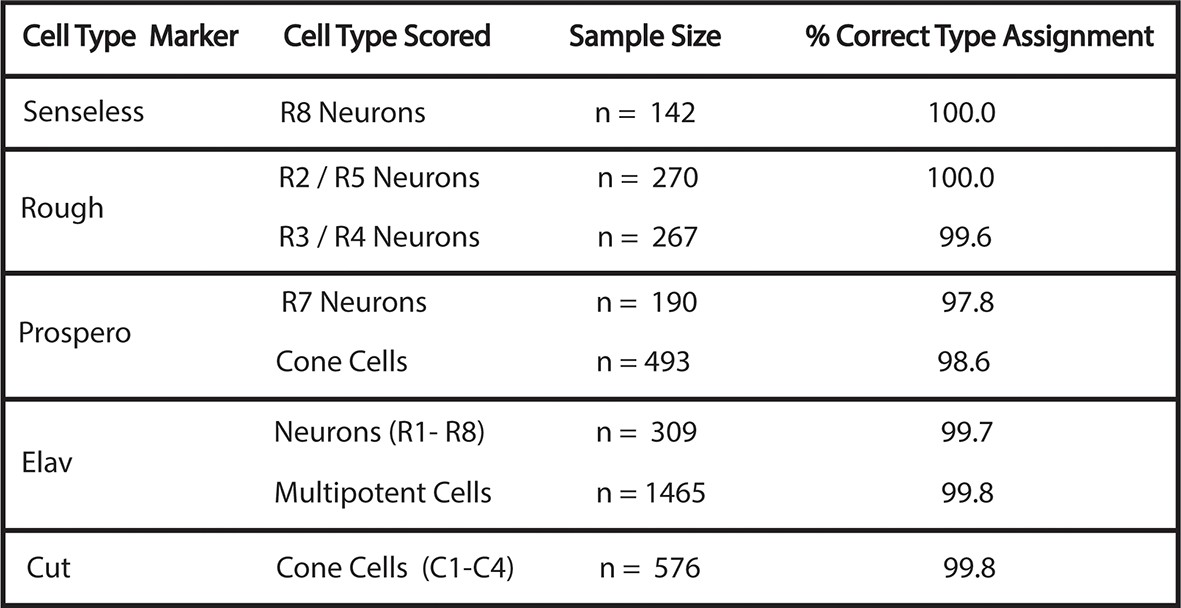
Accuracy of cell-type identification.
Cells were identified by nuclear position and shape in the His2Av-mRFP channel with the marker protein channel turned off. Identifications were then compared to the cell-type specific markers, as noted. Percentage of correctly identified cells is listed. Multipotent cells are Elav-negative cells that are not cone cells.
Figure 1—figure supplement 4
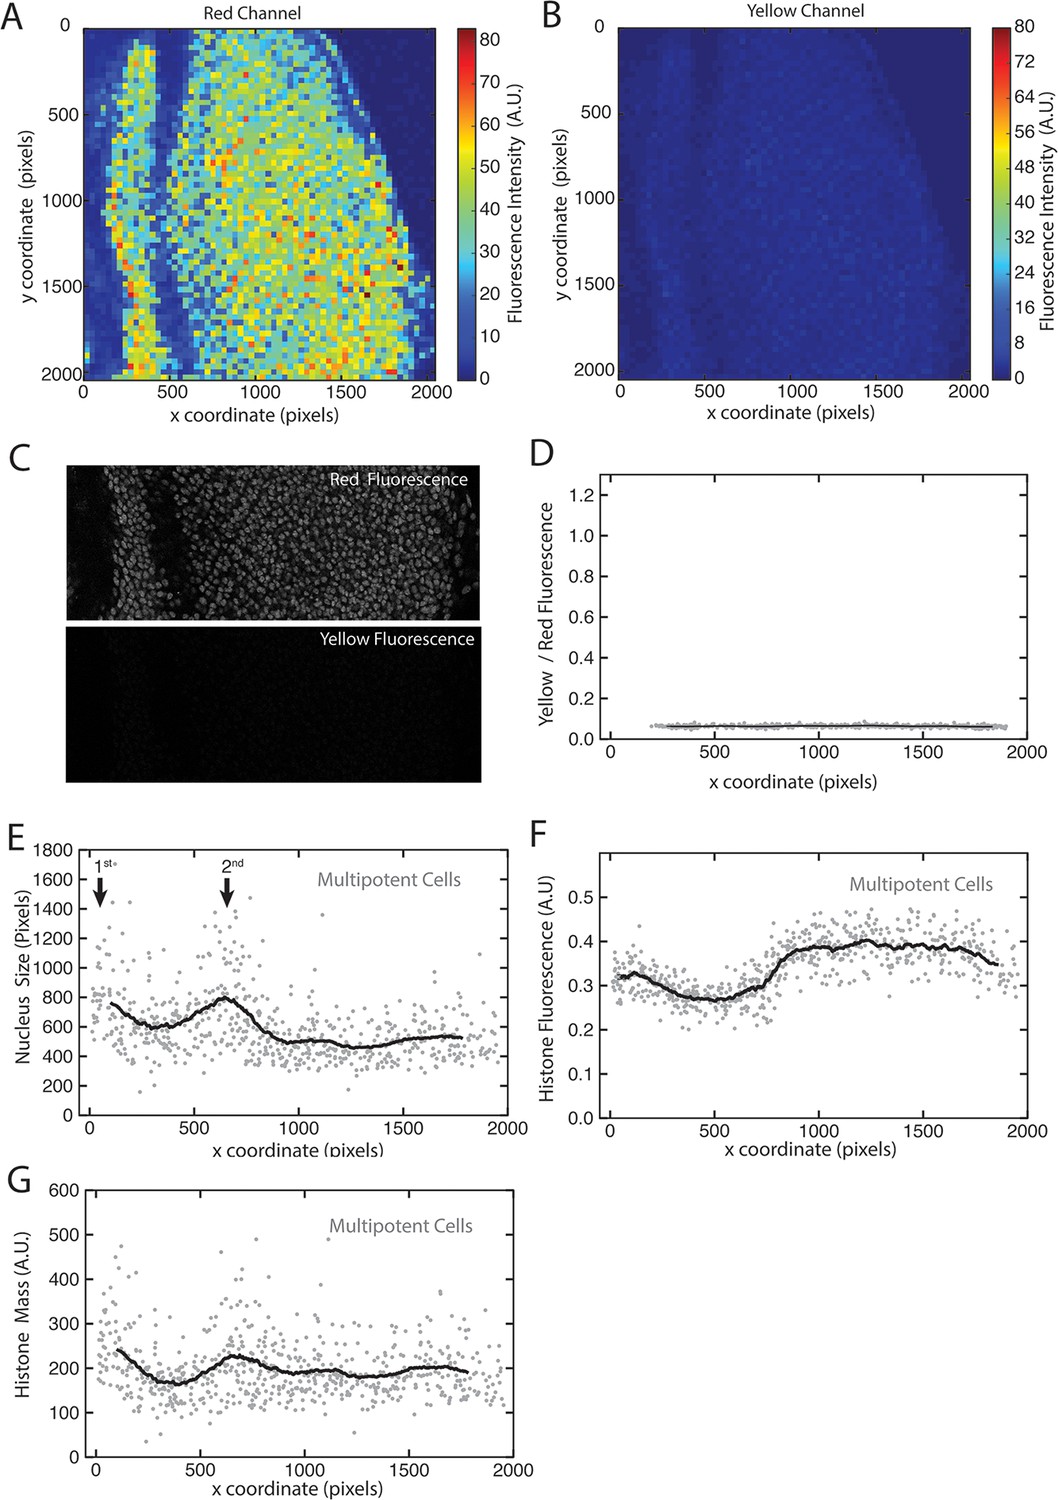
His2Av-mRFP fluorescence properties.
(A,B) Heat maps of fluorescence intensities in the red (A) and yellow (B) channels for an optical section of a disc expressing only His2Av-mRFP. Intensities are averaged in bins of 32 x 32 pixels (approximate size of a nucleus) across the image. (C) The region of interest within a His2Av-mRFP expressing disc imaged in red and yellow channels. (D) The ratio of yellow-to-red fluorescence within segmented nuclei from a His2Av-mRFP eye disc. (E-G) Multipotent cells in a representative His2Av-mRFP eye disc that has been segmented and analyzed for nuclear size (E) and His2Av-mRFP fluorescence intensity (F). Anterior is to the left. Arrows mark first and second mitotic waves. (G) Total His2Av-mRFP fluorescence within each segmented nucleus that is the product of fluorescence intensity and nuclear size.
Figure 2 with 1 supplement
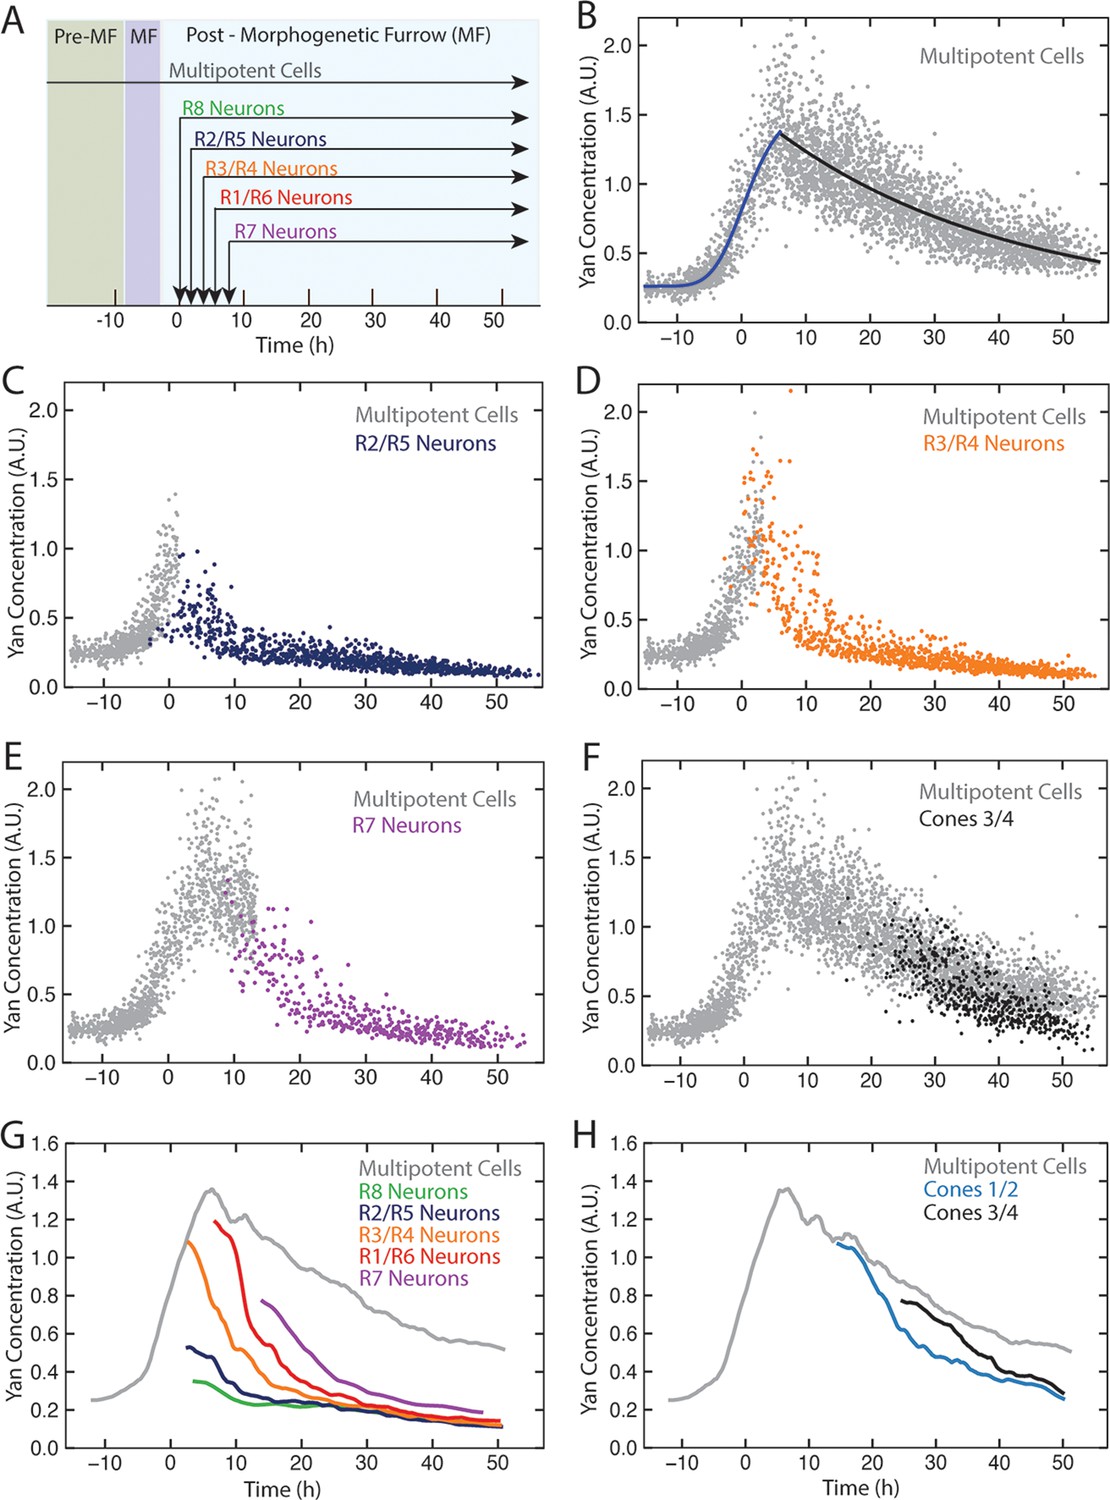
Dynamics of Yan-YFP in eye cells.
(A) Average time at which initiation of differentiation is first detected by apical migration of committing cell nuclei. Time zero is set to when R8 differentiation initiates. Differentiation proceeds over a time course after commitment is initiated (horizontal arrows) (B) Yan-YFP fluorescence in multipotent progenitor cells. We fit a Hill function (blue curve) to the inductive phase and an exponential decay (black curve) to the decay phase. (C-F) Scatter plots of Yan-YFP levels in individual cells for R2/R5 (C), R3/R4 (D), R7 (E), and C3/C4 (F) cells. These are overlaid with scatter plots of Yan-YFP in multipotent cells at times preceding and coincident with the appearance of the relevant differentiated cells. Note the similar Yan-YFP levels between multipotent cells and differentiating cells at their first appearance. (G) Moving averages of Yan-YFP levels for multipotent and photoreceptor cells. Gaps between the multipotent and photoreceptor curves are due to the window size for line averaging. (H) Moving averages of Yan-YFP in multipotent and cone cells.
Figure 2—figure supplement 1
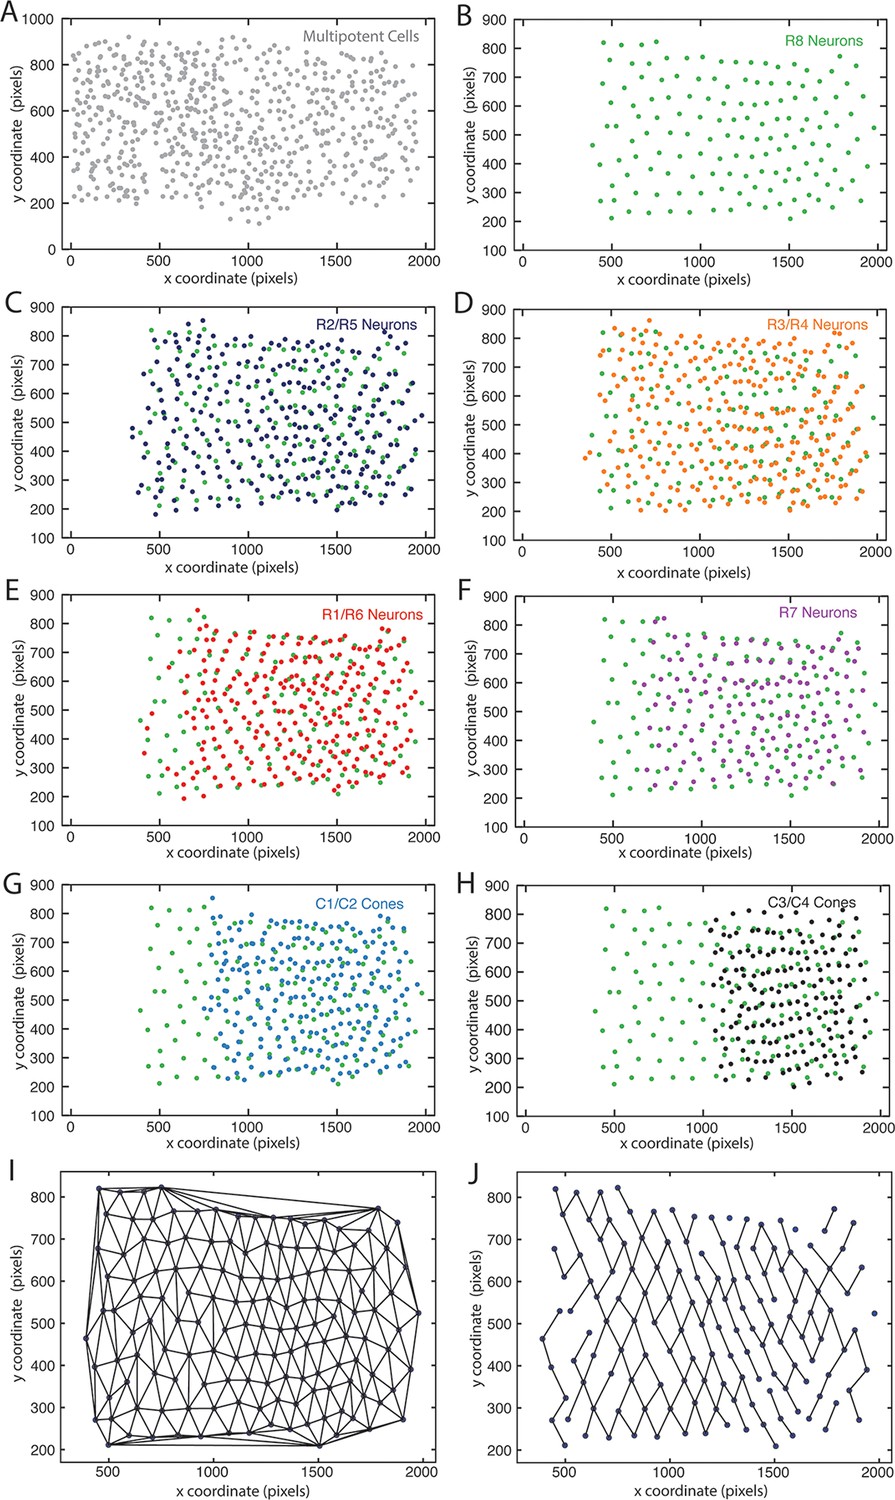
Mapping identified nuclei within XY space of eye discs.
Anterior is to left for each panel. (A–H) Maps of identified nuclei in an eye disc. Progenitor cell nuclei (A); R8 cell nuclei (B–H); R2 and R5 cell nuclei (C); R3 and R4 cell nuclei (D); R1 and R6 cell nuclei (E); R7 cell nuclei (F); C1 and C2 cone cell nuclei (G) C3 and C4 cone cell nuclei (H). (I,J) Delauney triangulation of R8 nuclei centroids within a representative eye disc from panel B. The complete triangulation network of R8 nodes (I); the network in which links are retained for nodes that are closest to one another along the x-axis (J).
Figure 3 with 1 supplement
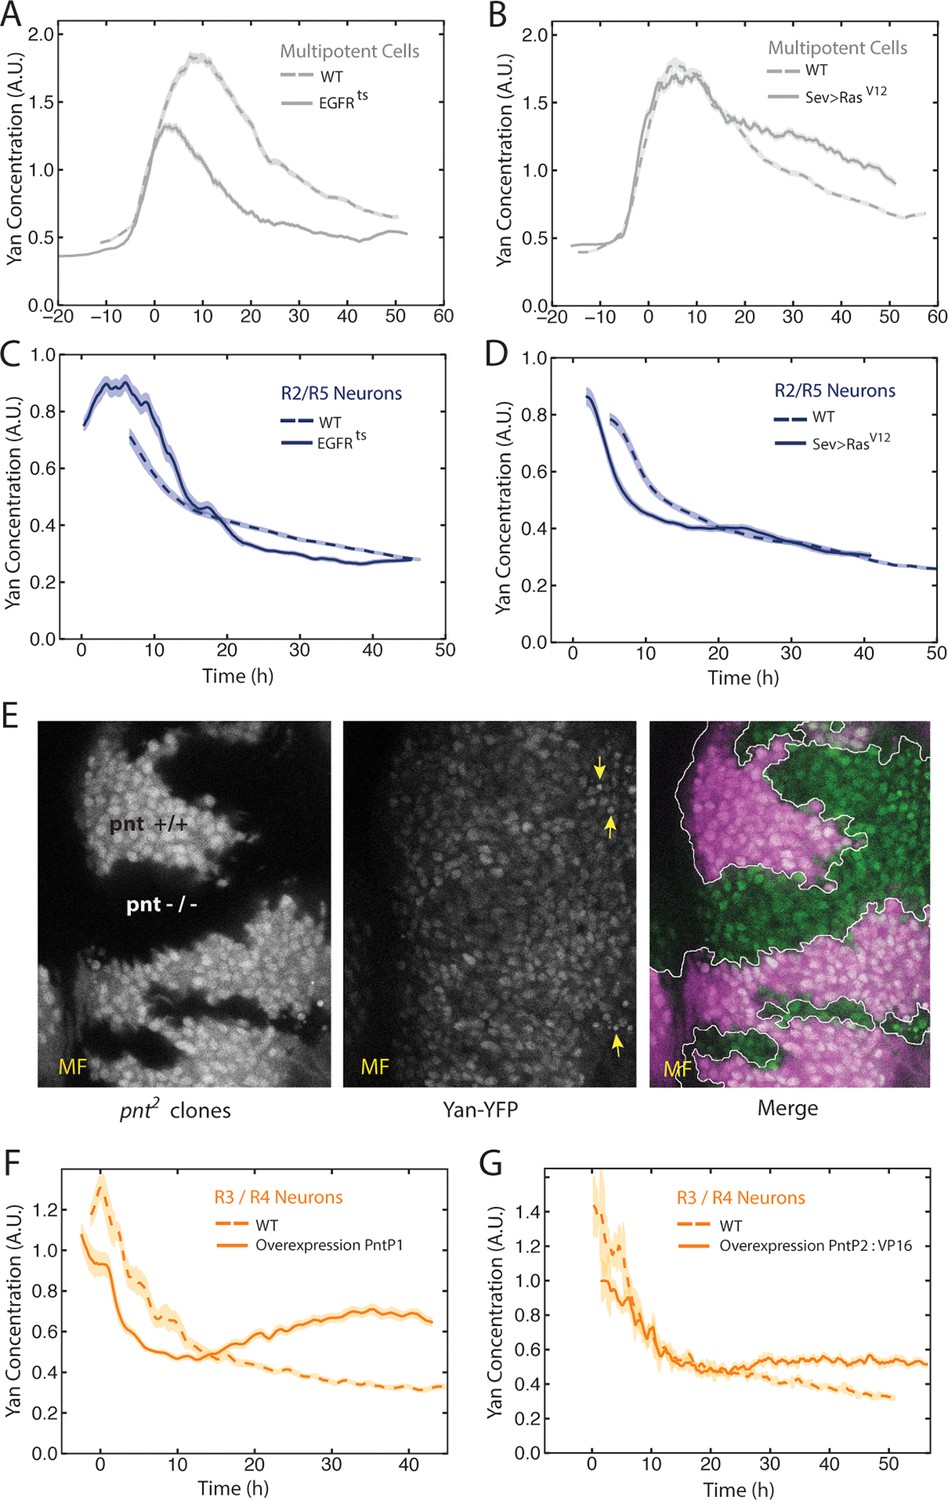
EGFR/Ras and Pnt regulate Yan-YFP levels.
(A–D) Moving averages of Yan-YFP in different cell types. Shown with shading is the standard error of the mean for each moving average. (A,C) Wildtype and EGFRts mutants incubated at the non-permissive temperature and analyzed for progenitors (A) and R2/R5 cells (C). (B,D) Wildtype and sev>Rasv12 mutants were analyzed for progenitors (B) and R2/R5 cells (D). (E) Optical slice through progenitor cell nuclei in a disc that contains clones of pnt2 mutant cells. Left, fluorescence of RFP, which positively marks wildtype cells and not pnt2 mutant cells. Middle, Yan-YFP fluorescence, showing reduced levels in pnt2mutant clones. Arrows highlight apoptotic nuclei. Right, merged image with Yan-YFP in green and RFP in purple. Clone borders are outlined. (F,G) Moving averages of Yan-YFP in R3/R4 cells that ectopically express PntP1 (F) or PntP2-VP16 (G) due to LongGMR-Gal4 driving the UAS transgenes. Since PntP2 requires MAPK phosphorylation to become transcriptionally active, we misexpressed a VP16 fusion of PntP2. PntP1 is constitutively active (Brunner et al., 1994; Gabay et al., 1996).
Figure 3—figure supplement 1
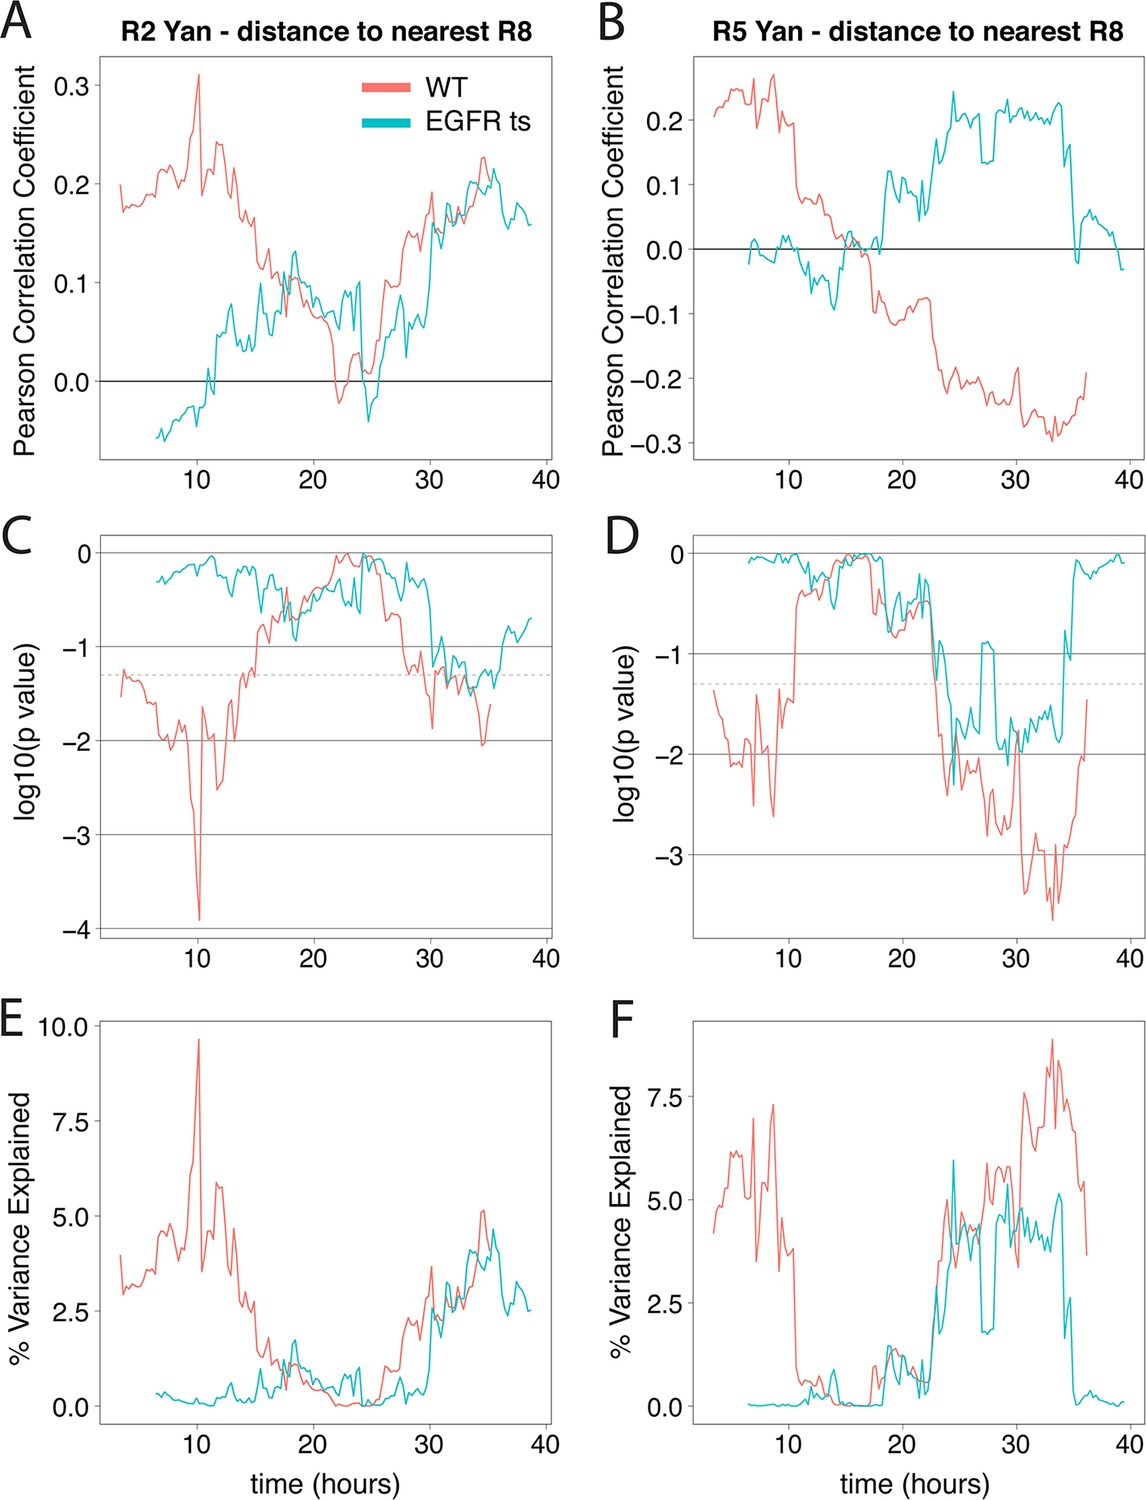
Yan-YFP levels in R2/R5 correlate with distance from R8 cells when EGFR is active.
Correlation between log-transformed detrended Yan-YFP levels in R2 and R5 nuclei and their distances from the nearest R8 nucleus as a function of developmental time. (A,B) The Pearson correlation coefficient obtained in wildtype and EGFRts mutant. (C,D) p value of correlation in wildtype and EGFRts mutant. (E,F) Proportion of variance in R2/R5 levels explained by distance to nearest R8 in wildtype and EGFRts mutant. Values calculated from pooled R2/R5 cells (four wildtype and four EGFRts replicates) within a 12.5 hr window centered on the corresponding developmental time.
Figure 4 with 2 supplements
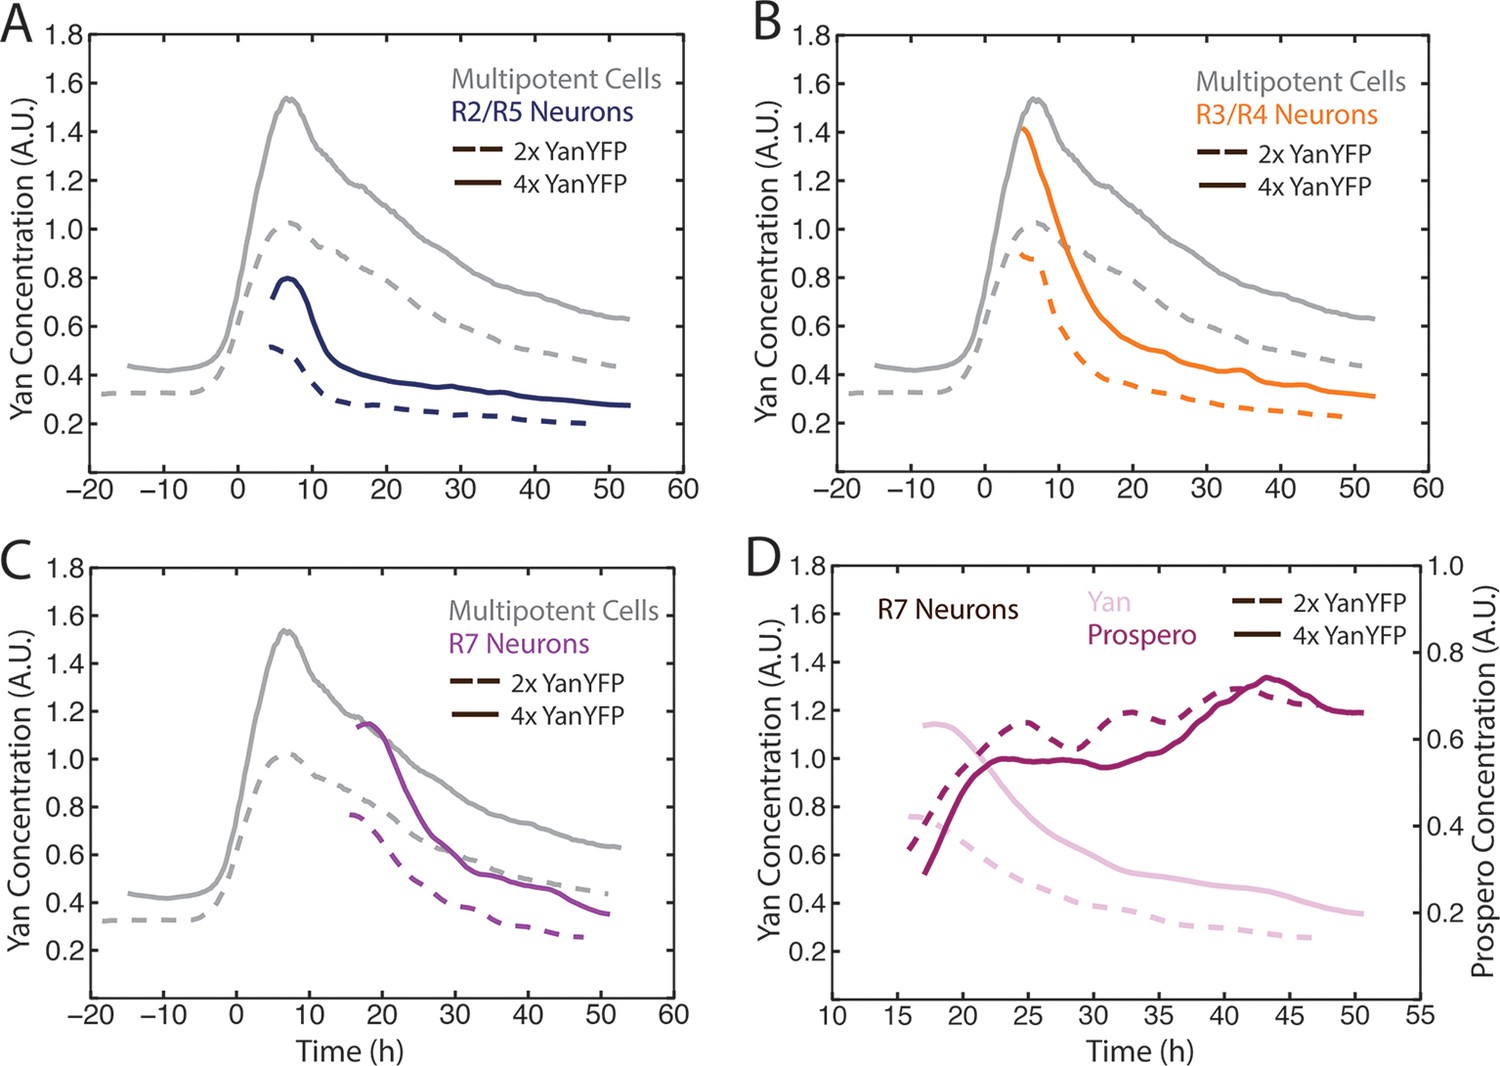
Cell state transitions are unaffected by Yan-YFP gene copy number.
(A–C) Moving averages of Yan-YFP in eye discs containing two versus four copies of the Yan-YFP transgene. (A) R2/R5 and progenitor cells. (B) R3/R4 and progenitor cells. (C) R7 and progenitor cells. (D) Moving averages of Yan-YFP and Pros proteins in R7 cells containing either two vs. four copies of the Yan-YFP transgene.
Figure 4—figure supplement 1
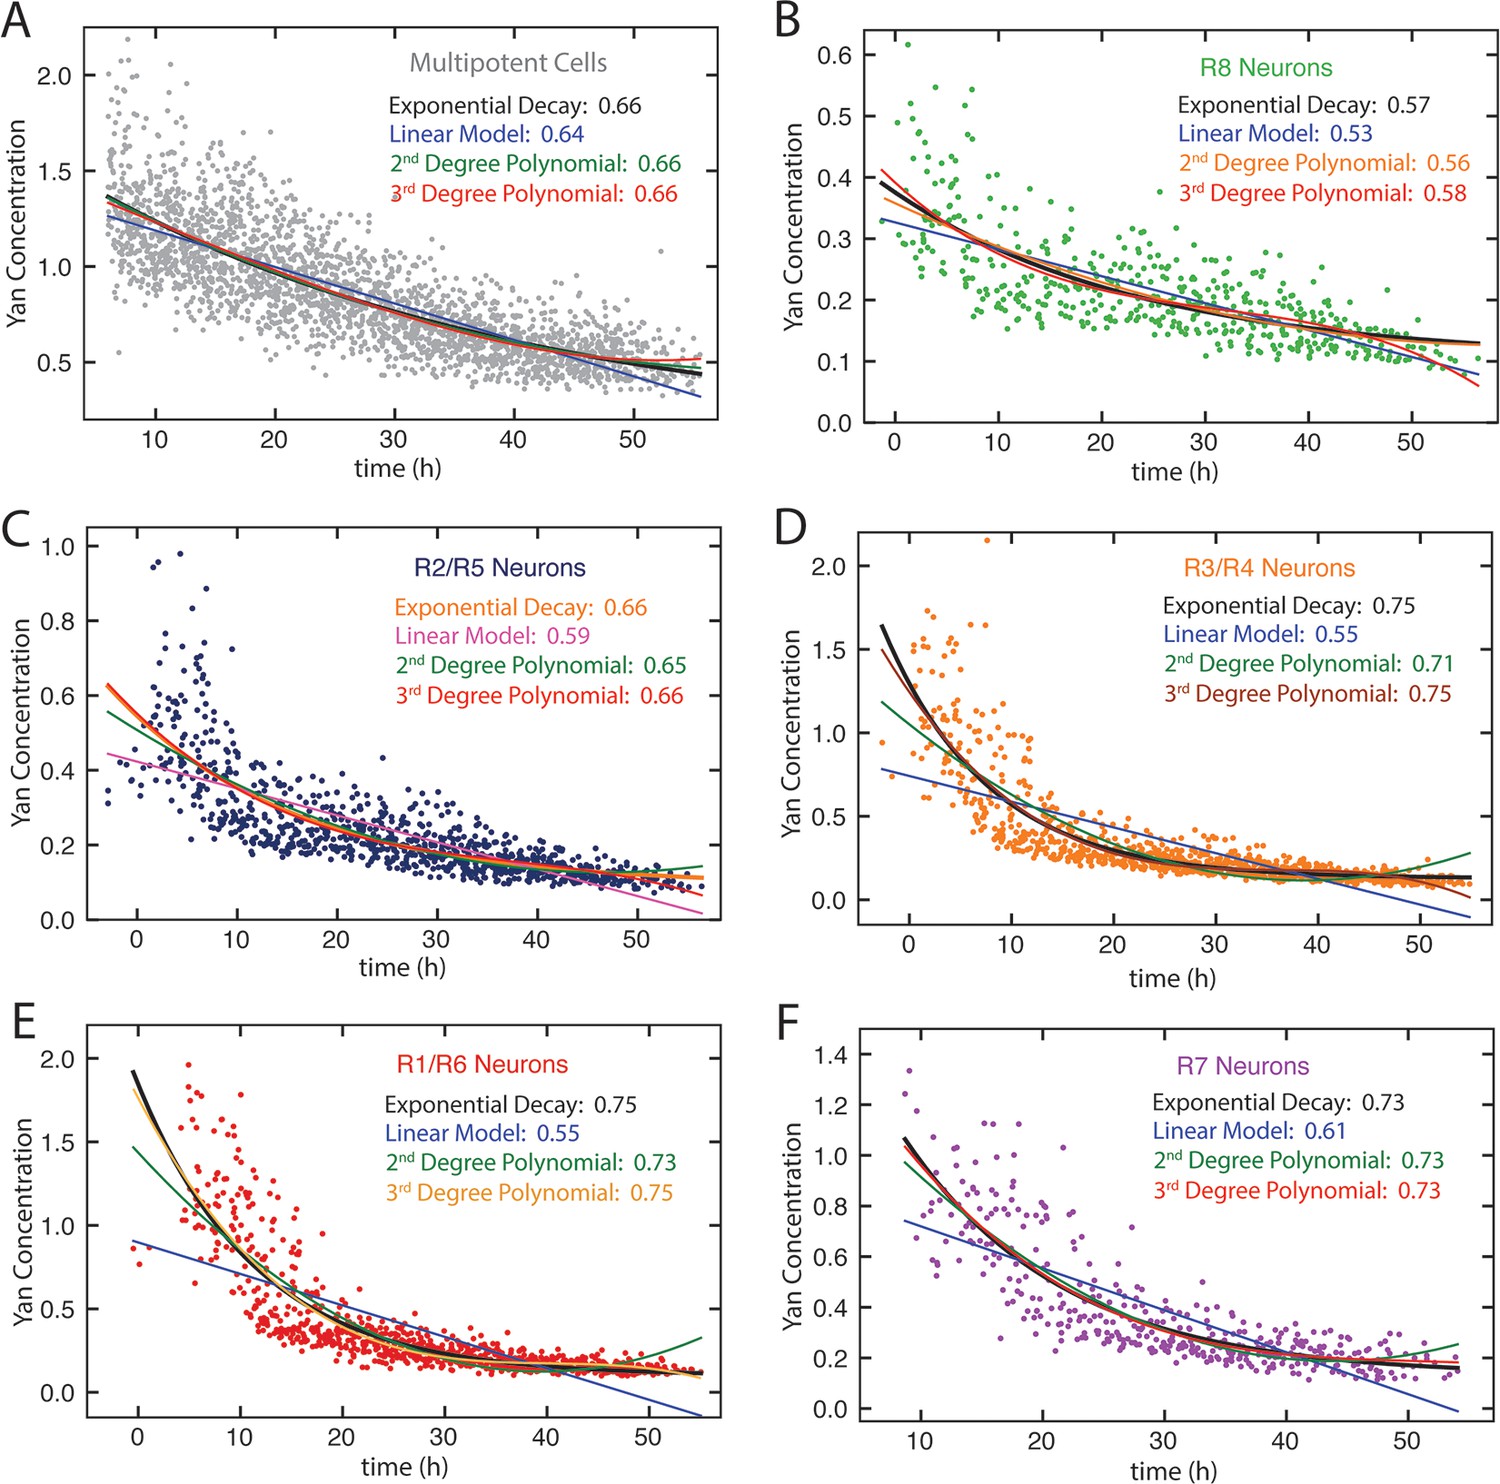
Model fitting Yan-YFP decay in eye disc cells.
(A) Progenitors, (B) R8 cells, (C) R2 and R5 cells, (D) R3 and R4 cells, (E) R1 and R6 cells, (F) R7 cells. For each dataset, four models are shown: linear, exponential, second-order polynomial, and third-order polynomial. R squared values are indicated for each model.
Figure 4—figure supplement 2
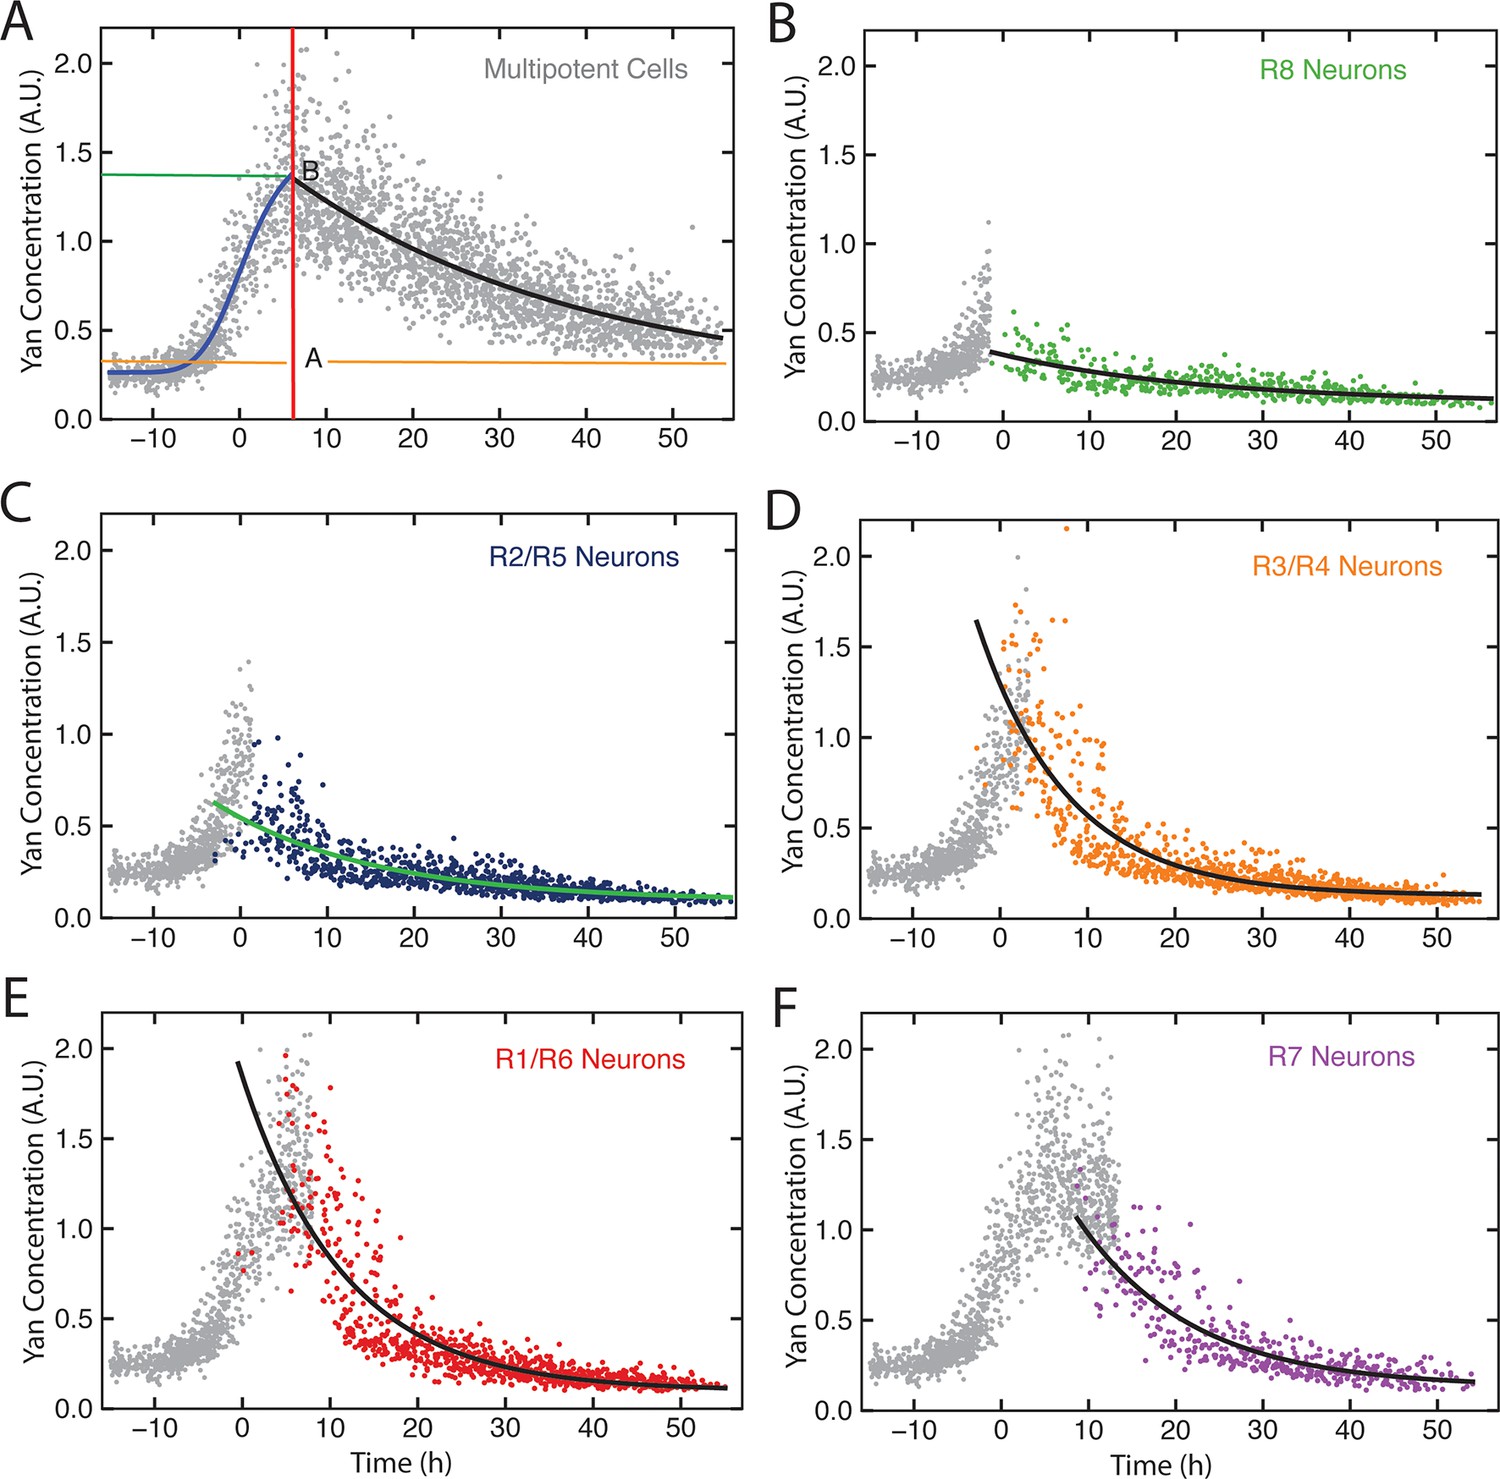
Exponential decay models.
Yan-YFP levels in cells within a representative eye disc. Each cell type is color-coded as indicated. (A) Progenitors with fitted Hill (blue line) and exponential decay functions (black line) overlaid. The green and orange lines label Yan-YFP levels at the start of the decay and at the end (decay asymptote) respectively. The red line outlines the transition from induction to decay. (B-F) Identified photoreceptors are overlaid with the progenitors that precede and coincide with them at the point when the photoreceptors first appear. Best-fit exponential functions for Yan-YFP in photoreceptors are shown.
Figure 5 with 2 supplements
Yan protein half-life is largely unaffected by yan gene copy number.
Exponential decay of Yan-YFP levels. Note the robustness of Yan-YFP half-lives across replicates and yan gene copy number. Note also how half-lives are nearly twice as long for progenitor cells versus photoreceptor neurons.
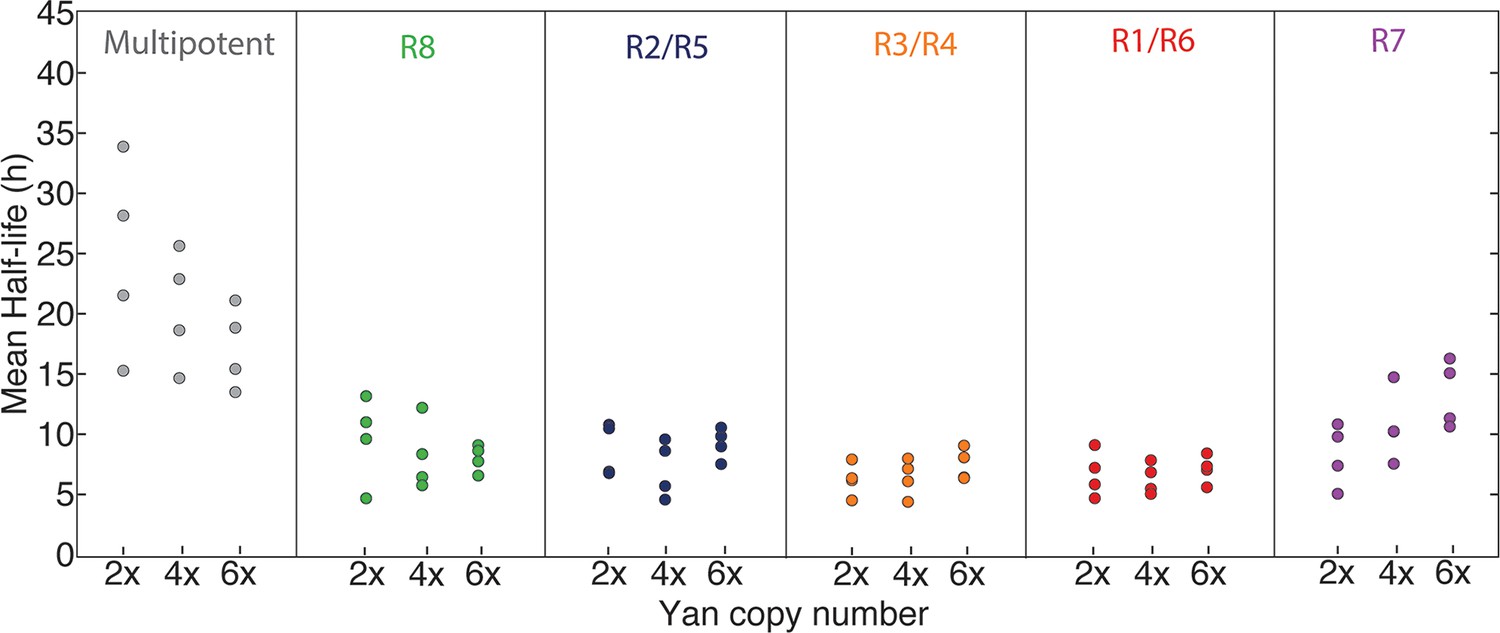
Figure 5—figure supplement 1

Mean half-lives for Yan-YFP decay versus yan gene copy number (2, 4, 6x).
Error bars represent 95% confidence intervals for estimation of the mean. Each estimation of the mean is based on bootstrapping data from one disc sample. Four discs were analyzed for each copy number condition.
Figure 5—figure supplement 2
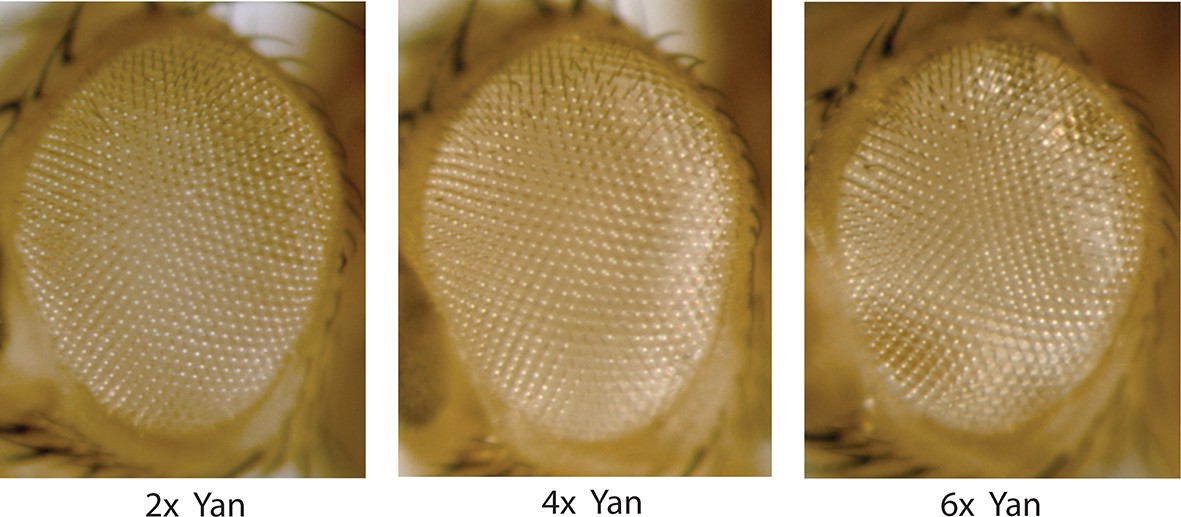
Compound eyes of adults carrying two, four, or six copies of the yan gene.
Anterior is to left.
Figure 6 with 4 supplements
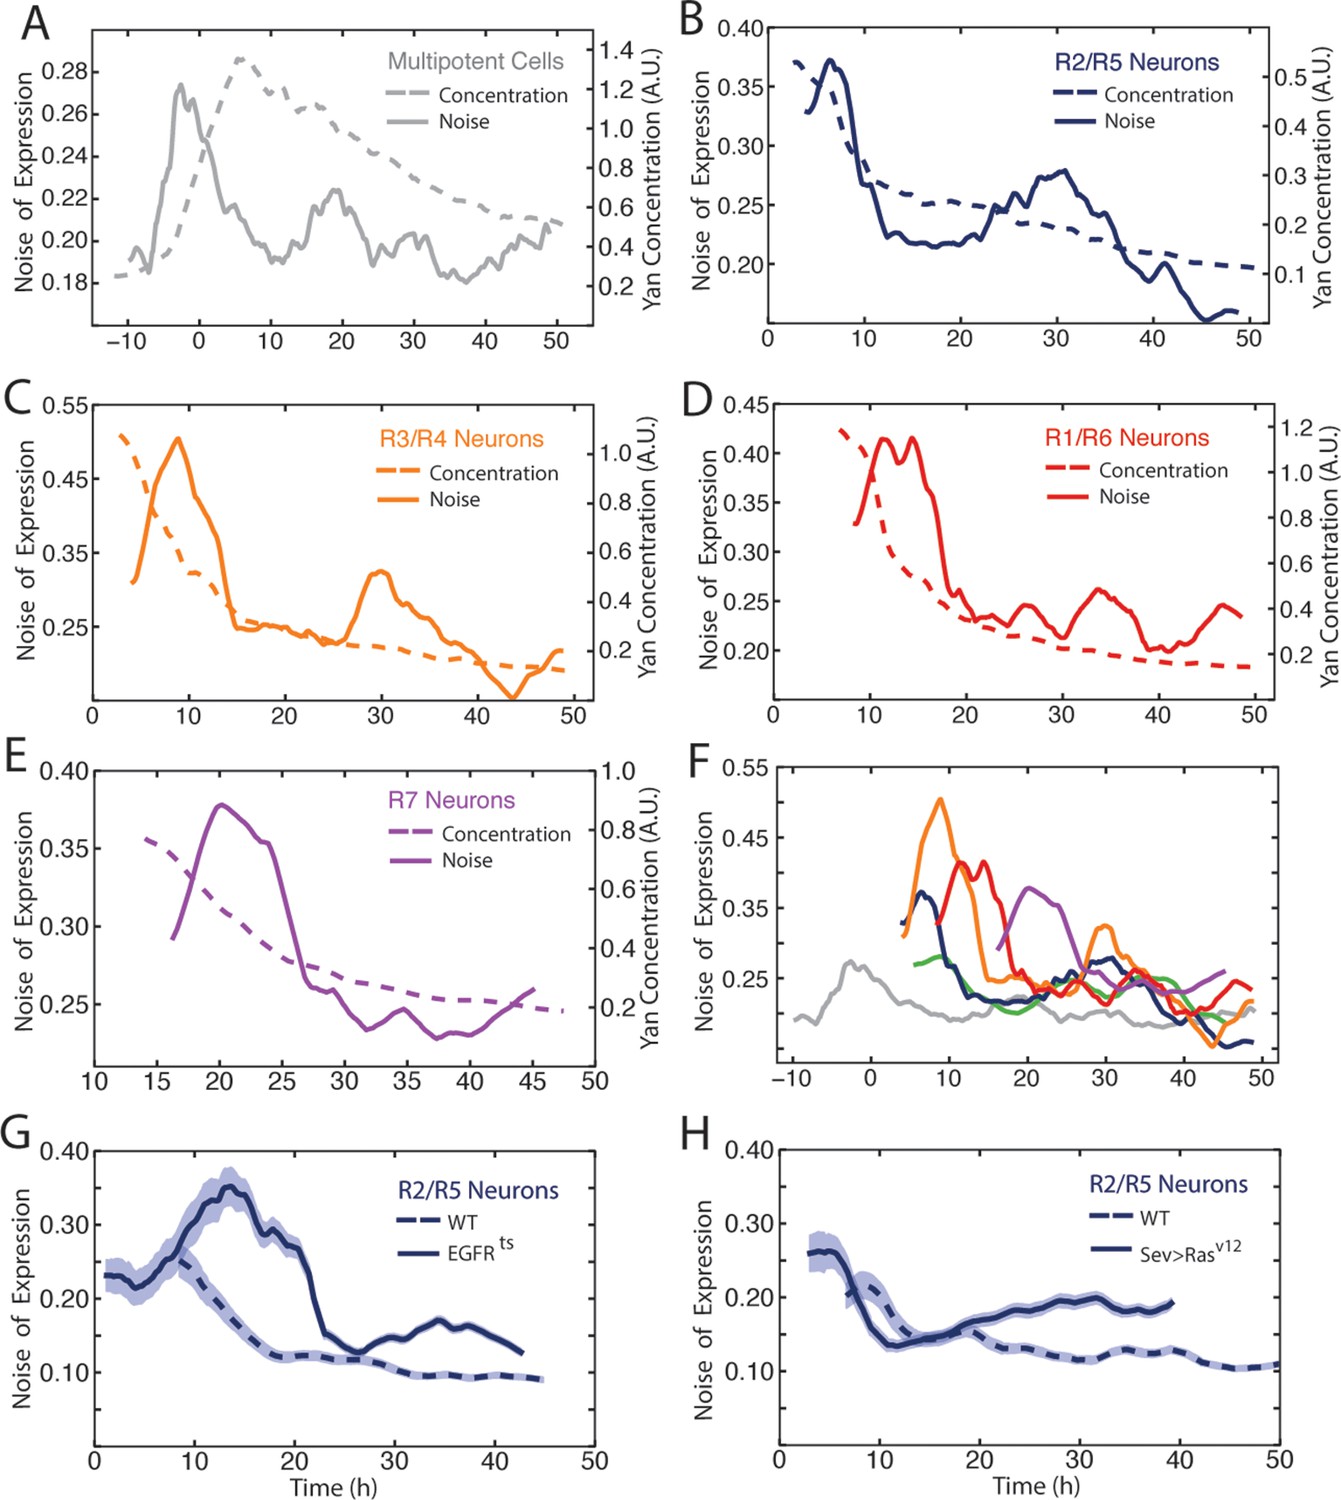
Noise in Yan-YFP expression is highly dynamic.
Moving averages of Yan-YFP levels and noise (detrended fluctuations) for (A) progenitors, (B) R2/R5, (C) R3/R4, (D) R1/R6, and (E) R7 cells. (F) Comparative noise dynamics for all cells analyzed in (A–E). (G) Moving averages of Yan-YFP noise (coefficient of variation) in R2/R5 cells sampled from wildtype and EGFRts mutant eyes at the non-permissive temperature. Shown with shading is the standard error of the mean for each moving average. (H) Moving averages of Yan-YFP noise (coefficient of variation) in R2/R5 cells sampled from wildtype and sev>Rasv12 mutant eyes. Shown with shading is the standard error of the mean for each moving average.
Figure 6—figure supplement 1
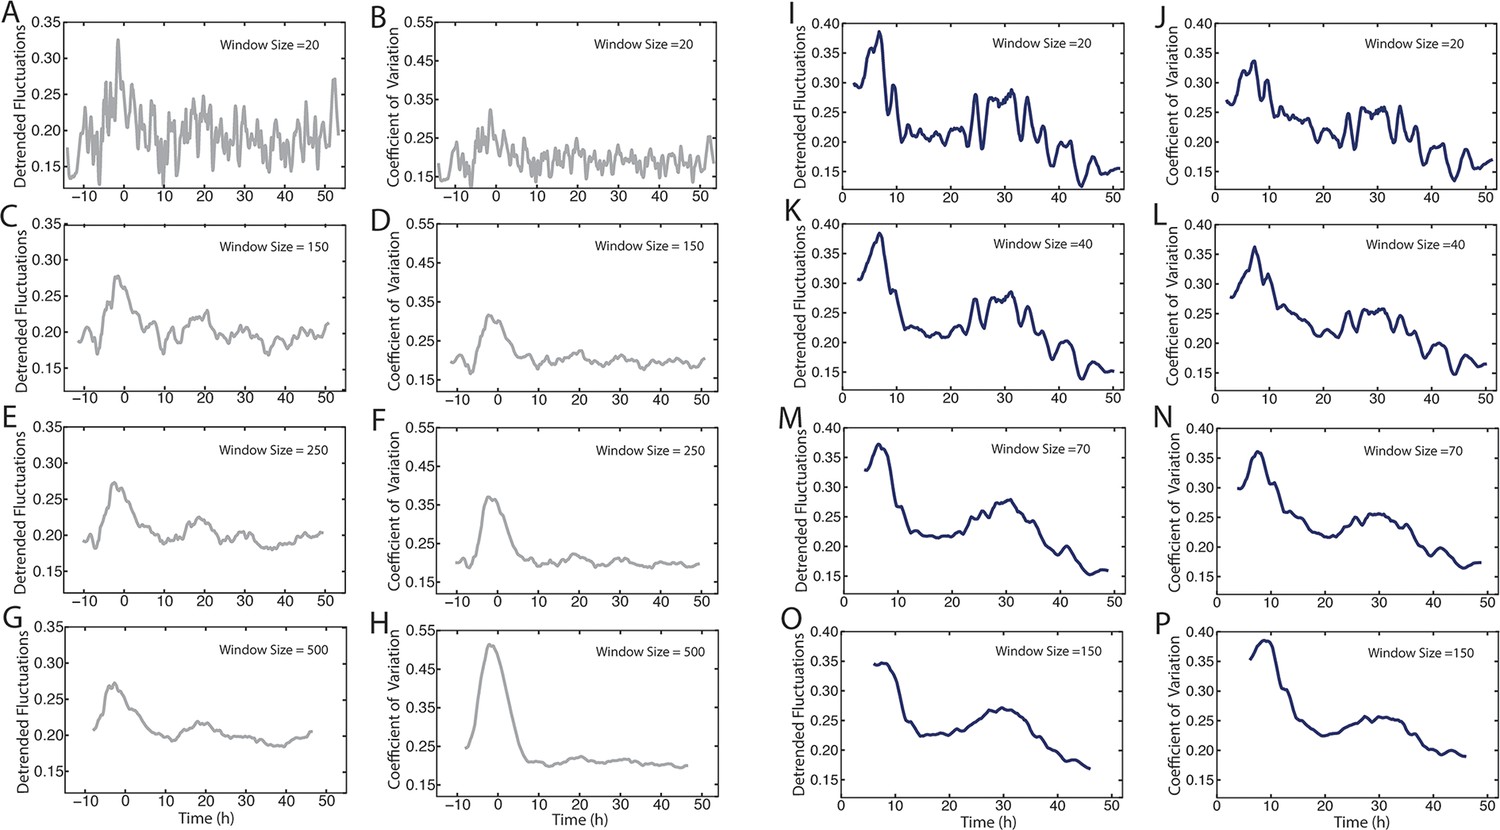
Comparison of methods to measure Yan-YFP noise based on sensitivity to window size.
(A–H) Yan-YFP levels are analyzed in sliding windows of size 20, 150, 250, or 500 progenitor cells. Noise is estimated by detrended fluctuation (A,C,E,G) or coefficient of variation (B,D,F,H) within a sliding window that bins cells. (I–P) Yan-YFP levels are analyzed in sliding windows of size 20, 40, 70, or 150 R2/R5 cells. Noise is estimated by detrended fluctuation (I,K,M,O) or coefficient of variation (J,L,N,P) within a sliding window that bins cells.
Figure 6—figure supplement 2
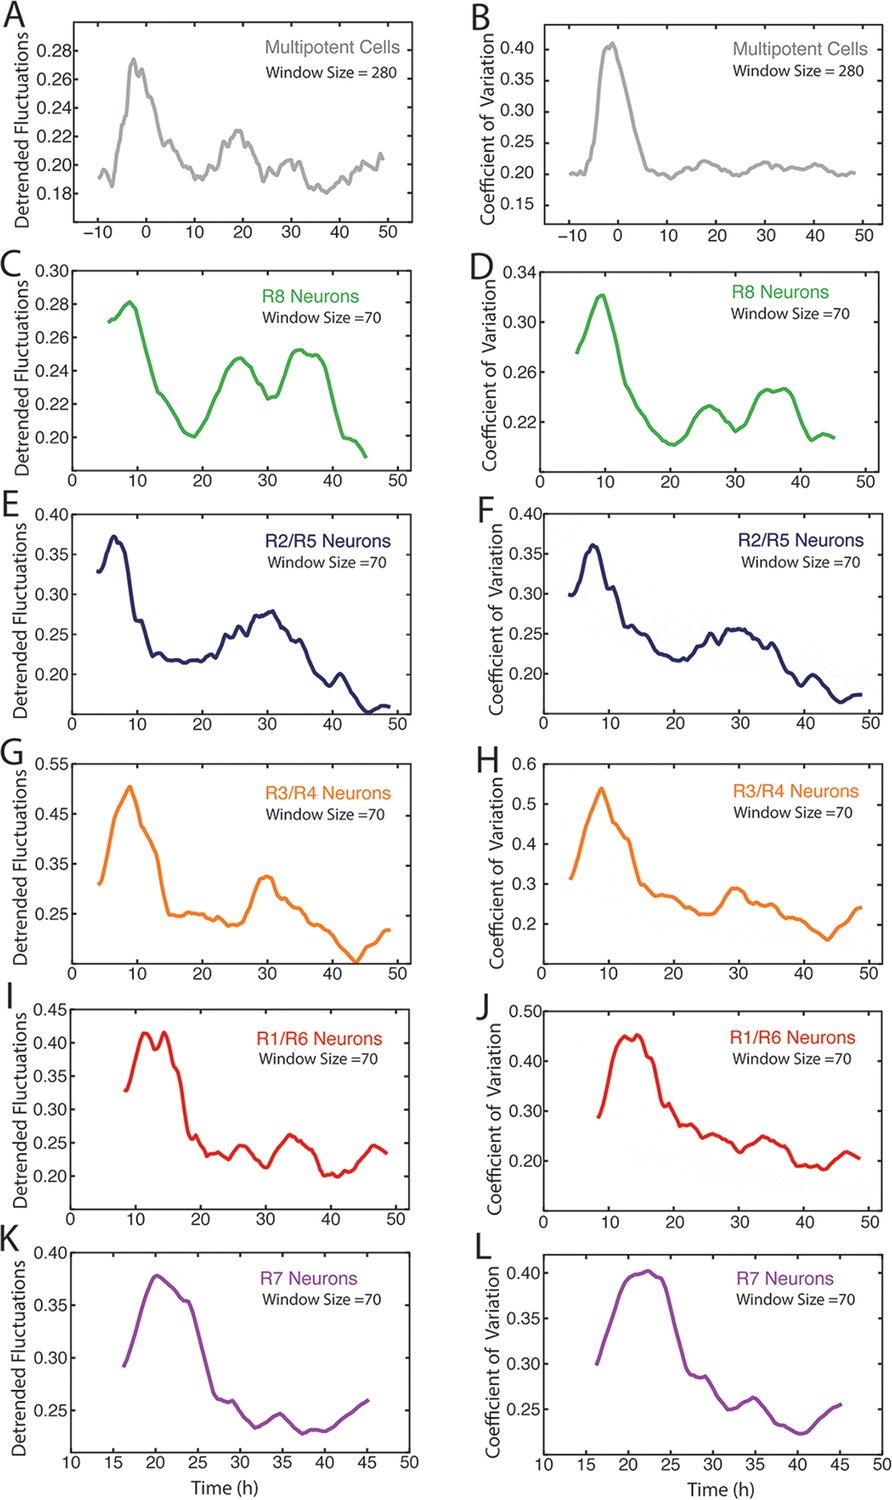
Measurement of Yan-YFP noise in all cell types.
(A,C,E,G,I,K) Yan-YFP noise is estimated by detrended fluctuations for progenitors (A), R8 (C), R2/R5 (E), R3/R4 (G), R1/R6 (I), and R7 cells (K). (B,D,F,H,J,L) Yan-YFP noise is estimated by the coefficient of variation for progenitors (B), R8 (D), R2/R5 (F), R3/R4 (H), R1/R6 (J), and R7 cells (L). Window sizes used for each analysis are indicated.
Figure 6—figure supplement 3
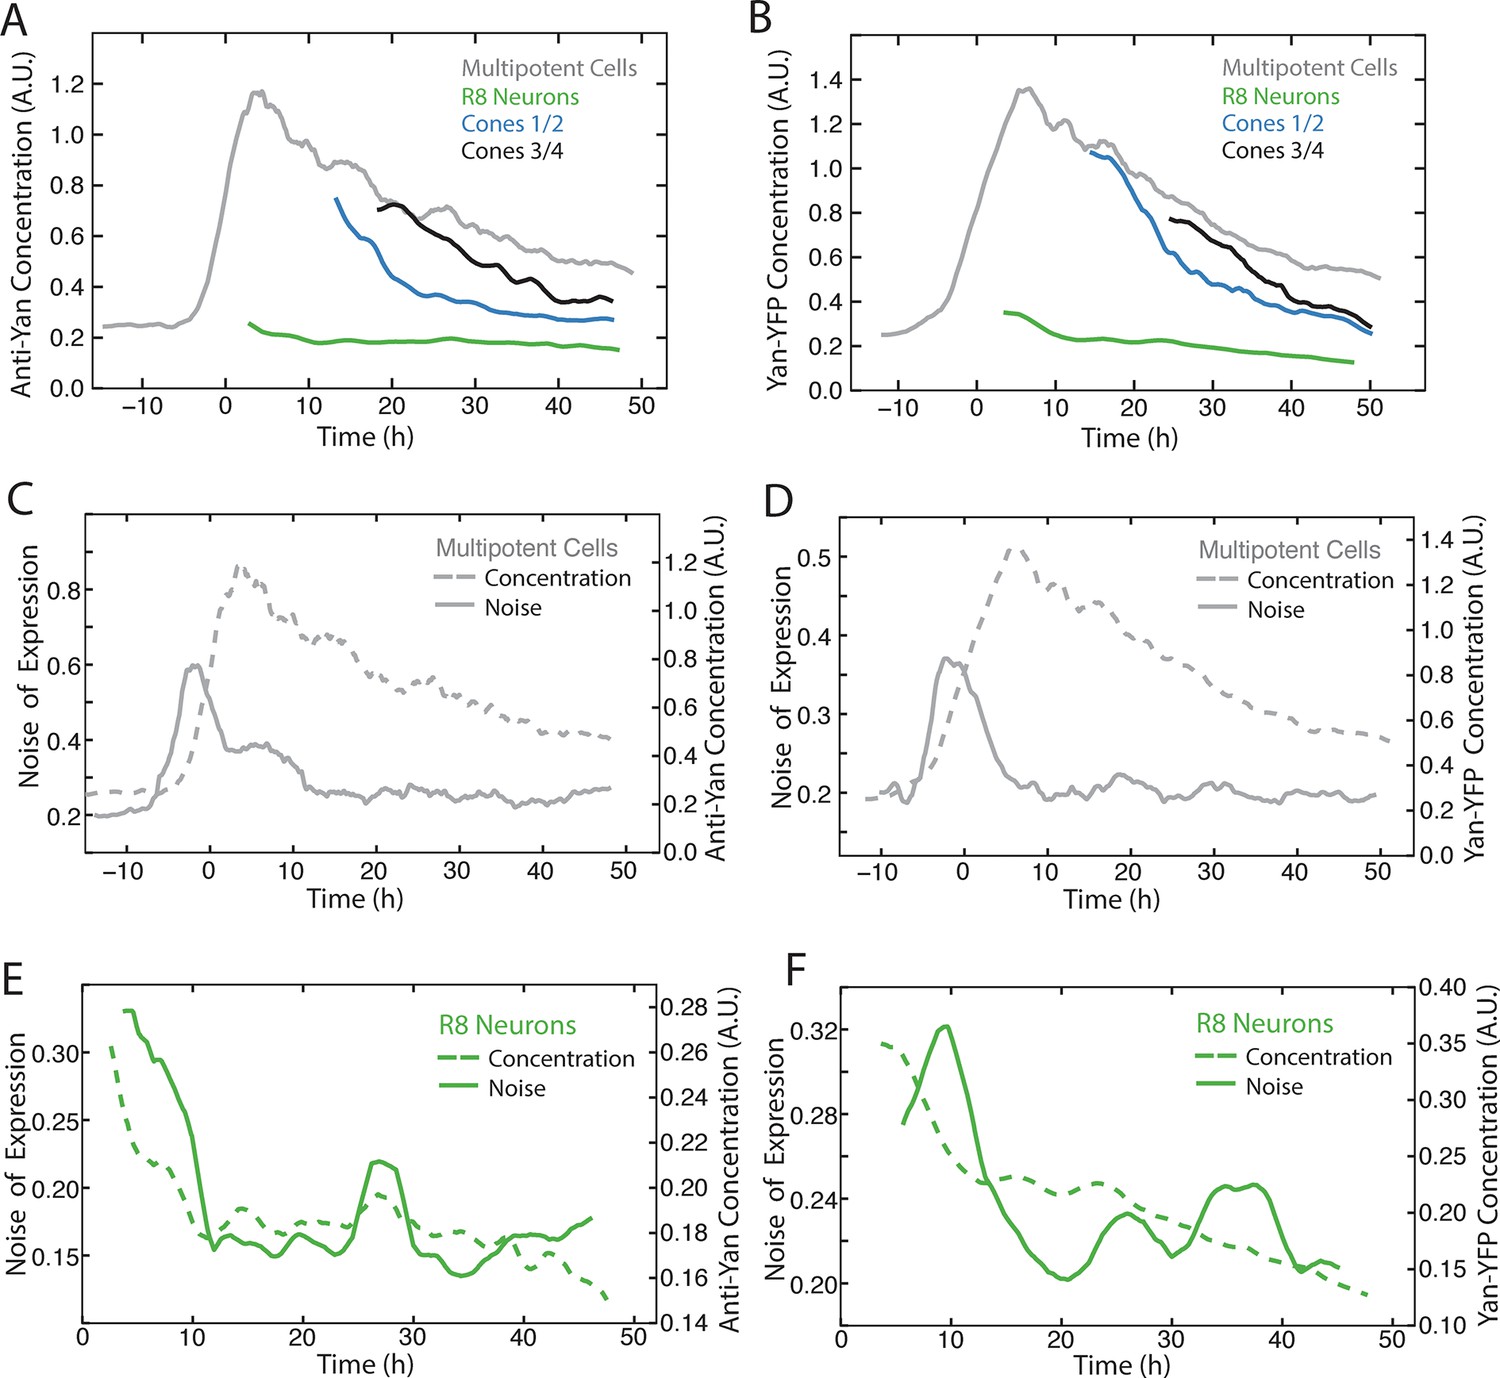
Comparison of Yan-YFP and endogenous Yan protein dynamics.
(A,C,E) His2Av-mRFP discs stained with anti-Yan antibody to measure endogenous Yan. (B,D,F) Yan-YFP measurements of His2Av-mRFP Yan-YFP discs in which endogenous Yan has been deleted. (A,B) Moving averages of anti-Yan (A) and Yan-YFP (B) fluorescence levels in multipotent, R8, and cone cells. Gaps between the multipotent and R8 curves are due to the window size for line averaging. (C,D) Moving averages of anti-Yan (C) and Yan-YFP (D) levels and noise (coefficient of variation) for multipotent cells. (E,F) Moving averages of anti-Yan (E) and Yan-YFP (F) levels and noise (coefficient of variation) for R8 cells.
Figure 6—figure supplement 4
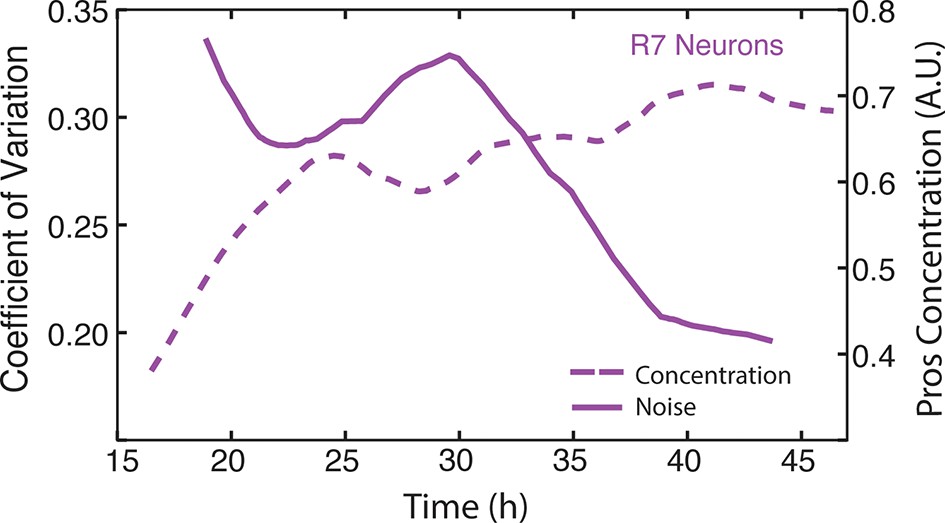
Moving averages of anti-Pros fluorescence levels and noise (coefficient of variation) in R7 cells.
https://doi.org/10.7554/eLife.08924.022
Figure 7
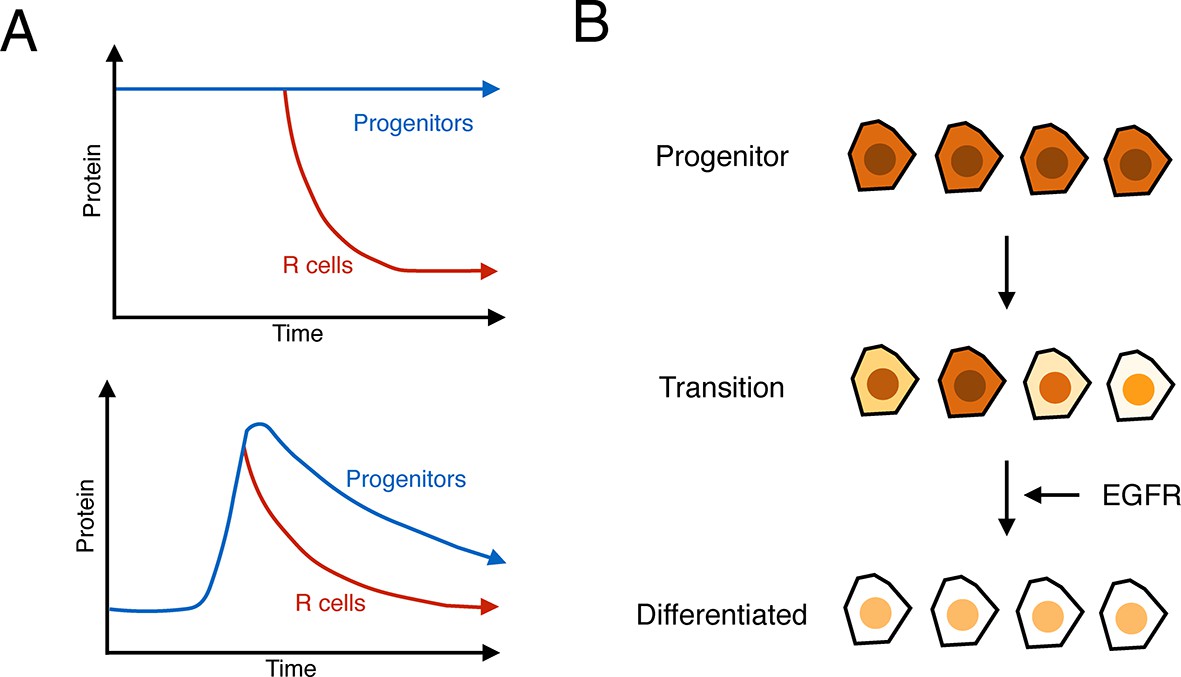
Summary of analysis.
(A) Top: a hypothetical bistable behavior would be where Yan is in a stable high state within progenitor cells and in a stable low state within differentiated cells. Bottom: the observed behavior of Yan appears monostable, with both progenitors and differentiated cells in unstable Yan states. (B) Heterogeneity in Yan expression is maximal when progenitor cells enter a transition state that resolves to a more homogeneous differentiated state, dependent upon EGFR signaling. This heterogeneous transition state may be a primary mechanism for Yan’s effect on cells, independent of the absolute Yan concentration within progenitors.
Download links
A two-part list of links to download the article, or parts of the article, in various formats.
Downloads (link to download the article as PDF)
Open citations (links to open the citations from this article in various online reference manager services)
Cite this article (links to download the citations from this article in formats compatible with various reference manager tools)
Dynamics and heterogeneity of a fate determinant during transition towards cell differentiation
eLife 4:e08924.
https://doi.org/10.7554/eLife.08924


