Structural basis of interprotein electron transfer in bacterial sulfite oxidation
- Centenary Institute, Australia
- University of Sydney, Australia
- La Trobe Institute for Molecular Science, La Trobe University, Australia
- The University of Queensland, Australia
- University of Queensland, Australia
Figures
Figure 1
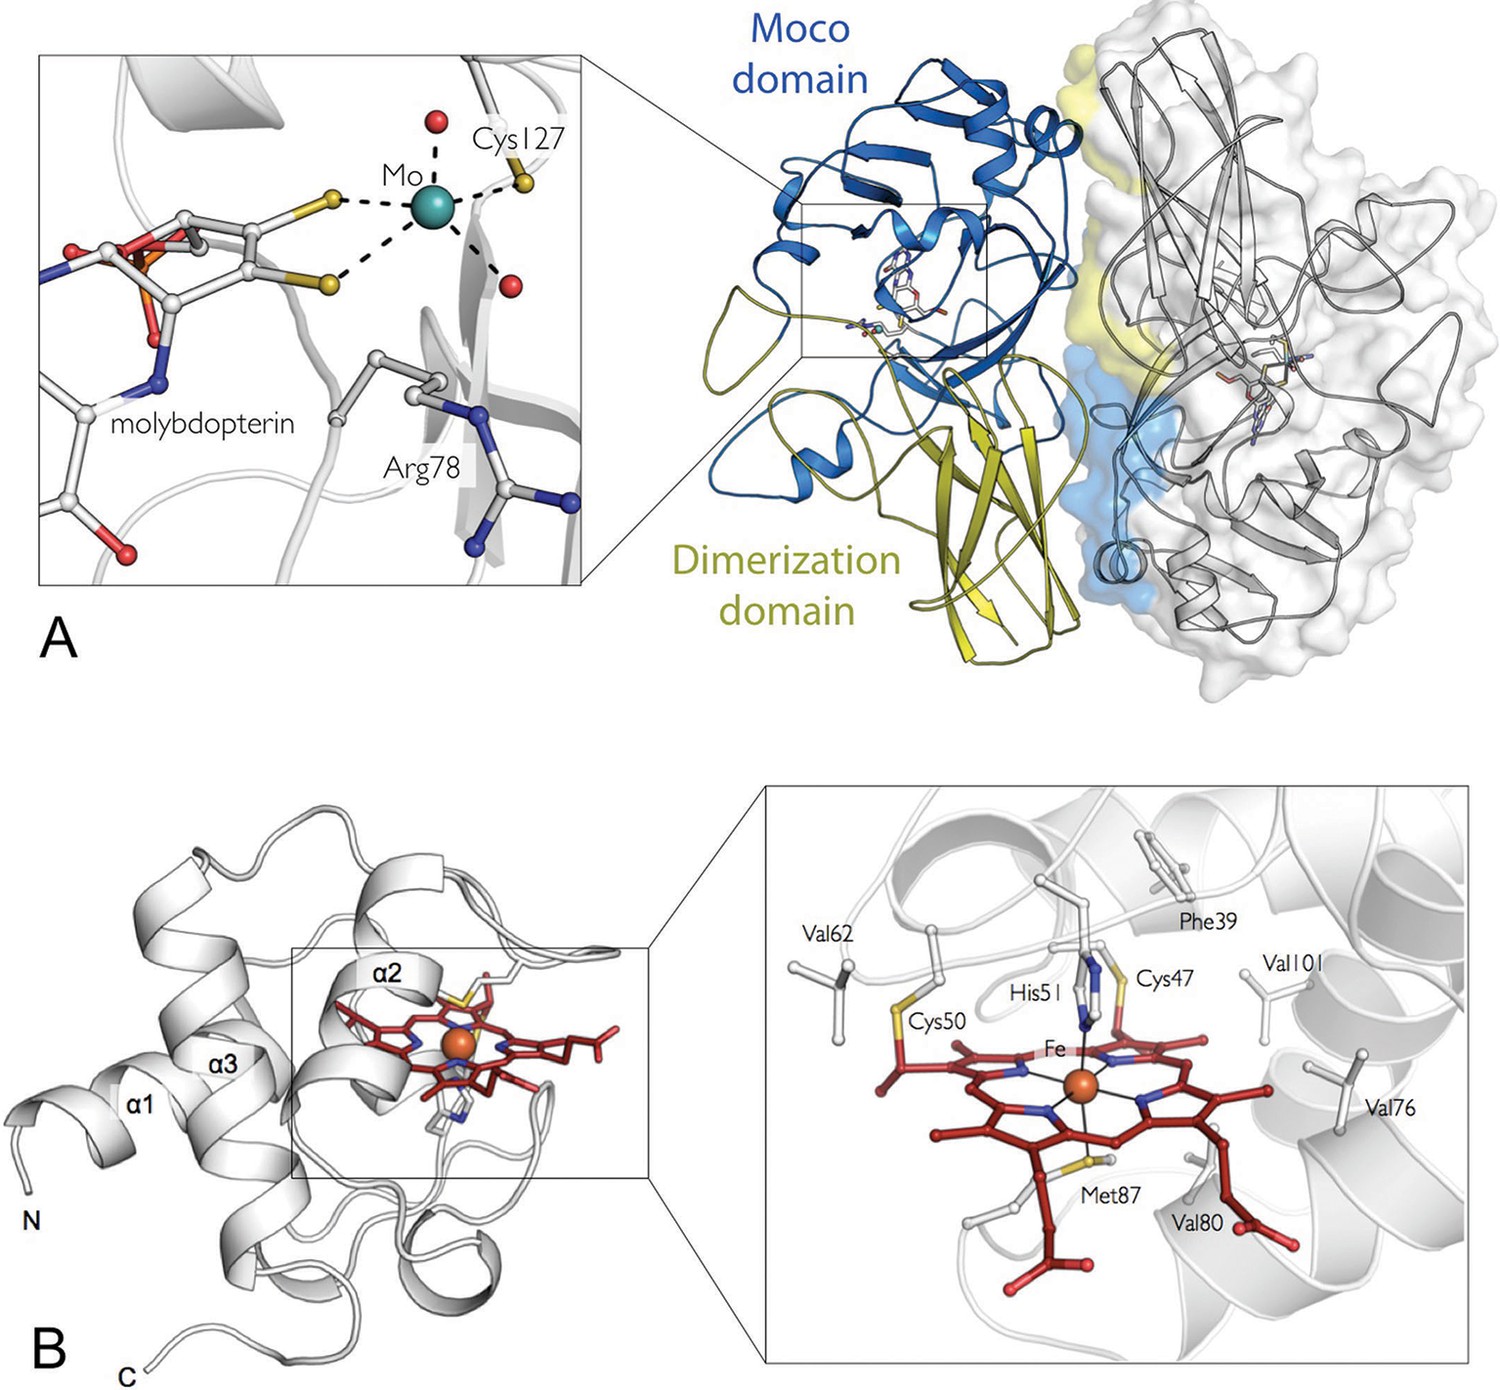
The crystal structures of the SorT and SorU proteins in isolation.
(A) The structure of the SorT homodimer. Molecule A in blue/yellow; molecule B in gray (with transparent surface). For molecule A, the ‘SUOX-fold domain’ and ‘dimerization domain’ are represented in blue and yellow, respectively. The molybdopterin cofactor is shown as sticks within the SUOX-fold domain. The corresponding domains of the opposing protomer (shown in molecular surface representation), which constitute the dimer interface are colored to highlight the ‘head-to-tail’ dimer arrangement. INSET: a closer view of the molybdenum binding-site: the molybdenum atom (green sphere) is coordinated by two dithioline ligands from the molybdopterin (yellow spheres), residue Cys 127, an axial oxo ligand and an equatorial hydroxo or water ligand (red spheres). (B) The structure of SorU. The main three helices are labeled and the heme cofactor is shown in red. INSET: the heme binding site with the heme cofactor, coordinating residues, covalent links to Cys 50 and 57 and hydrophobic residues lining binding site: Phe 39, Val 62, Val 76, Val 80, Val 101 highlighted.
Figure 2
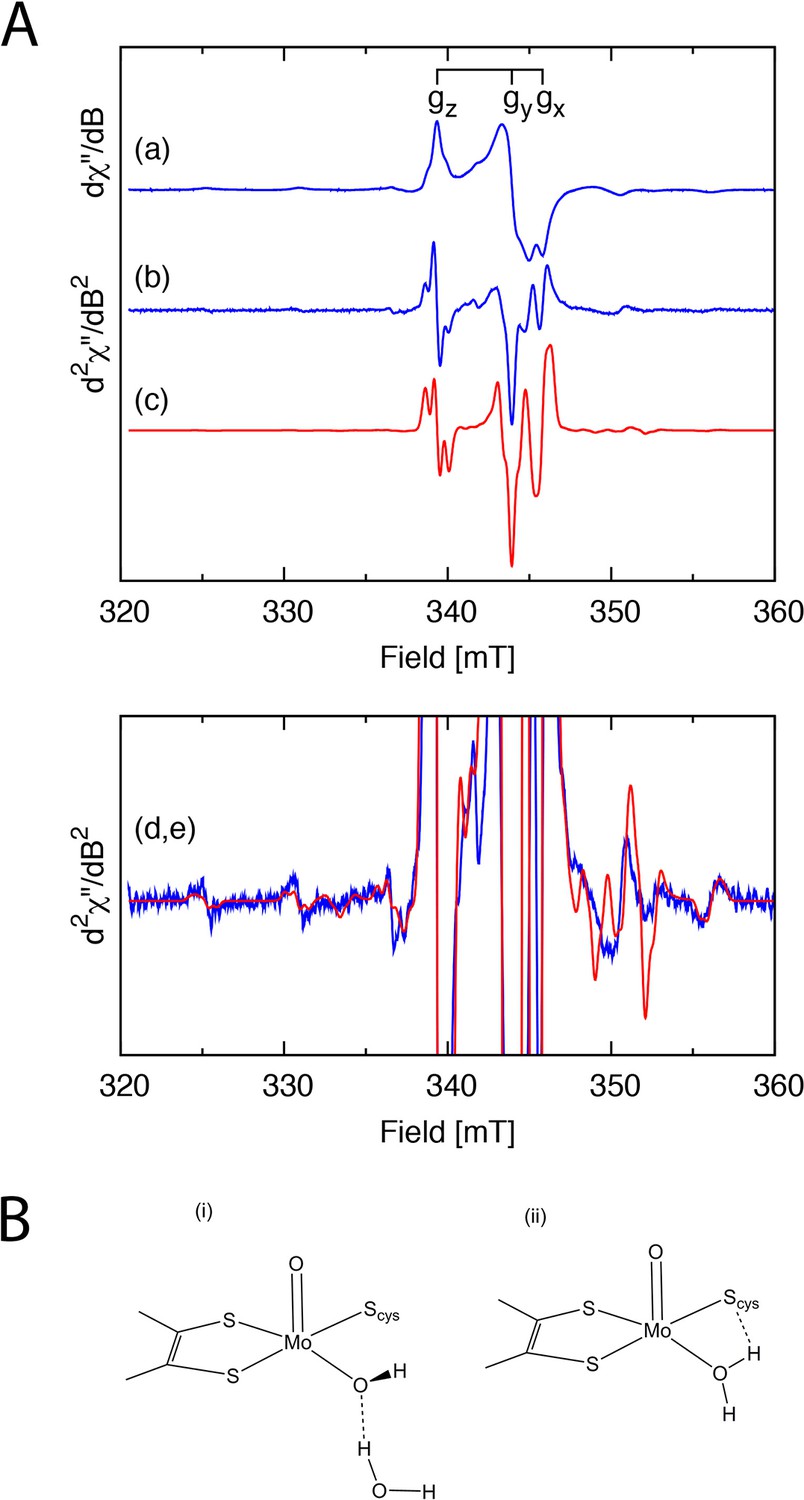
EPR analysis of the SorT protein.
(A) X-band EPR spectra of the Mo(V) center in SorT. (a) First and (b) second derivative EPR spectra of SorT at 0 mV vs NHE in tricine pH 8.0, υ= 9.43462 GHz, T = 136.3 K. (c) Computer simulation of the second derivative spectrum with the spin Hamiltonian parameters listed in Table 3; (d,e) Expansion of spectra (b) and (c), respectively. (B) Schematic structures of the (i) high and (ii) low pH forms of sulfite oxidase.
Figure 3
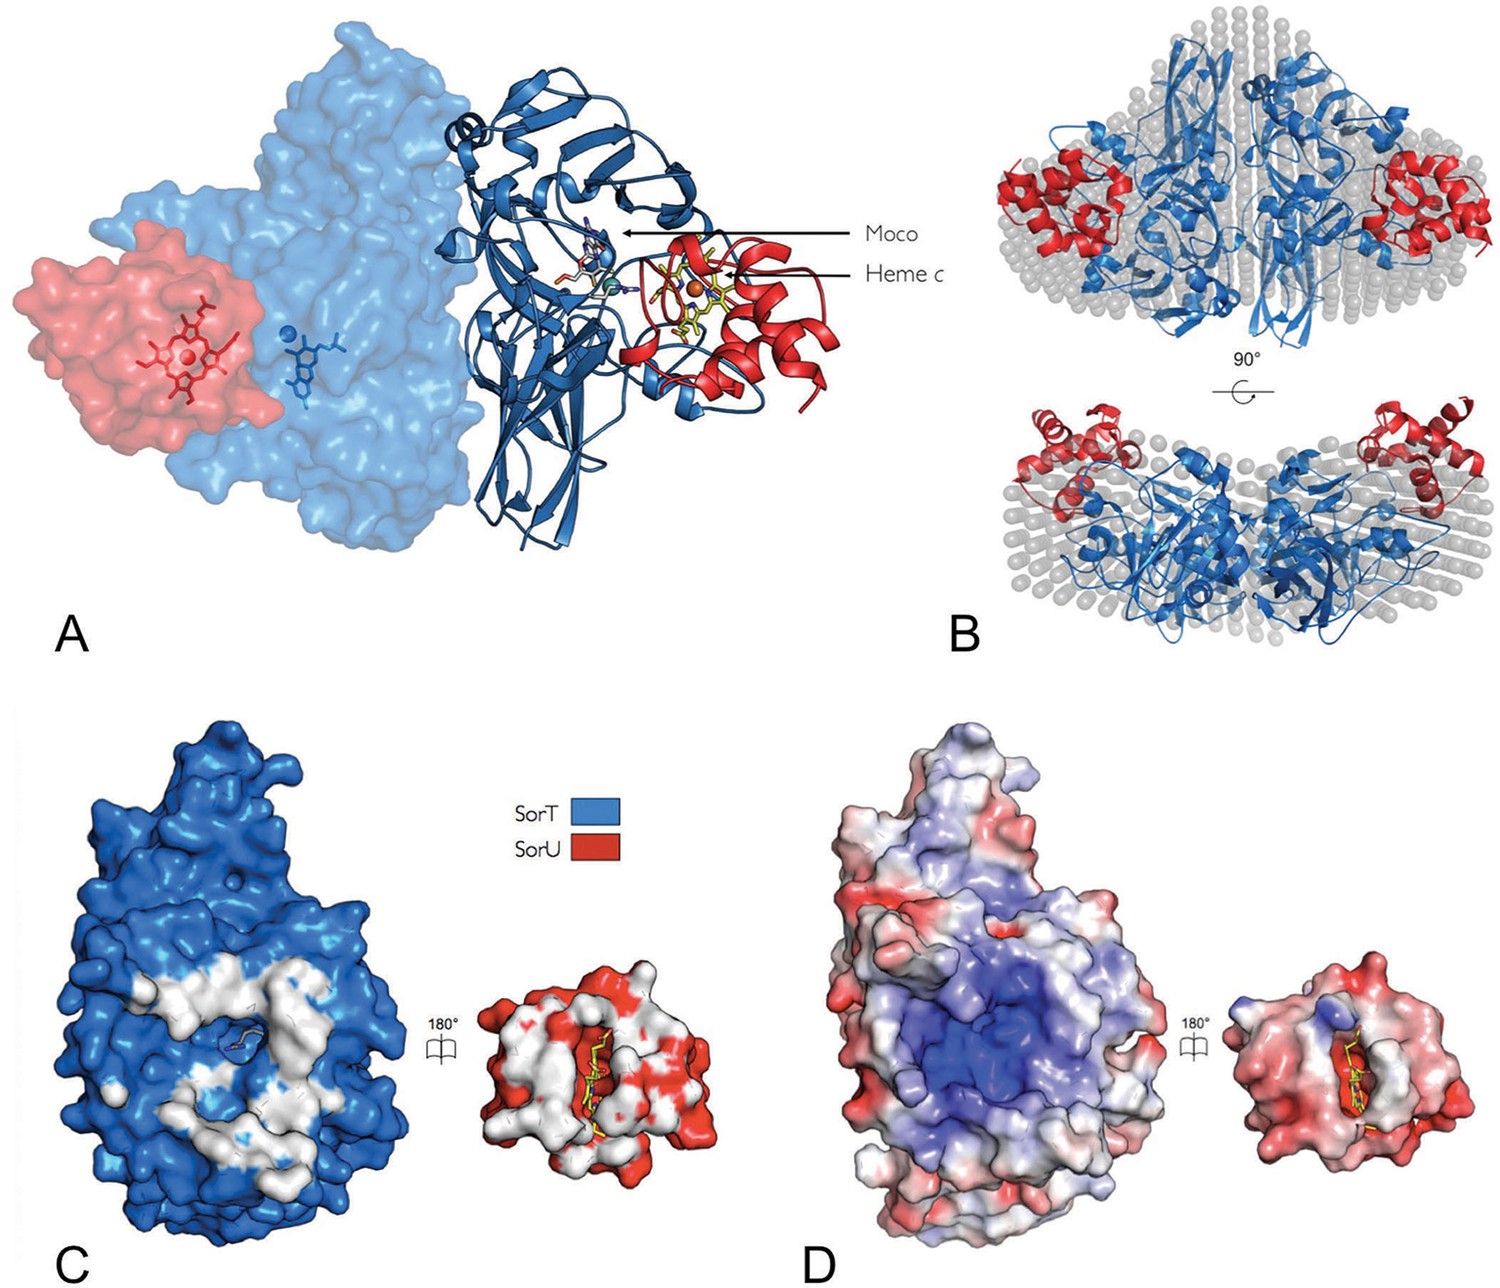
The structure of the SorT/SorU electron transfer complex.
(A) The asymmetric unit from the crystal structure of the SorT/SorU complex contains the functional electron transfer complex. The SorU/SorT2/SorU complex is revealed by the application of crystallographic symmetry operators. The positions of the redox active molybdenum (SorT) and heme c (SorU) cofactors are indicated. (B) Two views of an overlay of the SorU/SorT2/SorU crystal structure with the averaged and filtered dummy atom model from 10 ab initio reconstructions as revealed by SAXS analyses. (C) ‘Open-book unfolding’ of SorT/SorU complex (SorT is shown in blue, SorU in red) indicating the ‘footprint’ of interfacing residues from each protein. (D) The same view as Panel C, showing the charge complementarity of the SorT/SorU interface (areas of positive charge in blue, negative charge in red and neutral in white).
Figure 4
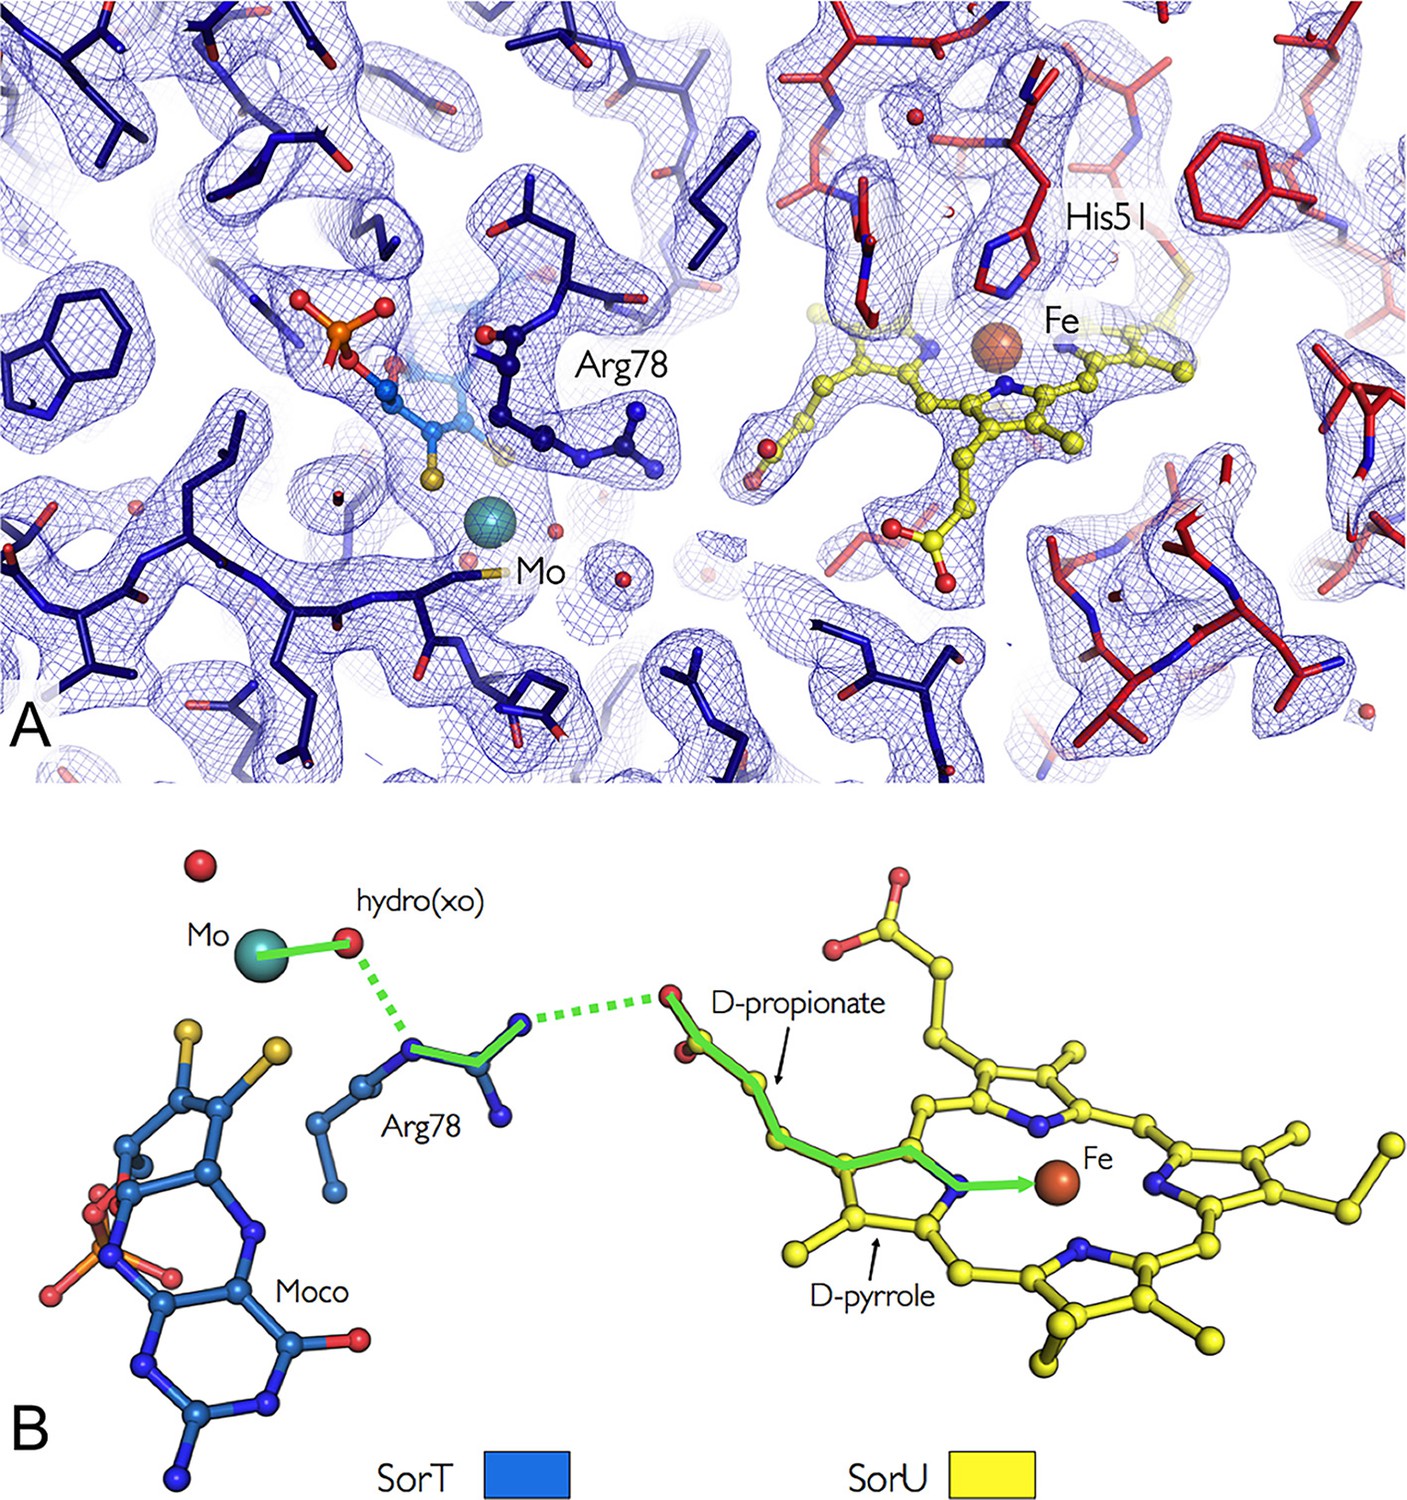
Orientation of the redox cofactors in the crystal structure of the SorT/SorU electron transfer complex.
(A) Electron density map in the region of the SorT/SorU interface. The SorT molecule is represented in blue and the SorU molecule in red. The 2Fo-Fc electron density map (contoured at 1σ) is shown as a blue net and the redox cofactors (molybdenum and heme) are colored according to the representation in Panel B. (B) Pathway for electron transfer (Beratan et al., 1992).
Figure 5

Comparisons of (A) the SorT/SorU and SorAB structures and (B) the structures of SorT and SorU within and outside of the electron transfer complex.
(A) Structures of the SorT/SorU (left) and SorAB (right) complexes, where the Cα traces of the heme-containing protomers are colored according to temperature factor. (B) Superposition of the SorT and SorU structures within and outside of the electron transfer complex, highlighting conformational changes that were observed to accompany complex formation. The crystal structures of SorT and SorU within the SorT/SorU complex are shown in gray, and the superposed structures of SorT and SorU determined alone are shown in blue and red respectively.
Figure 6
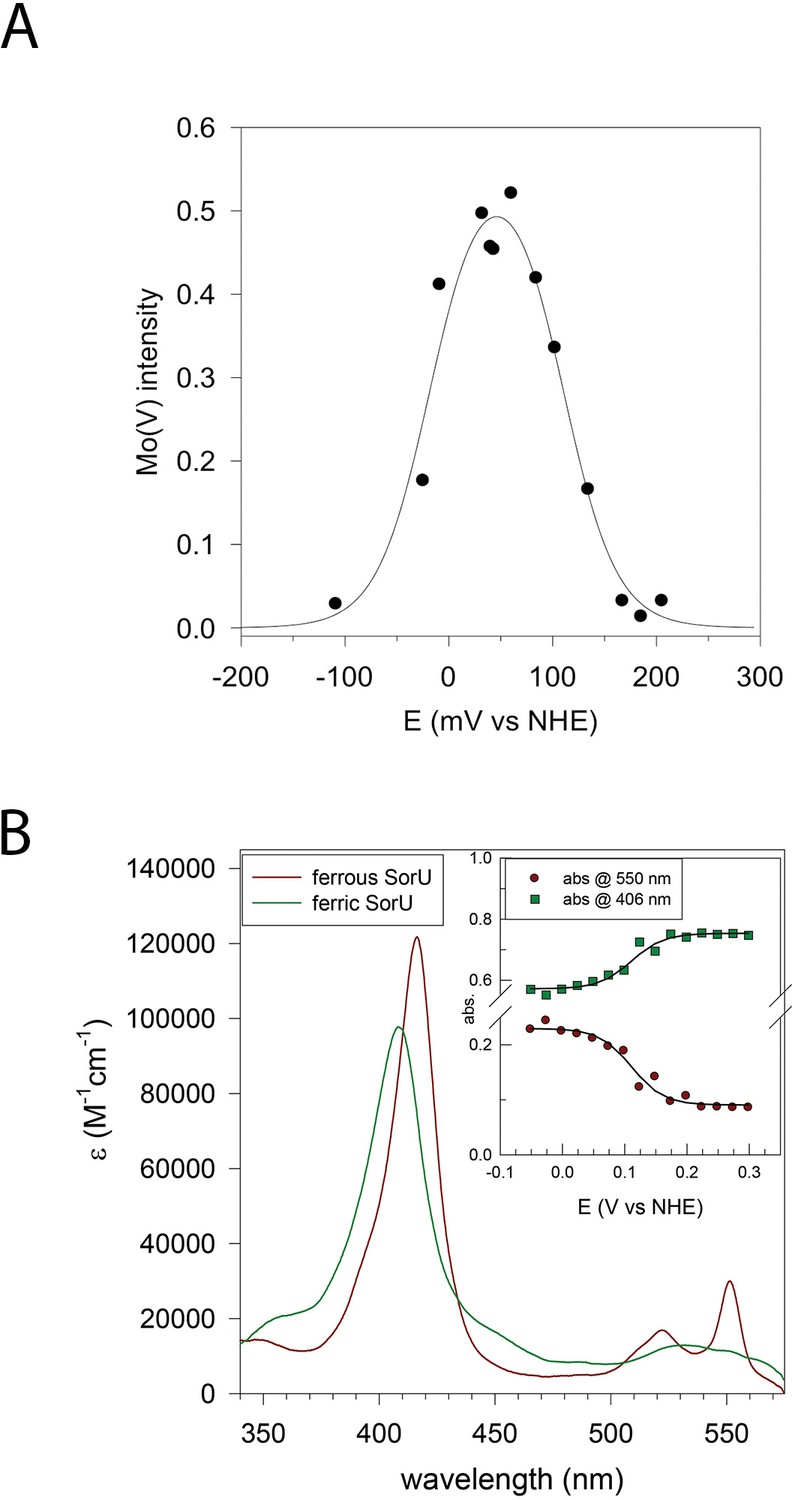
Redox analyses of the SorT protein and the SorT/SorU complex.
(A) Plot of EPR intensity (Ip) at 343 mT (from MoV form of SorT) as a function of solution redox potential (E mV vs NHE). The solid line is a fit to the equation using the potentials E1 = MoVI/V = +110(±10) mV and E2 MoV/IV-18(±10) mV vs NHE). (B) Electronic spectra of ferric and ferrous SorU obtained from spectroelectrochemistry. Inset: plot of absorbance at 550 nm (ferrous α-band) and 406 nm (ferric Soret band) as a function of applied potential. The solid lines are theoretical curves based on the equation where the extinction coefficients refer to the oxidized and reduced forms of the protein and Abs is the absorbance at this same wavelength. ctot is the total protein concentration. The redox potential (E' = +111 mV vs NHE) was obtained by global analysis of all potential dependent spectra across all wavelengths with the program ReactLab Redox (Maeder and King).
Figure 7
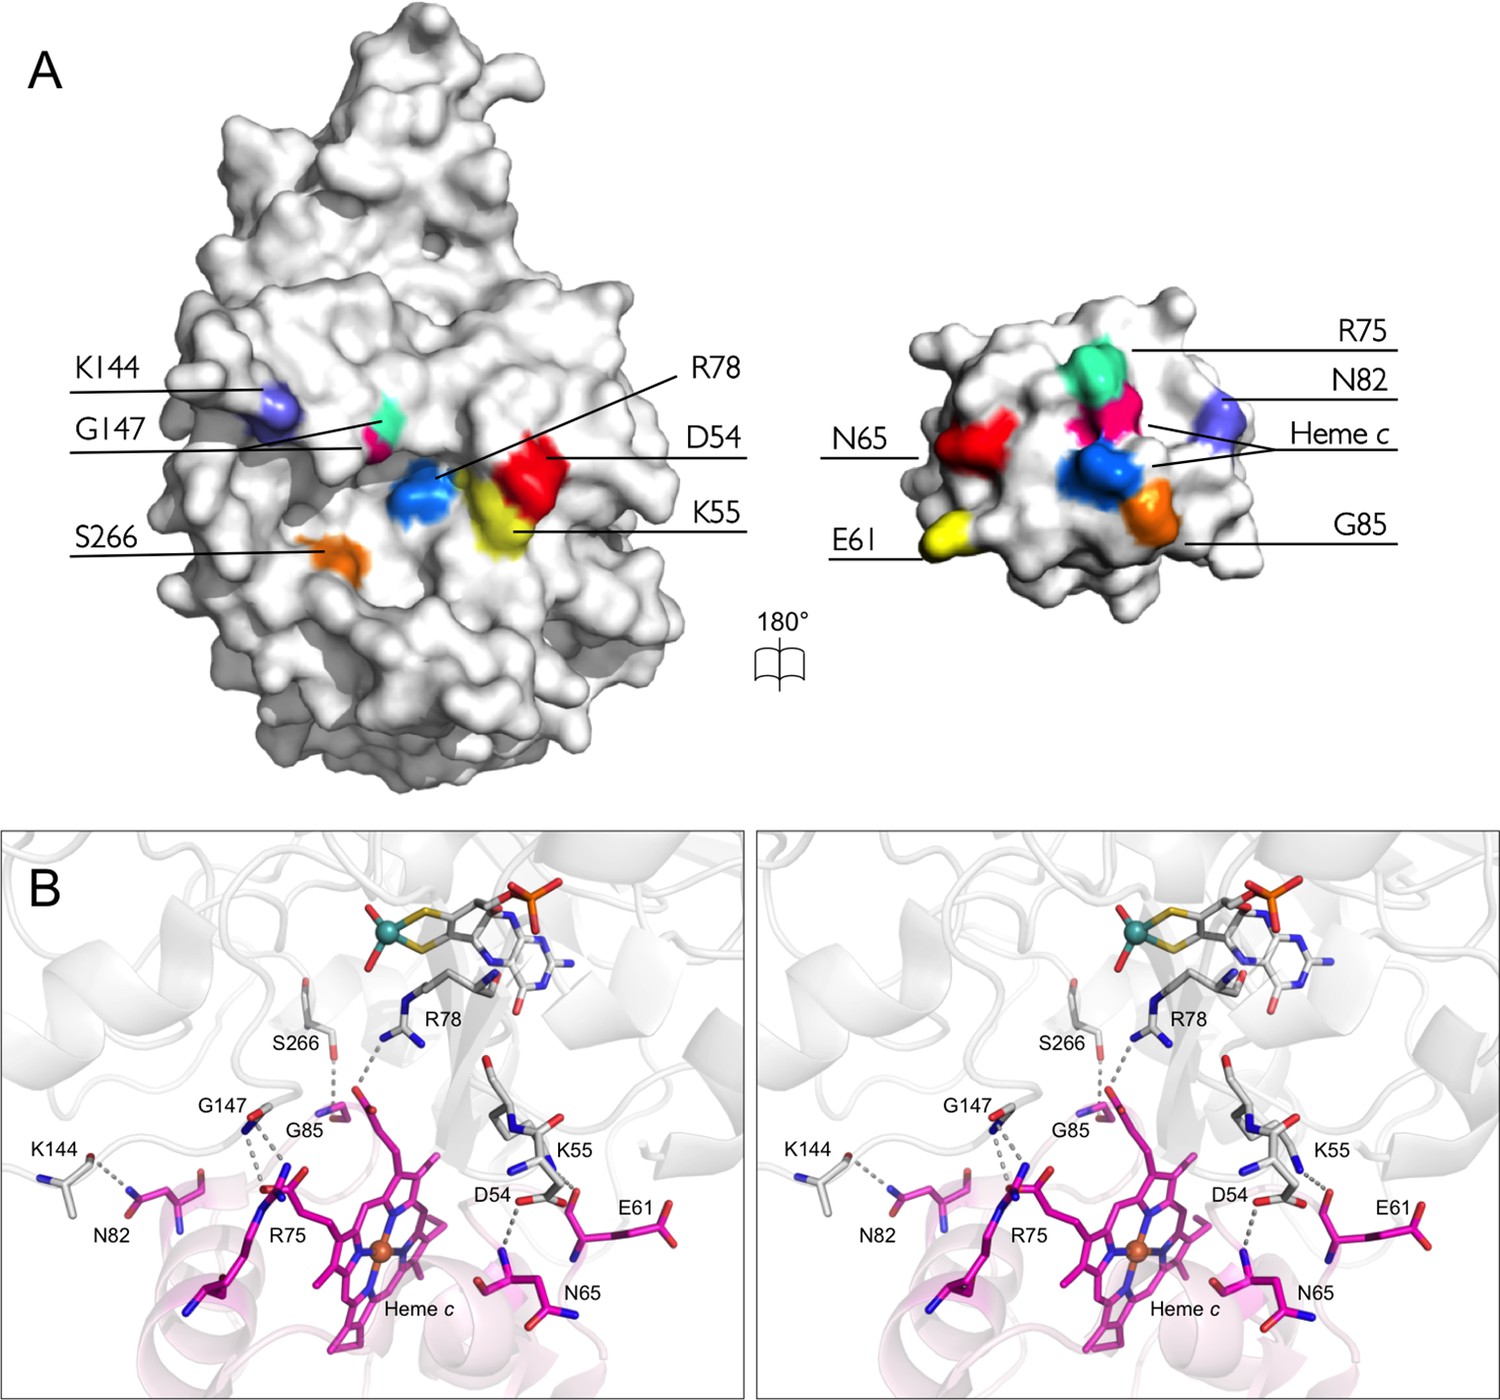
The bonding network at the interface of SorT/SorU.
(A) An open-book representation depicts residues involved in forming stable bonds at the interface between SorT and SorU as corresponding color patches mapped onto the molecular surface. (B) Stereoview of the interface between SorT and SorU. Bonding residues are shown as sticks with bonds shown as dashes between atoms. SorT is shown in light grey and SorU is shown in magenta.
Figure 8
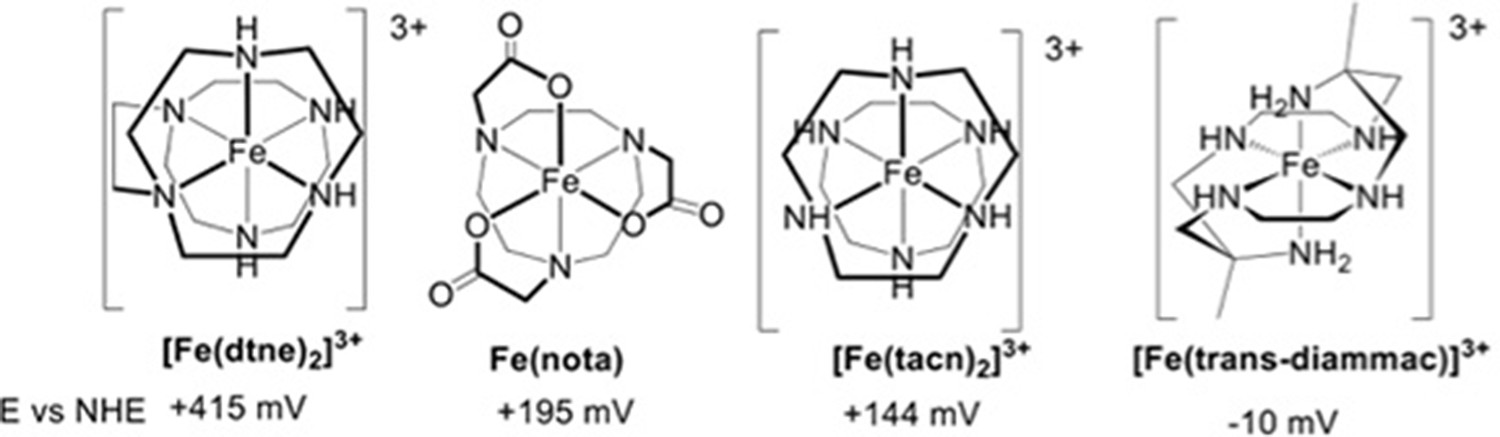
Redox mediators employed in optical spectroelectrochemistry experiments.
https://doi.org/10.7554/eLife.09066.017
Appendix 2-figure 1
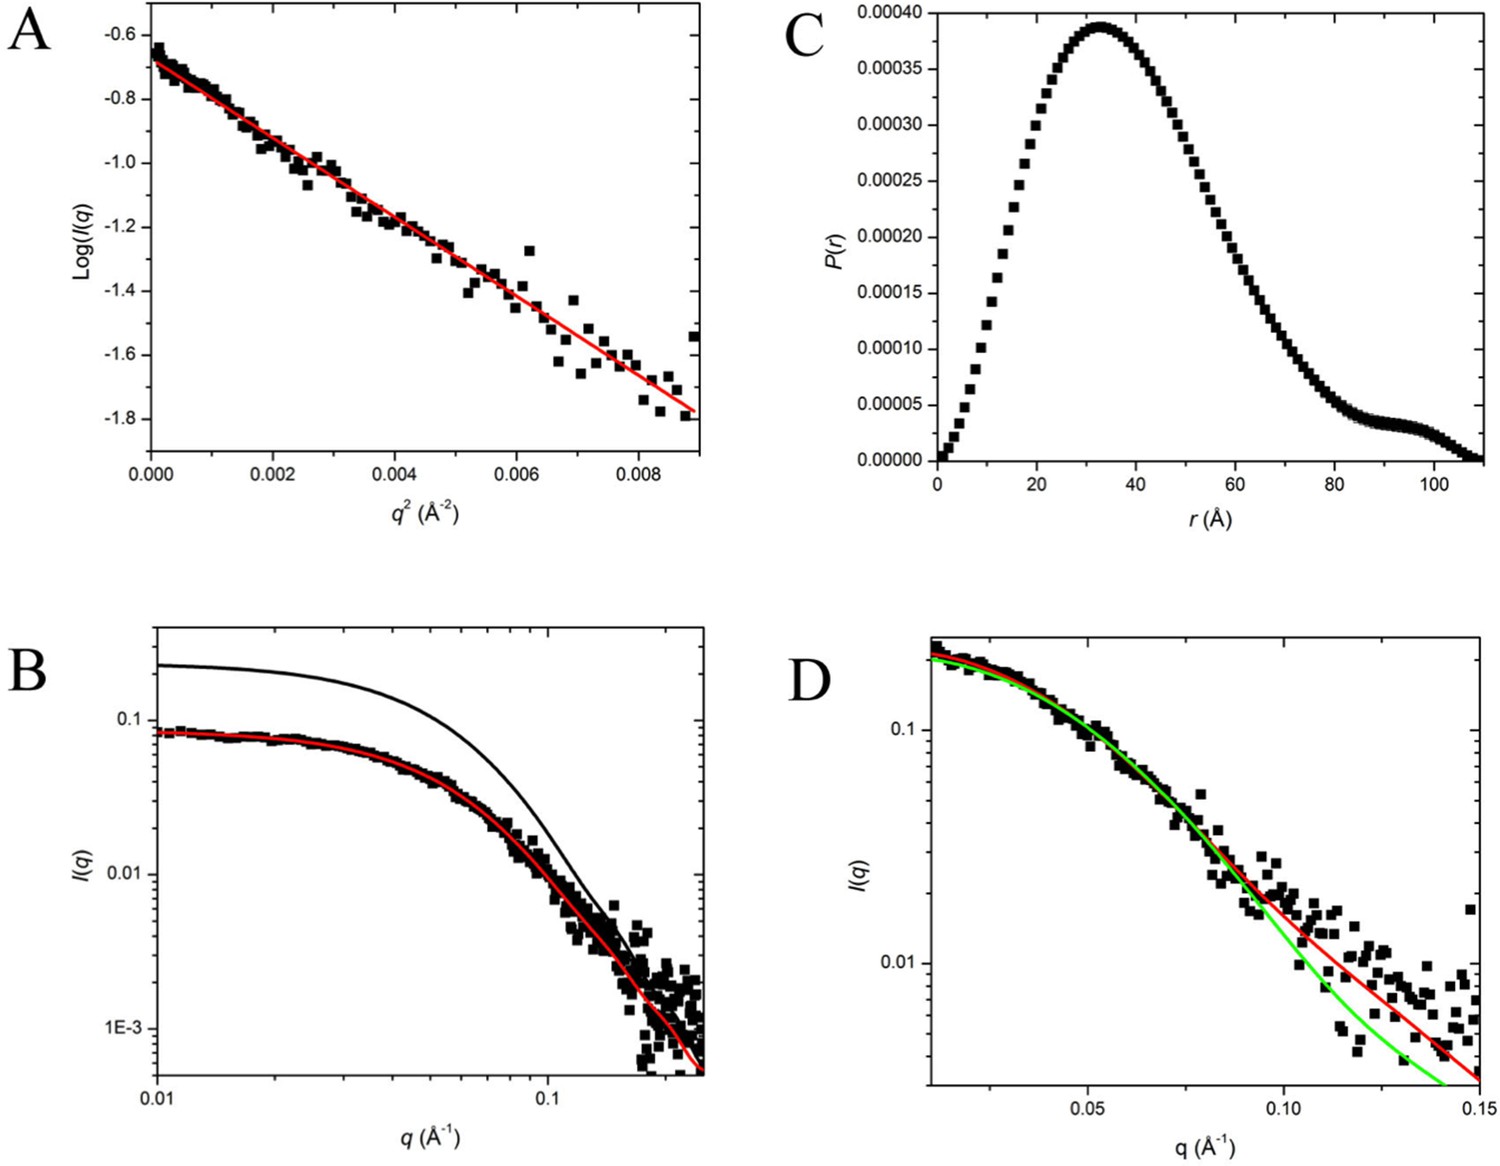
SAXS Data and Interpretation.
(A) Guinier plot of the desmeared I(q) versus q; (B) log:log plot of the measured (slit smeared) I(q) versus q with the P(r)- model I(q) (black line) and smeared P(r)-model I(q) (red line) fits; (C) P(r) versus r for the P(r) model in (B), dmax is 110 Å; (D) superposition of the desmeared I(q) versus q with that calculated from the crystal structure of the SorT/SorU2/SorT complex (red line) and the SorT dimer (green line).
Tables
Table 1
Data collection and refinement statistics.
| SorT | SorU | SorT/SorU complex | ||||
|---|---|---|---|---|---|---|
| Data collection | ||||||
| Space Group | P21 | F222 | P21212 | |||
| Cell dimensions | ||||||
| a, b, c (Å) | 96.0, 92.2, 109.4 | 70.9, 129.2, 197.0 | 109.6, 95.8, 49.9 | |||
| α, β, γ (°) | 90, 89.7, 90 | 90, 90, 90 | 90, 90, 90 | |||
| X-ray source | AUS MX2 | AUS MX2 | AUS MX2 | |||
| λ (Å) | 0.950 | 0.954 | 0.954 | |||
| Detector | ADSC Quantum 315r | ADSC Quantum 315r | ADSC Quantum 315r | |||
| Resolution range (Å) | 50-2.4 (2.43-2.35)a | 50-2.2 (2.28-2.20) | 50-2.5 (2.50-2.59) | |||
| Observed reflections | 240521 | 96340 | 64273 | |||
| Unique reflections | 77971 | 23453 | 18883 | |||
| Completeness (%) | 98.4 (99.4) | 99.9 (100) | 99.3 (99.6) | |||
| Multiplicity | 3.1 (3.1) | 4.1 (4.1) | 3.4 (3.4) | |||
| <I/σ(I)> | 6.7 (2.1) | 8.9 (1.6) | 8.8 (1.7) | |||
| Rmerge (%)b | 15.9 (66.7) | 13.3 (76.6) | 13.9 (76.6) | |||
| Refinement | ||||||
| Reflections in working set | 74024 | 22113 | 17781 | |||
| Reflections in test set | 3927 | 1201 | 960 | |||
| Protomers per ASU | 4 | 4 | 1 | |||
| Total atoms (non-H) | 11378 | 2941 | 3422 | |||
| Protein atoms | 10890 | 2542 | 3290 | |||
| Metal atoms | 4 | 4 | 2 | |||
| Water atoms | 376 | 227 | 63 | |||
| Other atoms | 108 | 168 | 67 | |||
| Rwork (%)c | 20.8 (31.7) | 19.2 (30.8) | 21.1 (30.2) | |||
| Rfree (%)d | 23.9 (34.7) | 24.0 (34.3) | 26.0 (36.5) | |||
| Rmsd bond lengths (Å) | 0.008 | 0.006 | 0.012 | |||
| Rmsd bond angles (deg) | 1.08 | 0.91 | 1.41 | |||
| <B> (Å2)e | 32.5 | 20.6 | 38.0 | |||
| Cruickshank's DPI | 0.07 | 0.23 | 0.49 | |||
| PDB ID | 4PW3 | 4PWA | 4PW9 | |||
-
aValues in parenthesis are for highest-resolution shell
-
b Rmerge = ∑hkl ∑i | Ii (hkl) - <I(hkl)> |/∑hkl ∑i Ii (hkl)
-
c Rwork = ∑h | Fobs – Fcalc |/∑hFobs
-
d Calculated as for Rwork using 10% of the diffraction data that had been excluded from the refinement
-
eAs calculated by BAVERAGE (Winn et al., 2011)
Table 2
Mo coordination geometry in the active site of SorT.
| Bond | Distance (Å) |
|---|---|
| Mo-S1 (pterin) | 2.4 |
| Mo-S2 (pterin) | 2.4 |
| Mo-S (Cys 127) | 2.3 |
| Mo=O | 1.7 |
| Mo-OH/H2O | 1.9 |
Table 3
Spin Hamiltonian parameters for the Mo(V) center of SorT and various low and high pH forms of human, avian, plant and bacterial sulfite oxidases.
| Species | Parameter | X | Y | Z | βo | Ref |
|---|---|---|---|---|---|---|
| SorT | g | 1.94930 | 1.95997 | 1.98632 | - | |
| A(95Mo)b | 20.5 | 36.0 | 53.9 | 26 | ||
| A(1H)b,c | 3.5 | 4.0 | 4.8 | 0 | ||
| SorAc | g | 1.9541 | 1.9661 | 1.9914 | -d | Klein, et al., 2013 |
| Human SO | g Low pH | 1.9646 | 1.9723 | 2.0023 | - | Enemark, et al., 2010 |
| A(1H)b | 11.47 | 7.10 | 7.71 | - | Enemark, et al., 2010 | |
| Chicken SO | g (Low pH) | 1.9658 | 1.9720 | 2.0037 | - | Drew and Hanson, 2009 |
| A(1H)b | 11.93 | 7.37 | 7.95 | - | Drew and Hanson, 2009 | |
| g (High pH) | 1.9531 | 1.9641 | 1.9872 | Drew and Hanson, 2009 | ||
| A. Thaliana SO | g (Low pH) | 1.963 | 1.974 | 2.005 | - | Enemark, et al., 2006 |
| A(1H)b | 11.9 | 9.2 | 10.3 | -- | Enemark, et al., 2006 | |
| g (High pH) | 1.956 | 1.964 | 1.989 | - | Enemark, et al., 2006 |
-
aNon-coincident angle between g and A (rotation about x axis). bUnits 10-4 cm-1. c Two magnetically equivalent protons (I=1/2) were included in the computer simulated spectra. c95Mo hyperfine couplings were unresolved and the shoulders on gz were incorrectly attributed to 95Mo hyperfine resonances. dEuler angles were not determined.
Table 4
Data collection and processing parameters for analysis of the SorT/SorU complex in solution by Small Angle X-ray Scattering (SAXS).
| Data collection parameters | |
| Instrument | SAXSess (Anton Paar) |
| Beam geometry | 10 mm slit |
| AH, LH (Å-1), GNOM beam geometry definition | 0.28, 0.12 |
| q-range measured (Å-1) | 0.01-0.400 |
| Exposure time (min) | 60 (4 x 15) |
| SorT2SorU2 concentration range (mg mL-1) | 2.75-5.5 |
| Temperature (ºC) | 10 |
| Structural parameters* | |
| Rg (Å), I(0) (cm-1) from Guinier (desmeared data) q*Rg < 1.3 | 30.8 ± 0.4, 0.223 ± 0.002 |
| Rg (Å), I(0) (cm-1) from P(r) (q-range 0.01 – 0.25 Å-1) | 32.0 ± 0.3, 0.235 ± 0.002 |
| dmax (Å) from P(r) | 110 |
| Molecular mass determination* | |
| Molecular mass Mrfrom Guinier I(0) (ratio with expected) | 108741 (0.984) |
| Molecular mass Mrfrom P(r) I(0) (ratio with expected) | 114593 (1.037) |
| SorT2SorU2 parameters calculated from sequence and chemical composition | |
| Molecular volume (Å3) | 134385 |
| Molecular weight Mr (Da) | 110556 |
| Partial specific volume (cm3 g-1) | 0.732 |
| Contrast (X-rays) (Δρ x 1010 cm-2) | 2.895 |
| Modeling results and validation | |
| Crystal structure Rg, dmax (Å) SorT/SorU2/SorT SorT | 31.3, 108 27.9, 99 |
| Crystal structure compare to desmeared I(q) (χ-value) SorT/SorU2/SorT (q-range 0.01 – 0.15 Å-1) SorT (q-range 0.01 – 0.15 Å-1) | 1.7 2.3 |
| Results from 10 ab initio shape restorations. P1 symmetry: Average molecular volume (Å3) Normalised spatial distribution (NSD) and NSD variation χ value for fit to desmeared data | 140800 0.508 (0.008) 1.8 |
| Software employed | |
| Calculation of expected Mr, △ρ and υ values | MULCh |
| Primary data reduction, I(q) vs q | SAXSQuant 1D |
| Desmearing | SAXSQuant |
| Guinier analysis | PRIMUS |
| P(r) analysis | GNOM |
| Model I(q) from crystal coordinates | CRYSOL |
| ab initio shape restorations | DAMMIN |
| 3D graphics representations | PYMOL |
-
*Reported for 2.75 mg ml-1 measurement.
Table 5
Electron transfer parameters between SorT (Mo) and SorU (Fe) as calculated by PATHWAYS (Onuchic et al., 1992).
| Distance (Mo-Fe, Å) | 16.5 Å |
| Atomic packing density (ρ) | 0.97 |
| Average decay exponential (β) | 0.97 |
| Electronic coupling (HDA) | 3.4 x 10⁻⁴ |
| Maximum ET rate (s-1) | 1.2 x 10⁷ |
Table 6
Redox potential values for SorT and SorUa.
| Protein | Couple | Eº (mV vs NHE) |
|---|---|---|
| SorT | MoVI/V | +110(±10) |
| MoV/IV | -18(±10) | |
| SorU | FeIII/II | +108 (±10) |
| SorU (in the presence of SorT) | FeIII/II | +111 (±10) |
-
aRedox potentials of SorT were determined by redox potentiometry, and SorU redox potentials by optical spectroelectrochemistry.
Table 7
Comparison of the protein-protein interfaces in the SorT/SorU and SorAB structures.
| Parameter | SorT/SorUa | SorABb | ||
|---|---|---|---|---|
| SorT | SorU | SorA | SorB | |
| Average relative B factorc (Å2) | 0.9 | 1.5 | 1.0 | 1.1 |
| Buried surface area (Å2)d | 644 | 696 | 1254 | 1380 |
| Interfacing residuesd | 31 | 21 | 46 | 33 |
| Hydrogen-bonds | 6 | 30e | ||
| Salt-bridges | 1 | 2e | ||
| Shape complementarity statisticf | 0.63 | 0.77 | ||
-
aThis work
-
bPDB code 2BLF (Kappler and Bailey, 2005)
-
cCalculated as the average for the protomer of interest divided by the average for the entire complex structure.
-
eTaken from(Kappler and Bailey, 2005)
Download links
A two-part list of links to download the article, or parts of the article, in various formats.
Downloads (link to download the article as PDF)
Open citations (links to open the citations from this article in various online reference manager services)
Cite this article (links to download the citations from this article in formats compatible with various reference manager tools)
Structural basis of interprotein electron transfer in bacterial sulfite oxidation
eLife 4:e09066.
https://doi.org/10.7554/eLife.09066


