Genetic architecture of natural variation in cuticular hydrocarbon composition in Drosophila melanogaster
- North Carolina State University, United States
Figures
Figure 1
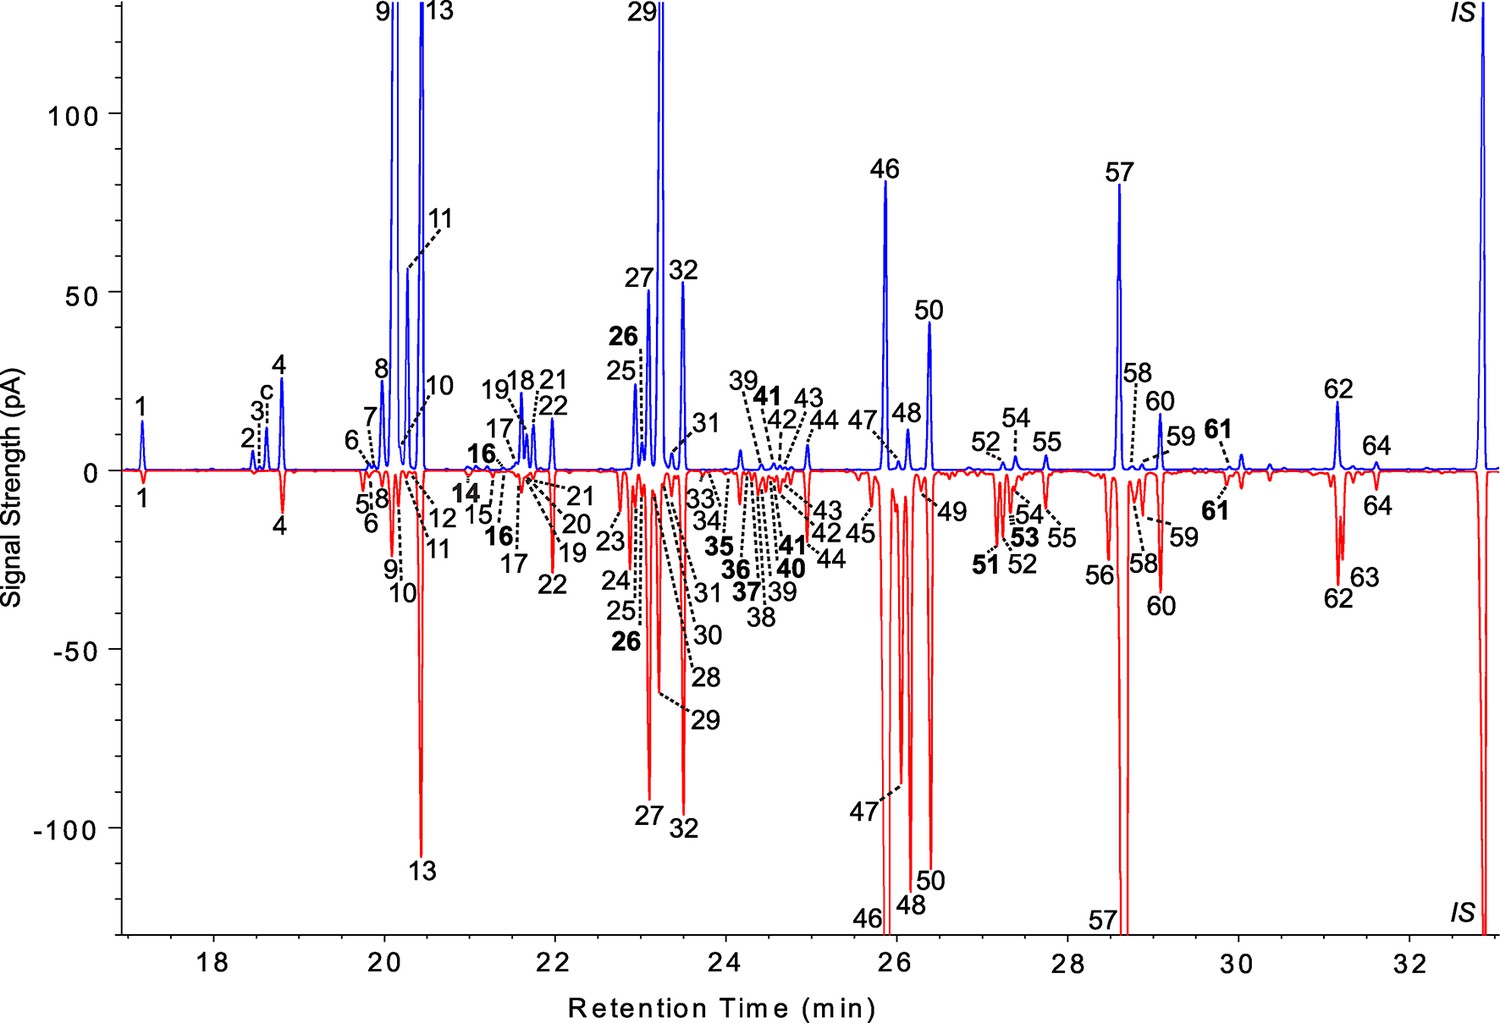
Representative male and female chromatograms from the DGRP.
Male cuticular lipids of DGRP_38 are shown on the top (blue) and female CHCs of DGRP_786 are mirrored below (red). All peaks for both sexes were assigned a unique number based on its corresponding compound determined by GC-MS; thus compounds shared between the sexes carry the same number. See Table 1 for the list of compound names. Compounds not previously described in D. melanogaster are shown in bold typeface. Some CHC isomers were not resolved by conventional GC, so a few chromatogram peaks contain more than one CHC. pA = picoAmperes, c = cis-vaccenyl acetate, * = contaminants from CHC extraction, IS = internal standard (n-C32).
Figure 2
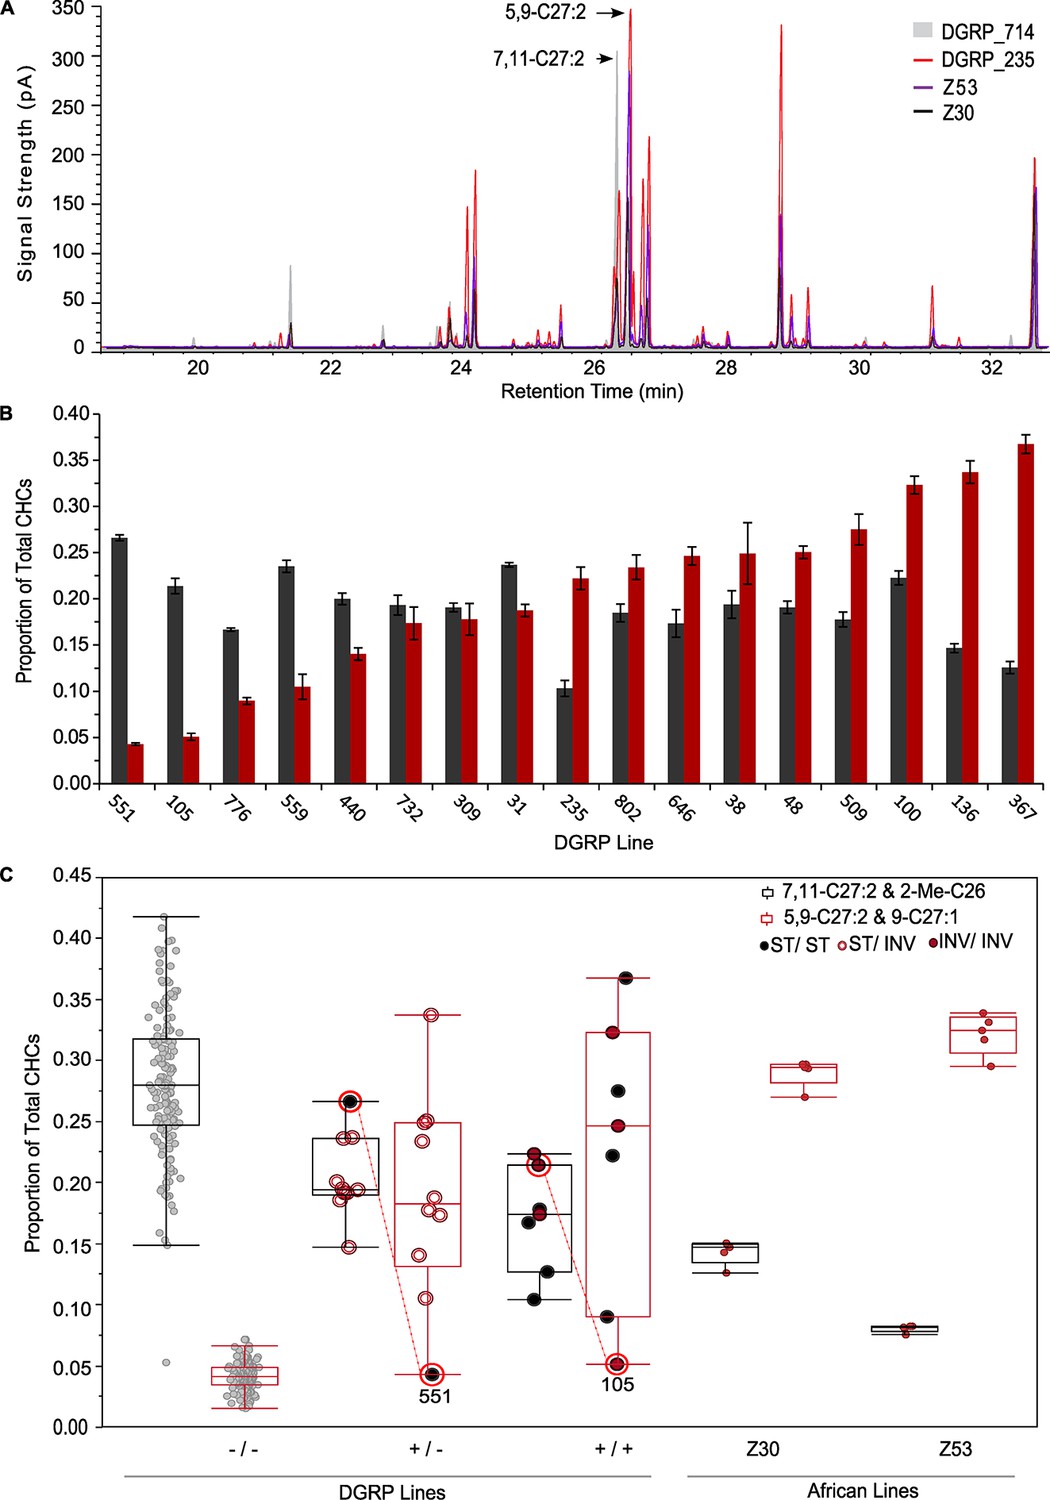
DGRP lines segregate for the female African CHC phenotype, Desat2 allele, and In3R(K) inversion status.
(A) Overlaid chromatograms of African D. melanogaster CHCs (Z30 and Z53), a DGRP line with an African-like CHC phenotype (DGRP_235), and a Cosmopolitan DGRP line (DGRP_714). (B) DGRP lines with at least one ancestral Desat2 allele exhibit natural variation in the percentage of each CHC peak for the isomeric sex pheromones 7,11-C27:2 (2-Me-C26 co-elutes with 7,11-C27:2) (gray) and 5,9-C27:2 (9-C27:1 co-elutes with 5,9-C27:2) (red). (C) Box-plots of the proportion of each sex pheromone peak for DGRP and African lines according to Desat2 allele and In3R(K) genotypes. DGRP_105 and DGRP_551, which have more Cosmopolitan-like phenotypes despite having the functional ancestral Desat2 allele, are indicated.
Figure 3
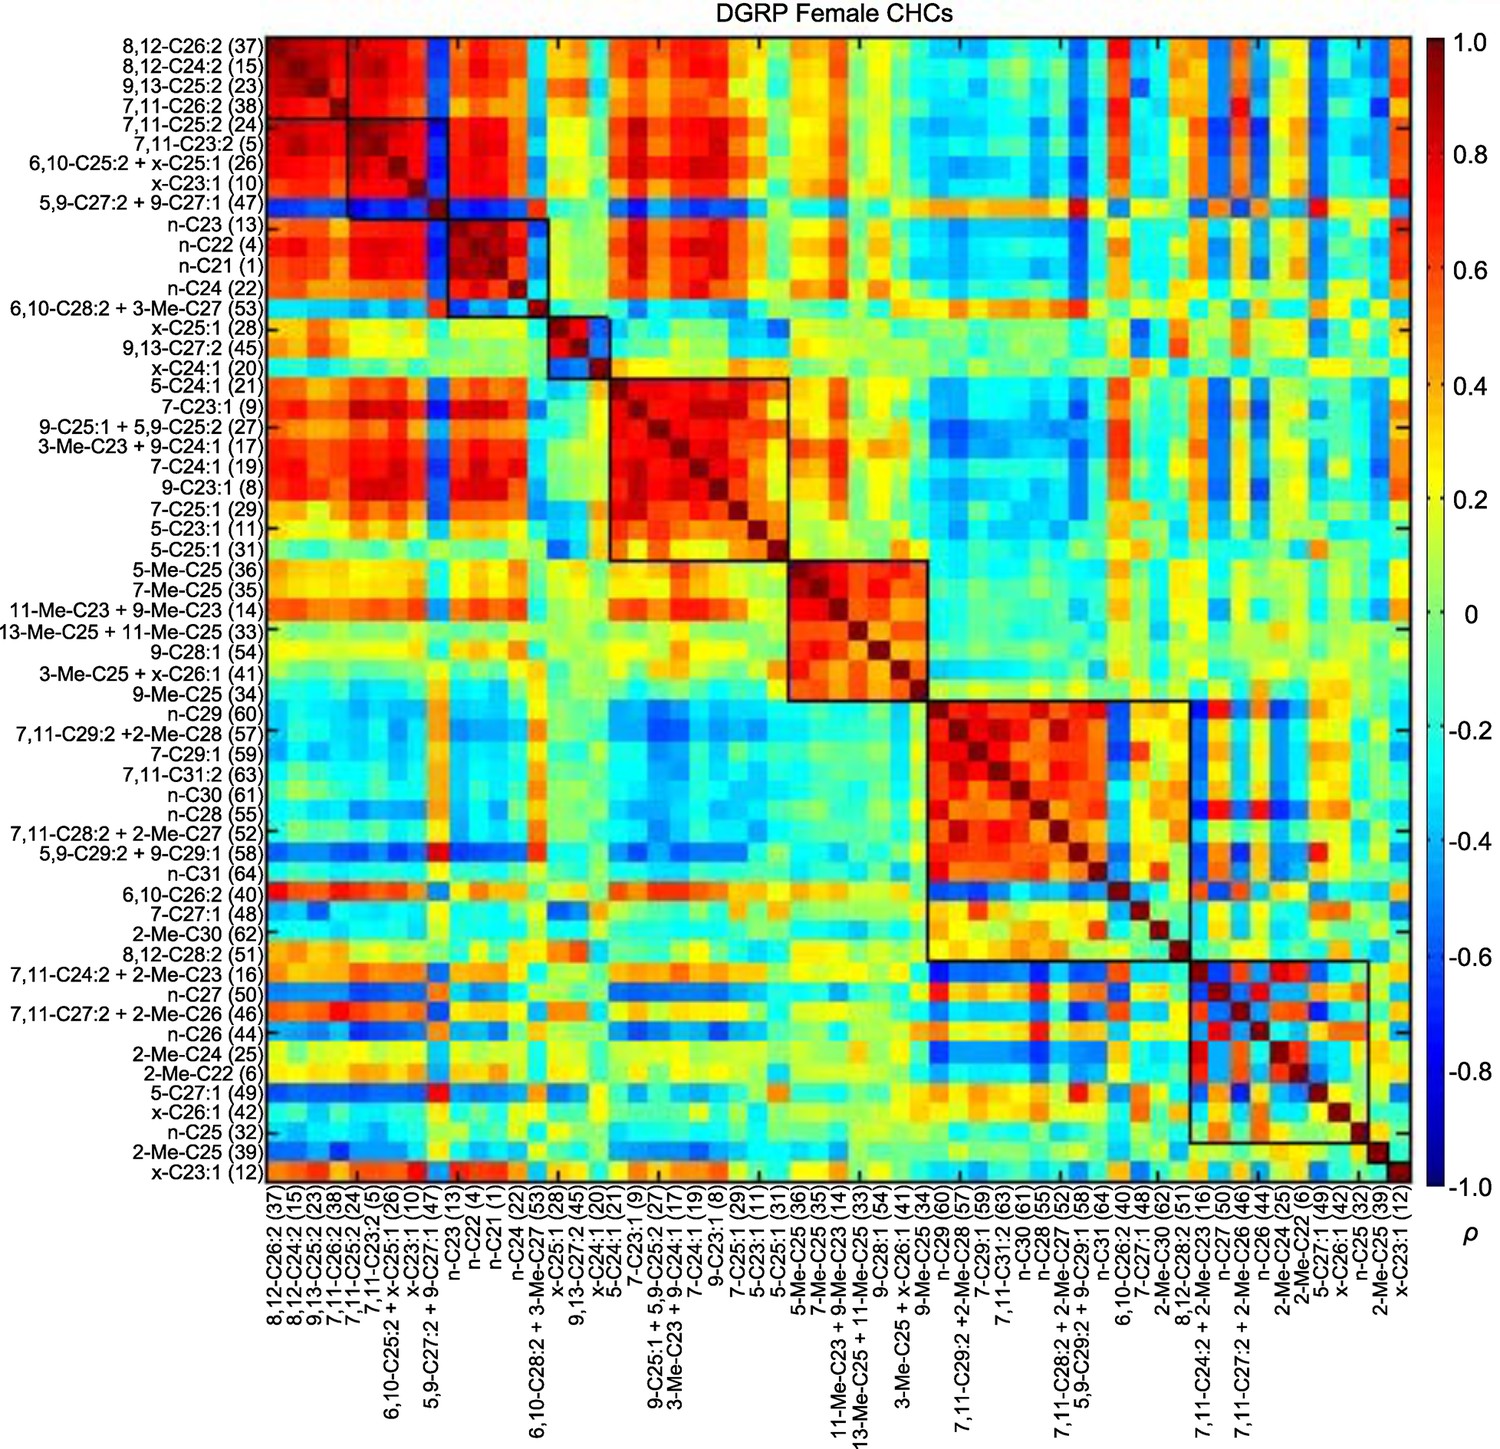
MMC modules of DGRP female CHCs based on Spearman's rank correlation coefficients (ρ).
Correlations are color-coded from +1 (dark red) to -1 (dark blue). Correlated CHCs are clustered into groups (modules). Modules (outlined in black) are arranged along the diagonal according to the average strengths of the correlations within each cluster; the most strongly correlated modules are on the top left and the weakly correlated modules are on the bottom right.
Figure 4
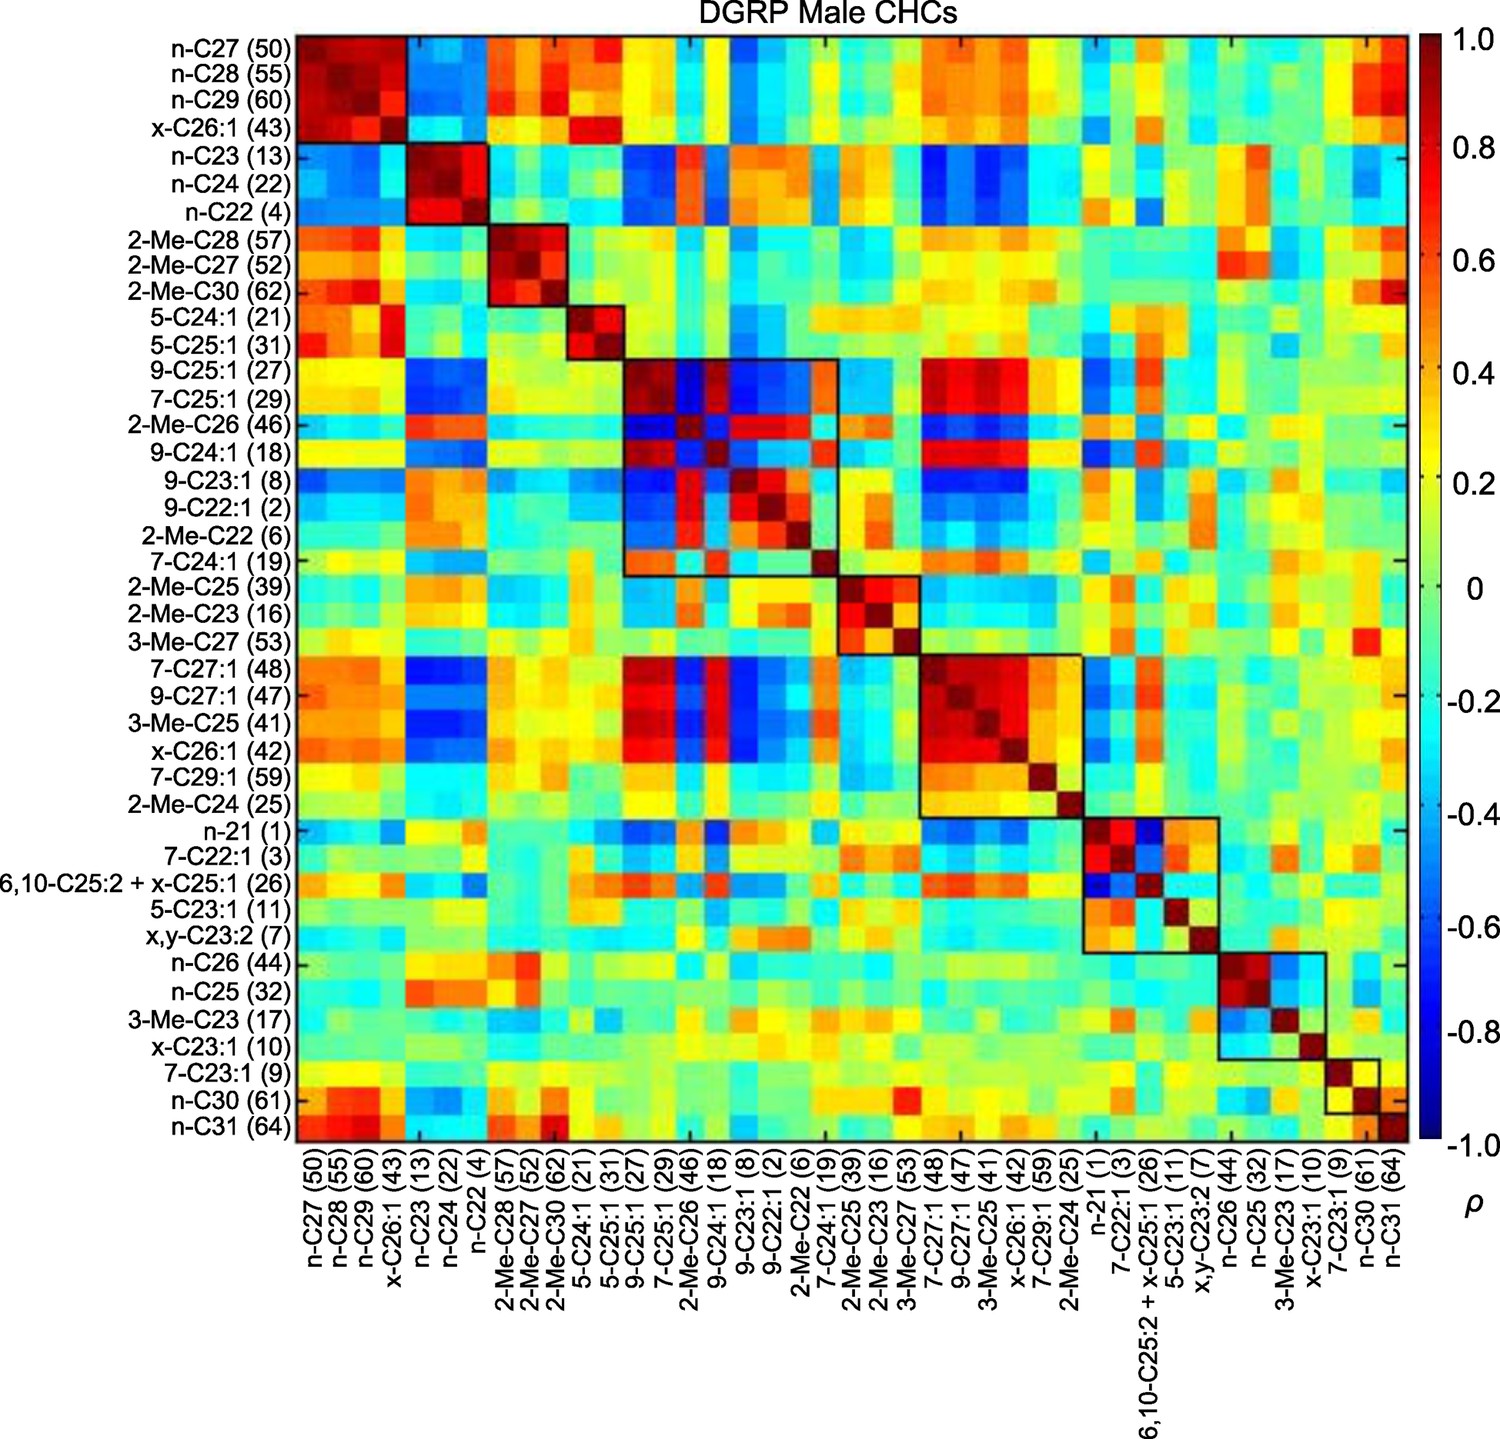
MMC modules of DGRP male CHCs based on Spearman's rank correlation coefficients (ρ).
Correlations are color-coded +1 (dark red) to -1 (dark blue). Correlated CHCs are clustered into groups (modules). Modules (outlined in black) are arranged along the diagonal according to the average strengths of the correlations within the groups; the most strongly and weakly correlated are on the top left and bottom right, respectively.
Figure 5
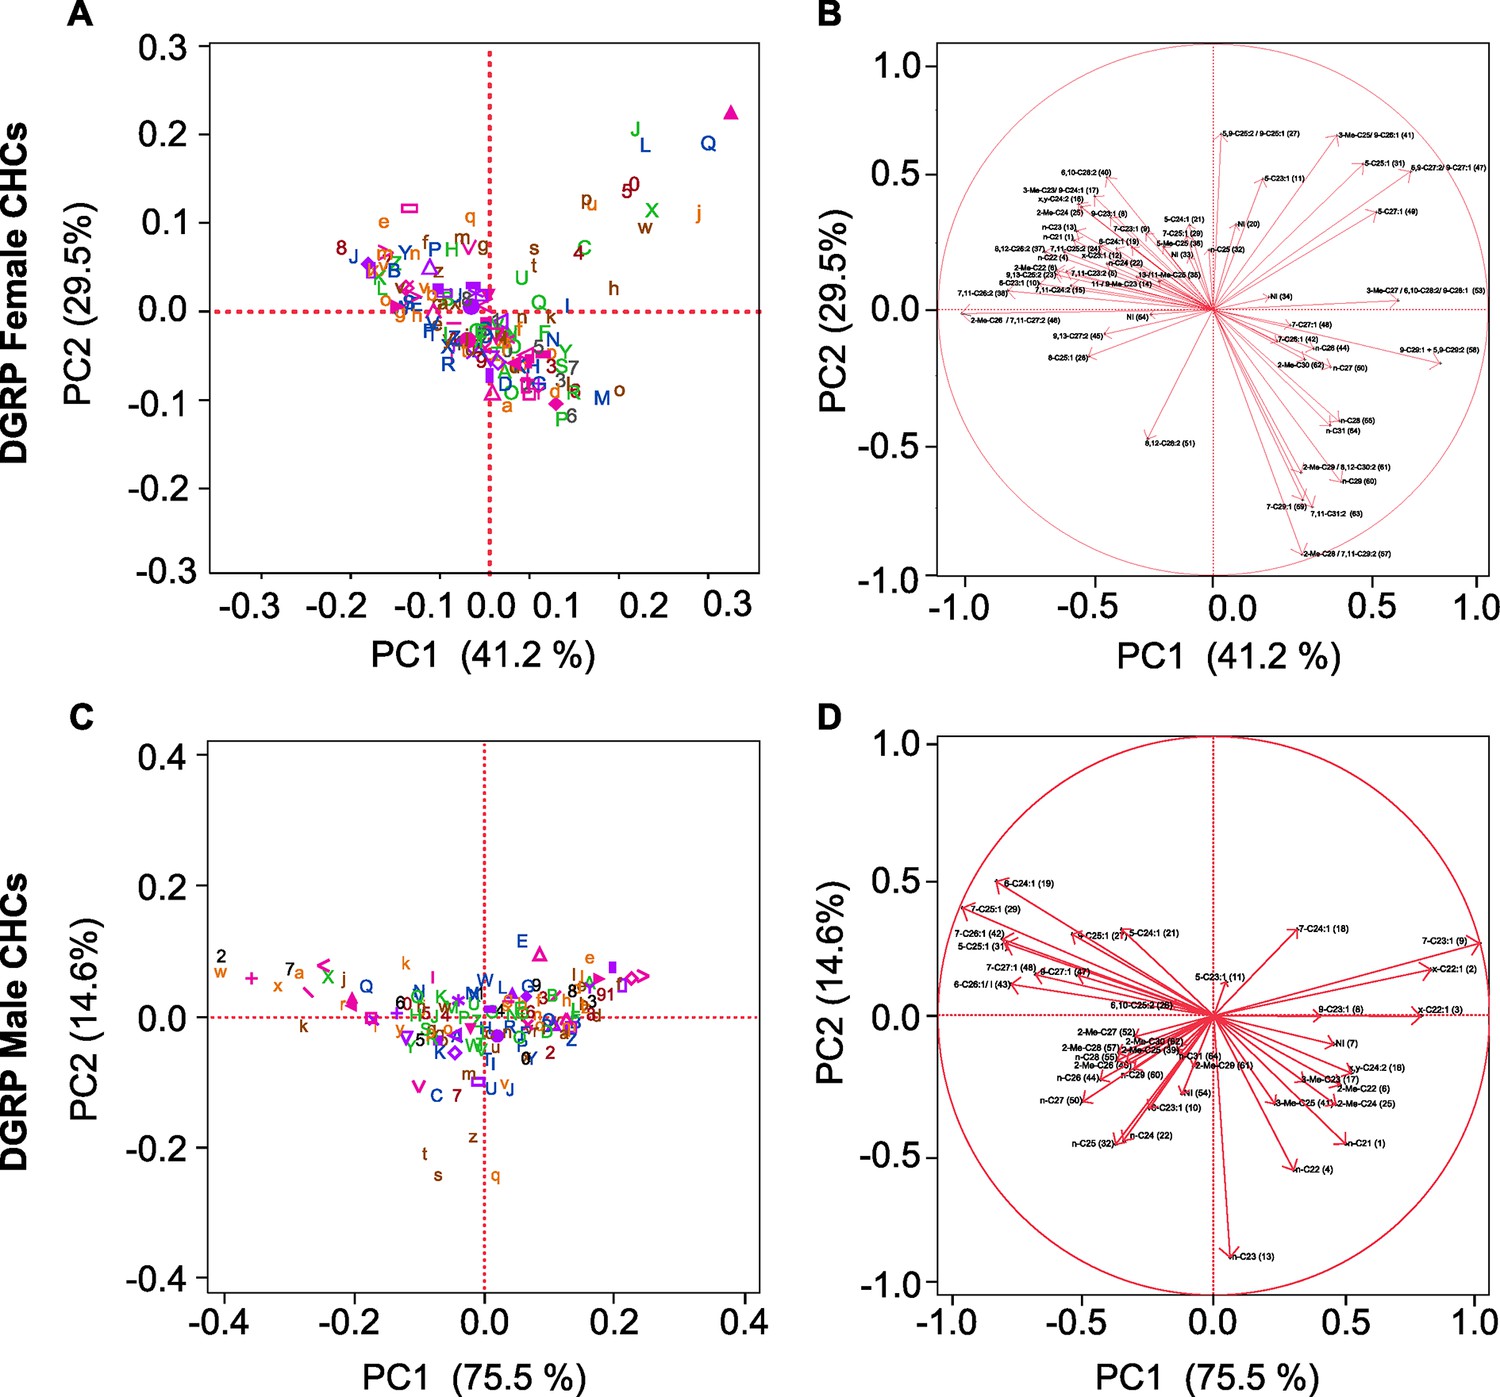
Principal component biplots for PC1 and PC2 of DGRP CHCs.
(A) Female and (C) male PC1 and PC2. (B) Female and (D) male PC1 and PC2 eigenvectors. The percent of variance explained by each PC is indicated on the x- and y-axes. In (A) and (C) DGRP lines are color-coded (Supplementary file 5).
Figure 6
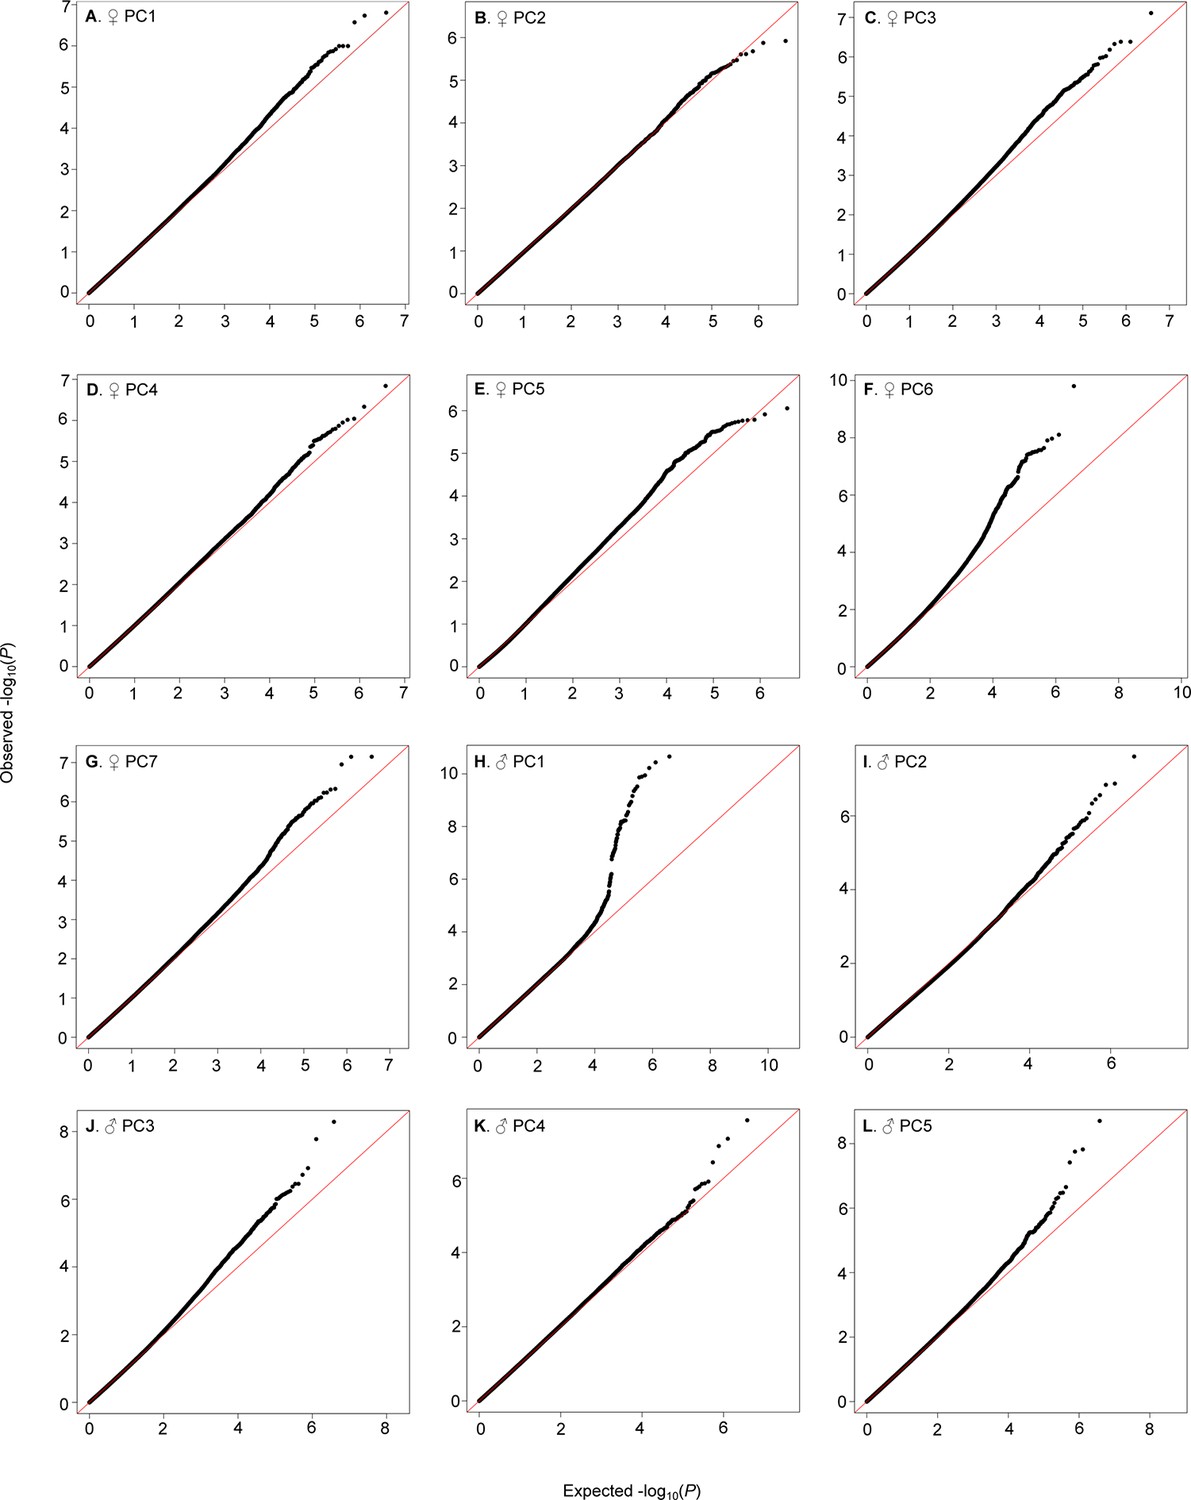
QQ-plots of CHC PCA GWA P-values.
(A–G) Female PCs. (H–L) Male PCs.
Figure 7 with 24 supplements
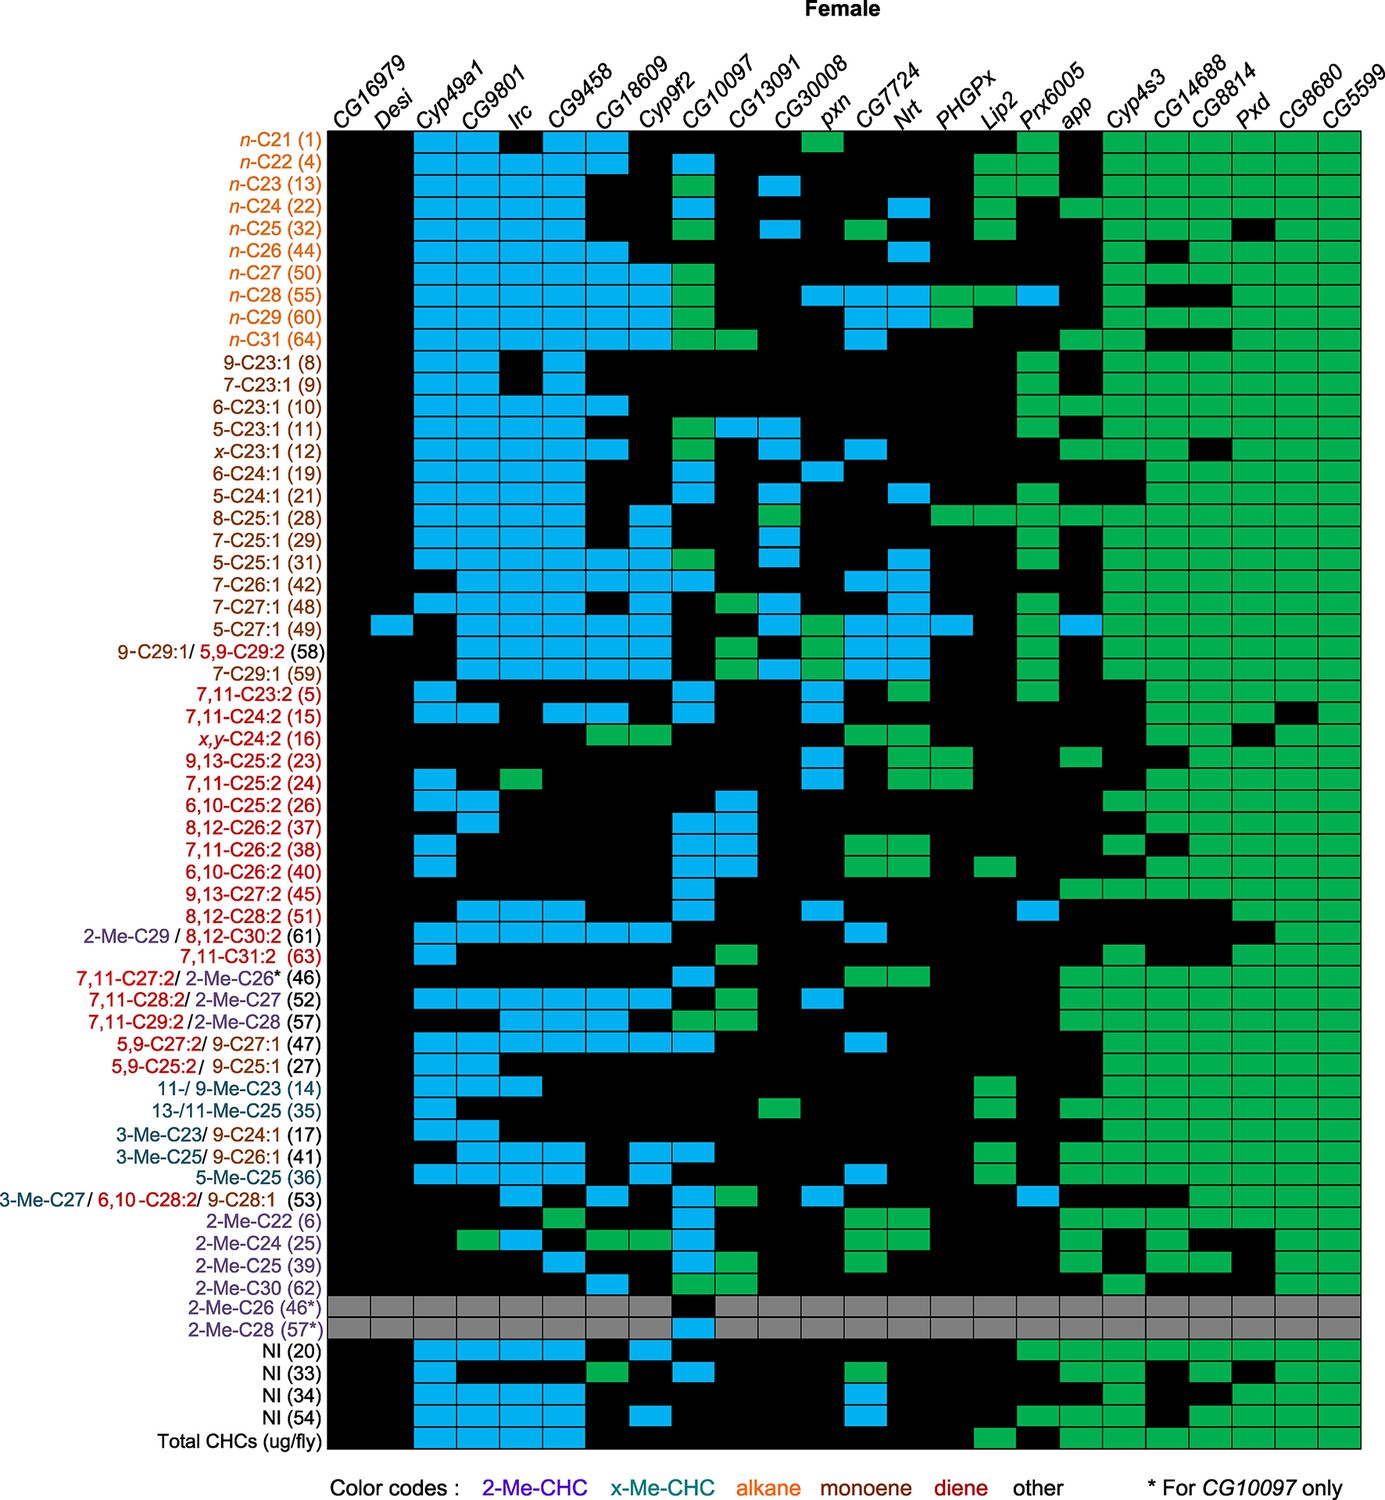
Summary of RNAi and mutant experiments for female CHCs.
UAS-RNAi target gene and the CG10097e00276 mutant are indicated on the horizontal axis. CHC names and numbers are listed on the y-axis. Data are color coded to represent P-values (P ≤ 0.05) from t-tests for the mean differences of the experimental and the control lines. Black = no significant change; blue = significant decrease; green = significant increase; gray = not applicable (peaks 46 and 57 split into two peaks for the CG10097 mutant).
Figure 7—figure supplement 1
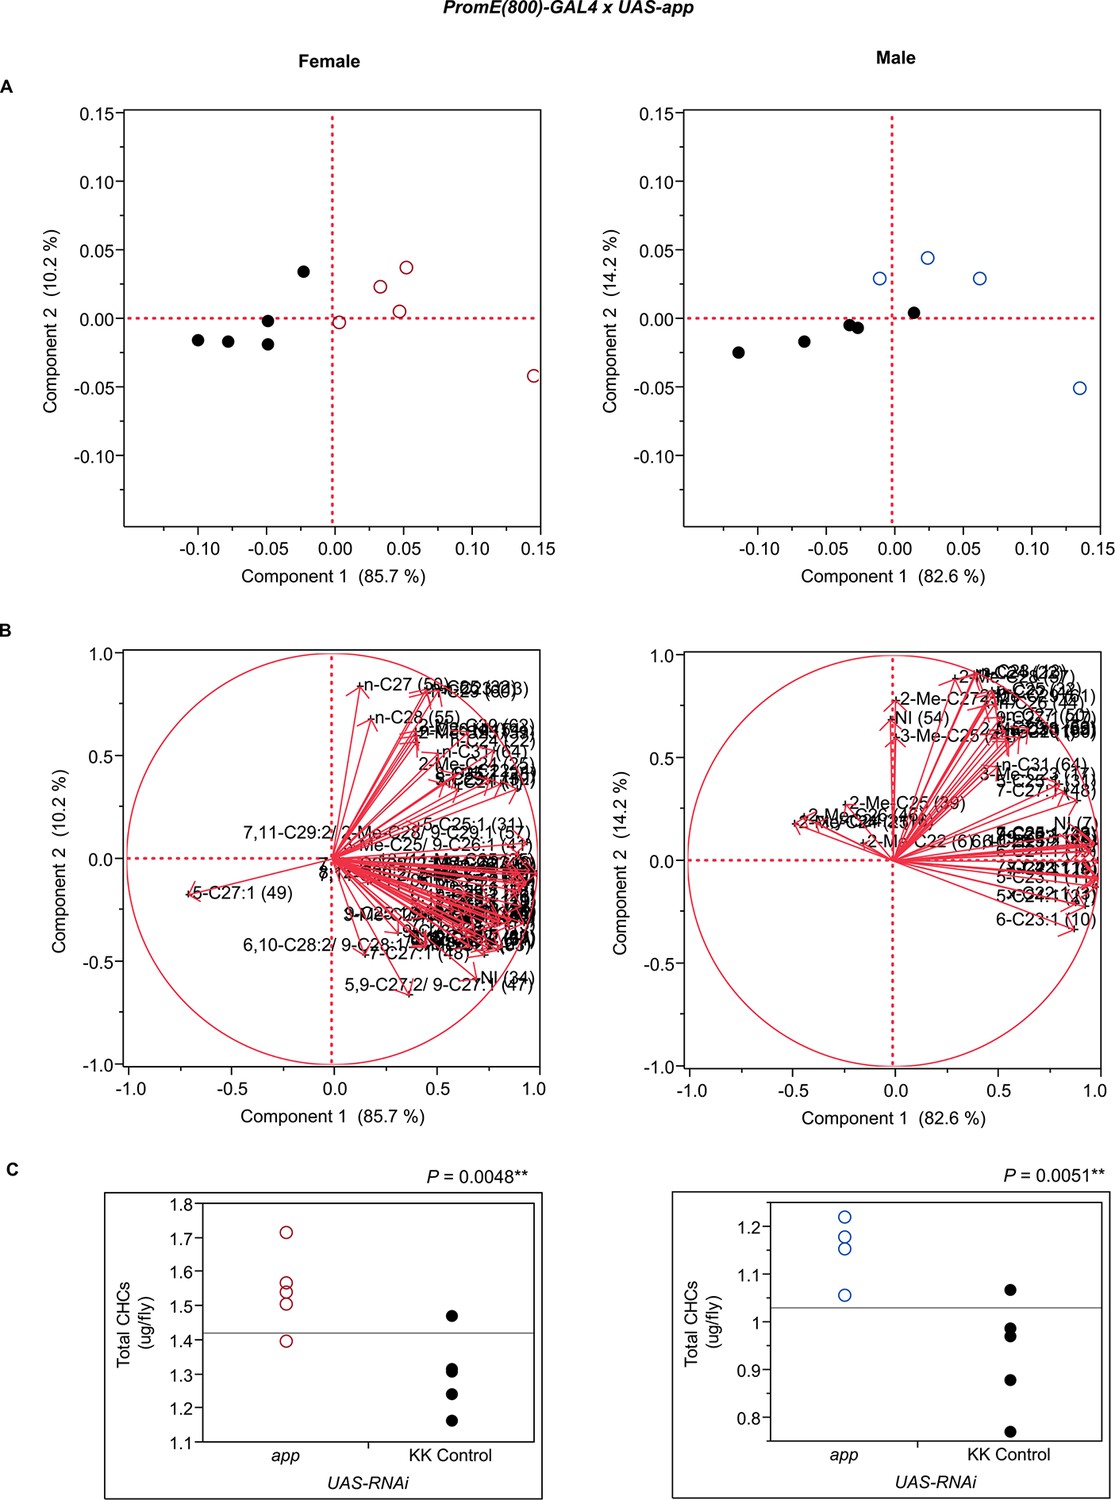
Functional validation PCA and total CHCs for RNAi-app.
(A) PCA biplots for females and males, ○ = female, ○ = male, and ● = control samples. (B) PC1 and PC2 eigenvectors. (C) Box-plots of female and male total amount of CHCs (µg/fly). P-values are reported for the Satterthwaite test, *: P < 0.05, **: P < 0.01, ***: P < 0.001.
Figure 7—figure supplement 2

Functional validation PCA and total CHCs for RNAi-CG5599.
(A) PCA biplots for females and males, ○ = female, ○ = male, and ● = control samples. (B) PC1 and PC2 eigenvectors. (C) Box-plots of female and male total amount of CHCs (µg/fly). P-values are reported for the Satterthwaite test, *: P < 0.05, **: P < 0.01, ***: P < 0.001.
Figure 7—figure supplement 3
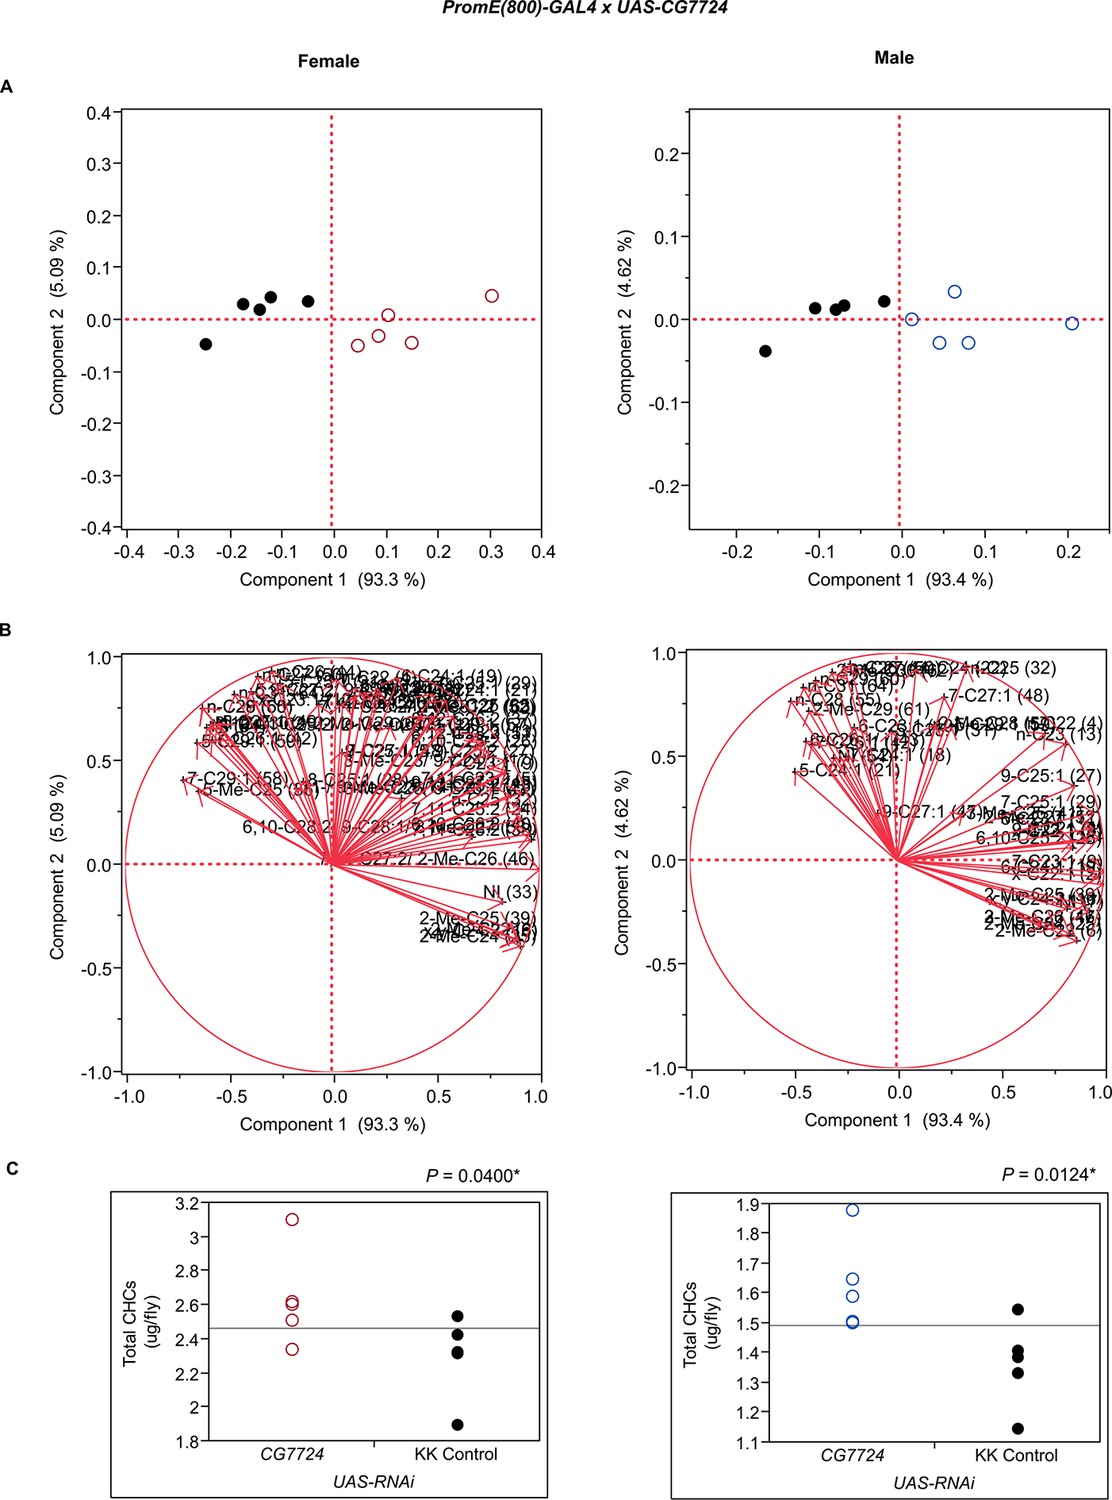
Functional validation PCA and total CHCs for RNAi-CG7724.
(A) PCA biplots for females and males, ○ = female, ○ = male, and ● = control samples. (B) PC1 and PC2 eigenvectors. (C) Box-plots of female and male total amount of CHCs (µg/fly). P-values are reported for the Satterthwaite test, *: P < 0.05, **: P < 0.01, ***: P < 0.001.
Figure 7—figure supplement 4
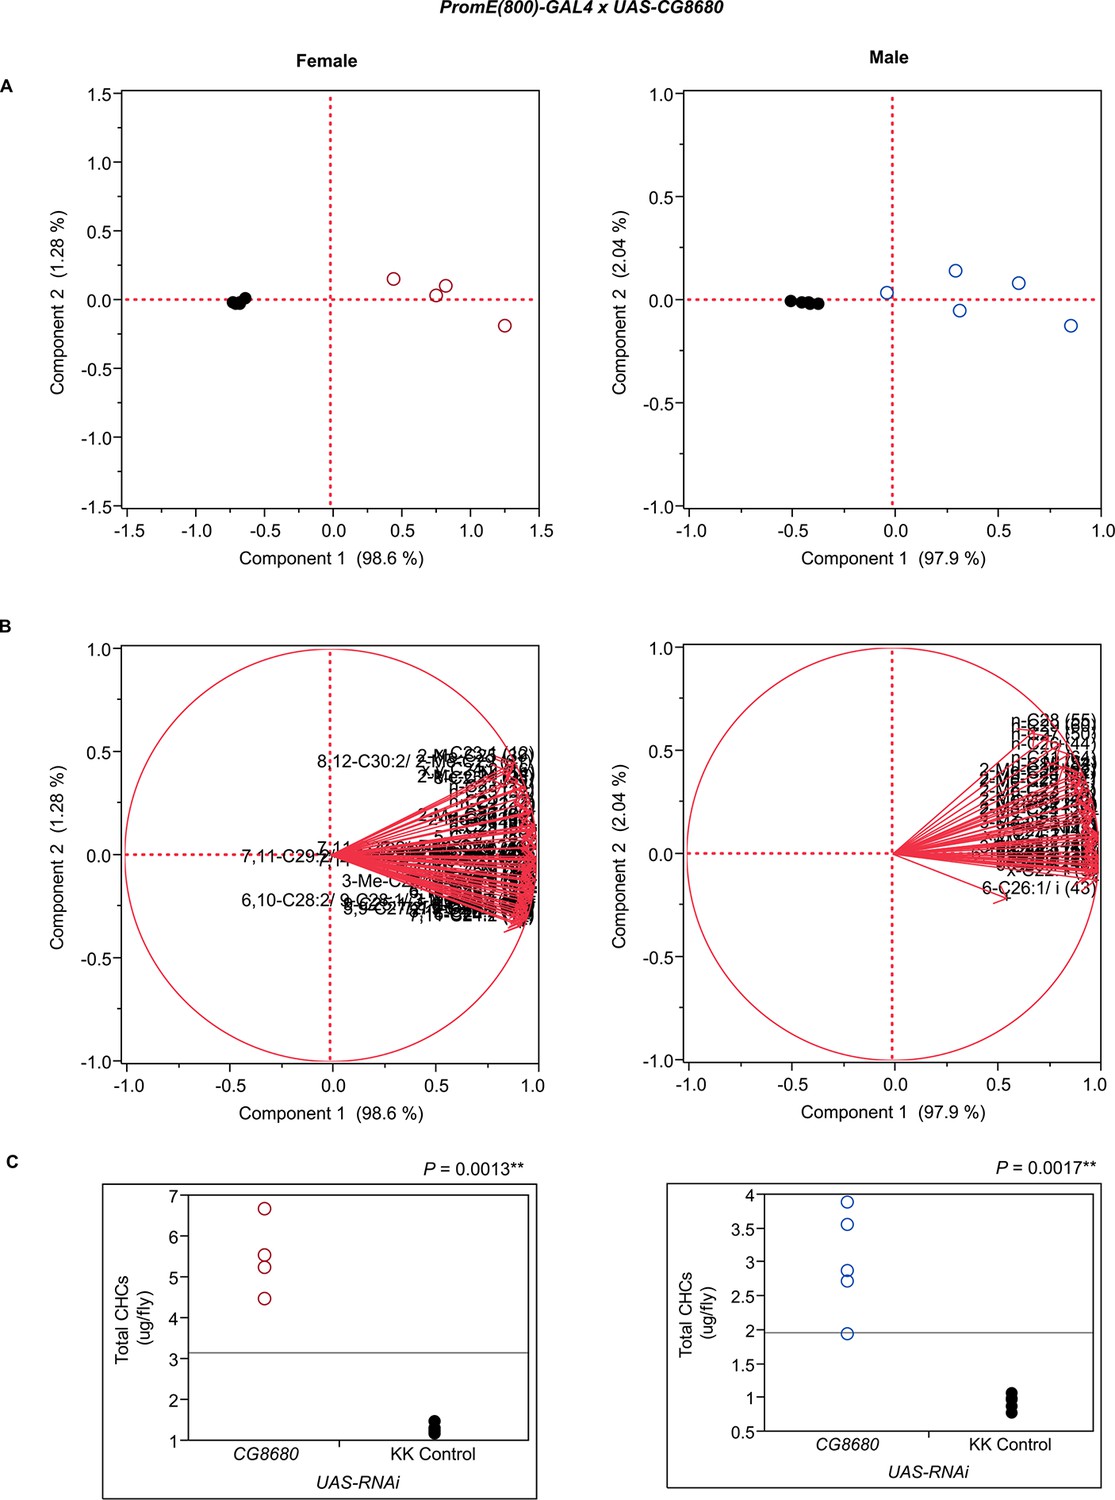
Functional validation PCA and total CHCs for RNAi-CG8680.
(A) PCA biplots for females and males, ○ = female, ○ = male, and ● = control samples. (B) PC1 and PC2 eigenvectors. (C) Box-plots of female and male total amount of CHCs (µg/fly). P-values are reported for the Satterthwaite test, *: P < 0.05, **: P < 0.01, ***: P < 0.001.
Figure 7—figure supplement 5
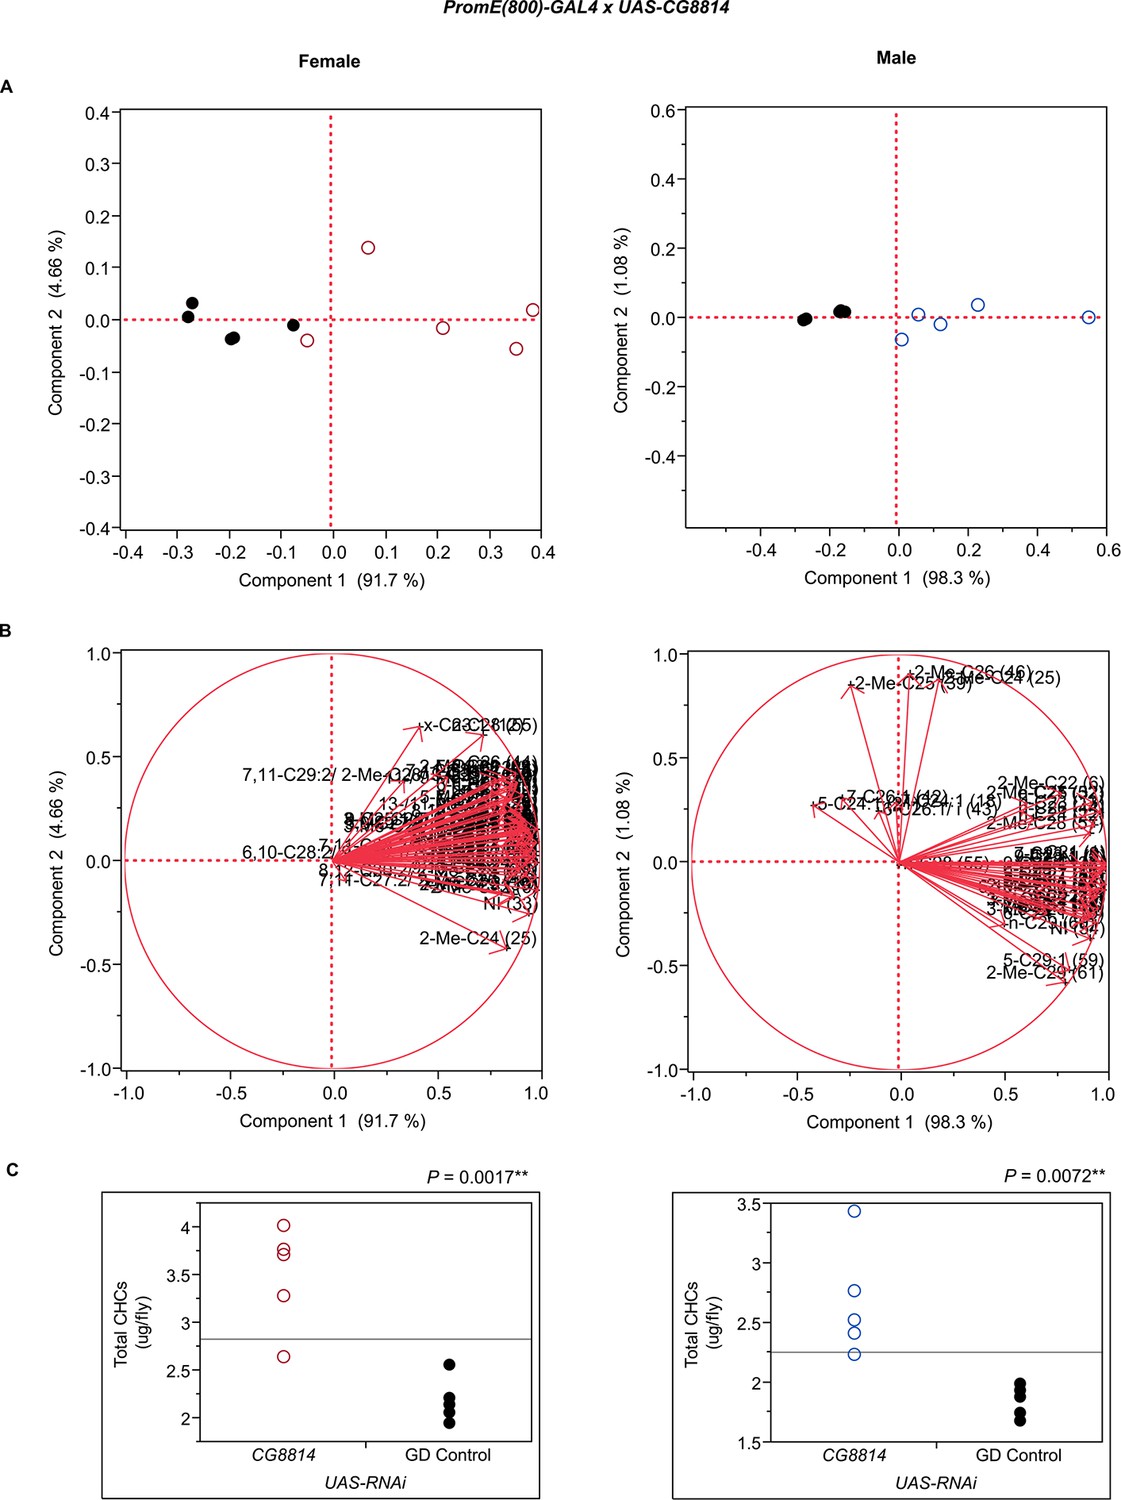
Functional validation PCA and total CHCs for RNAi-CG8814.
(A) PCA biplots for females and males, ○ = female, ○ = male, and ● = control samples. (B) PC1 and PC2 eigenvectors. (C) Box-plots of female and male total amount of CHCs (µg/fly). P-values are reported for the Satterthwaite test, *: P < 0.05, **: P < 0.01, ***: P < 0.001.
Figure 7—figure supplement 6
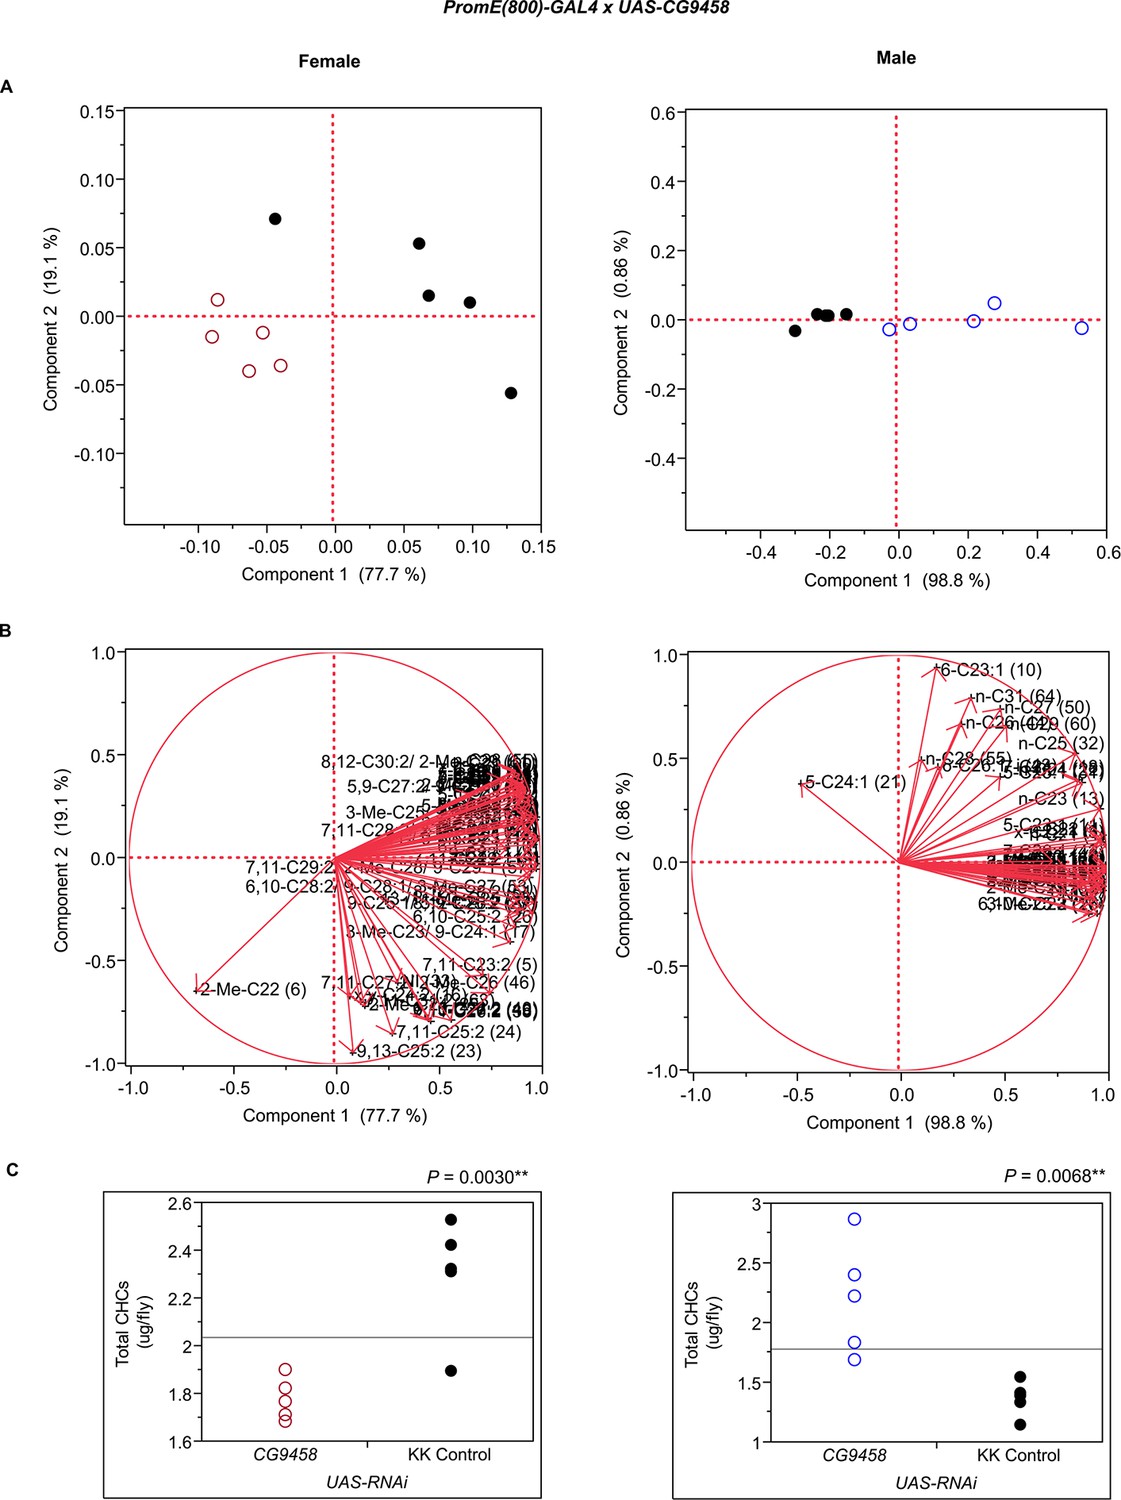
Functional validation PCA and total CHCs for RNAi-CG9458.
(A) PCA biplots for females and males, ○ = female, ○ = male, and ● = control samples. (B) PC1 and PC2 eigenvectors. (C) Box-plots of female and male total amount of CHCs (µg/fly). P-values are reported for the Satterthwaite test, *: P < 0.05, **: P < 0.01, ***: P < 0.001.
Figure 7—figure supplement 7

Functional validation PCA and total CHCs for RNAi-CG9801.
(A) PCA biplots for females and males, ○ = female, ○ = male, and ● = control samples. (B) PC1 and PC2 eigenvectors. (C) Box-plots of female and male total amount of CHCs (µg/fly). P-values are reported for the Satterthwaite test, *: P < 0.05, **: P < 0.01, ***: P < 0.001.
Figure 7—figure supplement 8
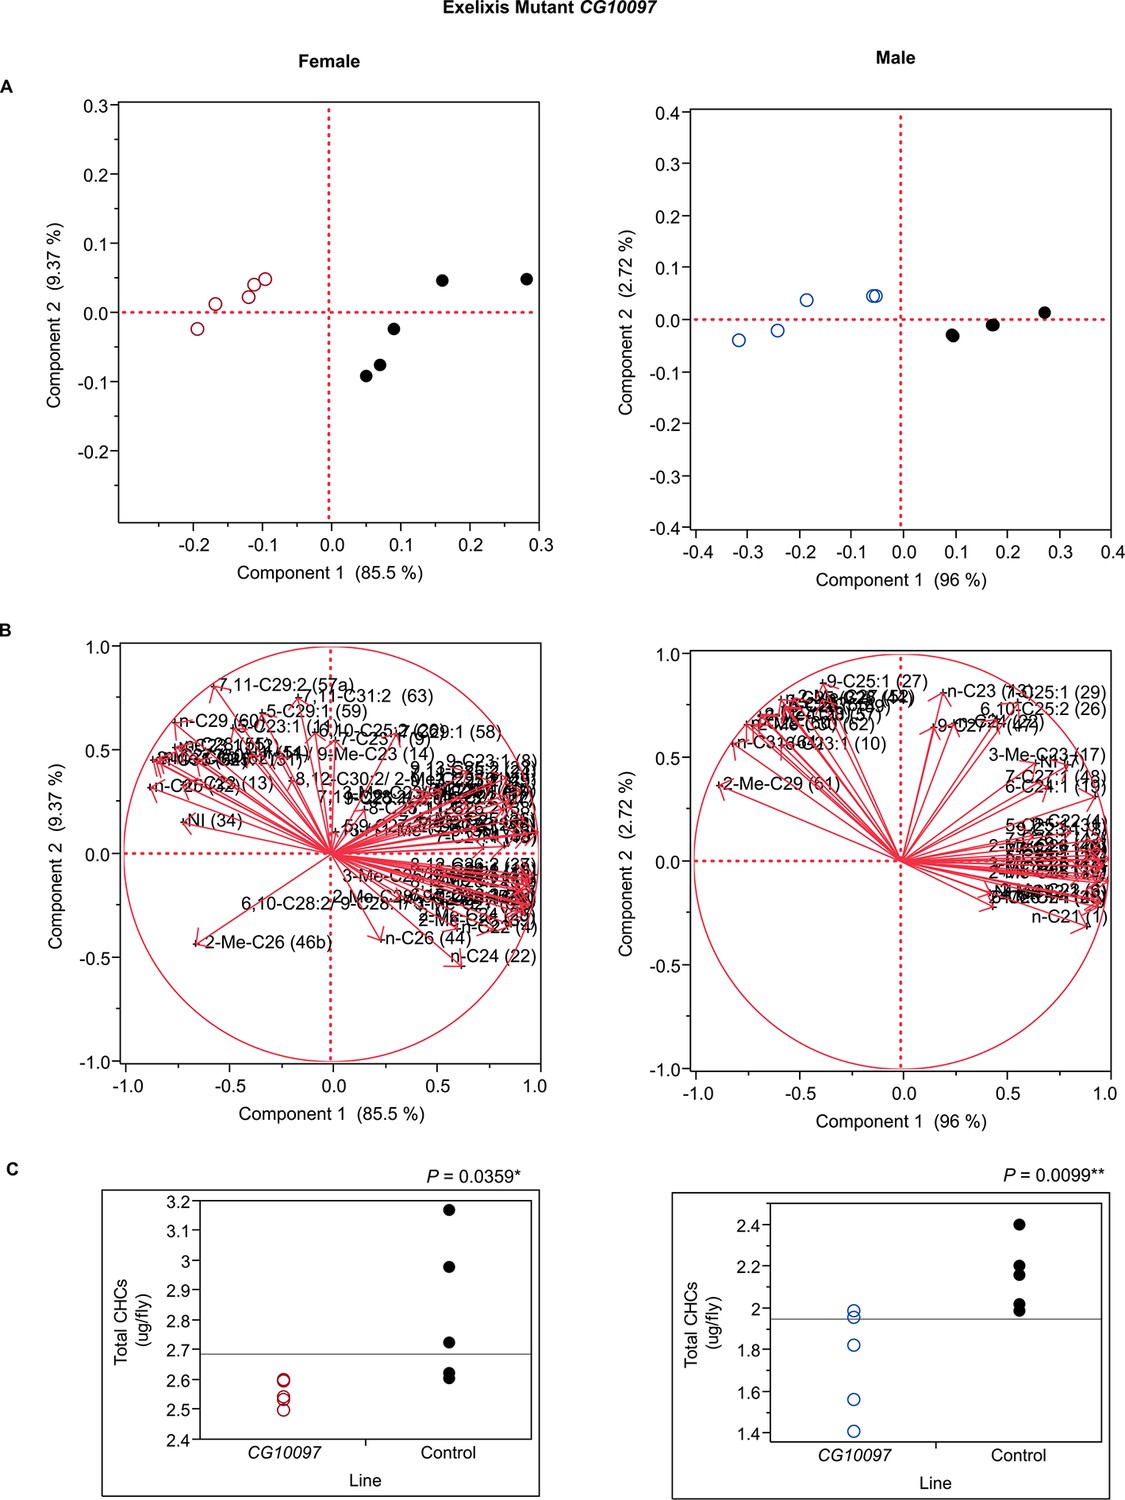
Functional validation PCA and total CHCs for mutant CG10097.
(A) PCA biplots for females and males, ○ = female, ○ = male, and ● = control samples. (B) PC1 and PC2 eigenvectors. (C) Box-plots of female and male total amount of CHCs (µg/fly). P-values are reported for the Satterthwaite test, *: P < 0.05, **: P < 0.01, ***: P < 0.001.
Figure 7—figure supplement 9
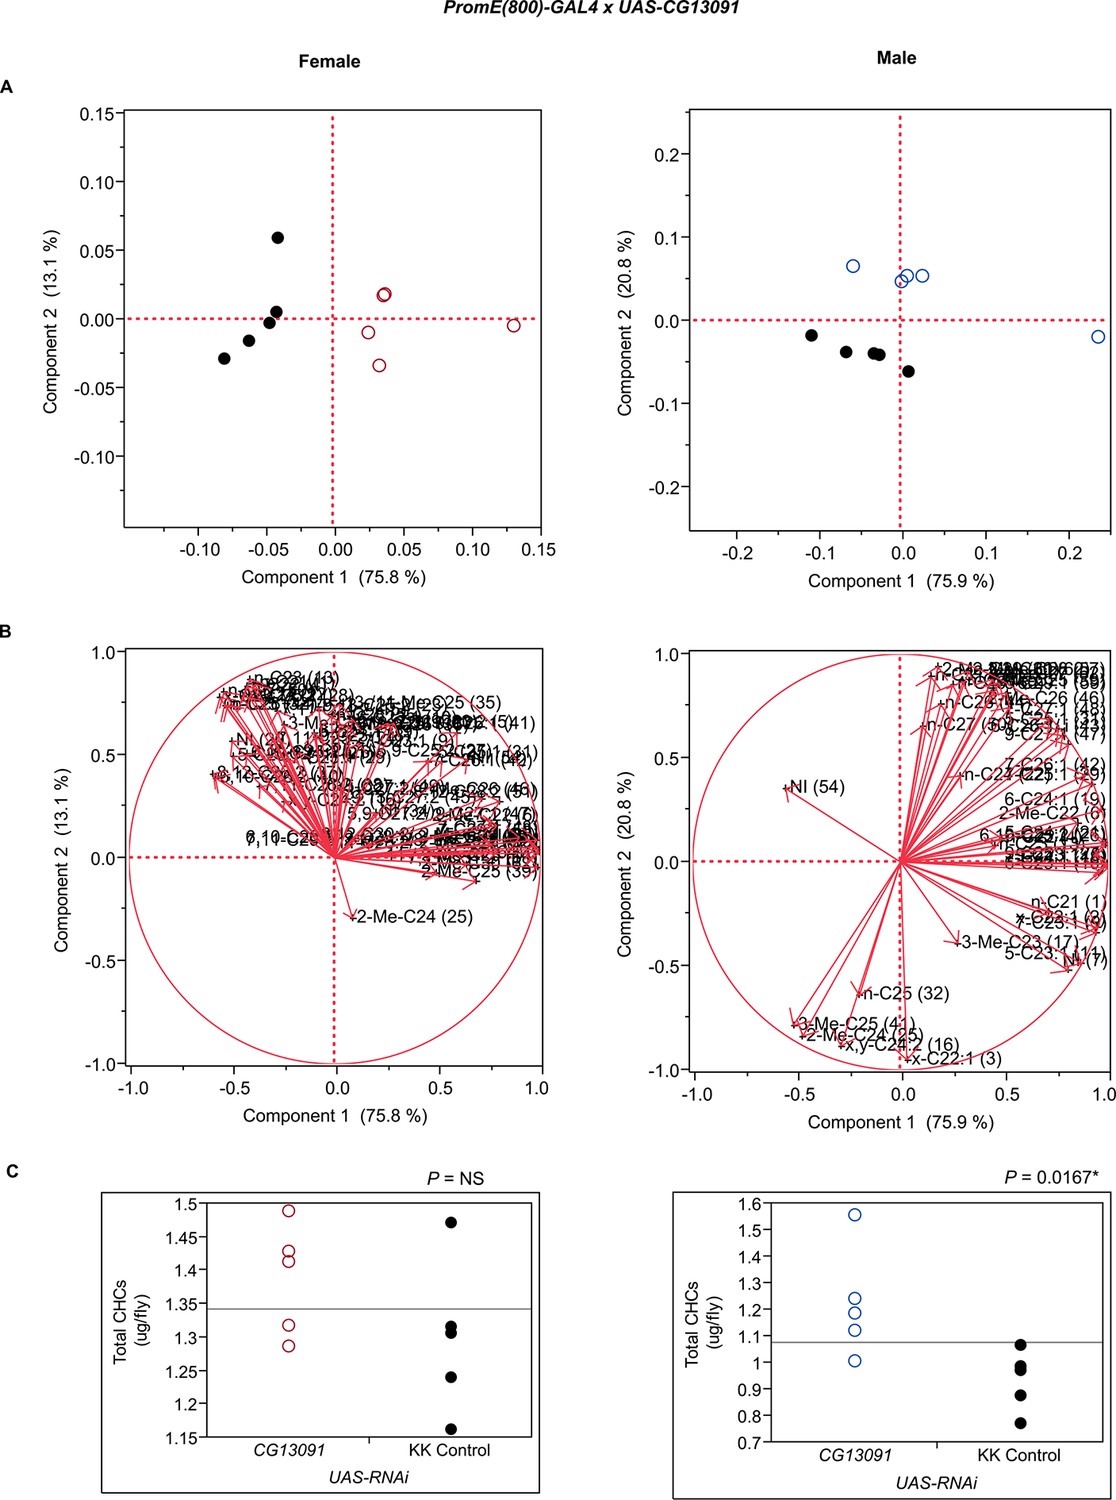
Functional validation PCA and total CHCs for RNAi-CG13091.
(A) PCA biplots for females and males, ○ = female, ○ = male, and ● = control samples. (B) PC1 and PC2 eigenvectors. (C) Box-plots of female and male total amount of CHCs (µg/fly). P-values are reported for the Satterthwaite test, *: P < 0.05, **: P < 0.01, ***: P < 0.001.
Figure 7—figure supplement 10
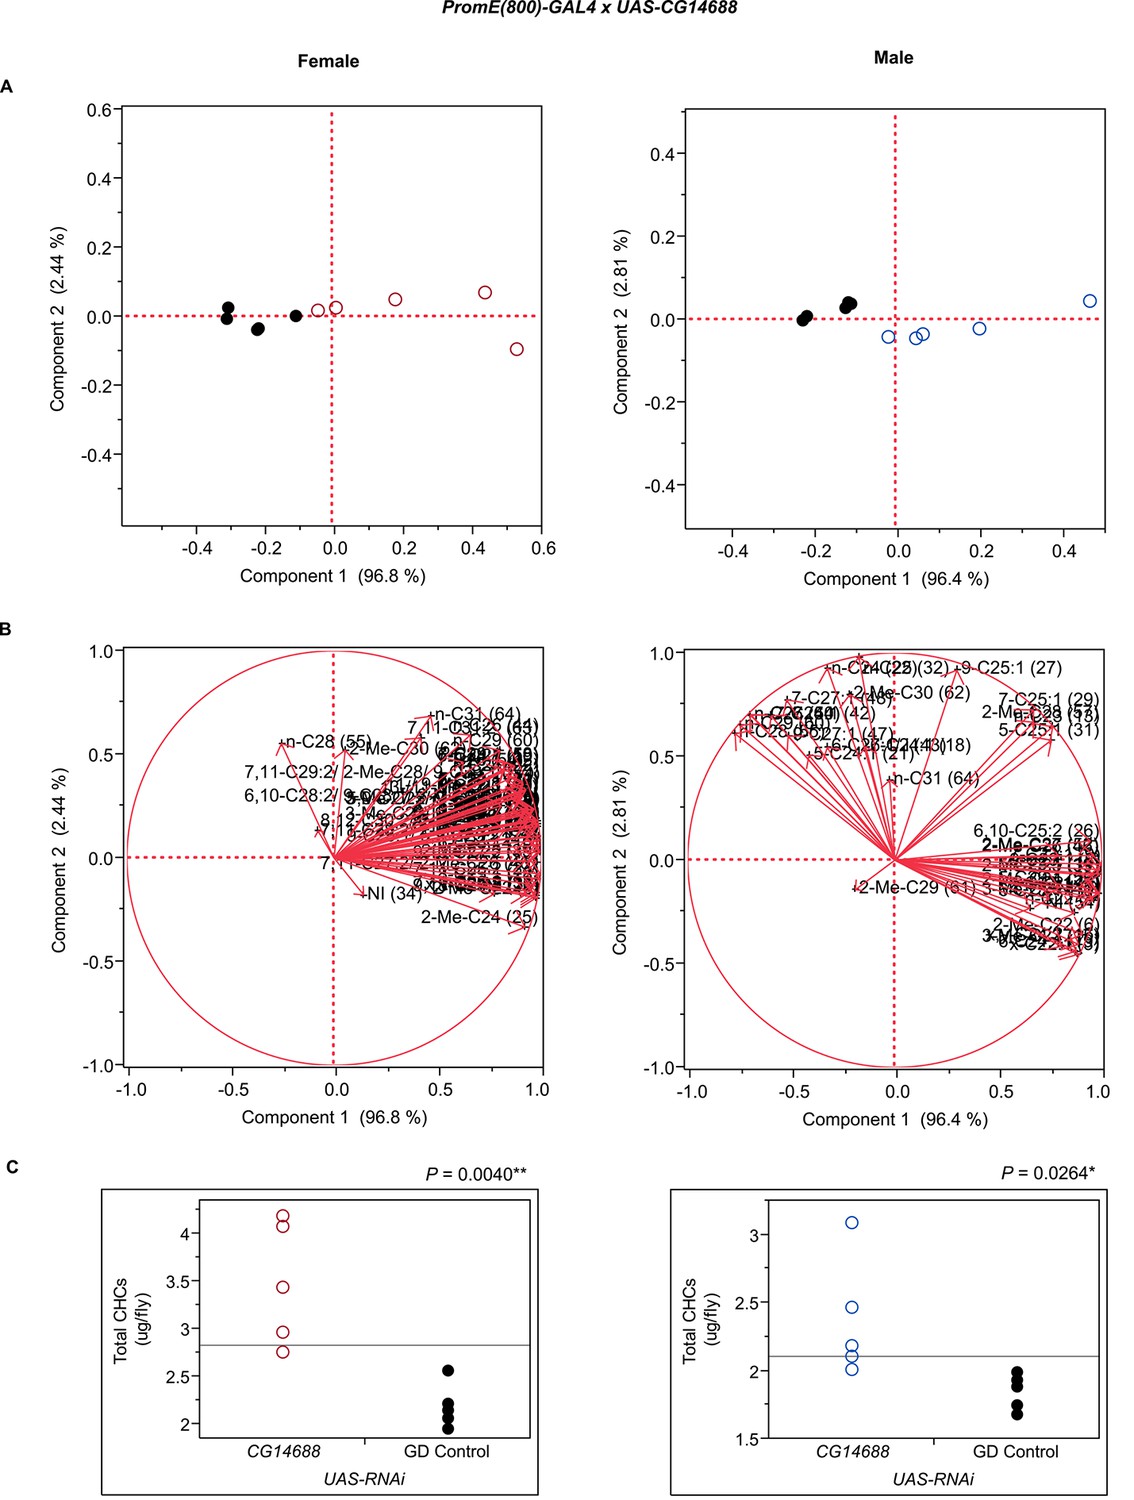
Functional validation PCA and total CHCs for RNAi-CG14688.
(A) PCA biplots for females and males, ○ = female, ○ = male, and ● = control samples. (B) PC1 and PC2 eigenvectors. (C) Box-plots of female and male total amount of CHCs (µg/fly). P-values are reported for the Satterthwaite test, *: P < 0.05, **: P < 0.01, ***: P < 0.001.
Figure 7—figure supplement 11
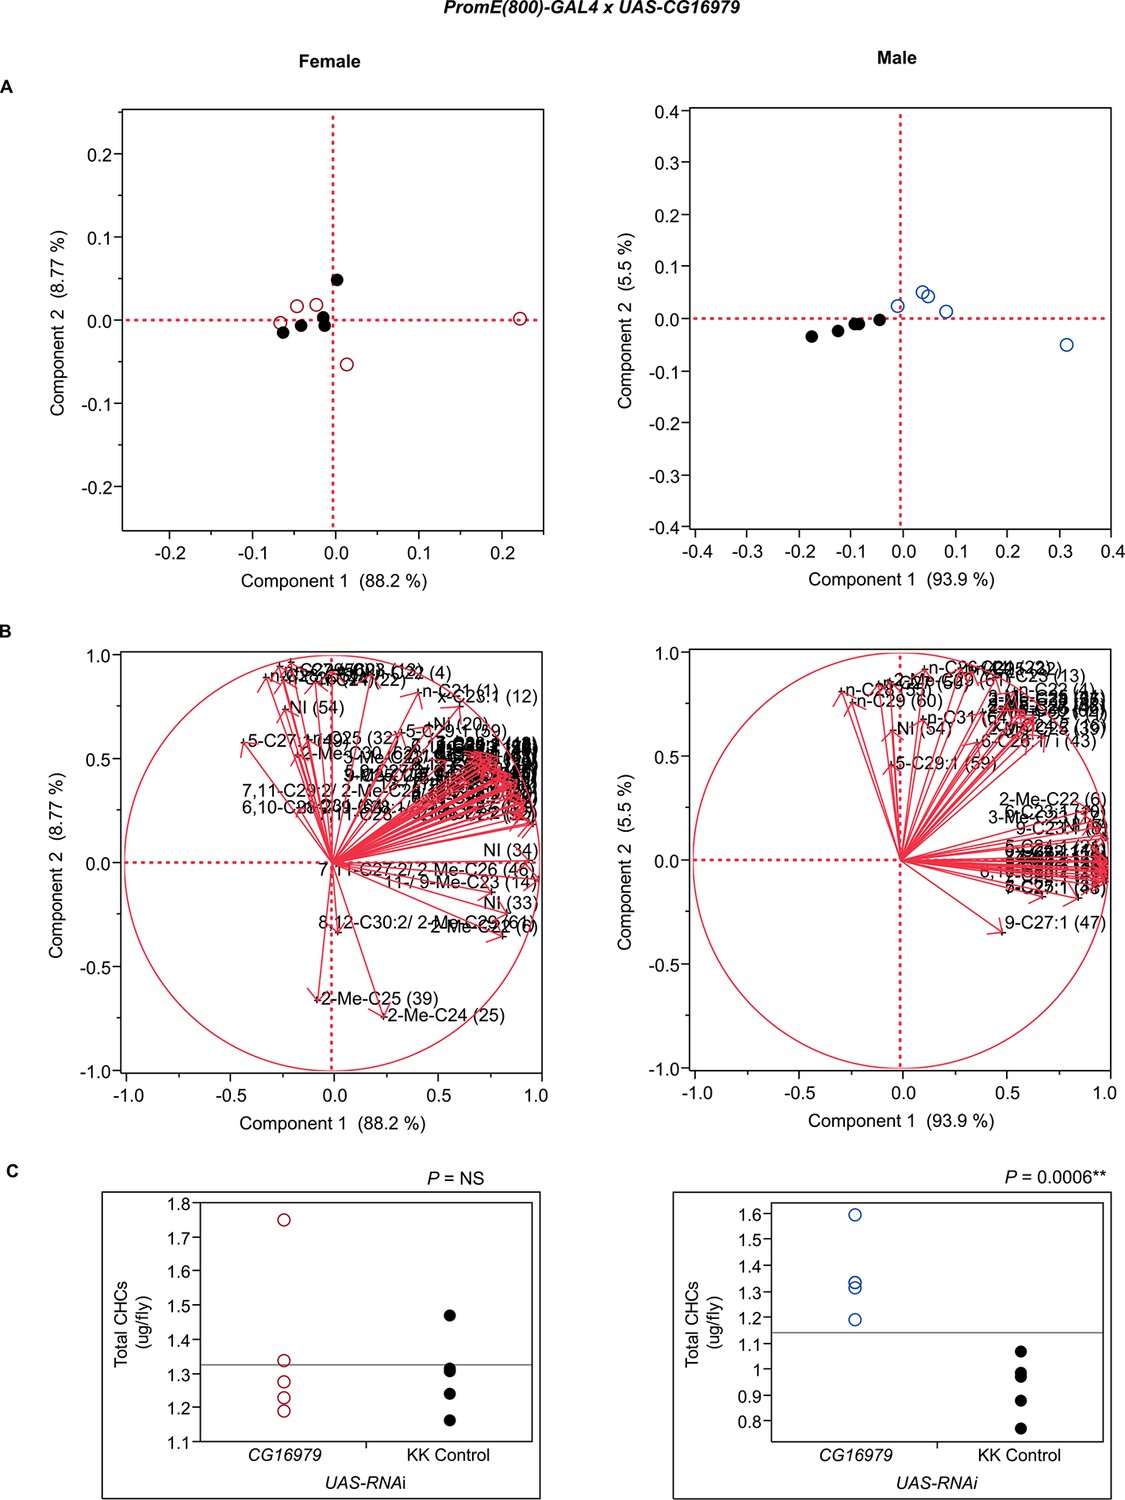
Functional validation PCA and total CHCs for RNAi-CG16979.
(A) PCA biplots for females and males, ○ = female, ○ = male, and ● = control samples. (B) PC1 and PC2 eigenvectors. (C) Box-plots of female and male total amount of CHCs (µg/fly). P-values are reported for the Satterthwaite test, *: P < 0.05, **: P < 0.01, ***: P < 0.001.
Figure 7—figure supplement 12
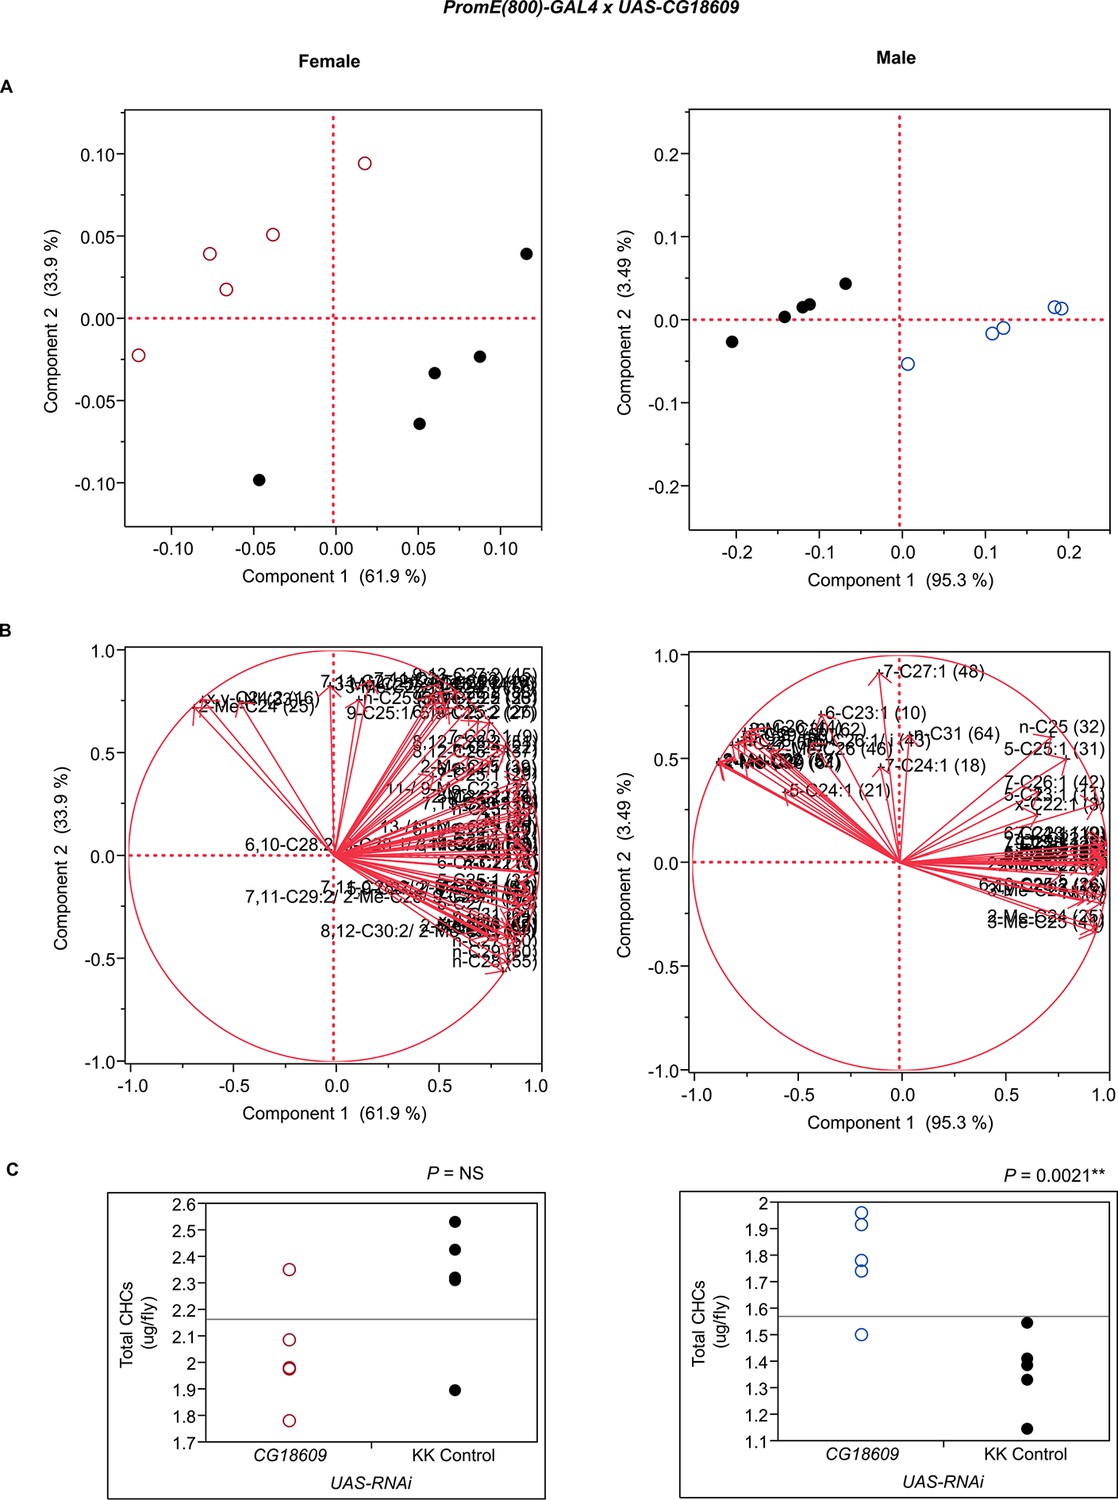
Functional validation PCA and total CHCs for RNAi-CG18609.
(A) PCA biplots for females and males, ○ = female, ○ = male, and ● = control samples. (B) PC1 and PC2 eigenvectors. (C) Box-plots of female and male total amount of CHCs (µg/fly). P-values are reported for the Satterthwaite test, *: P < 0.05, **: P < 0.01, ***: P < 0.001.
Figure 7—figure supplement 13

Functional validation PCA and total CHCs for RNAi-CG30008.
(A) PCA biplots for females and males, ○ = female, ○ = male, and ● = control samples. (B) PC1 and PC2 eigenvectors. (C) Box-plots of female and male total amount of CHCs (µg/fly). P-values are reported for the Satterthwaite test, *: P < 0.05, **: P < 0.01, ***: P < 0.001.
Figure 7—figure supplement 14
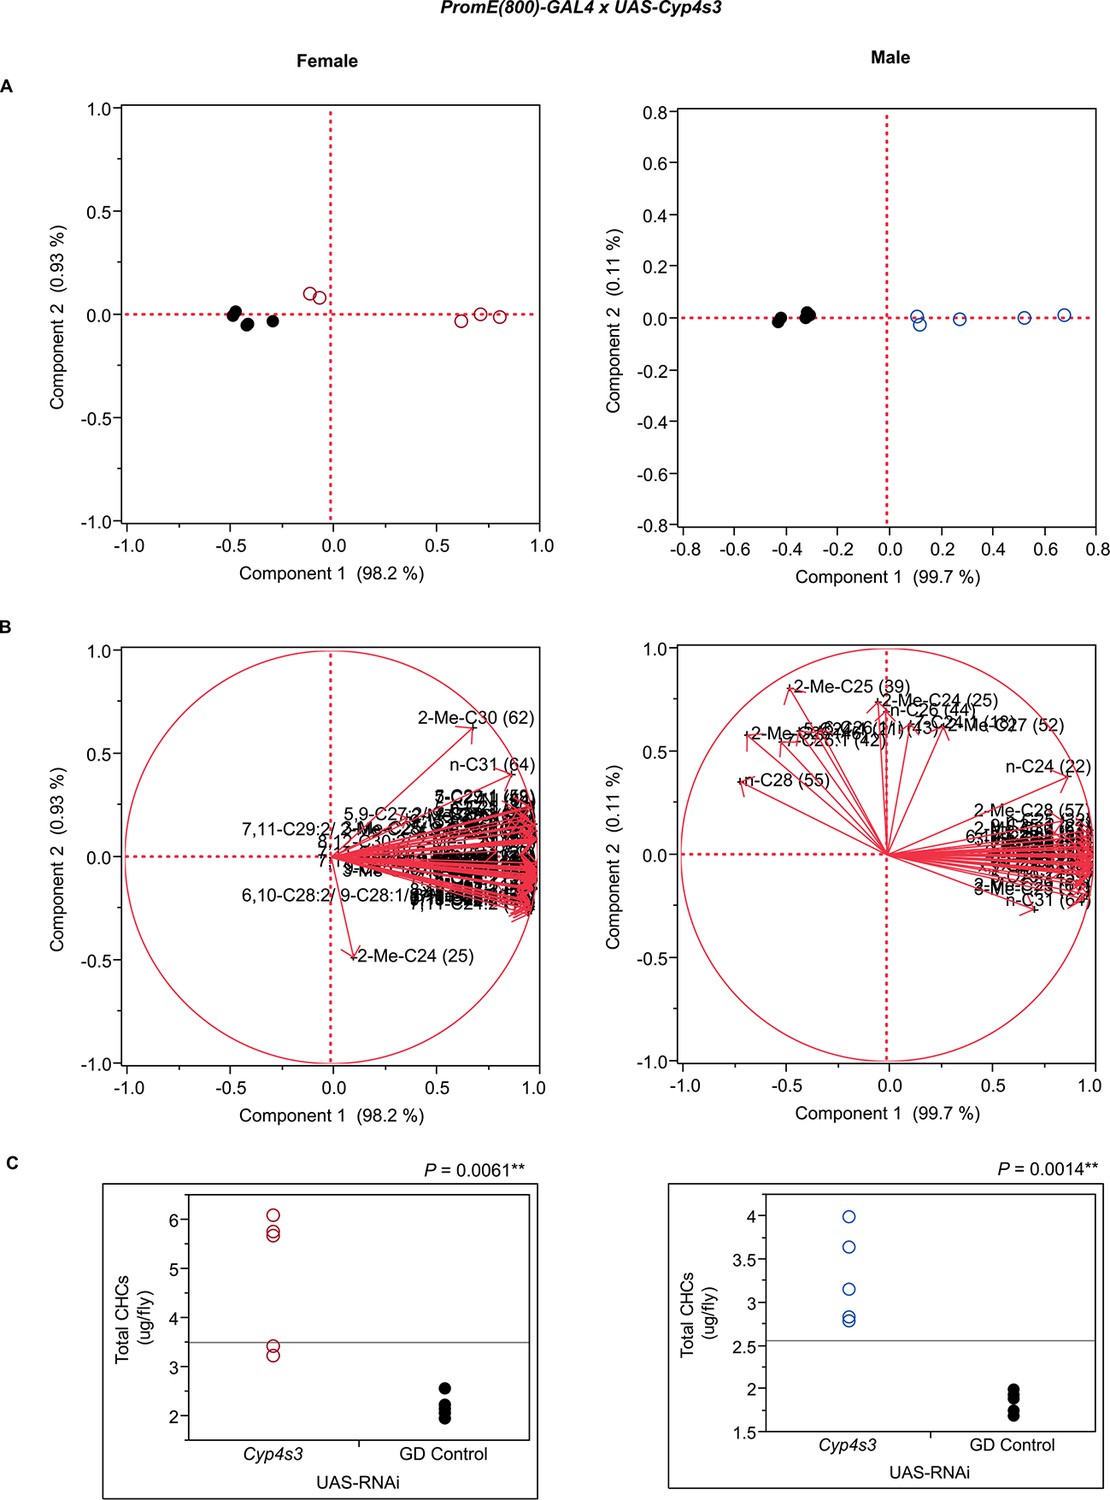
Functional validation PCA and total CHCs for RNAi-Cyp4s3.
(A) PCA biplots for females and males, ○ = female, ○ = male, and ● = control samples. (B) PC1 and PC2 eigenvectors. (C) Box-plots of female and male total amount of CHCs (µg/fly). P-values are reported for the Satterthwaite test, *: P < 0.05, **: P < 0.01, ***: P < 0.001.
Figure 7—figure supplement 15
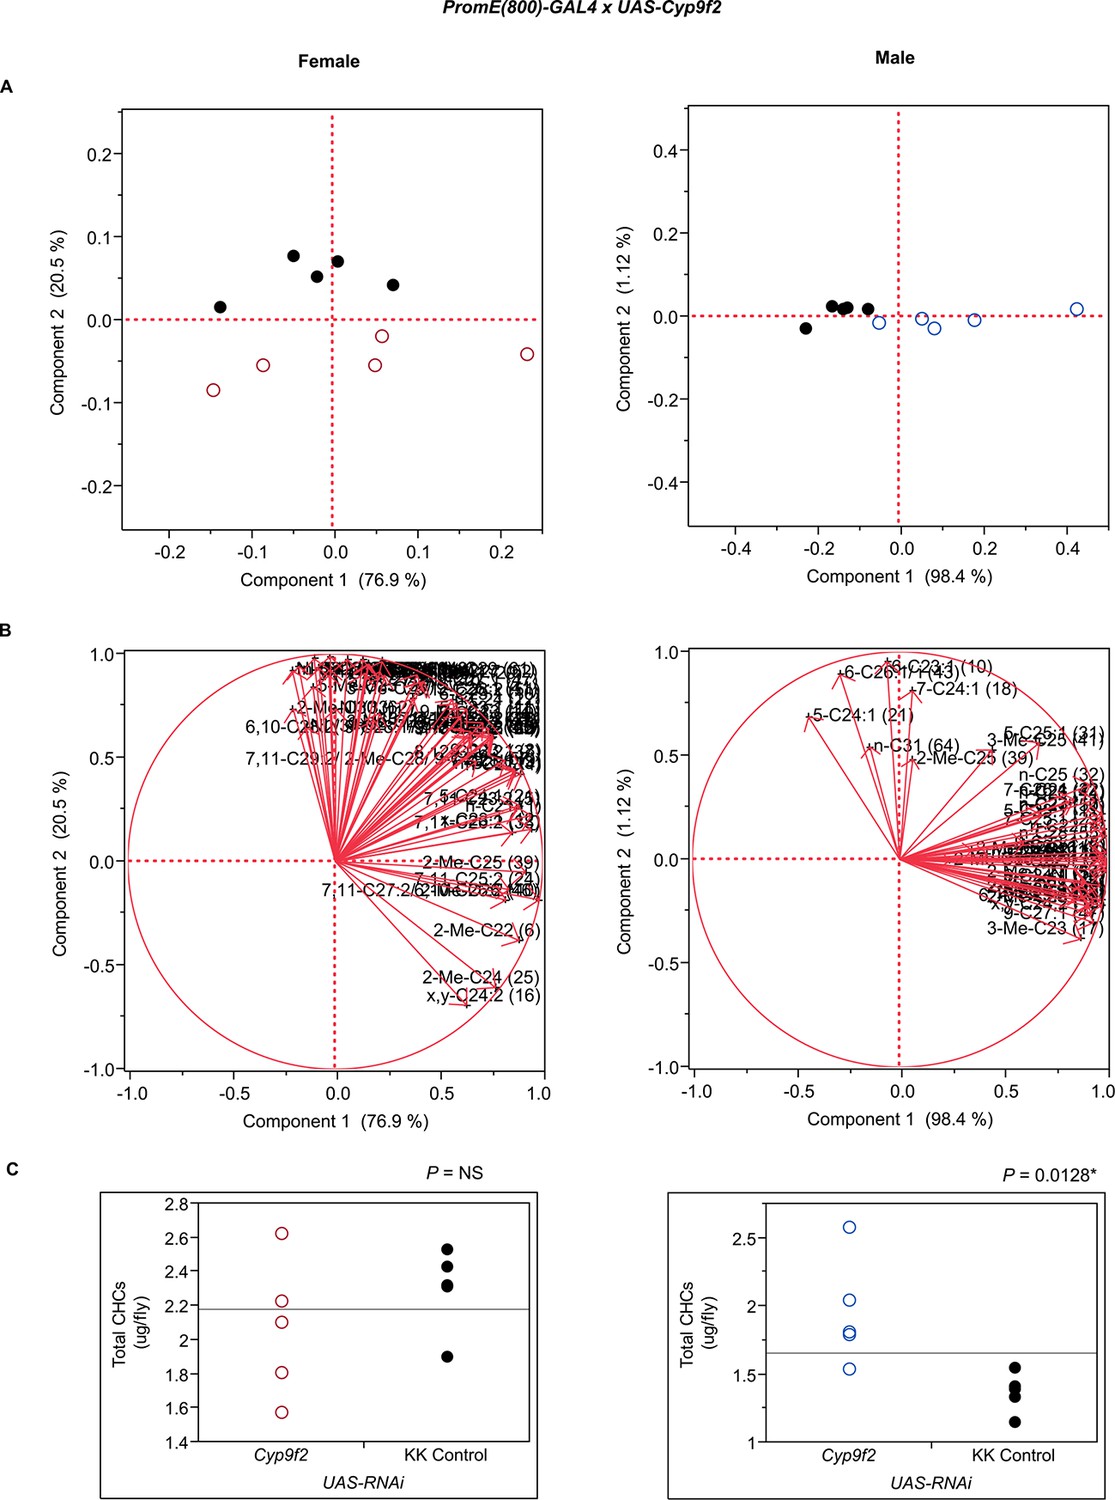
Functional validation PCA and total CHCs for RNAi-Cyp9f2.
(A) PCA biplots for females and males, ○ = female, ○ = male, and ● = control samples. (B) PC1 and PC2 eigenvectors. (C) Box-plots of female and male total amount of CHCs (µg/fly). P-values are reported for the Satterthwaite test, *: P < 0.05, **: P < 0.01, ***: P < 0.001.
Figure 7—figure supplement 16
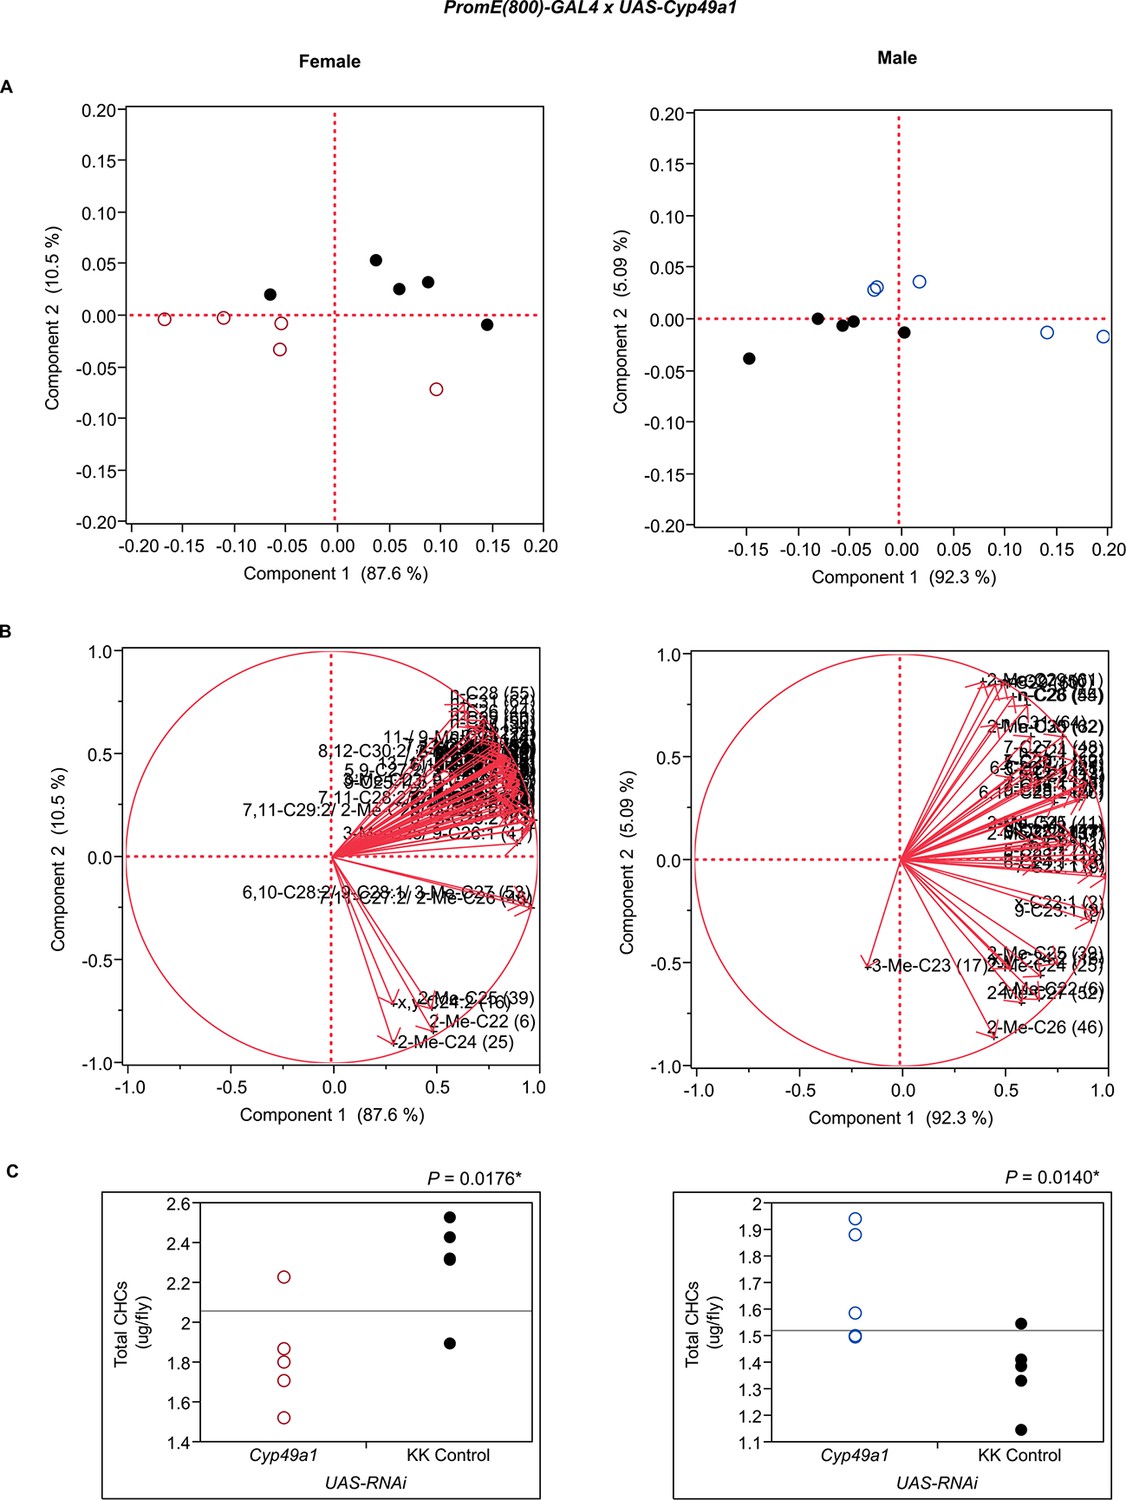
Functional validation PCA and total CHCs for RNAi-Cyp49a1.
(A) PCA biplots for females and males, ○ = female, ○ = male, and ● = control samples. (B) PC1 and PC2 eigenvectors. (C) Box-plots of female and male total amount of CHCs (µg/fly). P-values are reported for the Satterthwaite test, *: P < 0.05, **: P < 0.01, ***: P < 0.001.
Figure 7—figure supplement 17
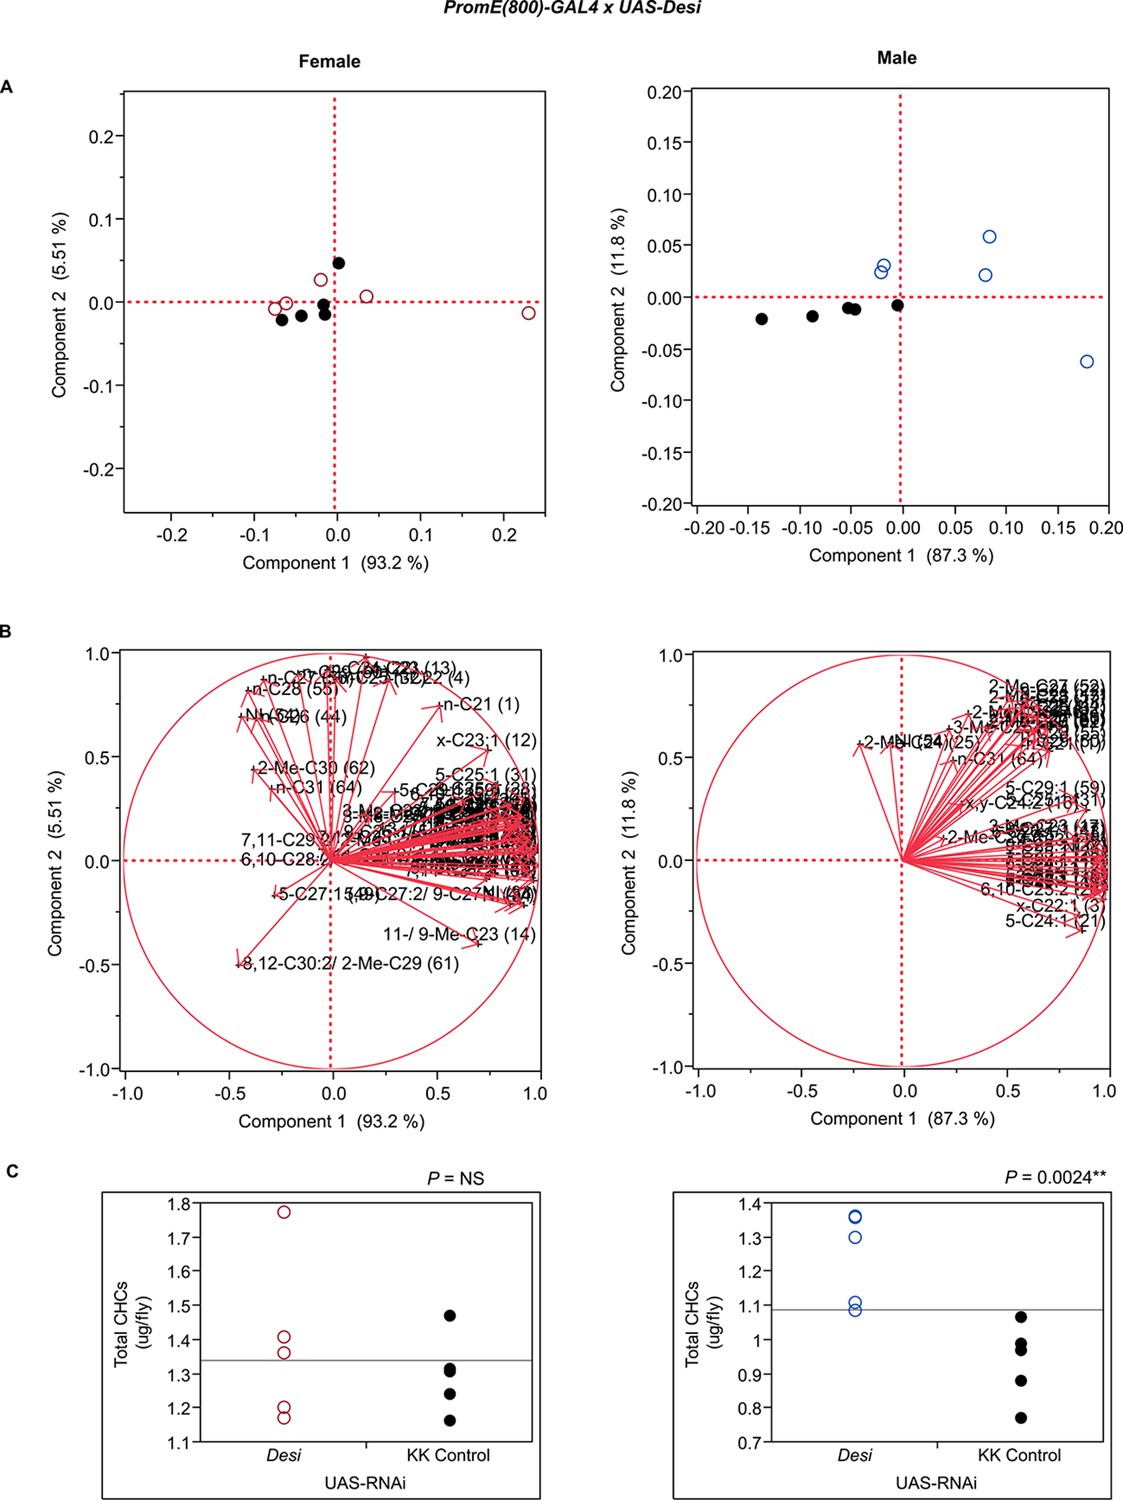
Functional validation PCA and total CHCs for RNAi-Desi.
(A) PCA biplots for females and males, ○ = female, ○ = male, and ● = control samples. (B) PC1 and PC2 eigenvectors. (C) Box-plots of female and male total amount of CHCs (µg/fly). P-values are reported for the Satterthwaite test, *: P < 0.05, **: P < 0.01, ***: P < 0.001.
Figure 7—figure supplement 18
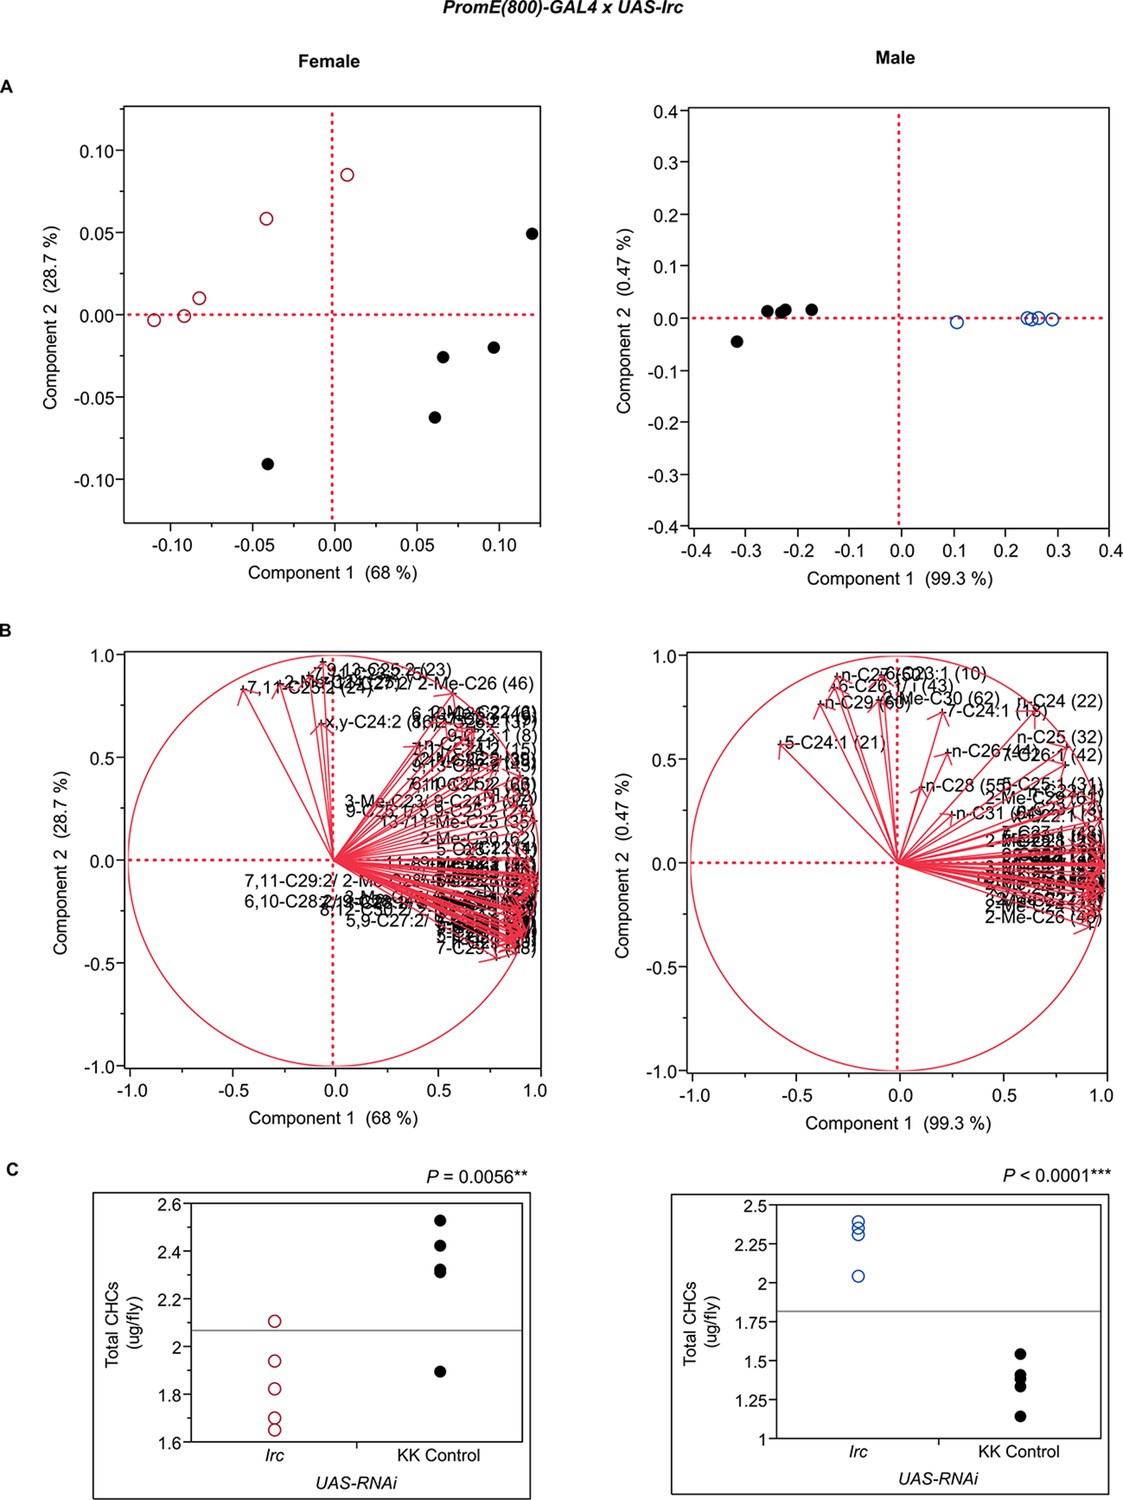
Functional validation PCA and total CHCs for RNAi-Irc.
(A) PCA biplots for females and males, ○ = female, ○ = male, and ● = control samples. (B) PC1 and PC2 eigenvectors. (C) Box-plots of female and male total amount of CHCs (µg/fly). P-values are reported for the Satterthwaite test, *: P < 0.05, **: P < 0.01, ***: P < 0.001.
Figure 7—figure supplement 19
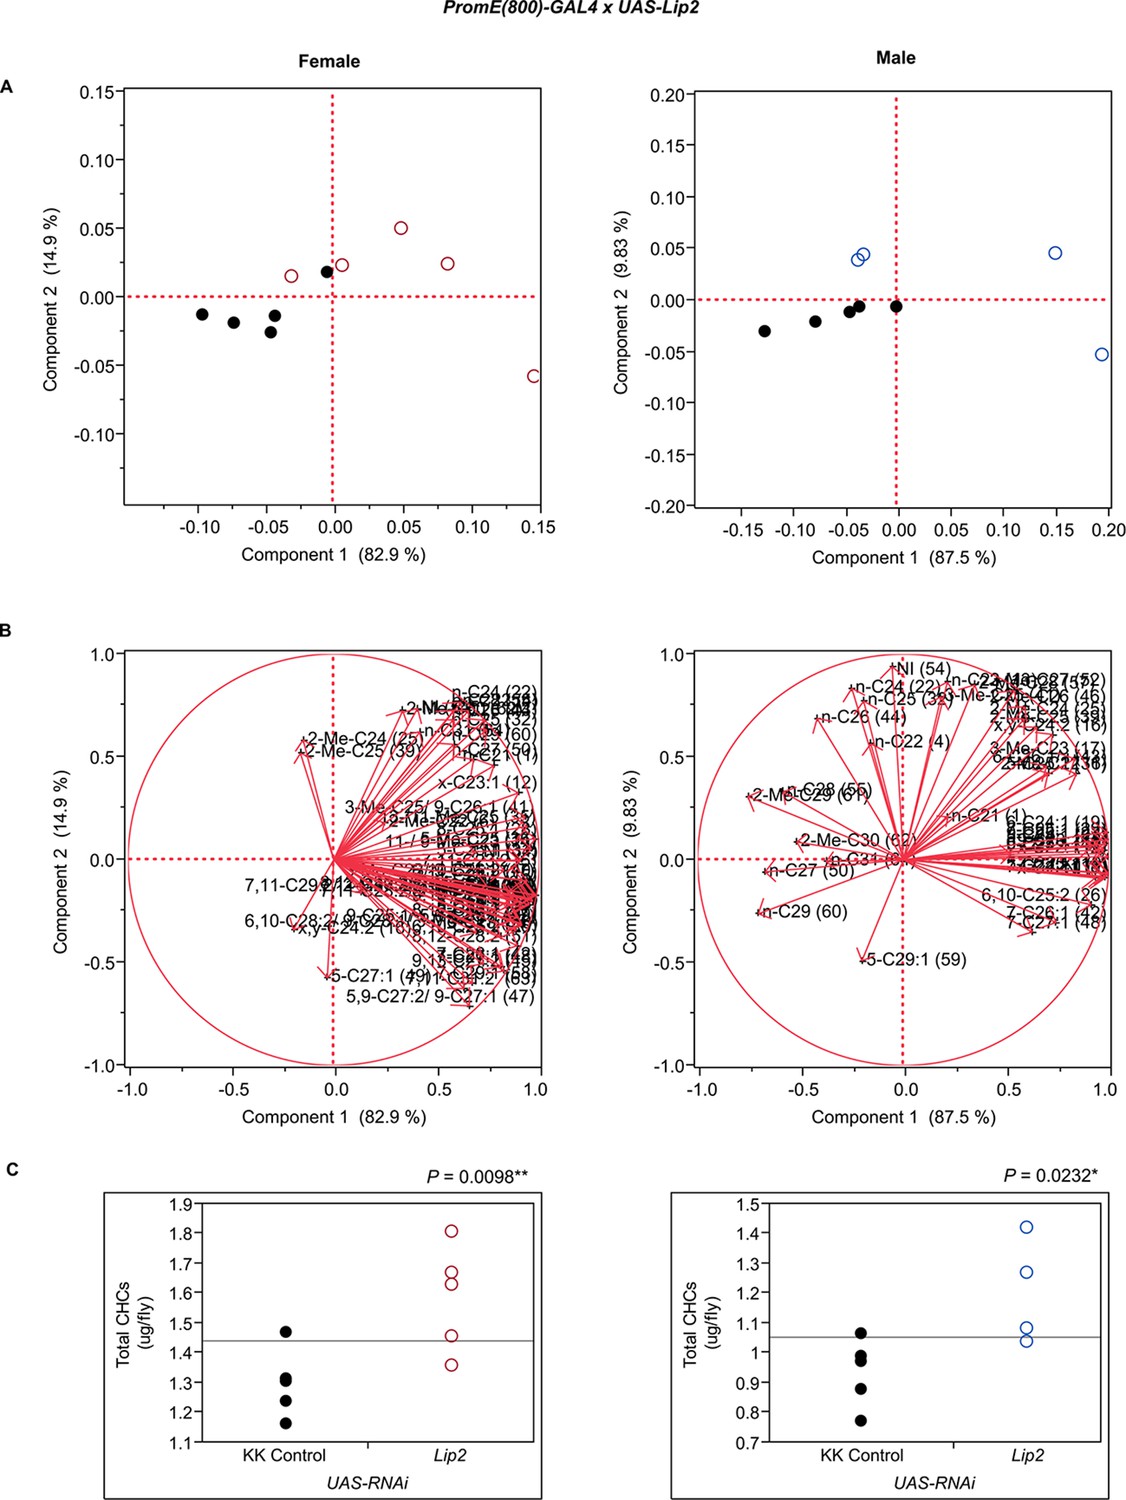
Functional validation PCA and total CHCs for RNAi-Lip2.
(A) PCA biplots for females and males, ○ = female, ○ = male, and ● = control samples. (B) PC1 and PC2 eigenvectors. (C) Box-plots of female and male total amount of CHCs (µg/fly). P-values are reported for the Satterthwaite test, *: P < 0.05, **: P < 0.01, ***: P < 0.001.
Figure 7—figure supplement 20
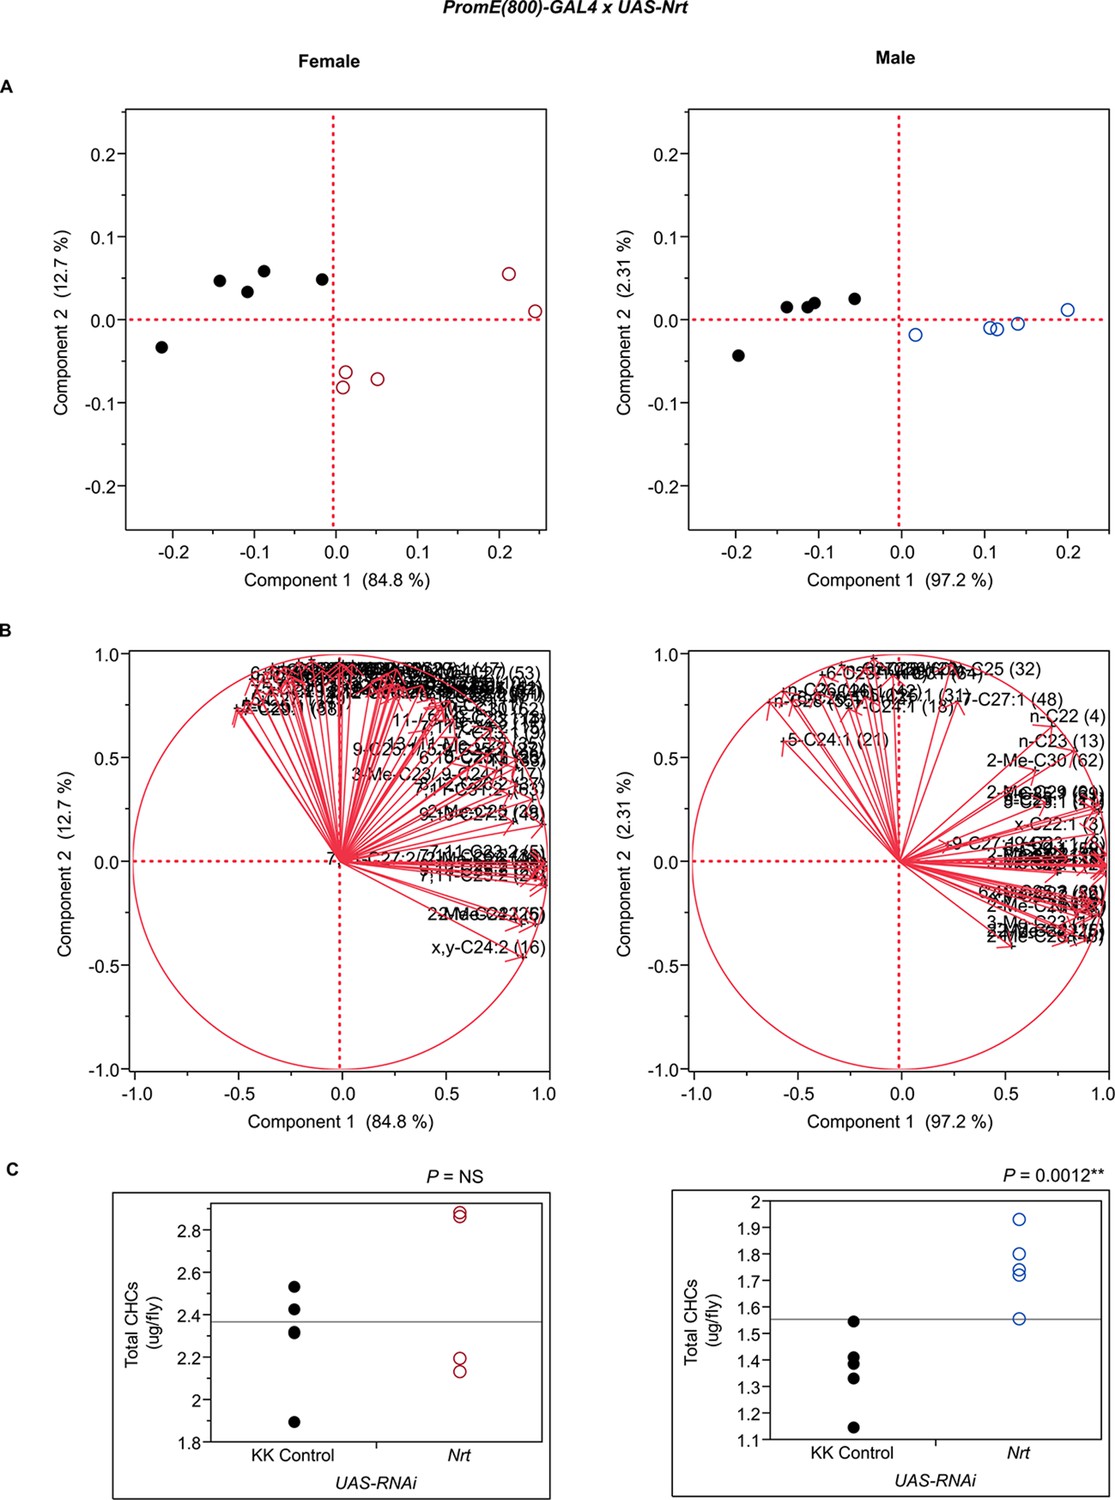
Functional validation PCA and total CHCs for RNAi-Nrt.
(A) PCA biplots for females and males, ○ = female, ○ = male, and ● = control samples. (B) PC1 and PC2 eigenvectors. (C) Box-plots of female and male total amount of CHCs (µg/fly). P-values are reported for the Satterthwaite test, *: P < 0.05, **: P < 0.01, ***: P < 0.001.
Figure 7—figure supplement 21
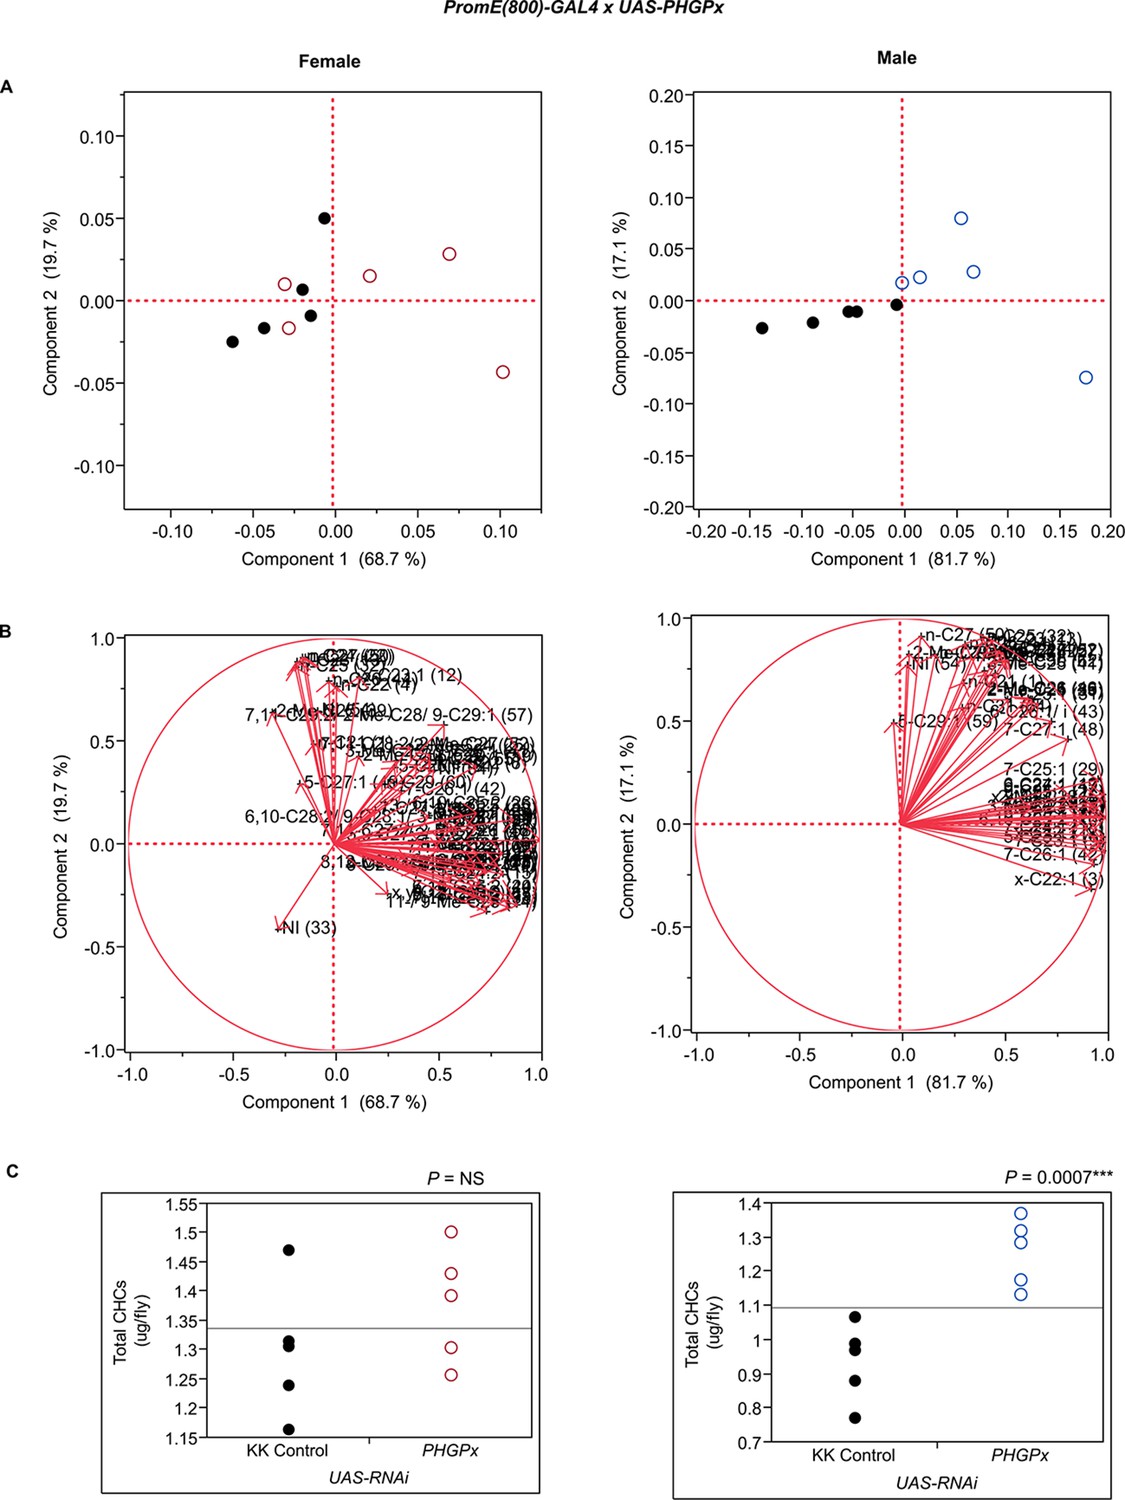
Functional validation PCA and total CHCs for RNAi-PHGPx.
(A) PCA biplots for females and males, ○ = female, ○ = male, and ● = control samples. (B) PC1 and PC2 eigenvectors. (C) Box-plots of female and male total amount of CHCs (µg/fly). P-values are reported for the Satterthwaite test, *: P < 0.05, **: P < 0.01, ***: P < 0.001.
Figure 7—figure supplement 22
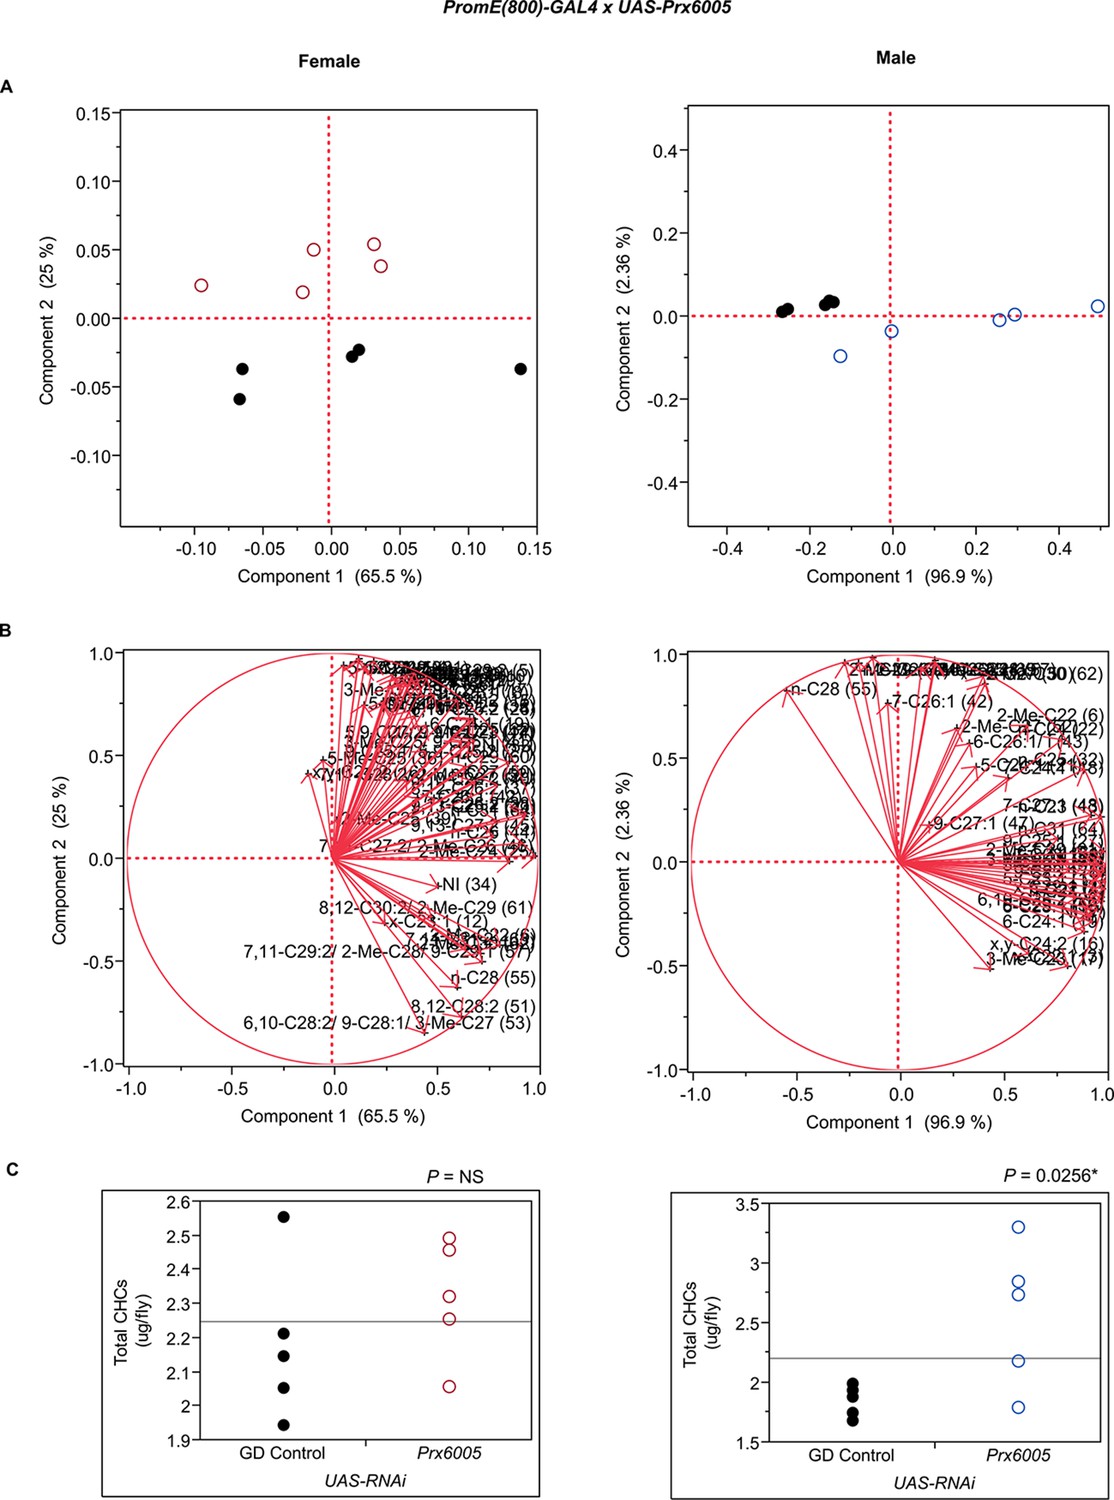
Functional validation PCA and total CHCs for RNAi-Prx6005.
(A) PCA biplots for females and males, ○ = female, ○ = male, and ● = control samples. (B) PC1 and PC2 eigenvectors. (C) Box-plots of female and male total amount of CHCs (µg/fly). P-values are reported for the Satterthwaite test, *: P < 0.05, **: P < 0.01, ***: P < 0.001.
Figure 7—figure supplement 23
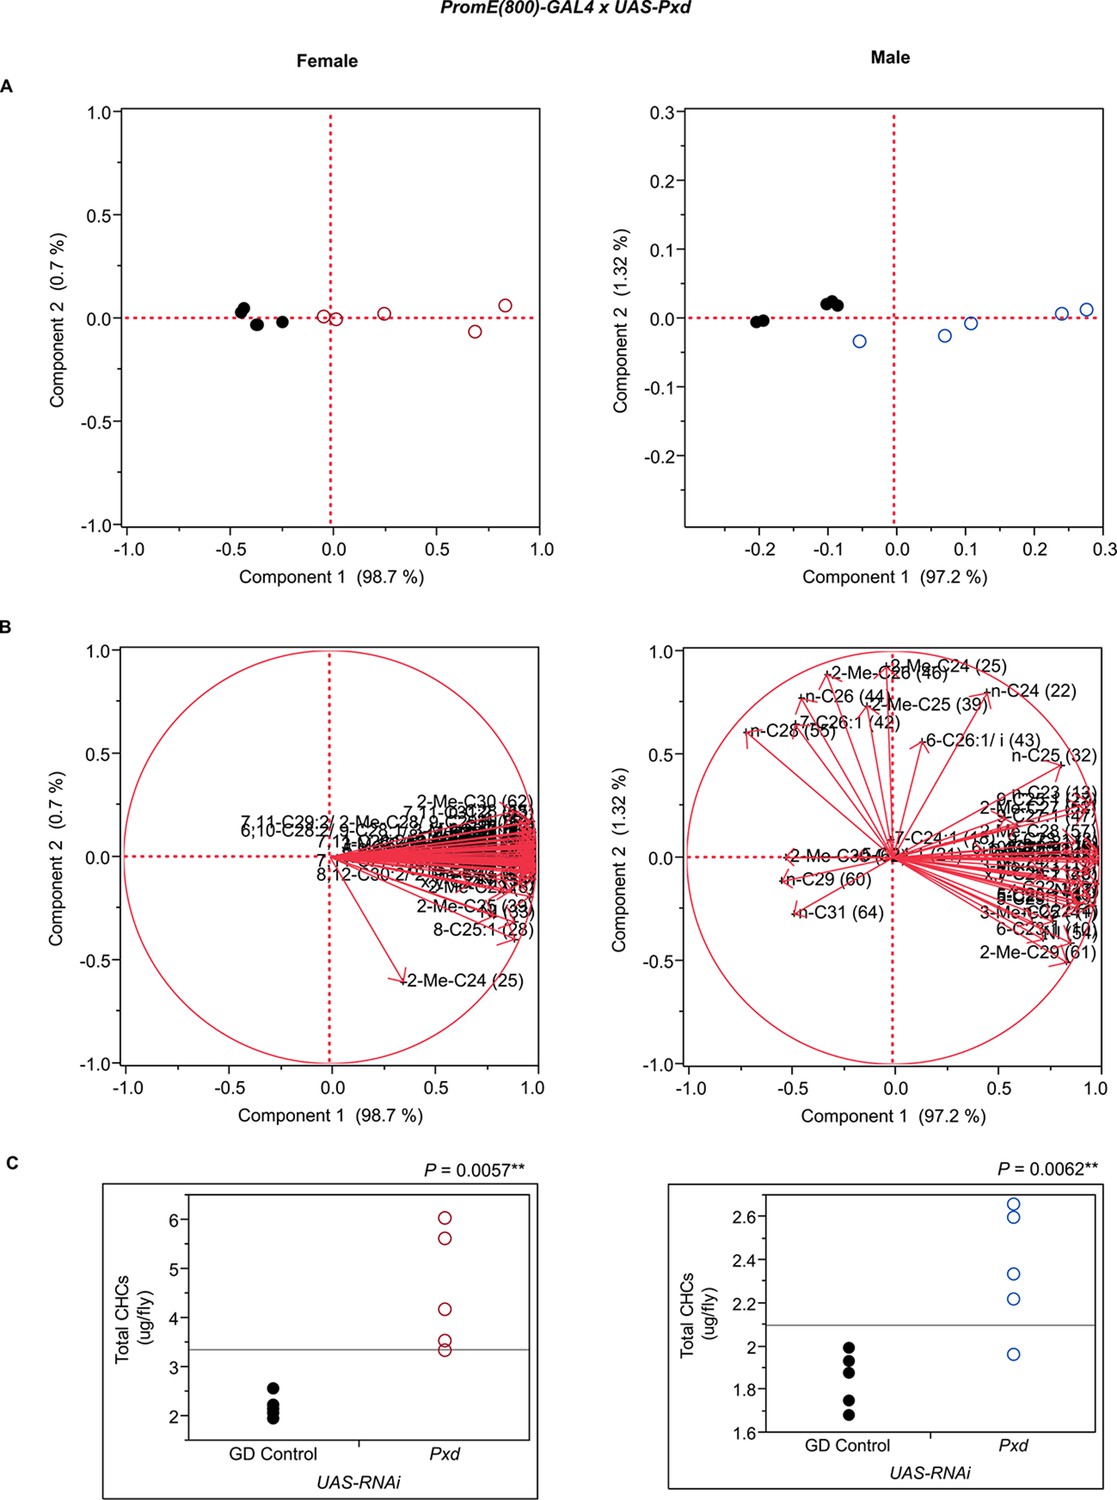
Functional validation PCA and total CHCs for RNAi-Pxd.
(A) PCA biplots for females and males, ○ = female, ○ = male, and ● = control samples. (B) PC1 and PC2 eigenvectors. (C) Box-plots of female and male total amount of CHCs (µg/fly). P-values are reported for the Satterthwaite test, *: P < 0.05, **: P < 0.01, ***: P < 0.001.
Figure 7—figure supplement 24
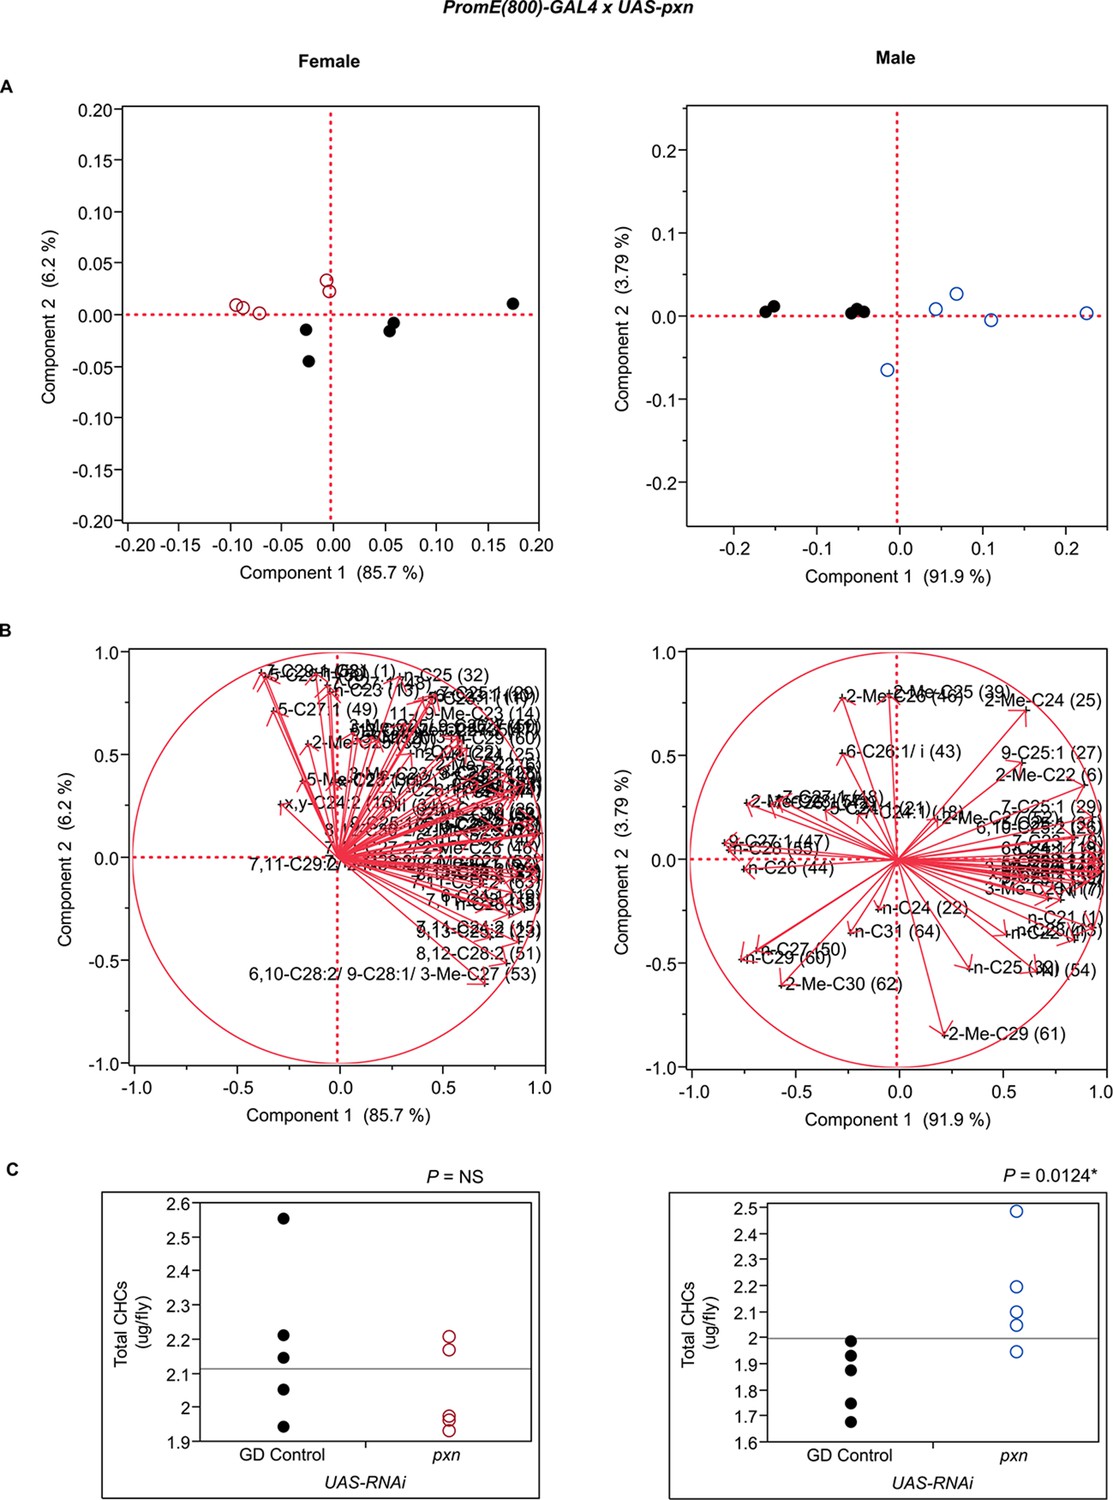
Functional validation PCA and total CHCs for RNAi-pxn.
(A) PCA biplots for females and males, ○ = female, ○ = male, and ● = control samples. (B) PC1 and PC2 eigenvectors. (C) Box-plots of female and male total amount of CHCs (µg/fly). P-values are reported for the Satterthwaite test, *: P < 0.05, **: P < 0.01, ***: P < 0.001.
Figure 8

Summary of RNAi and mutant experiments for male CHCs.
UAS-RNAi target gene and the CG10097 e00276 mutant are indicated on the horizontal axis. CHC names and numbers are listed on the y-axis. Data are color coded to represent P-values (P ≤ 0.05) from t-tests for the mean differences of the experimental and the control lines. Black = no significant change; blue = significant decrease; green = significant increase; gray = not applicable (peaks 46 and 57 split into two peaks for the CG10097 mutant).*
Figure 9

Example chromatograms of oenocyte-specific RNAi knockdowns and mutants – CG13091 and CG10097.
(A) and (B) PromE(800)-GAL4 x UAS-CG13091. (C) and (D) Exelixis mutant CG10097 e00276. pA = picoAmperes, IS = internal standard, ↑ CHCs significantly increased or ↓ decreased according to the individual t-tests.
Figure 10
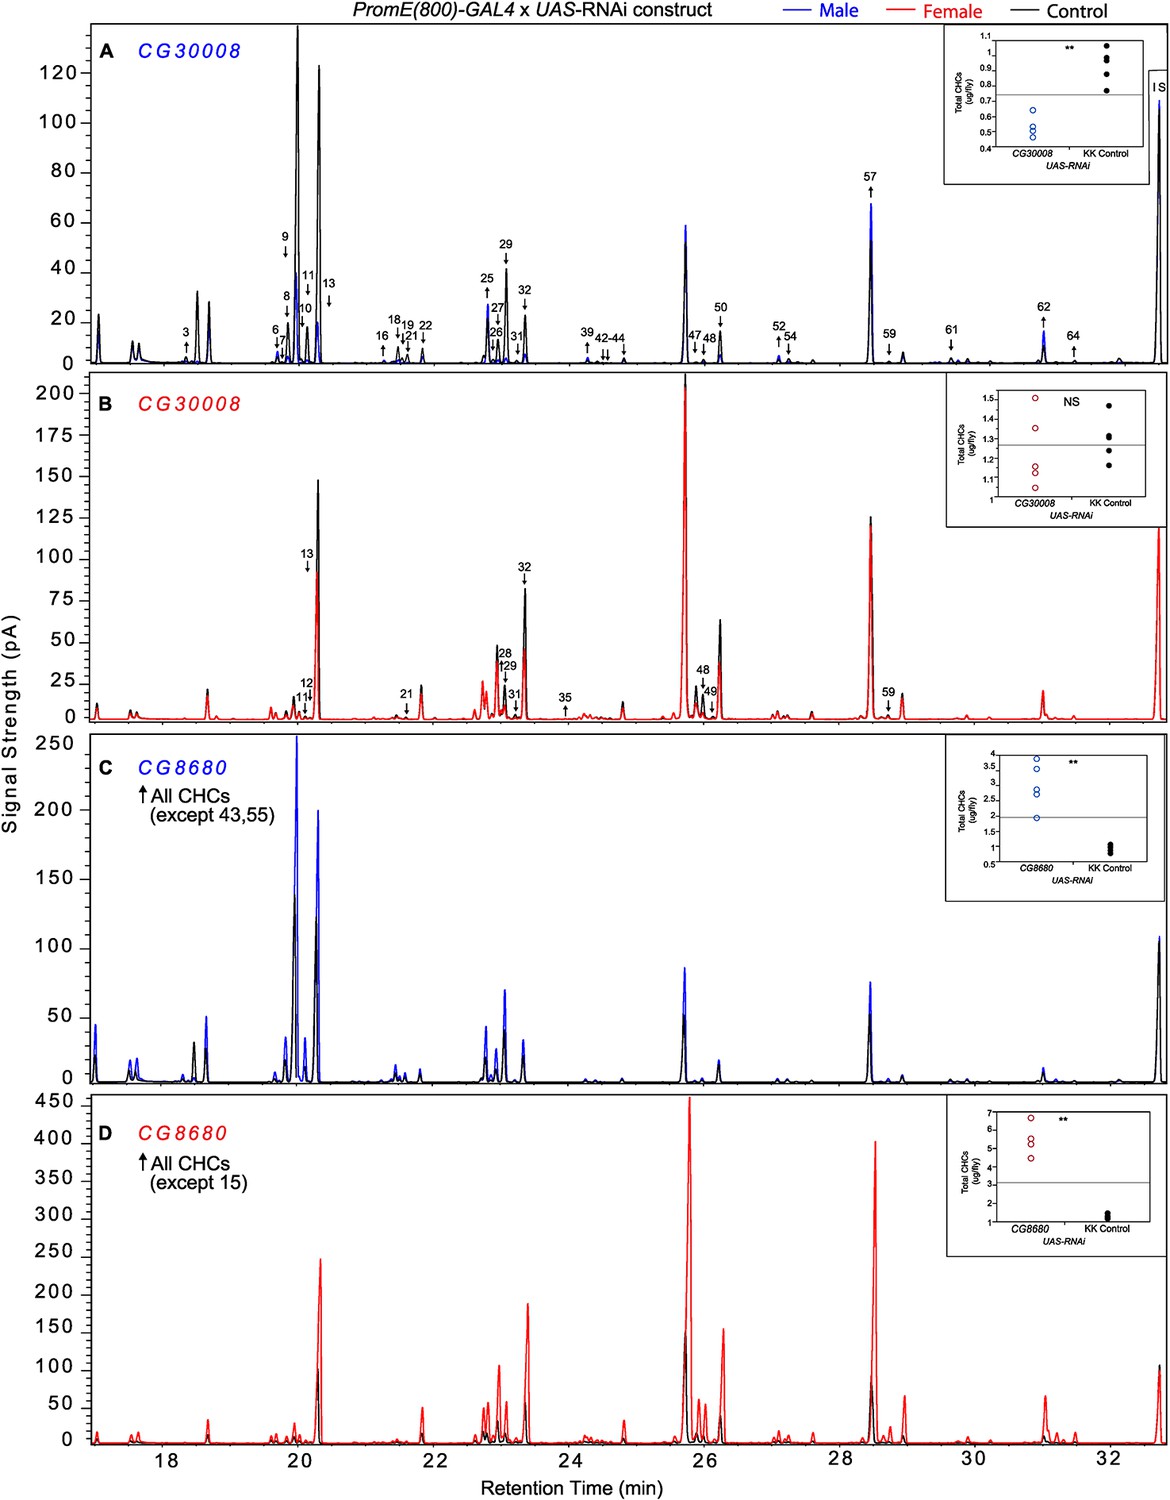
Example chromatograms of oenocyte-specific RNAi knockdowns – CG8680 and CG30008.
(A) and (B) PromE(800)-GAL4 x UAS-CG8680. (C) and (D) PromE(800)-GAL4 x UAS-CG30008. pA = picoAmperes, IS = internal standard, ↑ CHCs significantly increased or ↓ decreased according to the individual t-tests.
Tables
Table 1
Cuticular lipids identified by GC-MS in DGRP males and females. NI = not identified; nd = not detected; bold typeface = not previously identified in D. melanogaster.
| # | Cuticular component | Retention index | # | Cuticular component | Retention index | ||
|---|---|---|---|---|---|---|---|
| ♀ | ♂ | ♀ | ♂ | ||||
| 1 | n-C21 | 2100 | 2100 | 33 | NI | 2516 | nd |
| 2 | x-C22:1 (quantified only in ♂) | 2179 | 2179 | 34 | NI | 2521 | nd |
| 3 | x-C22:1 | nd | 2184 | 35 | 13-Me-C25 11-Me-C25 | 2533 | nd |
| c | cis-vaccenyl acetate | nd | 2189 | 36 | 5-Me-C25 | 2550 | nd |
| 4 | n-C22 | 2200 | 2200 | 37 | 8,12-C26:2 | 2555 | nd |
| 5 | 7,11-C23:2 | 2259 | nd | 38 | 7,11-C26:2 | 2560 | nd |
| 6 | 2-Me-C22 | 2263 | 2263 | 39 | 2-Me-C25 | 2562 | 2562 |
| 7 | NI | nd | 2267 | 40 | 6,10-C26:2 | 2566 | nd |
| 8 | 9-C23:1 | 2273 | 2273 | 41 | 9-C26:1 (only in ♀) 3-Me-C25 | 2572 | 2572 |
| 9 | 7-C23:1 | 2280 | 2283 | 42 | 7-C26:1 | 2577 | 2577 |
| 10 | 6-C23:1 | 2285 | 2286 | 43 | 6-C26:1 + impurity (i) | 2581 | 2581 |
| 11 | 5-C23:1 | 2291 | 2291 | 44 | n-C26 | 2600 | 2600 |
| 12 | x-C23:1 | 2294 | nd | 45 | 9,13-C27:2 | 2652 | nd |
| 13 | n-C23 | 2300 | 2300 | 46 | 7,11-C27:2 (only in ♀) 2-Me-C26 | 2664 | 2663 |
| 14 | 11-Me-C23 9-Me-C23 | 2336 | 2336 | 47 | 5,9-C27:2 (only in ♀) 9-C27:1 | 2675 | 2675 |
| 15 | 7,11-C24:2 | 2355 | nd | 48 | 7-C27:1 | 2682 | 2682 |
| 16 | x,y-C24:2 | 2363 | 2363 | 49 | 5-C27:1 | 2693 | nd |
| 17 | 3-Me-C23 9-C24:1 (only in ♀) | 2373 | 2373 | 50 | n-C27 | 2700 | 2700 |
| 18 | 7-C24:1 (quantified only in ♂) | 2377 | 2377 | 51 | 8,12-C28:2 | 2756 | nd |
| 19 | 6-C24:1 | 2380 | 2380 | 52 | 2-Me-C27 7,11-C28:2 (only in ♀) | 2761 | 2761 |
| 20 | NI (Variable in DGRP lines but not detected in GC-MS samples) | nd | nd | 53 | 6,10-C28:2 3-Me-C27 9-C28:1 | 2768 | nd |
| 21 | 5-C24:1 | 2386 | 2386 | 54 | NI | 2772 | 2772 |
| 22 | n-C24 | 2400 | 2400 | 55 | n-C28 | 2800 | 2800 |
| 23 | 9,13-C25:2 | 2451 | nd | 56 | 9,13-C29:2 | 2852 | nd |
| 24 | 7,11-C25:2 | 2460 | nd | 57 | 2-Me-C28 7,11-C29:2 (only in ♀) | 2864 | 2862 |
| 25 | 2-Me-C24 | 2463 | 2463 | 58 | 9-C29:1 5,9-C29:1 (only in ♀) | 2875 | 2875 |
| 26 | 6,10-C25:2 | 2468 | 2468 | 59 | 7-C29:1 | 2882 | 2882 |
| 27 | 5,9-C25:2 (only in ♀) 9-C25:1 | 2474 | 2474 | 60 | n-C29 | 2900 | 2900 |
| 28 | 8-C25:1 | 2478 | nd | 61 | 8,12-C30:2 (only in ♀) 2-Me-C29 | 2961 | 2961 |
| 29 | 7-C25:1 | 2482 | 2483 | 62 | 2-Me-C30 | 3060 | 3060 |
| 30 | 6-C25:1 | 2485 | nd | 63 | 7,11-C31:2 | 3065 | nd |
| 31 | 5-C25:1 | 2492 | 2492 | 64 | n-C31 | 3100 | 3100 |
| 32 | n-C25 | 2500 | 2500 | IS | n-C32 | 3200 | 3200 |
Table 2
Phenotypes and In(3R)K genotypes for females from DGRP lines with functional Desat2 alleles. Red text indicates "mismatched" Desat2 genotype ('+' = ancestral; '-' = 16-bp deletion) and inversion status (‘INV’ = In(3R)K; ‘ST’ = Standard karyotype). Blue background indicates "mismatched" Desat2 genotype and phenotype.
| DGRP line | Desat 2 genotype | % 7,11-C27:2 | % 5,9-C27:2 | Ratio | In(3R)K status |
|---|---|---|---|---|---|
| DGRP_31 | + / - | 23.7 | 18.7 | 1.27 | INV / ST |
| DGRP_38 | + / - | 19.4 | 24.9 | 0.78 | INV / ST |
| DGRP_48 | + / - | 19.1 | 25.0 | 0.76 | INV / ST |
| DGRP_100 | + / + | 22.3 | 32.3 | 0.69 | INV / INV |
| DGRP_136 | + / - | 14.7 | 33.7 | 0.44 | INV / ST |
| DGRP_309 | + / - | 19.1 | 17.8 | 1.07 | INV / ST |
| DGRP_440 | + / - | 20.0 | 14.0 | 1.43 | INV / ST |
| DGRP_559 | + / - | 23.5 | 10.5 | 2.24 | INV / ST |
| DGRP_646 | + / + | 17.3 | 24.6 | 0.70 | INV / INV |
| DGRP_802 | + / - | 18.5 | 23.4 | 0.79 | INV / ST |
| DGRP_732 | + / - | 19.3 | 17.3 | 1.12 | INV / ST |
| DGRP_367 | + / + | 12.6 | 36.8 | 0.34 | ST/ ST |
| DGRP_776 | + / + | 16.7 | 8.98 | 1.86 | ST / ST |
| DGRP_509 | + / + | 17.8 | 27.5 | 0.65 | ST / ST |
| DGRP_235 | + / + | 10.3 | 22.2 | 0.46 | ST / ST |
| DGRP_551 | + / - | 26.6 | 4.29 | 6.20 | ST / ST |
| DGRP_105 | + / + | 21.4 | 5.10 | 4.20 | INV / INV |
Table 3
Percent of CHC variation in the DGRP explained by PCs.
| Sex | Number | Eigenvalue | Percent | Cumulative percent |
|---|---|---|---|---|
| Female | 1 | 0.0061 | 41.16 | 41.16 |
| 2 | 0.0043 | 29.47 | 70.63 | |
| 3 | 0.0021 | 14.50 | 85.13 | |
| 4 | 0.0009 | 6.22 | 91.35 | |
| 5 | 0.0005 | 3.07 | 94.42 | |
| 6 | 0.0003 | 2.30 | 96.72 | |
| 7 | 0.0002 | 1.29 | 98.01 | |
| Male | 1 | 0.0170 | 75.52 | 75.52 |
| 2 | 0.0033 | 14.57 | 90.10 | |
| 3 | 0.0010 | 4.59 | 94.69 | |
| 4 | 0.0005 | 2.04 | 96.73 | |
| 5 | 0.0003 | 1.39 | 98.12 |
Additional files
-
Supplementary file 1
DGRP line means and African samples CHC data.
(A) DGRP females. (B) DGRP males. (C) DGRP and African females. (D) DGRP and African males.
- https://doi.org/10.7554/eLife.09861.040
-
Supplementary file 2
ANOVA and heritabilities of DGRP CHC peak proportions in females and males.
(A) Females. (B) Males. df: degrees of freedom; SS: Sums of squares (Type III); MS: Mean squares; F: F ratio test statistic; P: P-value; σ2: variance component; H2: broad sense heritability.
- https://doi.org/10.7554/eLife.09861.041
-
Supplementary file 3
ANOVA of female sex pheromones in DGRP lines containing the Desat2 insertion (ins/ins or ins/del).
df: degrees of freedom; P: P-value.
- https://doi.org/10.7554/eLife.09861.042
-
Supplementary file 4
CHC module correlations in the DGRP.
(A) Females. (B) Males.
- https://doi.org/10.7554/eLife.09861.043
-
Supplementary file 5
Color and symbol codes for DGRP lines used in Figure 5.
- https://doi.org/10.7554/eLife.09861.044
-
Supplementary file 6
ANOVA of the effects of Wolbachia infection and common polymorphic inversions on CHC PCs.
df: degrees of freedom; SS: Type III sums of squares; F: F statistic; AIC: Akaike information criterion. ***p<0.001; **p<0.01; *p<0.05.
- https://doi.org/10.7554/eLife.09861.045
-
Supplementary file 7
GWA results for DGRP female and male CHC PCs.
Results are given for female PC 1 - 7 and male PC 1 - 5. P-values (≤ 10-5) of association tests are given for a linear mixed model accounting for relatedness of adjusted line mean PCs versus genotypes.
- https://doi.org/10.7554/eLife.09861.046
-
Supplementary file 8
VDRC and Exelixis transgenic line information.
- https://doi.org/10.7554/eLife.09861.047
-
Supplementary file 9
Difference between experimental lines and controls for individual CHCs (ng/fly) and raw data (µg/fly).
(A) Mean difference between RNAi or mutant CHCs and controls, females. (B) Mean difference between RNAi or mutant CHCs and controls, males. (C) Experiment 1 raw data for KK RNAi lines, females. (D) Experiment 2 raw data for KK RNAi lines, females. (E) Raw data for GD RNAi lines, females. (F) Raw data for Exelixis mutation, females. (G) Experiment 1 raw data for KK RNAi lines, males. (H) Experiment 2 raw data for KK RNAi lines, males. (I) Raw data for GD RNAi lines, males. (J) Raw data for Exelixis mutation, males.
- https://doi.org/10.7554/eLife.09861.048
-
Supplementary file 10
Chemical identification of previously unpublished CHCs in Drosophila melanogaster.
- https://doi.org/10.7554/eLife.09861.049
Download links
A two-part list of links to download the article, or parts of the article, in various formats.
Downloads (link to download the article as PDF)
Open citations (links to open the citations from this article in various online reference manager services)
Cite this article (links to download the citations from this article in formats compatible with various reference manager tools)
Genetic architecture of natural variation in cuticular hydrocarbon composition in Drosophila melanogaster
eLife 4:e09861.
https://doi.org/10.7554/eLife.09861


