Excitatory transmission onto AgRP neurons is regulated by cJun NH2-terminal kinase 3 in response to metabolic stress
- University of Massachusetts Medical School, United States
- Beth Israel Deaconess Medical Center, United States
- Harvard Medical School, United States
- Howard Hughes Medical Institute, University of Massachusetts Medical School, United States
- Yale University School of Medicine, United States
- Howard Hughes Medical Institute, Yale University School of Medicine, United States
Figures
Figure 1 with 3 supplements
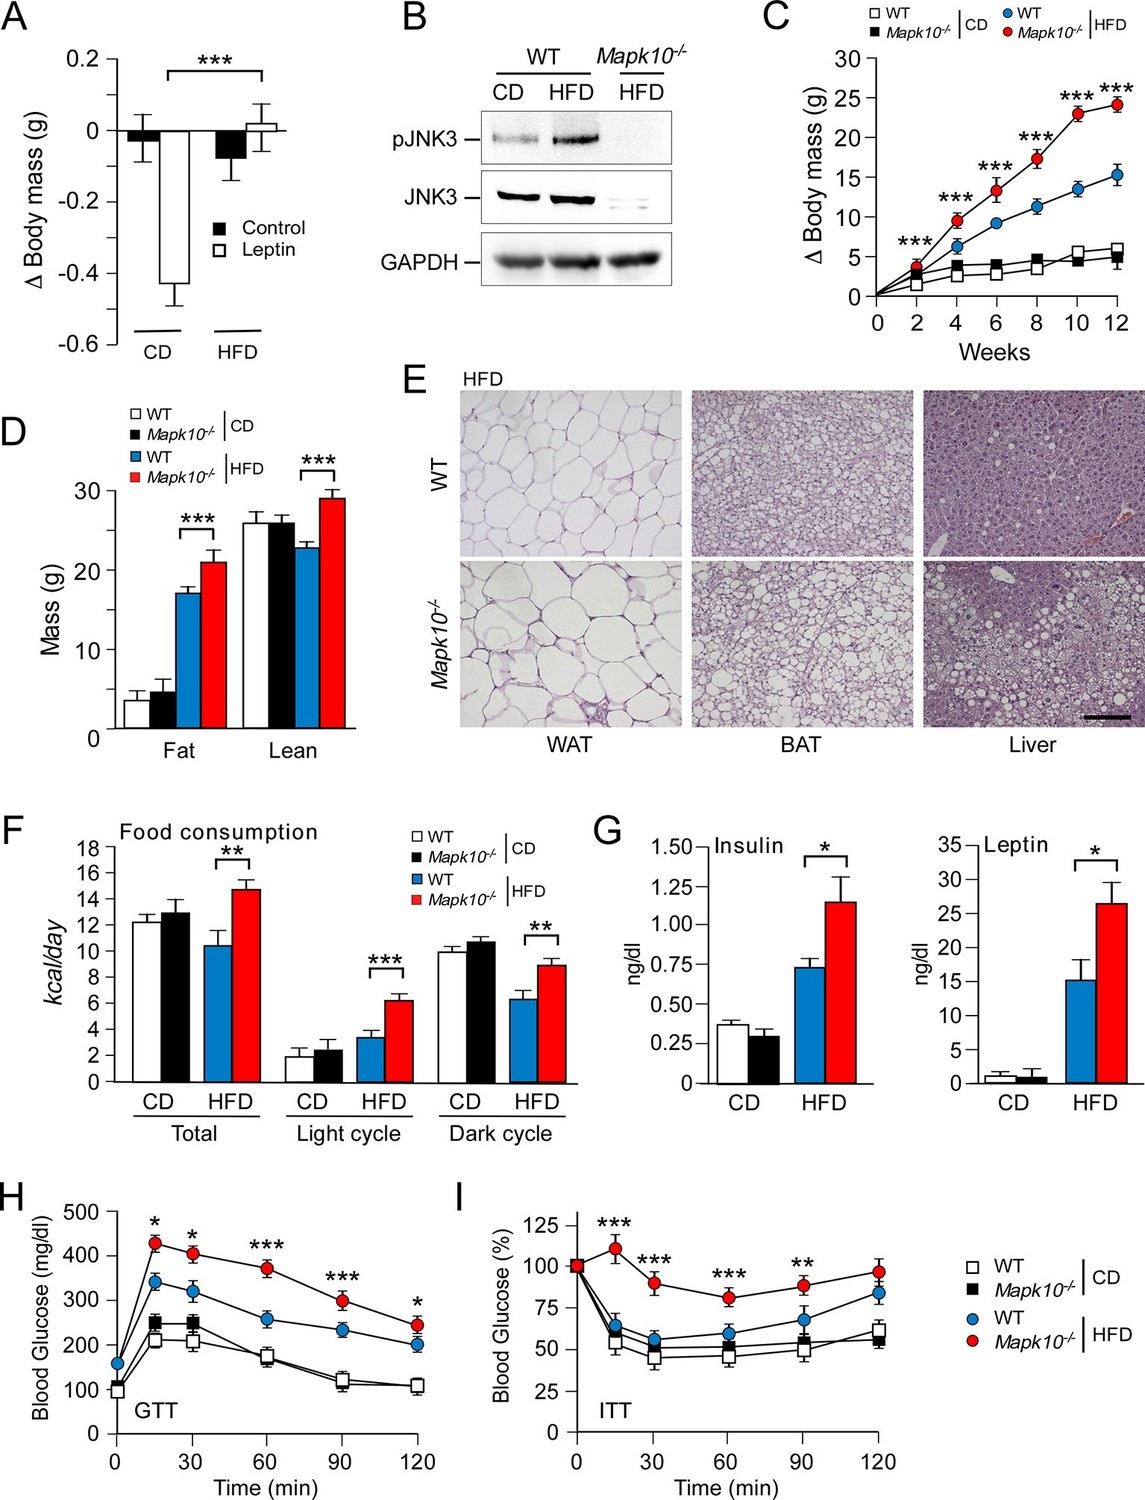
JNK3 deficiency causes hyperphagia and obesity.
(A) WT mice were fed (4 wk) a chow diet (CD) or a high-fat diet (HFD). The body mass change at 24 hr post-injection (i.p. with solvent (PBS) or 2.5 mg/kg leptin) was measured (mean ± SEM; n=8; ***p<0.001). (B) WT and Mapk10-/- mice fed (12 wk) a CD or a HFD were starved overnight. Phospho-JNK3, JNK3, and GAPDH in the hypothalamus were measured by immunoblot analysis. (C,D) The body mass gain of CD-fed and HFD-fed (12 wk) mice was measured (mean ± SEM; n=10~12) (C). Fat and lean mass were measured by 1H-MRS analysis (mean ± SEM; n=10~12). (D) Statistically significant differences between WT and Mapk10-/- mice are indicated (***p<0.001). (E) Paraffin embedded sections of epididymal white adipose tissue (WAT), interscapular brown adipose tissue (BAT), and liver were prepared from HFD-fed (12 wk) WT and Mapk10-/- mice. The sections were stained with hematoxylin & eosin. Scale bar, 100 µm. (F) Food consumption by WT and Mapk10-/- mice fed a CD or a HFD (3 wk) was measured (mean ± SEM; n=6; **p<0.01; ***p<0.001). (G) WT and Mapk10-/- mice fed a CD or a HFD (4 wk) were fasted overnight and the blood concentration of leptin and insulin was measured (mean ± SE; n=10~12; *p<0.05). (H,I) Glucose tolerance tests (H) and insulin tolerance tests (I) were performed on WT and Mapk10-/- mice fed a CD or a HFD (12 wk) by measurement of blood glucose concentration (mean ± SEM; n=10~12; *p < 0.05; **p < 0.01; ***p < 0.001).
Figure 1—figure supplement 1
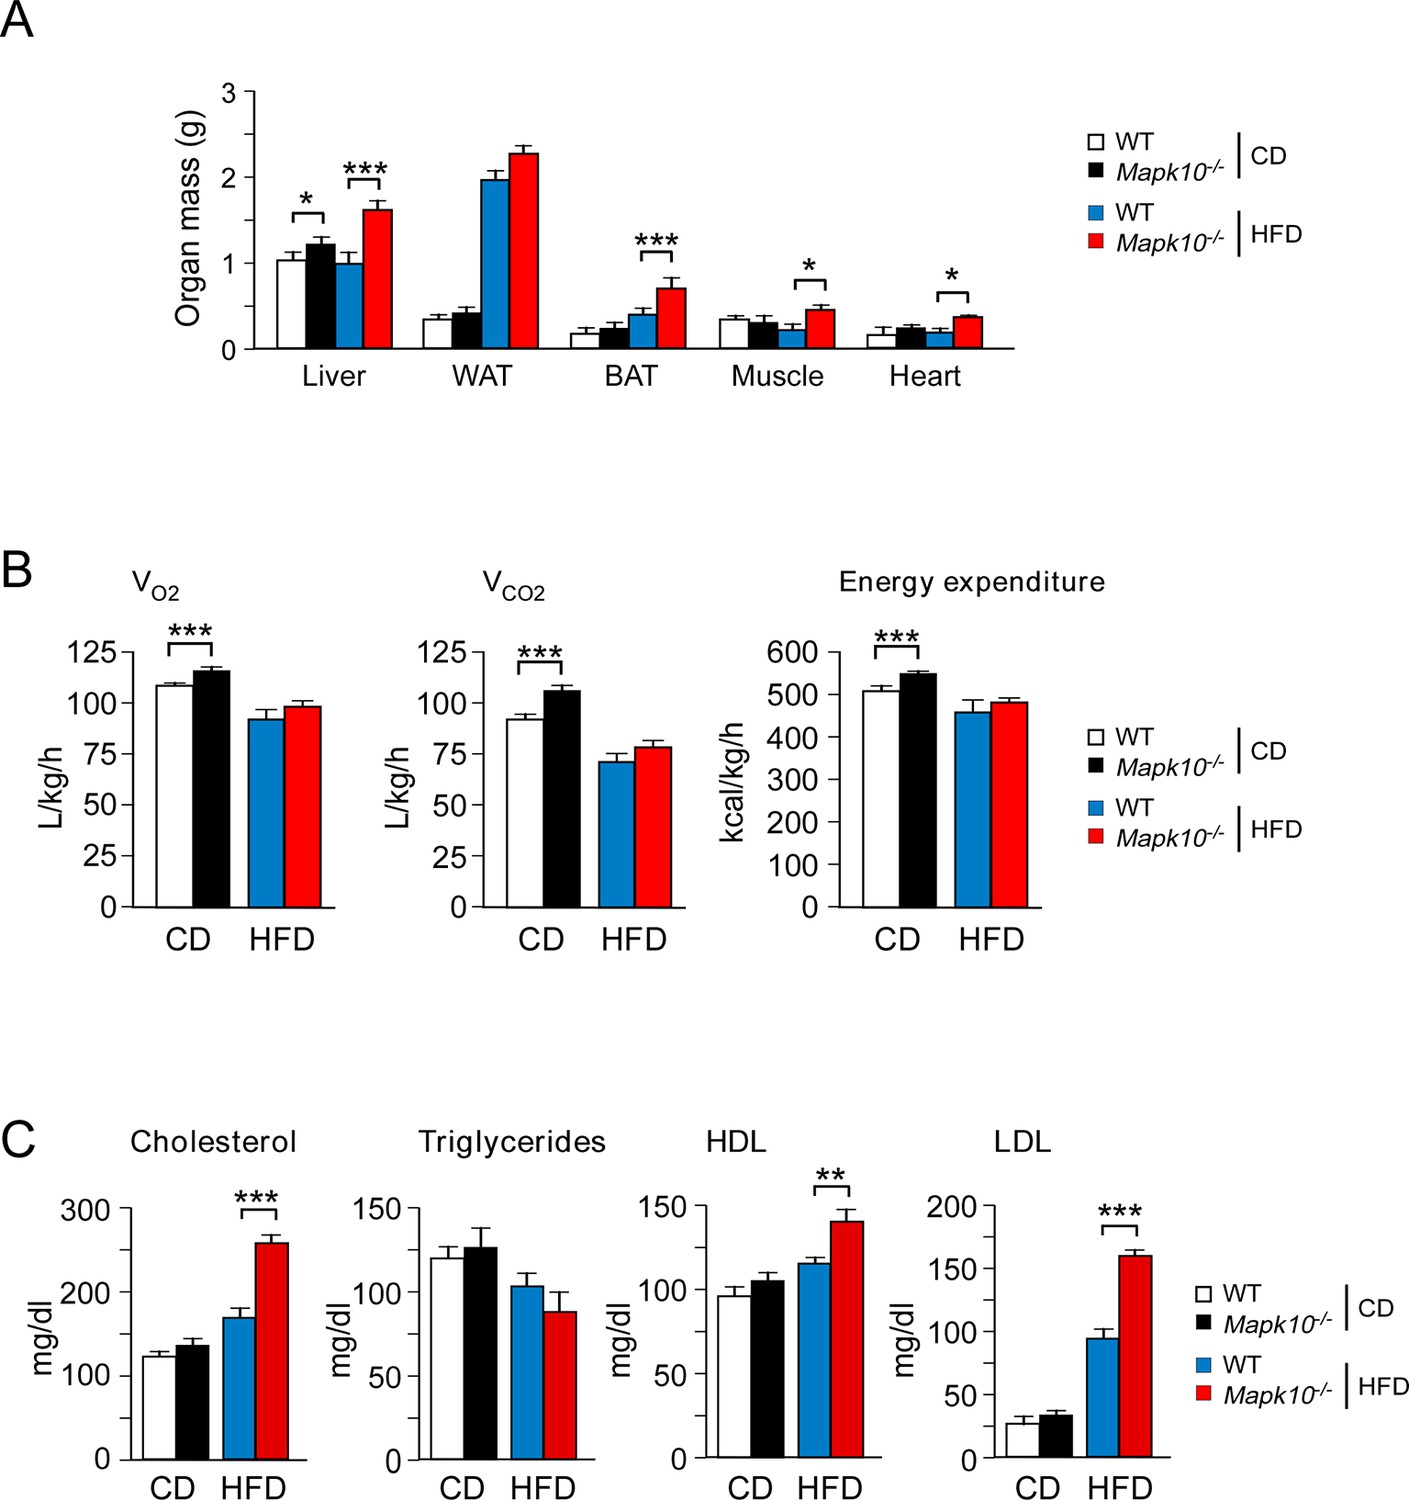
JNK3 deficiency causes obesity without changes in energy expenditure.
(A) Organ mass of CD-fed and HFD-fed (12 wk) WT and Mapk10-/- mice was measured (mean ± SEM; n=10~12; *p<0.05; ***p<0.001). (B) CD-fed and HFD-fed (4 wk) WT and Mapk10-/- mice were examined using metabolic cages to measure VO2, VCO2, and energy expenditure (mean ± SEM; n=8; ***p<0.001). (C) Blood lipids and lipoproteins in overnight starved CD-fed and HFD-fed (12 wk) WT and Mapk10-/- mice were measured (mean ± SEM; n=10~12; **p<0.01; ***p<0.001).
Figure 1—figure supplement 2
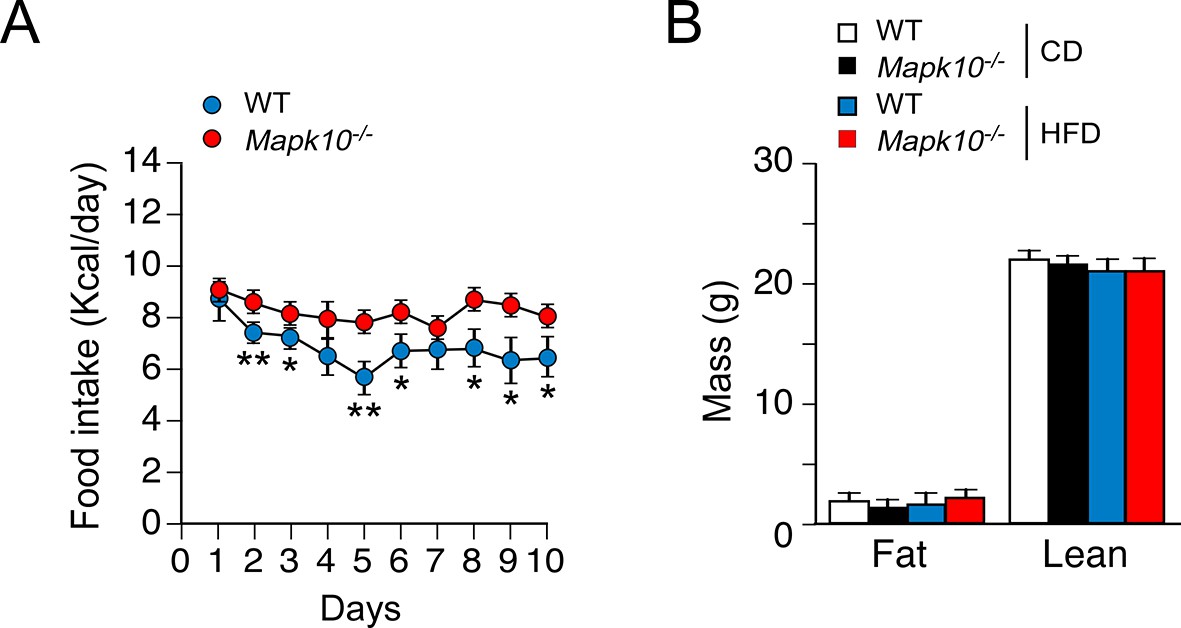
Time course of the development of hyperphagia in HFD-fed JNK3-deficient mice.
(A) Metabolic cage analysis of WT and Mapk10-/- mice fed a HFD. The amount of food consumed 7pm – 7am each day was measured (mean ± SEM; n=6; *p<0.05; **p<0.01). (B) Fat and lean body mass of WT and Mapk10-/- mice fed a HFD (3 days) was measured by 1H-MRS analysis (mean ± SEM; n=6). No statistically significant differences were detected (p>0.05).
Figure 1—figure supplement 3
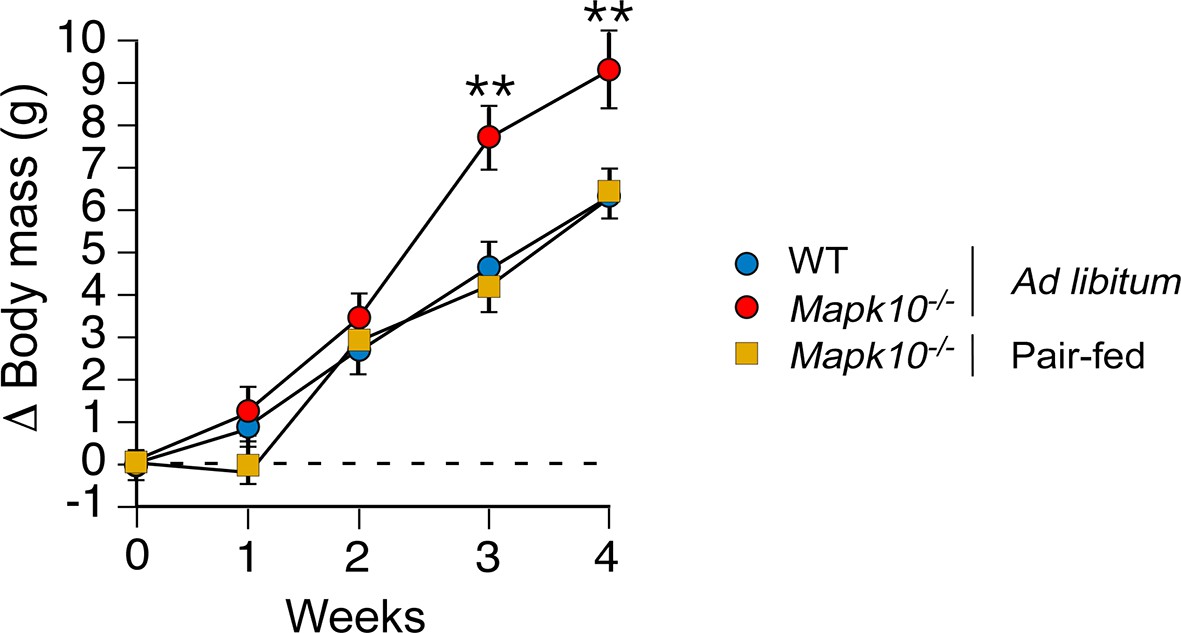
Increased food consumption is required for obesity caused by JNK3 deficiency in HFD-fed mice.
WT and Mapk10-/- mice were fed a HFD ad libitum. A second group of Mapk10-/- mice were pair-fed with the WT mice. The change in body mass was measured (mean ± SEM; n= 6; **p<0.01).
Figure 2
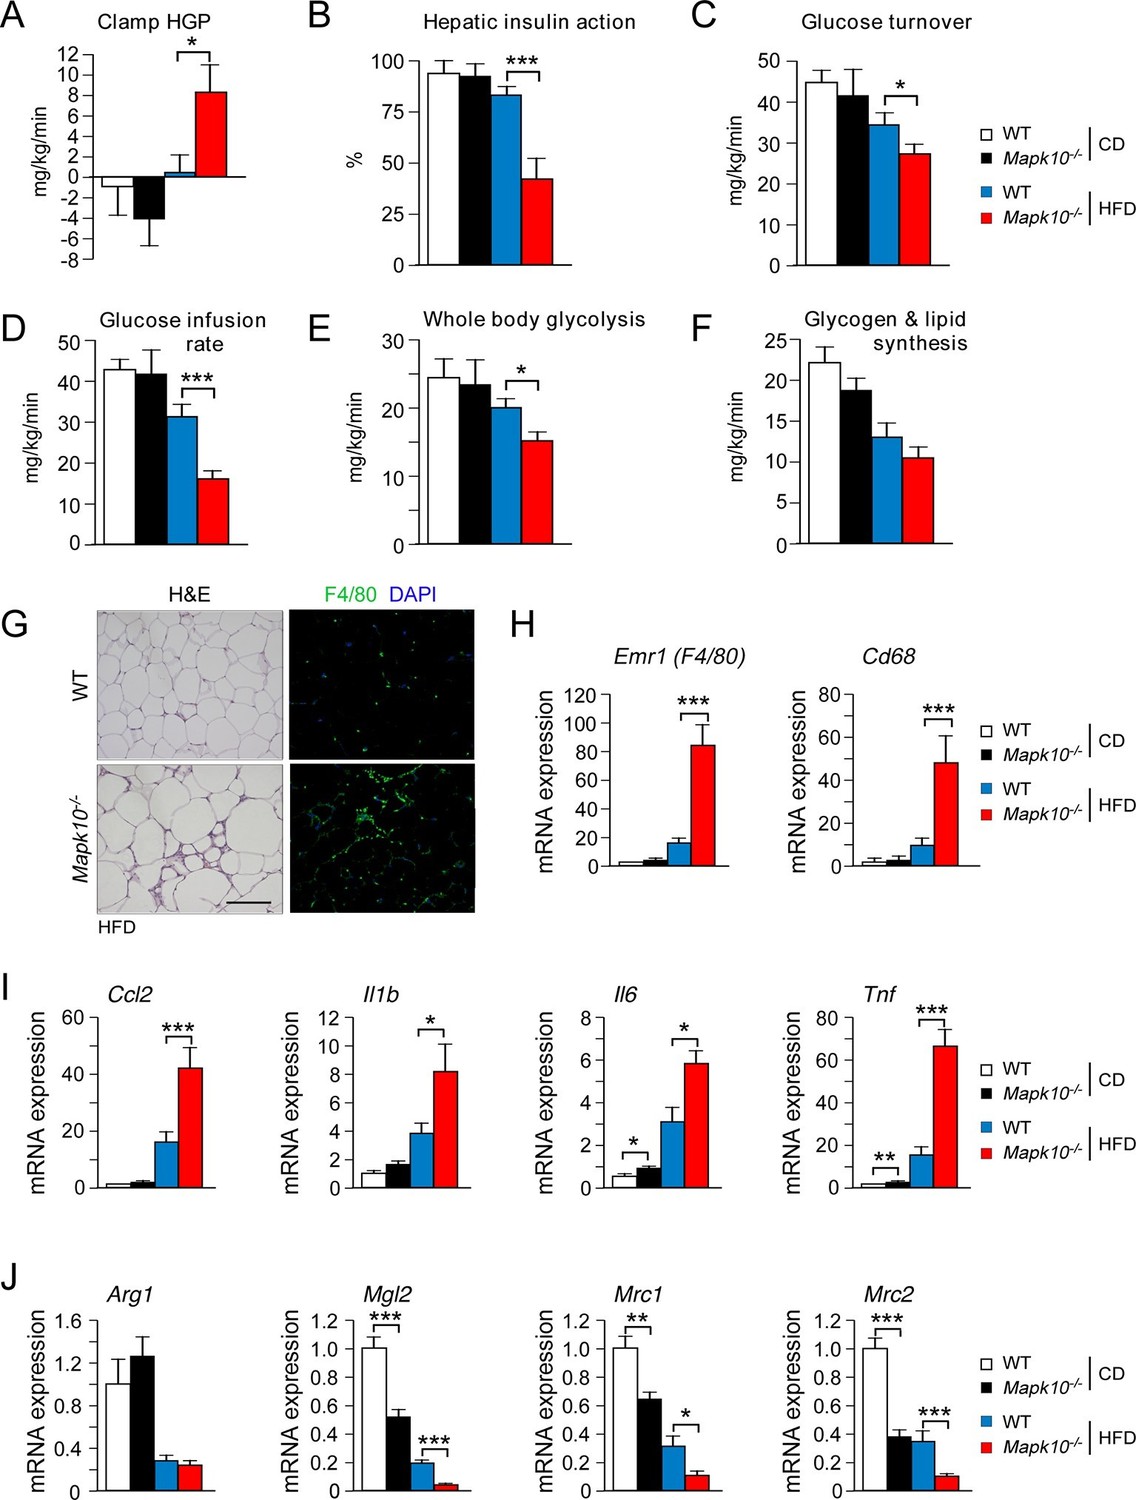
JNK3 deficiency promotes and adipose tissue inflammation and insulin resistance.
(A-F) Hyperinsulinemic-euglycemic clamps were performed on CD-fed or HFD-fed (3 wk) WT and Mapk10-/- mice. Clamp hepatic glucose production (A), hepatic insulin action (B), glucose turnover (C), glucose infusion rate (D), whole body glycolysis (E), and glycogen plus lipid synthesis (F) were measured (mean ± SE; n=8; *p<0.05; ***p<0.001). (G-J) Sections of epididymal WAT from HFD-fed (12 wk) WT and Mapk10-/- mice were stained with hematoxylin & eosin or with an antibody to the macrophage protein F4/80 (G). Macrophage infiltration was examined by measurement of the expression of Cd68 and Emr1 (F4/80) mRNA (H) and also mRNA expressed by genes associated with M1-like (I) and M2-like (J) polarization by Taqman© assays (mean ± SEM; n=10~12; *p<0.05; **p<0.01; ***p<0.001).
Figure 3
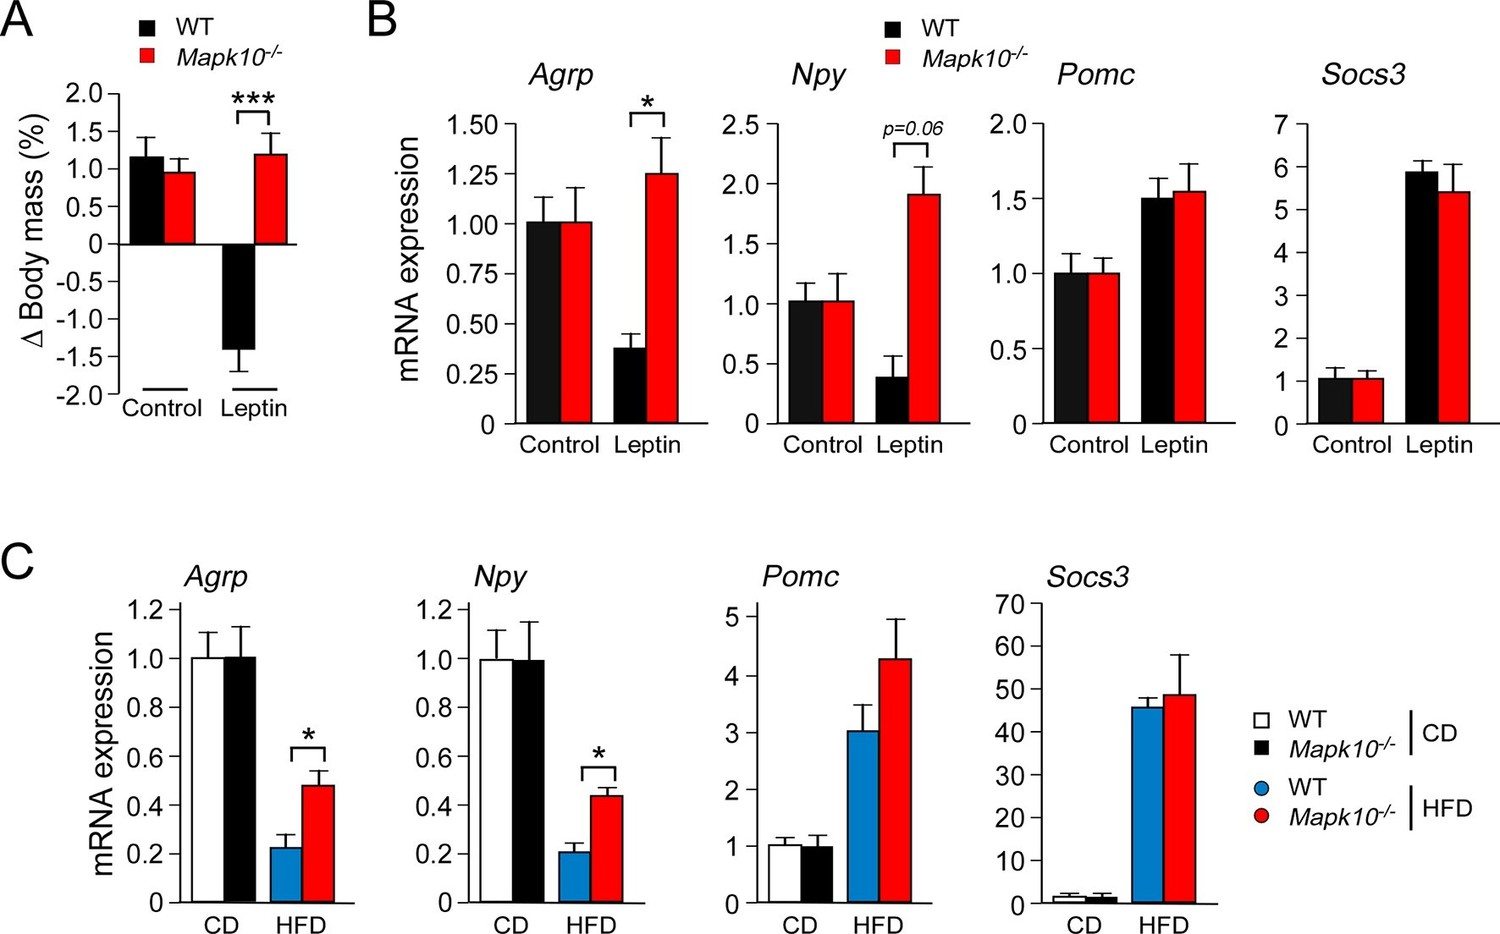
JNK3 deficiency causes a selective defect in AgRP neurons.
(A) HFD-fed (4 wk) WT and Mapk10-/- mice were treated by intracerebroventricular administration of 5 µg leptin or solvent (Control). The change in body mass at 24 hr post-treatment was measured (mean ± SEM; n=10~12; ***p<0.001). (B) WT and Mapk10-/- mice were treated without or with leptin (2h) prior to measurement of hypothalamic gene expression by Taqman© assays (mean ± SEM; n=10~12; *p<0.05). (C) Hypothalamic gene expression in CD-fed and HFD-fed (12 wk) WT and Mapk10-/- mice was measured by Taqman© assay (mean ± SEM; n=10~12; *p<0.05).
Figure 4 with 2 supplements
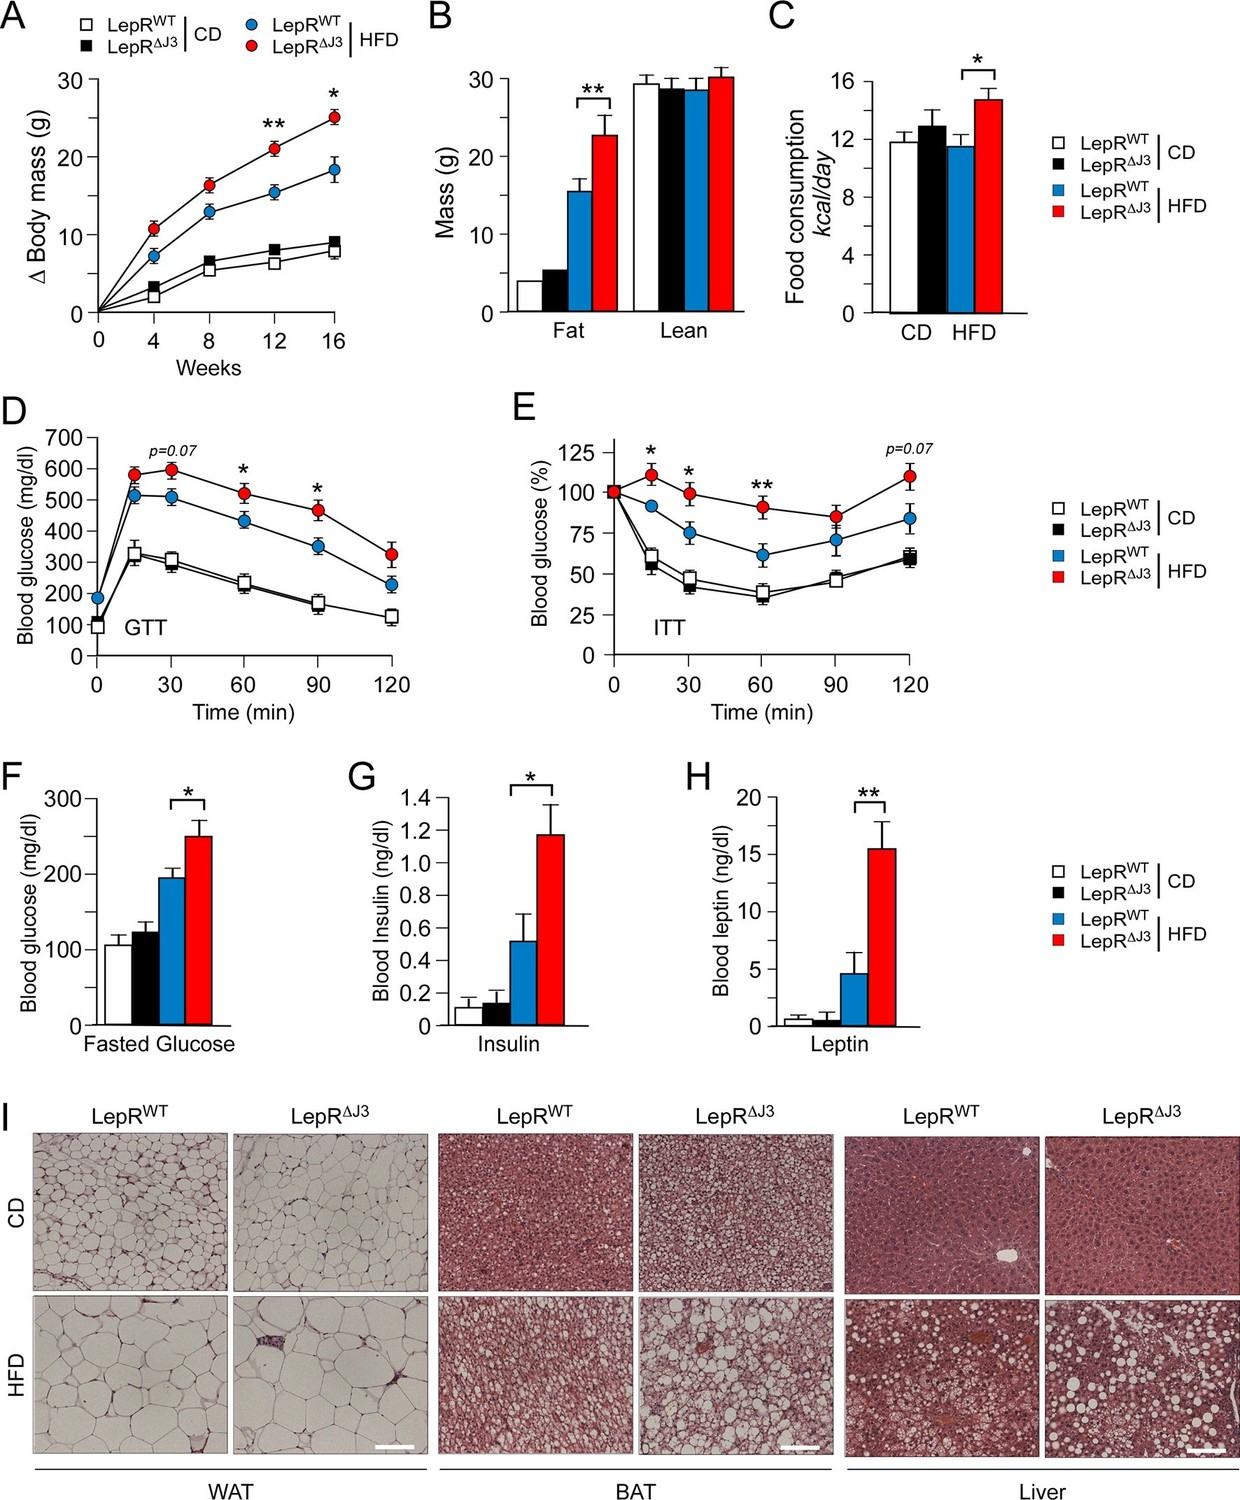
JNK3 deficiency in leptin-responsive neurons causes HFD-induced hyperphagia and obesity.
(A) The total body mass gain of CD-fed and HFD-fed mice was examined (mean ± SEM; n = 10~25; *p<0.05; **p<0.01). JNK3 deficiency in LEPRb+ neurons was studied by comparing Leprb-cre control mice (LepRbWT mice) and Leprb-cre Mapk10LoxP/LoxPmice (LepR∆J3 mice). (B) The fat and lean mass of CD-fed and HFD-fed (16 wk) mice was measured by 1H-MRS analysis (mean ± SEM; n = 8~10; **p<0.001). (C) Food consumption by CD-fed and HFD-fed (4 wk) LepRWT and LepR∆J3 mice was examined (mean ± SEM; n = 8; *p<0.05). (D,E) Glucose tolerance (D) and insulin tolerance (E) tests were performed using CD-fed and HFD-fed (12 wk) LepRWT and LepR∆J3 mice (mean ± SEM; n = 8~12; *p<0.05; **p<0.01). (F-H) CD-fed and HFD-fed (12 wks) LepRWT and LepR∆J3 mice were fasted overnight and the blood concentration of glucose (F), insulin (G), and leptin (H) was measured (mean ± SEM; n = 8~20; *p<0.05**p<0.01). (I) Sections of epididymal WAT, interscapular BAT, and liver from CD-fed and HFD-fed (12 wk) LepRWT and LepR∆J3 mice were stained with hematoxylin & eosin. Bar, 100 μm.
Figure 4—figure supplement 1
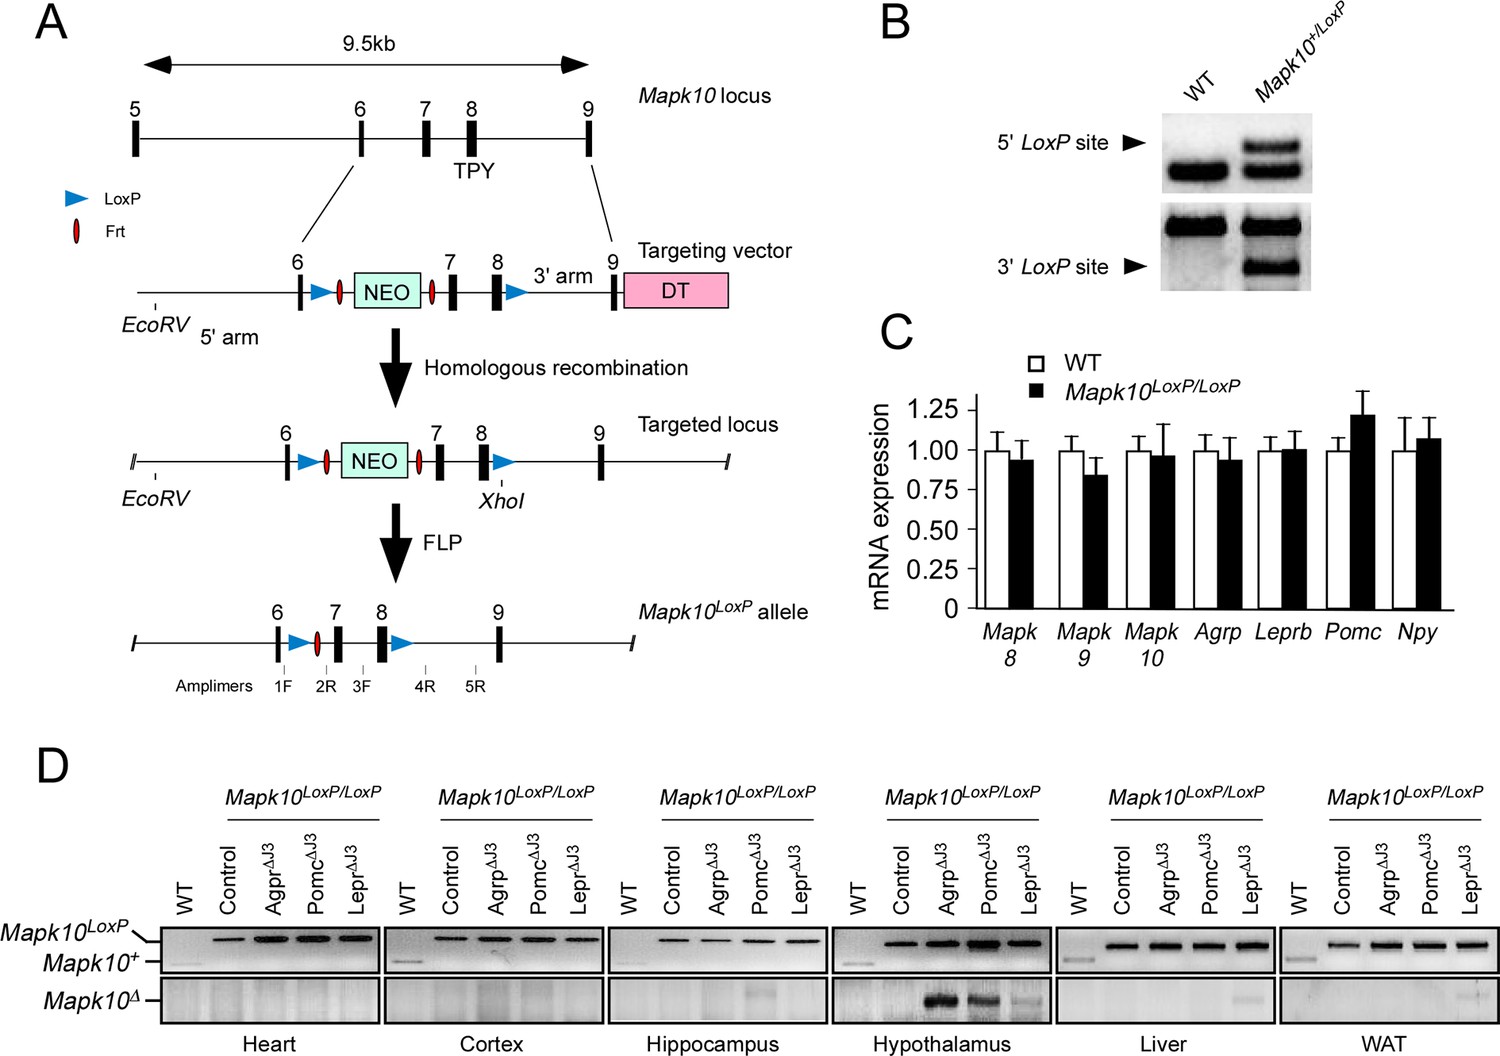
Establishment of Mapk10LoxP/LoxPmice.
(A) The strategy employed to target the Mapk10 locus (exons 6–9) by homologous recombination is illustrated. Restriction sites and PCR amplimers are indicated. Abbreviations: NEO, neomycin resistance cassette; and DT, diptheria toxin cassette. (B) The integrity of 5’ and 3’ LoxP sites of the Mapk10LoxP allele were verified by PCR analysis of genomic DNA using amplimers 1F & 2R (5’ site) and 3F & 5R (3’ site). (C) Comparison of hypothalamic expression of selected genes in WT and Mapk10LoxP/LoxPmice by Taqman© assays. No significant differences (p>0.05) between WT and Mapk10LoxP/LoxPmice were detected (mean ± SEM; n=3). (D) PCR genotype analysis of DNA isolated from different tissues of WT mice, Mapk10LoxP/LoxPmice, Agrp-cre Mapk10LoxP/LoxPmice (Agrp∆J3), Pomc-cre Mapk10LoxP/LoxPmice (Pomc∆J3), and LepRb-cre Mapk10LoxP/LoxPmice (LepR∆J3) using amplimers 1F & 2R (upper panel) and 1F & 4R (lower panel).
Figure 4—figure supplement 2
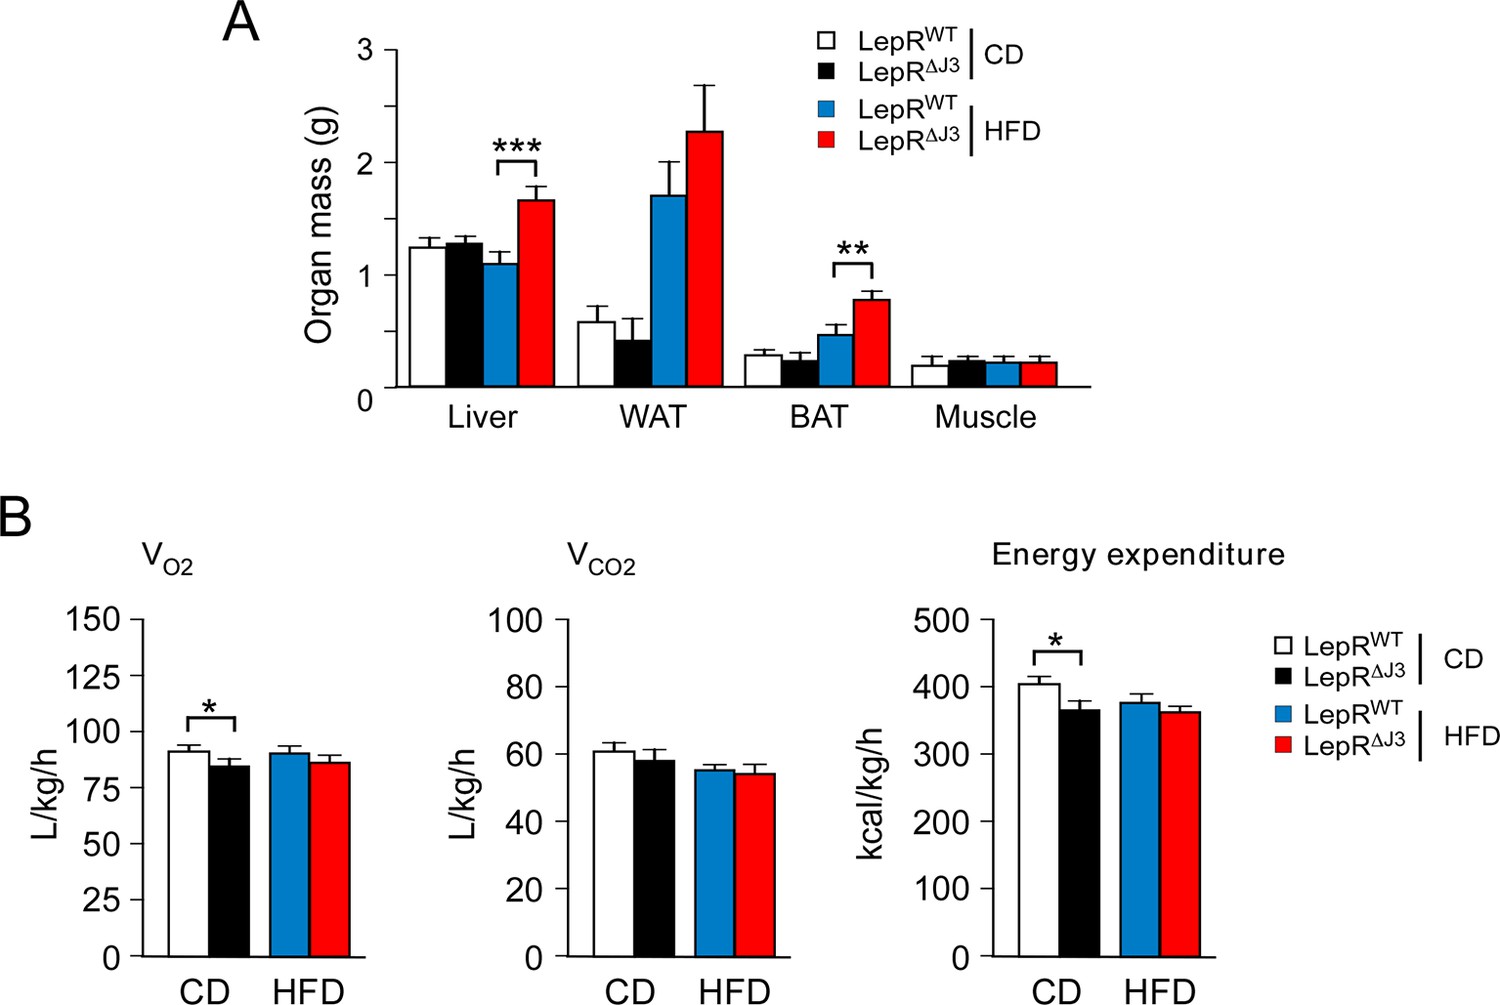
JNK3 deficiency in leptin-responsive neurons causes obesity.
(A) Organ mass of CD-fed and HFD-fed (16 wk) LepRb-cre (LeprWT) and LepRb-cre Mapk10Loxp/LoxP(Lepr∆J3) mice was measured (mean ± SEM; n=10~12; **p<0.01; ***p<0.001). (B) CD-fed and HFD-fed (4 wk) LeprWT and Lepr∆J3 mice were examined using metabolic cages to measure VO2, VCO2, and energy expenditure (mean ± SEM; n=8; *p<0.05).
Figure 5 with 1 supplement
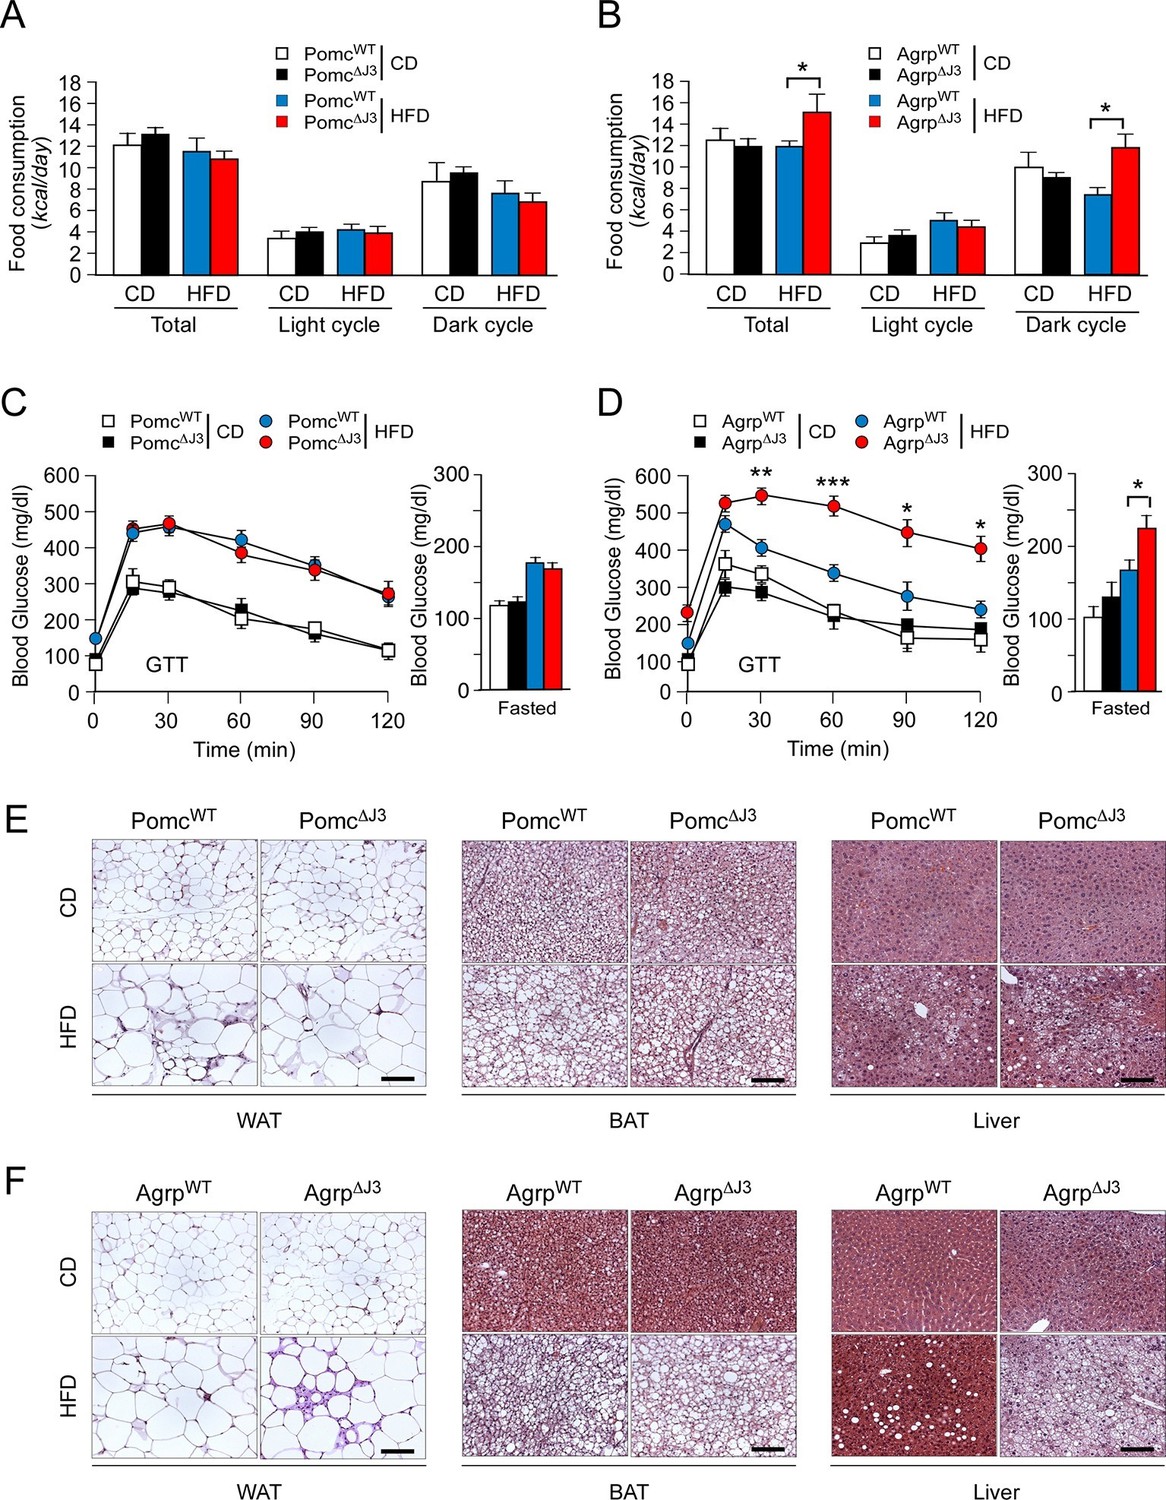
JNK3 in AgRP neurons, but not POMC neurons, regulates food consumption.
(A,B) Food consumption by CD-fed and HFD-fed (4 wk) mice was measured (mean ± SEM; n = 8; *p<0.05). JNK3 deficiency in POMC neurons was studied by comparing Pomc-cre control mice (PomcWT mice) and Pomc-cre Mapk10LoxP/LoxPmice (Pomc∆J3 mice). JNK3 deficiency in AgRP neurons was studied by comparing Agrp-cre control mice (AgrpWT mice) and Agrp-cre Mapk10LoxP/LoxPmice (Agrp∆J3 mice). (C,D) CD-fed and HFD-fed (16 wk) control mice and mice with JNK3 deficiency in POMC neurons (C) and AgRP neurons (D) or were tested using glucose tolerance assays and by measurement of fasting blood glucose concentration (mean ± SEM; n = 8~12; *p<0.05; **p<0.01; ***p<0.001). (E,F) Representative hematoxylin & eosin-stained sections of liver, epididymal WAT, and interscapular BAT from CD-fed and HFD-fed (16 wk) control mice and mice with JNK3 deficiency in POMC neurons (E) and AgRP neurons (F) are presented.
Figure 5—figure supplement 1
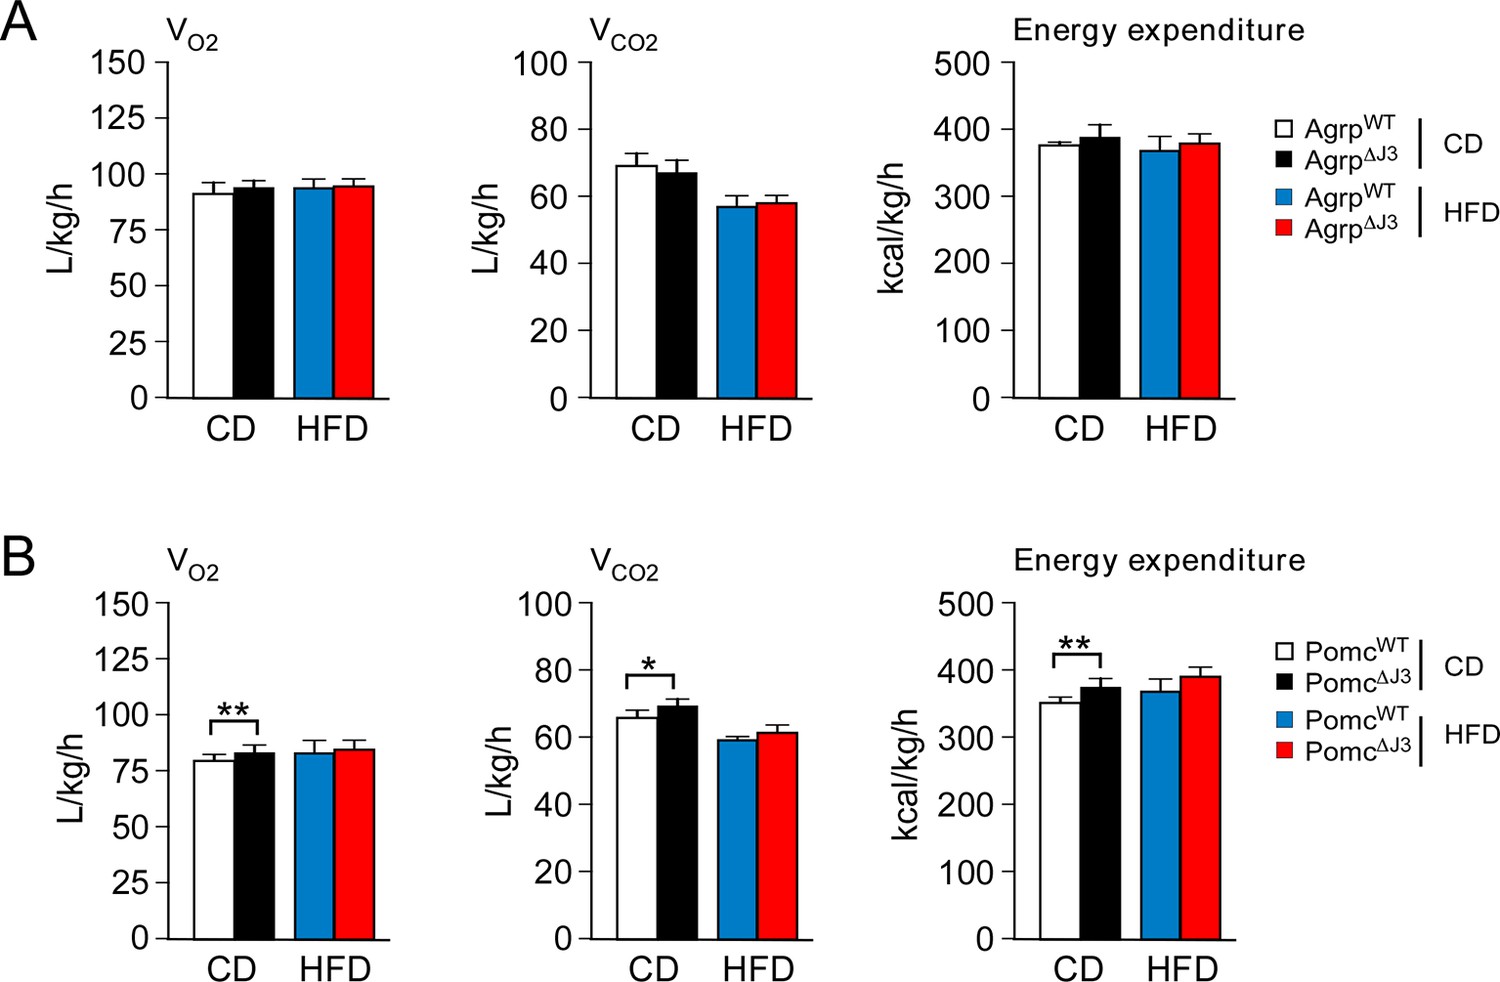
Effect of JNK3 deficiency in AgRP and POMC neurons on energy expenditure.
(A) CD-fed and HFD-fed (4 wk) AgrpWT and Agrp∆J3 mice mice were examined using metabolic cages to measure VO2, VCO2, and energy expenditure (mean ± SEM; n=8; p>0.05). (B) CD-fed and HFD-fed (4 wk) PomcWT and Pomc∆J3 mice were examined using metabolic cages to measure VO2, VCO2, and energy expenditure (mean ± SEM; n=8; *p<0.05; **p<0.01).
Figure 6 with 1 supplement
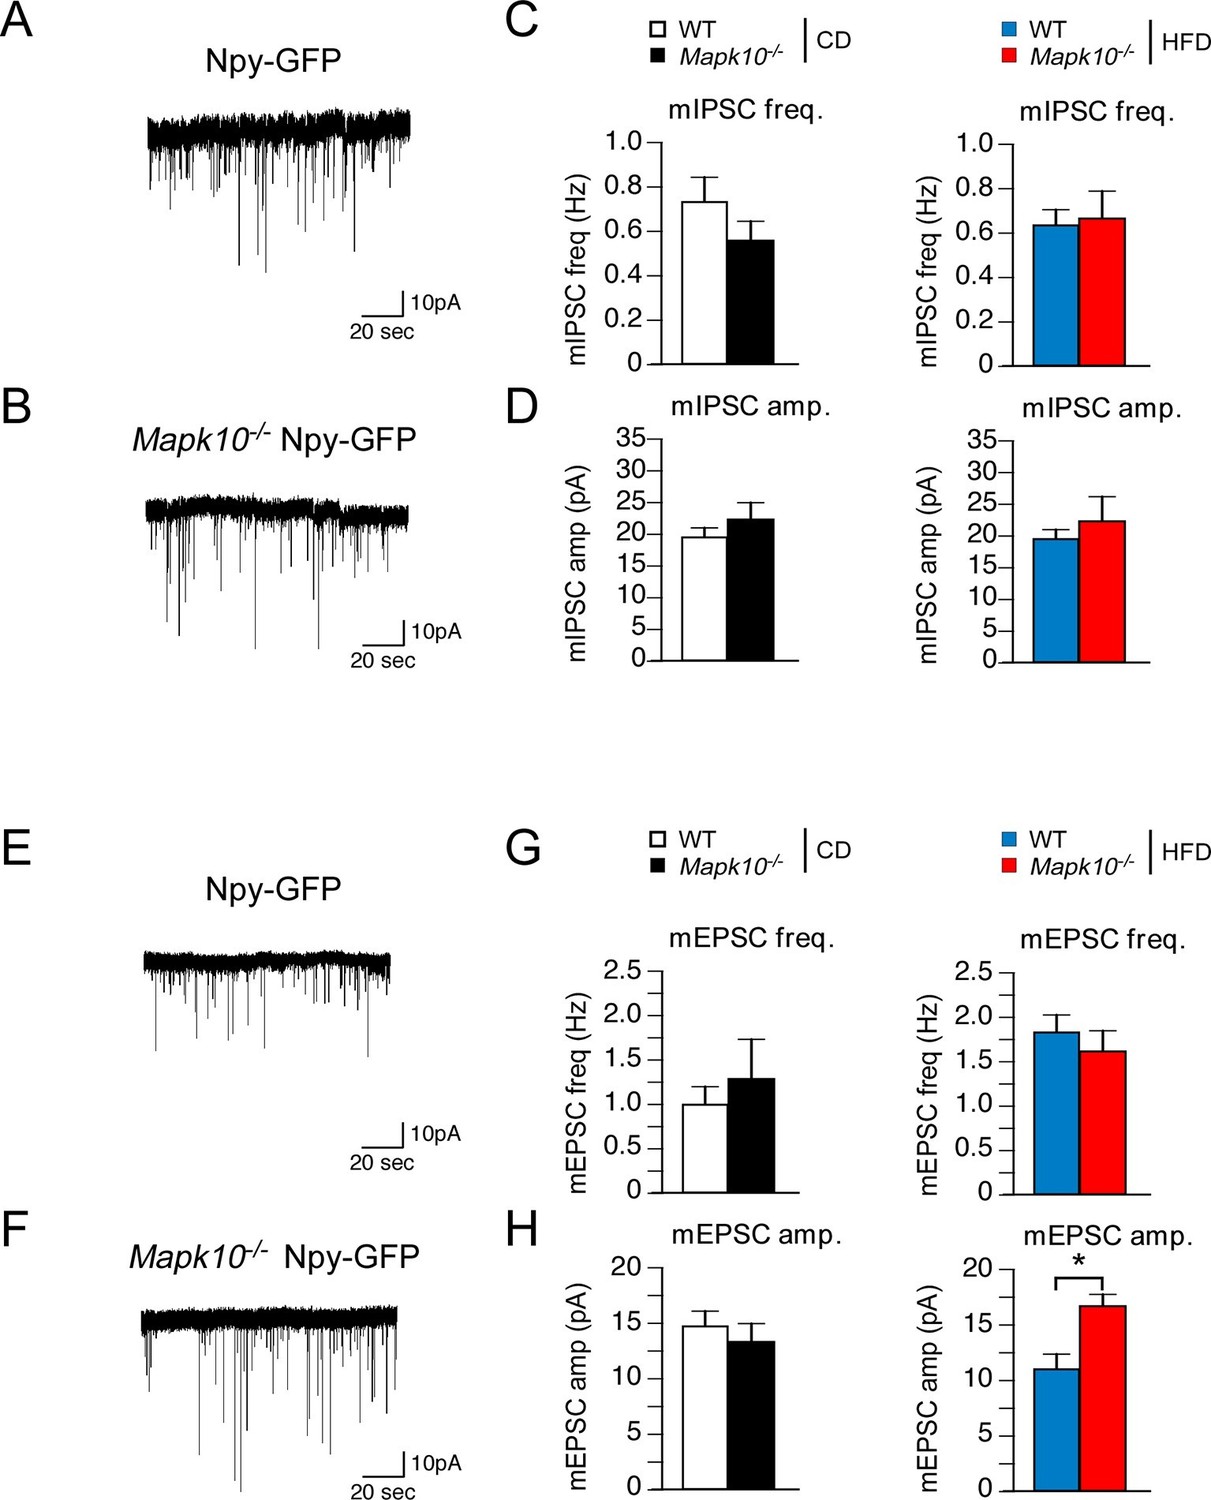
JNK3 regulates excitatory transmission onto AgRP neurons.
(A,B) Mapk10+/+ Npy-GFP and Mapk10-/- Npy-GFP mice were fed a HFD (3 wk) prior to electrophysiological recording of mIPSC from AgRP neurons. (C,D) mIPSC frequency (freq.) and amplitude (amp.) in recordings of CD-fed and HFD-fed mice were quantitated (mean ± SEM; n=11~12; *p<0.05). (E,F) Mapk10+/+ Npy-GFP and Mapk10-/- Npy-GFP mice were fed a HFD (3 wk) prior to electrophysiological recording of mEPSC from AgRP neurons. (G,H) mEPSC frequency and amplitude in recordings of CD-fed and HFD-fed mice were quantitated (mean ± SEM; n=10; *p<0.05).
Figure 6—figure supplement 1
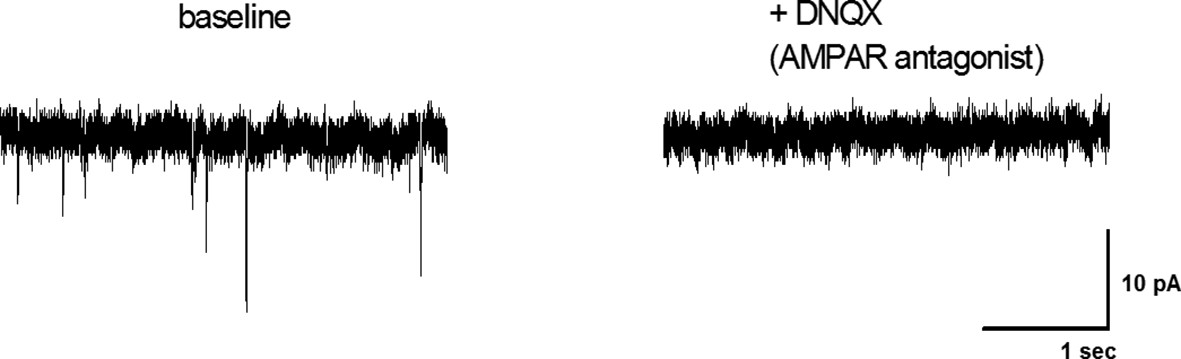
The AMPA receptor antagonist DNQX blocks mEPSCs in AgRP neurons.
mEPSCs of arcuate AgRP neurons from Npy-GFP mice were recorded under baseline conditions (perfusion with aCSF) and following addition of 10 µM DNQX. The data presented are representative of three recordings from single neurons. The selective AMPA receptor antagonist (DNQX) blocks all mEPSCs recorded at -60 mV. Extracellular Mg2+ in the bath solution blocks NMDA receptor-mediated currents at this holding potential.
Download links
A two-part list of links to download the article, or parts of the article, in various formats.
Downloads (link to download the article as PDF)
Open citations (links to open the citations from this article in various online reference manager services)
Cite this article (links to download the citations from this article in formats compatible with various reference manager tools)
Excitatory transmission onto AgRP neurons is regulated by cJun NH2-terminal kinase 3 in response to metabolic stress
eLife 5:e10031.
https://doi.org/10.7554/eLife.10031


