Transcriptome profiling of tendon fibroblasts at the onset of embryonic muscle contraction reveals novel force-responsive genes
- Department of Developmental and Cell Biology, University of California, United States
Abstract
Mechanical forces play a critical role in tendon development and function, influencing cell behavior through mechanotransduction signaling pathways and subsequent extracellular matrix (ECM) remodeling. Here, we investigate the molecular mechanisms by which tenocytes in developing zebrafish embryos respond to muscle contraction forces during the onset of swimming and cranial muscle activity. Using genome-wide bulk RNA sequencing of FAC-sorted tenocytes we identify novel tenocyte markers and genes involved in tendon mechanotransduction. Embryonic tendons show dramatic changes in expression of matrix remodeling associated 5b (mxra5b), matrilin 1 (matn1), and the transcription factor kruppel-like factor 2a (klf2a), as muscles start to contract. Using embryos paralyzed either by loss of muscle contractility or neuromuscular stimulation we confirm that muscle contractile forces influence the spatial and temporal expression patterns of all three genes. Quantification of these gene expression changes across tenocytes at multiple tendon entheses and myotendinous junctions reveals that their responses depend on force intensity, duration, and tissue stiffness. These force-dependent feedback mechanisms in tendons, particularly in the ECM, have important implications for improved treatments of tendon injuries and atrophy.
Editor's evaluation
This valuable manuscript presents solid evidence that identifies potential force-responsive gene expression responses within tenocytes and developing tendons by comparing unperturbed animals to those with paralyzed muscles. A handful of these force-responsive genes are then validated, which reveals that force-responsive gene expression differs between individual tendons or local biophysical environments and shows a phenotype in mutants for a force-responsive gene expressed during tendon development. Future work that further explores how these particular examples relate to broader force-responsive gene expression programs and that identifies stronger phenotypes when force-responsive gene expression is disrupted will strengthen its conclusions. This work is of interest to the fields of developmental biology, mechanobiology, muscle and tendon biology.
https://doi.org/10.7554/eLife.105802.sa0Introduction
All cells experience mechanical forces from their environments, from adhesive interactions between adjacent epithelial cells to structural interactions with the surrounding extracellular matrix (ECM). A key question is how cells adapt and respond to force by modifying their local microenvironment. Force-responsive cellular mechanisms have been implicated in cell differentiation (D’Angelo et al., 2011), morphogenesis (Hamada, 2015; Keller et al., 2008), tissue maintenance and repair (Riley et al., 2022; Zhang et al., 2022). However, these mechanisms remain understudied in vivo, particularly those that involve cell–ECM interactions. Dramatic examples include tendons and ligaments of the musculoskeletal system. Tendons experience a broad range of contractile forces from muscles, such as extreme stretching forces on the human Achilles tendon during exercise, and their constitutive fibroblast populations (called tenocytes) constantly remodel the surrounding ECM to adapt (Subramanian and Schilling, 2015; Wang, 2006). Tendon injuries and atrophy with aging are very common, and a better understanding of the roles of force in tendon development will aid in developing effective treatments.
Tendons are ECM-rich structures that connect muscles to cartilages and bones as well as to softer tissues. The events leading to the proper formation of their attachments relies largely upon cell–ECM interactions (Schweitzer et al., 2010; Subramanian and Schilling, 2015). For example, in the embryonic zebrafish trunk, myotendinous junctions (MTJs) at the vertical myosepta (VMS) of developing somites form via distinct tendon-independent and -dependent stages (Subramanian and Schilling, 2015). In the tendon-independent phase, myofibers differentiate and secrete ECM proteins such as Thbs4b that localize to the pre-tendon ECM and mediate initial fiber attachment. This coincides with tendon progenitor cell (TPC) migration into the MTJ. Later, in response to muscle contraction, TPCs differentiate into mature tenocytes and extend long microtubule-rich processes laterally into the surrounding ECM of the VMS, with which they regulate ECM composition locally in response to force (McNeilly et al., 1996; Pingel et al., 2014; Subramanian et al., 2018). Contractile forces acting on these MTJs activate transforming growth factor β (TGF-β) signaling in TPCs (Berthet et al., 2013; Pryce et al., 2009; Subramanian et al., 2018). Although not necessary for TPC specification, TGF-β induces expression of the transcription factors Scleraxis (Scx) and Mohawk (Mkx), which drive tenocyte fate by directly promoting transcription of collagens (i.e. Col1a1, Col1a2, Col12a1, and Col14) enriched in tendon ECM (Berthet et al., 2013; Maeda et al., 2011).
Cell type and ECM composition differ along the length of many tendons to aid in load bearing and force transmission. For example, the enthesis region where a tendon attaches to cartilage or bone is structurally graded in stiffness with fibrocartilage closer to the bone. This helps buffer mechanical stress between the elastic tendon tissue and rigid bony matrix (Lu and Thomopoulos, 2013). Fibrocartilage cells co-express Scx and Sox9, both direct transcriptional regulators of collagens, and muscle activity regulates the ratio of their expression levels (Blitz et al., 2013; Subramanian et al., 2023; Zelzer et al., 2014). This changes collagen levels, fibril size, and organization during injury or repair, as has been shown both in vitro and ex vivo (Ireland et al., 2001; Pingel et al., 2014). We have also shown that muscle contraction is required for embryonic tenocyte maturation, morphogenesis and ECM production in zebrafish tendons in vivo (Subramanian et al., 2018; Subramanian and Schilling, 2014).
To identify genes regulated by muscle contraction in tendons we have performed genome-wide bulk RNA-sequencing (RNA-seq) on FAC-sorted tenocytes of zebrafish embryos during the onset of muscle contractions and active swimming behavior. In addition to upregulation of known tenocyte markers, we find several other genes up- or downregulated as tendons differentiate that have not been implicated in tenocyte development or mechanotransduction. These include genes encoding two ECM proteins, Matrix Remodeling Associated 5b (mxra5b) and Matrilin 1 (matn1), as well as the transcription factor Kruppel-like factor 2a (klf2a). We confirm that muscle contraction regulates their transcription in tenocytes at later stages, after the onset of cranial muscle activity, by comparing wild-type and paralyzed embryos. Using genetic and physiological perturbations of muscle contraction in vivo, we show gene expression changes both in whole embryos and sorted tenocytes. Quantitative in situ methods show that their expression is contained within embryonic tendon entheses and MTJs and that their transcriptional responses to force vary depending on the strength and continuity of muscle contraction. These findings provide insights into tendon attachment specific and force-dependent feedback mechanisms in tendons during development in vivo, which have important implications for improved treatments for tendon disease, injury, and atrophy.
Results
Onset of active muscle contraction alters tenocyte gene expression
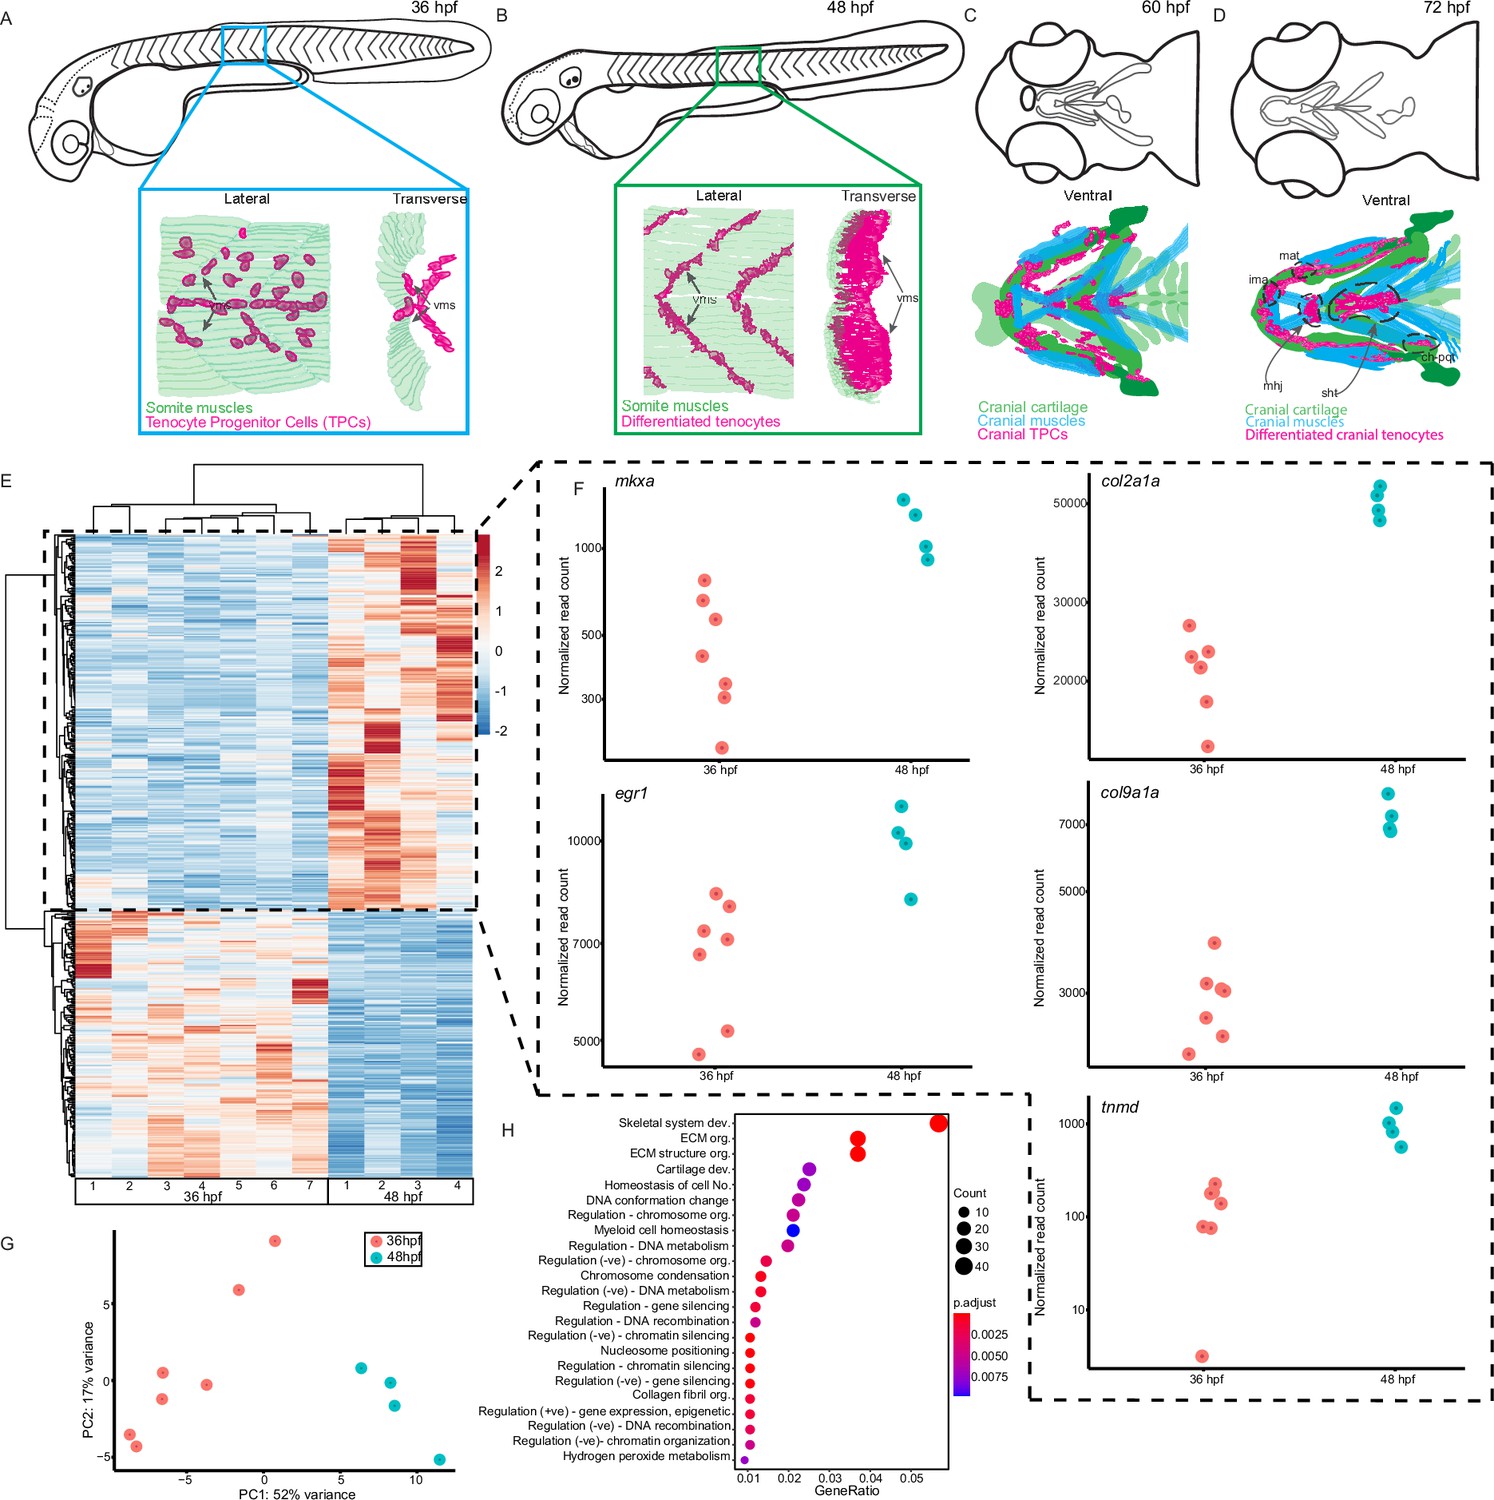
We previously showed that trunk tenocytes in zebrafish undergo dramatic morphological transformations when muscle contractions begin (Subramanian et al., 2018; Subramanian et al., 2023). These occur when embryos transition from twitching (36 hr post-fertilization, hpf) to free-swimming behaviors (48 hpf), as well as between sporadic jaw contractions at 60 hpf, and free-feeding behavior at 72 hpf (Figure 1A–D). These morphological changes likely reflect force-induced transcriptional changes in tenocytes, in addition to changes driving differentiation. To identify potential force-responsive factors, we conducted RNA-seq with FAC-sorted populations of Tg(scxa:mCherry)-positive tenocytes isolated from dissociated twitching (36 hpf) or free-swimming embryos (48 hpf). The Tg(scxa:mCherry) line predominantly labels both embryonic trunk and cranial tenocytes. We FACS-sorted mCherry+ cells using WT stage-matched non-fluorescent embryos as negative controls (Figure 1—figure supplement 1). Differential expression analysis revealed 2788 differentially expressed genes (DEGs) between twitching and free-swimming stages with p-value <0.05 (Figure 1E; Supplementary file 1). These included known tenocyte markers such as tnmd, mkxa, and egr1 upregulated at swimming (Figure 1E, F), confirming that many of the sorted mCherry+ cells were tenocytes or TPCs. Principle components associated with biological replicates segregated according to experimental condition (36 vs. 48 hpf), validating library preparation (Figure 1G; Figure 1—figure supplement 1). GO analysis for Biological Process terms associated with the top DEGs showed significant enrichment for ‘skeletal system development’ and ‘ECM organization’ (Figure 1H). Surprisingly, these included col2a1a and col9a1a, which are typically associated with cartilage development and morphogenesis (Figure 1F) suggesting that an early subset of scxa+ cells in embryonic tendons are specified as developing enthesis cells (Subramanian et al., 2023). Dual-expressing scxa/sox9a+ cells localize to cartilage attachment sites of cranial muscles at 48 hpf, prior to the onset of jaw movements (Figure 1A–D), consistent with specification of enthesis progenitors before the tendons or their skeletal muscle attachments become functional. These results also fit with recent single-cell sequencing studies of enthesis lineage trajectories in mice (Fang et al., 2022).
Figure 1 with 1 supplement see all
Onset of embryonic muscle contraction regulates transcription in tenocytes.
(A–D) Diagrams depicting changes in tenocyte distribution and morphology during onset of trunk and cranial muscle contractions, (A) 36 hpf when twitching movements are sporadic and (B) 48 hpf when embryos become free swimming. Lateral views of 36 (A) and 48 hpf embryos (B). Insets show lateral and transverse views of migrating tenocyte progenitors (A) and differentiated tenocytes at somite boundaries with polarized, branched projections (B). Ventral views of the embryonic head in 60 hpf (C) and 72 hpf (D) embryos just prior to and during the onset of jaw movements. Cartilage (green), tenocytes (magenta), and muscles (cyan) showing tenocyte elongation, particularly in the sternohyoid tendon (sht) and condensation, as well as the mandibulohyoid junction (mhj). (E) Heatmaps from bulk RNA-sequencing (RNA-seq) showing the top 1000 differentially expressed genes (DEGs) between 36 and 48 hpf. p < 0.05. (F) Elevated expression of tenocyte marker genes mkxa, tnmd, and egr1 and extracellular matrix (ECM) genes col2a1a, col9a1a in RNA-seq experiments at 48 hpf. Datapoints represent normalized read counts of single biological replicates at each color-coded timepoint (n = 7 for 36 hpf, n = 4 for 48 hpf). (G) Elevated expression of cartilage marker genes col2a1a and col9a1a in 48 hpf samples. (H) PCA of individual replicates showing separation of experimental conditions by timepoint. (I) GO analysis using Biological Process (BP) terms of top 2788 DEGs by adjusted p-value.
To identify cell signaling pathways implicated in force responses during embryonic tendon development, we analyzed our DEG list using ShinyGO (Ge et al., 2020; Supplementary file 2) and DAVID (Supplementary file 3), both of which interrogate Gene Ontology and KEGG pathway databases (Huang et al., 2009). ShinyGO identified DEGs associated with 52 different pathways with FDR <0.05, including TGF-β, MAPK, Wnt, and Notch signaling, along with cell–cell adhesion and cell–ECM adhesion (Supplementary file 2). DAVID identified many of the same pathways as well as DEGs involved in RA metabolism, an emerging pathway of interest in tendon development (McGurk et al., 2017; Supplementary file 3).
Because our RNA-seq datasets were obtained from tenocytes during the onset of muscle contractions and swimming we also searched for DEGs associated with mechanosensitive pathways. Three genes of particular interest, matn1, klf2a, and mxra5b, stood out based on their force-dependent regulation in other biological contexts or regulation by TGF-β, a well-known force-responsive signal (Maeda et al., 2011; Subramanian and Schilling, 2015). The top-most upregulated gene was matn1, which encodes an ECM protein highly enriched in cartilage; Matn1 enhances chondrogenesis of synovial fibroblasts treated with TGF-β (Pei et al., 2008). The transcription factor klf2a was also strongly upregulated; Klf2 and Klf4 have been implicated in enthesis development in mammalian tendons. Klf proteins also repress TGF-β signaling in endothelial cells (Boon et al., 2007; Li et al., 2021) and klf2a expression is mechanosensitive during heart valve development (Steed et al., 2016). The third DEG of particular interest was mxra5b, which encodes an ECM protein expressed in both tendons and ligaments during chick development (Robins and Capehart, 2018) and regulated by TGF-β in cultured human kidney epithelial cells (Poveda et al., 2017). Though other potentially mechanosensitive genes were present in our bulk RNA-seq dataset, we focused on matn1, klf2a, and mxra5b for further analysis based on evidence implicating them in mechanotransduction in other tissue contexts.
matn1, klf2a, and mxra5b are expressed in cranial and trunk tenocytes in vivo
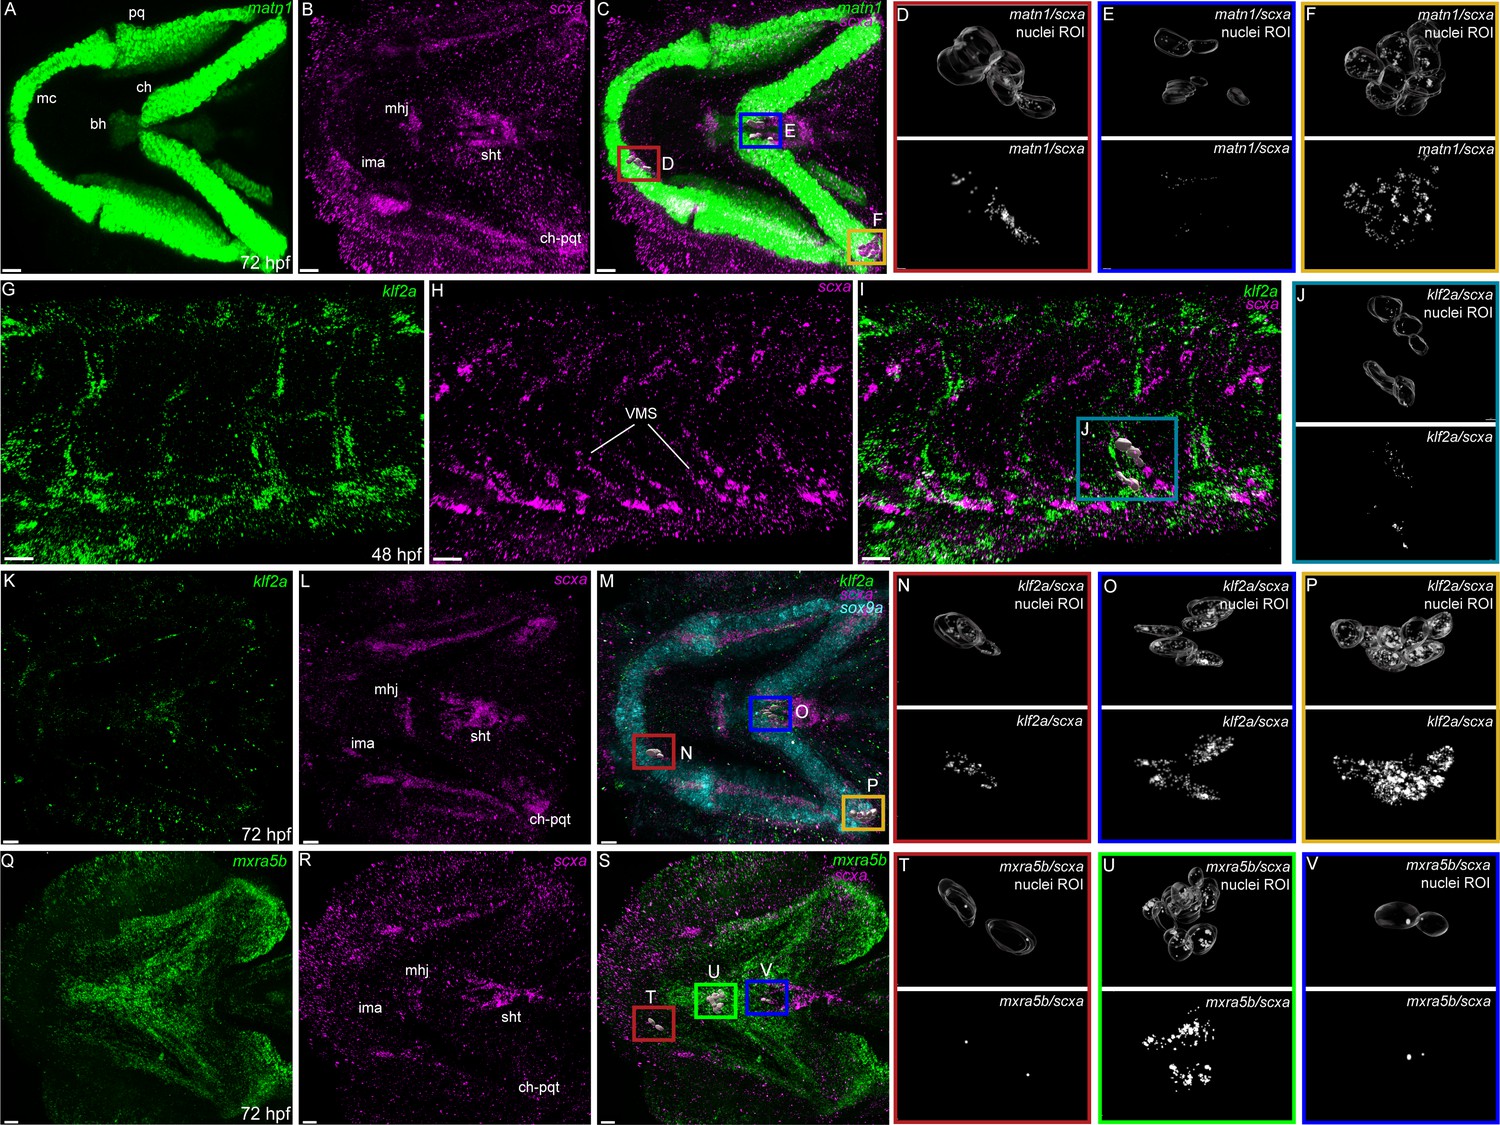
To verify tenocyte-specific expression of matn1, klf2a and mxra5b, we performed in situ hybridization (ISH). Conventional chromogenic ISH for matn1 detected no expression at 36 hpf but very strong expression at 48 and 60 hpf in developing craniofacial and pectoral fin cartilages (Figure 2—figure supplement 1A–C). Differential expression of matn1 in our tendon dataset could reflect expression in developing fibrocartilage enthesis progenitors closely associated with cartilages. To test this idea, we conducted fluorescent in situ Hybridization Chain Reaction (isHCR) for scxa and matn1 at 51 hpf, slightly later than our RNA-seq samples to allow better visualization of differentiated chondrocytes, and 72 hpf after the onset of jaw movements. scxa/matn1 co-expressing cells localized to the intermandibularis anterior tendon (ima) and sternohyoid tendon (sht), specifically in the entheses that attach to meckels, anterior edge of the ceratohyal cartilages, and the posterior enthesis of the ceratohyal (ch-pqt), at 72 hpf (Figure 2A–F, Figure 2—figure supplement 2A–D).
Figure 2 with 2 supplements see all
Expression of matn1, klf2a, and mxra5b with scxa in cranial and trunk tenocytes.
Ventral cranial (A–F, K–V) and lateral trunk (G–J) views of 72 hpf (A–F, K–V) and 48 hpf (G–J) embryos showing isHCR of matn1 (A, C–F), klf2a (G, I–K, M–P), and mxra5b (Q, S–V) in combination with scxa (B–F, H–J, L–P, R–V). (D–F, J, N–P, T–V) Higher magnification views of tenocyte nuclei in marked ROI. (C, D, M, N, S, T) ROI and panels outlined in magenta show magnified views of 3D volumes of tenocytes associated with imt. (I, J) ROI and panels outlined in cyan show magnified views of 3D volume of VMS tenocytes. (C, E, M, O, S, V) ROI and panels outlined in royal blue show magnified views of 3D volume of tenocytes associated with sht enthesis. (C, F, M, P) ROI and panels outlined in yellow show magnified views of 3D volumes of tenocytes associated with ch-pqt. (S, U) ROI and panels outlined in green show magnified views of 3D volumes of tenocytes associated with mhj. Each magnified view of ROI displays a translucent outline of the nuclear 3D volume with white puncta representing voxel colocalizations of isHCR as depicted by the colocalization function in Imaris (see Methods). mc – Meckel’s cartilage, pq – palatoquadrate, ch – ceratohyal, bh – basihyal cartilage, ima – intermadibularis anterior tendon, mhj – mandibulohyoid junction, sht – sternohyoideus tendon, ch-pqt – ceratohyal-palatoquadrate tendon, sb – somite boundary. Scale bars = 20 µm.
For klf2a, chromogenic ISH revealed expression at VMS (somite boundaries) in the trunk at 48 hpf as well as developing pharyngeal arches and pectoral fins at 48 and 60 hpf (Figure 2—figure supplement 1D–F). This was confirmed by double isHCR of klf2a and scxa showing overlapping expression in tenocytes at VMS at 48 hpf (Figure 2G–J). klf2a expression was also detected in multiple cranial tendons at 72 hpf, most prominantly in the entheses of the ima, sht, and ch-pqt (Figure 2K–P). This provides the first evidence for klf2a as an enthesis marker in craniofacial tendons, similar to Klf2 expression in developing mouse limb entheses (Kult et al., 2021; Lu and Thomopoulos, 2013; Zelzer et al., 2014).
mxra5b expression was first detected by chromogenic ISH at VMS near the horizontal myoseptum (HMS), which separates dorsal and ventral somites at 36 hpf, as well as in the notochord and cranial mesenchyme at 48 hpf (Figure 2—figure supplement 1G, H). Expression increased and extended along the VMS by 60 hpf (Figure 2—figure supplement 1). Double isHCR for scxa and mxra5b, detected mxra5b expression in cranial entheses (including ima, mhj, and sht – as well as others not shown), and in the mandibulohyoid junction tendon (mhj) in embryos at 72 hpf (Figure 2Q–V). Similar to klf2a, mxra5b expression has not been described in cranial connective tissues previously.
Tenocyte-specific gene expression of matn1, klf2a, and mxra5b is regulated by muscle contraction
Since matn1, klf2a, and mxra5b were among the top DEGs in tenocytes at the onset of active swimming and persistent muscle activity, we reasoned that mechanical force regulates their expression. To test this, we performed Real Time Quantitative-PCR (RT-qPCR) in genetically paralyzed embryos. Relative expression of each gene was compared between wild-type (WT) embryos and homozygous mutants lacking the function of the voltage-dependent L-type calcium channel subtype beta-1 (cacnb1−/−), which blocks muscle contraction (Subramanian et al., 2018; Zhou et al., 2006). At 48 hpf, all three genes were downregulated in cacnb1−/− mutants versus WT (Figure 3—figure supplement 1A). In contrast, at 72 hpf once jaw movements had begun, only matn1 and mxra5b remained downregulated in cacnb1−/− embryos while klf2a expression increased (Figure 3—figure supplement 1B).
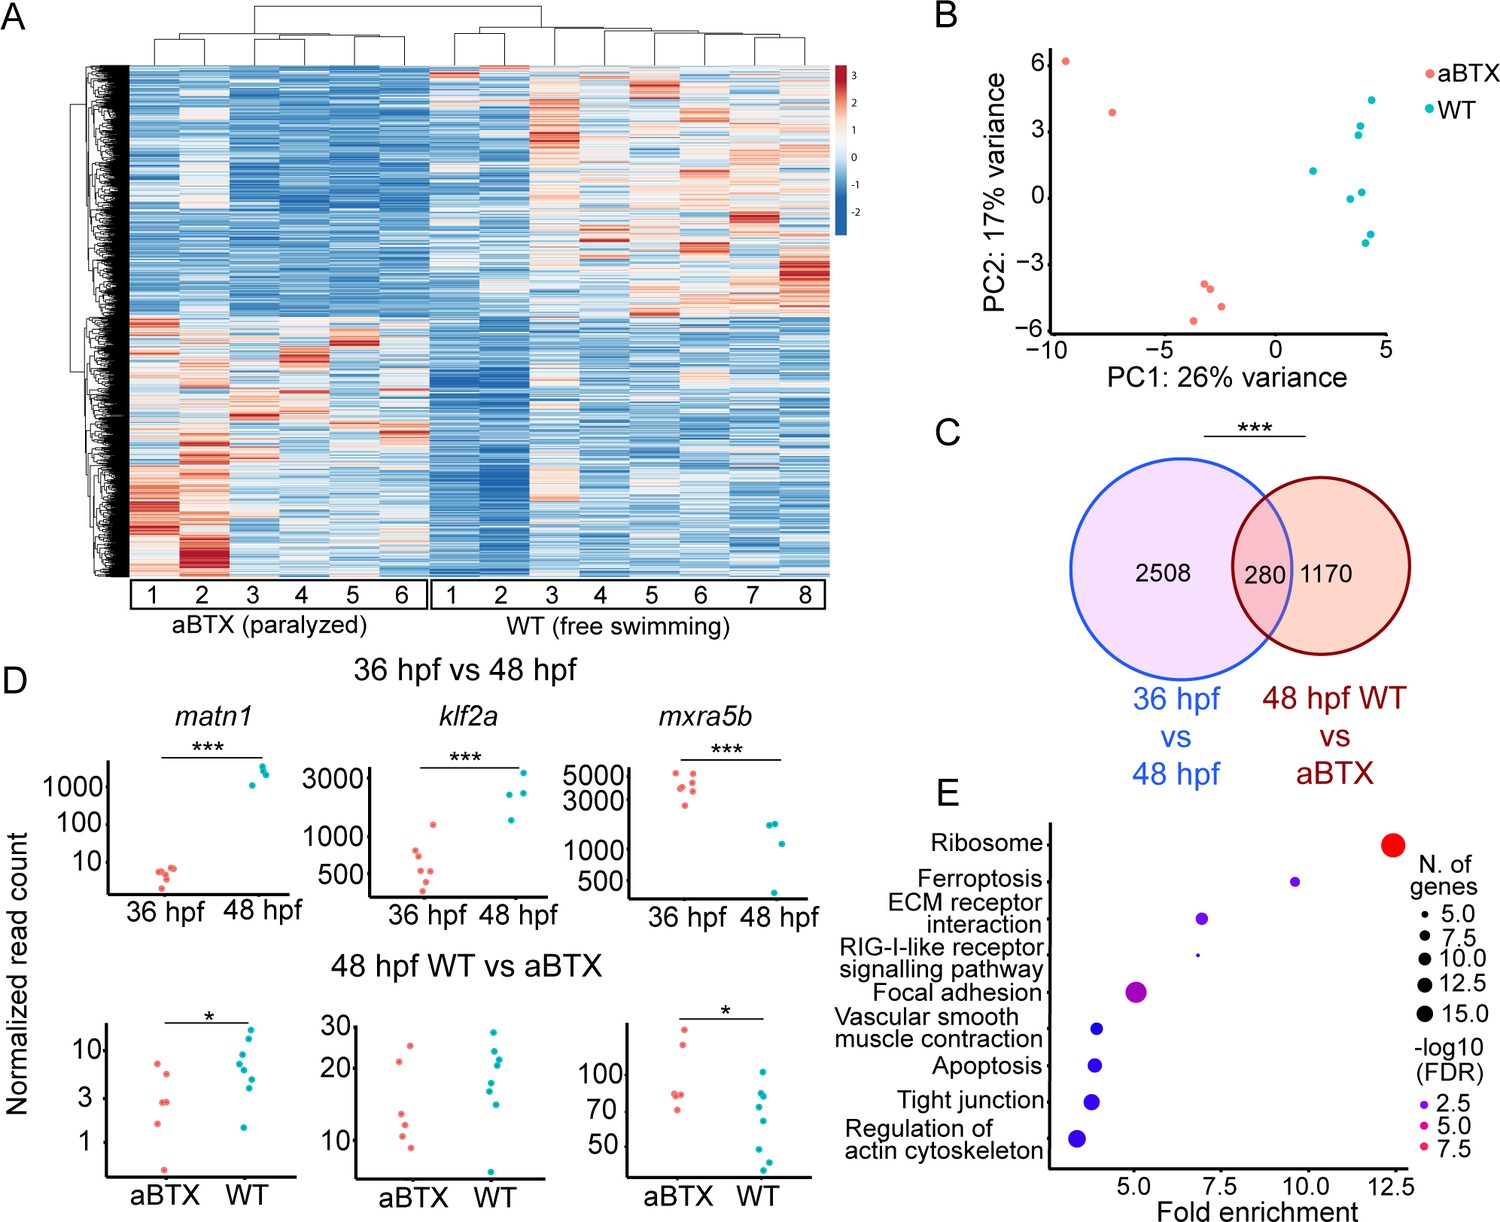
To confirm that loss of muscle contraction caused these transcriptional changes in tenocytes we injected Tg(scxa:mCherry) embryos at the 1-cell stage with full-length alpha-bungarotoxin mRNA (aBTX), which paralyzes embryos by irreversibly binding to acetylcholine receptors at neuromuscular synapses. Bulk RNA-seq of sorted mCherry+ cells from whole aBTX-injected embryos at 48 hpf compared with WT uninjected controls (Figure 3A) identified 1450 DEGs. PC analysis clearly separated WT and aBTX biological replicates (Figure 3B, Supplementary file 4). 280 DEGs overlapped between both bulk RNA-seq runs (Figure 3C, Supplementary file 5). GO term analysis, using shinyGO (Ge et al., 2020), identified many of the same pathways downregulated in cacnb1−/− embryos, as well as others not previously implicated in tendon mechanotransduction. Seveal of these mapped to terms such as ‘Focal Adhesion’, including rhoab, rock2a (both part of Rho-ROCK signaling), and col9a1a (Figure 3E, Supplementary file 6) further implicating these as force dependent in tendons.
Figure 3 with 1 supplement see all
Paralysis regulates tenocyte gene expression in developing musculoskeletal system.
(A) Heatmap of differentially expressed genes (DEGs) from bulk RNA-sequencing (RNA-seq) between WT and aBTX-injected (aBTX-inj) paralyzed 48 hpf embryos (force perturbed). (B) PCA of individual replicates WT versus aBTX-inj embryos’ RNA-seq separate by experimental condition. (C) Venn diagram shows overlap of genes between developmental time-point and force perturbed RNA-seq experiments. (D) Comparison of normalized read counts between replicates of matn1, klf2a, and mxra5b in 36 versus 48 hpf and WT versus aBTX RNA-seq experiments. (E) KEGG pathway analysis plot shows enrichment of overlapping genes from (C). ns = not significant, *p < 0.05, ***p < 0.001.
Comparisons of matn1, klf2a, and mxra5b expression between aBTX and WT versus our original 36 hpf versus free swimming 48 hpf RNA-seq experiment, revealed similar trends in expression. This suggests that the expression changes seen at embryonic stages (36 vs. 48 hpf) reflect tenocyte responsiveness to muscle contraction (Figure 3D). Further, comparing the 48 hpf WT versus cacnb1−/− mutant RT-qPCR with both bulk RNA-seq experiments, matn1 and mxra5b expression were both consistently downregulated by paralysis, while klf2a expression was more variable across experiments (Figure 3A, D).
Having shown reproducible changes in their expression between bulk RNA-seq results, we next asked if variable recovery of muscle contractile forces differentially affects changes in matn1, klf2a, and mxra5b expression caused by paralysis. To test this, we used 90 ng/µl of aBTX , a concentration optimized to paralyze embryos only for the first 2 days of embryogenesis after which they gradually recover. Nearly all aBTX-injected embryos regained muscle contractions and were swimming at 48 hpf. We performed RT-qPCR on cDNA derived from these embryos and compared them to aBTX paralyzed (aBTX-P) and uninjected controls. We separated 48 hpf recovered embryos into two subgroups based on the extent of muscle contraction: (1) partially recovered (Twitching or aBTX-T), in which embryos showed sporadic contractions of the trunk and pectoral fin muscles, similar to twitching 36 hpf embryos and (2) fully recovered (Recovered, or aBTX-R), in which embryos swam freely. At 48 hpf, RT-qPCR revealed significant global downregulation of matn1 and mxra5b in αBTX paralyzed embryos compared to WT uninjected siblings, like cacnb1−/− mutant embryos (Figure 3—figure supplement 1C) and were upregulated in aBTX-T and aBTX-R embryos (Figure 3—figure supplement 1D). In contrast, klf2a was upregulated in paralyzed embryos, though this increase was also not statistically significant from WT controls (Figure 3—figure supplement 1E). These results, combined with those from RNA-seq, suggest that matn1, klf2a, and mxra5b transcription during development are regulated by muscle contraction.
To verify that these transcriptional changes occur specifically in tenocytes in response to force, we examined matn1, klf2a, and mxra5b expression in scxa-positive cells by isHCR with mCherry antibody staining of Tg(scxa:mCherry) fish using our αBTX paralysis-recovery experimental protocol (Figure 4, Figure 5, Figure 6). Additionally, we quantified expression at multiple attachment regions across different tendons for each gene to determine if responses differed between spatially distinct tendons and by attachment type (e.g. enthesis vs. MTJ).
Figure 4 with 1 supplement see all
Mechanical force differentially regulates expression of matn1 in ima enthesis tenocytes.
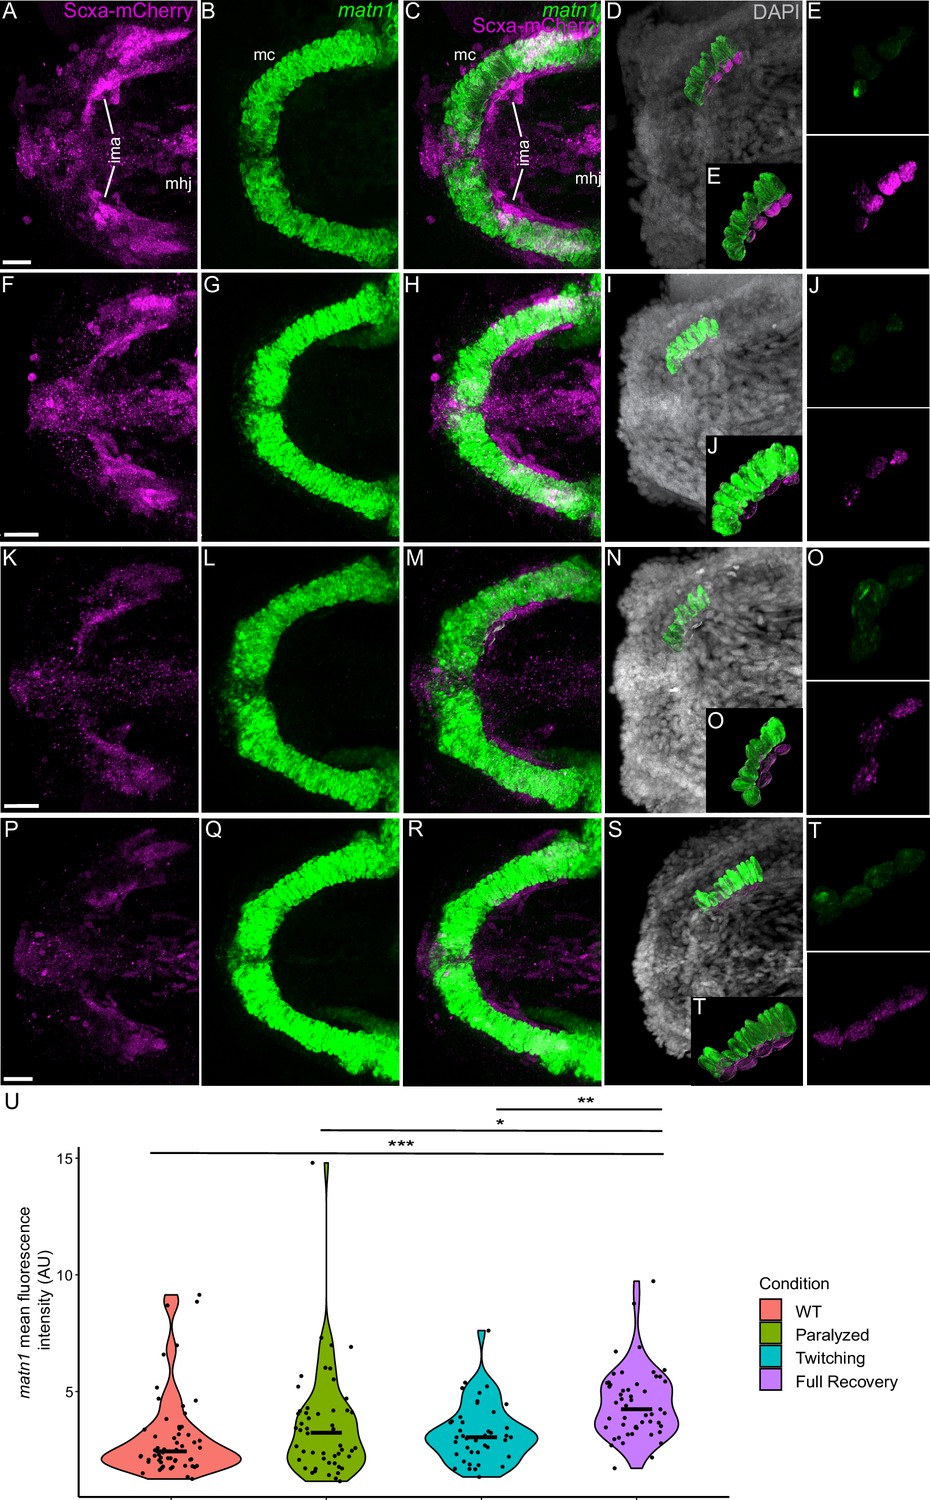
Ventral views of Meckel’s cartilage and associated tenocytes showing in situ Hybridization Chain Reaction (isHCR) of matn1 (green) and anti-mCherry immunofluorescence (magenta) marking the tenocytes in Tg(scxa:mCherry) embryos at 72 hpf in WT uninjected (WT) (A–E), aBTX-inj (Paralyzed) (F–J), partially recovered aBTX-inj (Twitching) (K–O), and completely recovered aBTX-inj (Full Recovery) (P–T) conditions at ima enthesis. (D, I, N, S) Grayscale images showing nuclei stained with DAPI with ROIs showing isolated 3D volumes of chondrocytes (green) and enthesis tenocytes (magenta) based on DAPI signal. (E, J, O, T) Insets showing magnified views of the 3D volumes of tenocytes associated with ima enthesis depicting expression of matn1 and stained for mCherry. (U) Violin plot showing changes in mean fluorescence intensity of matn1 in ima enthesis tenocyte nuclei between WT (n = 8), Paralyzed (n = 8), Twitching (n = 6), and Full Recovery (n = 7) with ~8 nuclei measured per embryo. p-value calculated with linear mixed effects model with Tukey post hoc test. *p < 0.05, **p < 0.01, ***p < 0.001. Scale bars = 20 µm.
-
Figure 4—source data 1
Measurements of matn1 isHCR signal intensity in ima enthesis tenocytes.
- https://cdn.elifesciences.org/articles/105802/elife-105802-fig4-data1-v2.xlsx
Figure 5 with 3 supplements see all

Mechanical force differentially regulates expression of mxra5b in sht enthesis tenocytes.
Ventral views of ceratohyal (ch) cartilage and associated tenocytes showing in situ Hybridization Chain Reaction (isHCR) of mxra5b (green) and anti-mCherry immunofluorescence (magenta) marking the tenocytes in Tg(scxa:mCherry) embryos at 72 hpf in WT uninjected (WT) (A–E), aBTX-inj paralyzed (F–J), partially recovered aBTX-inj (Twitching) (K–O), and completely recovered aBTX-inj (Full Recovery) (P–T) conditions at sht enthesis. (D, I, N, S) Grayscale images showing nuclei stained with DAPI with ROIs showing isolated 3D volumes of chondrocytes (green) and sht enthesis tenocytes (magenta) based on DAPI signal. (E, J, O, T) Insets showing magnified views of the 3D volumes of tenocytes associated with sht enthesis depicting expression of mxra5b and stained for mCherry. (U) Violin plot showing changes in mean fluorescence intensity of mxra5b in sht enthesis tenocyte nuclei between WT (n = 7), Paralyzed (n = 8), Twitching (n = 8), and Full Recovery (n = 4) with ~8 nuclei measured per embryo. p-value calculated with linear mixed effects model with Tukey post hoc test. *p < 0.05, **p < 0.01. Scale bars = 20 µm.
-
Figure 5—source data 1
Measurements of mxra5b isHCR signal intensity in sht enthesis tenocytes.
- https://cdn.elifesciences.org/articles/105802/elife-105802-fig5-data1-v2.xlsx
Figure 6
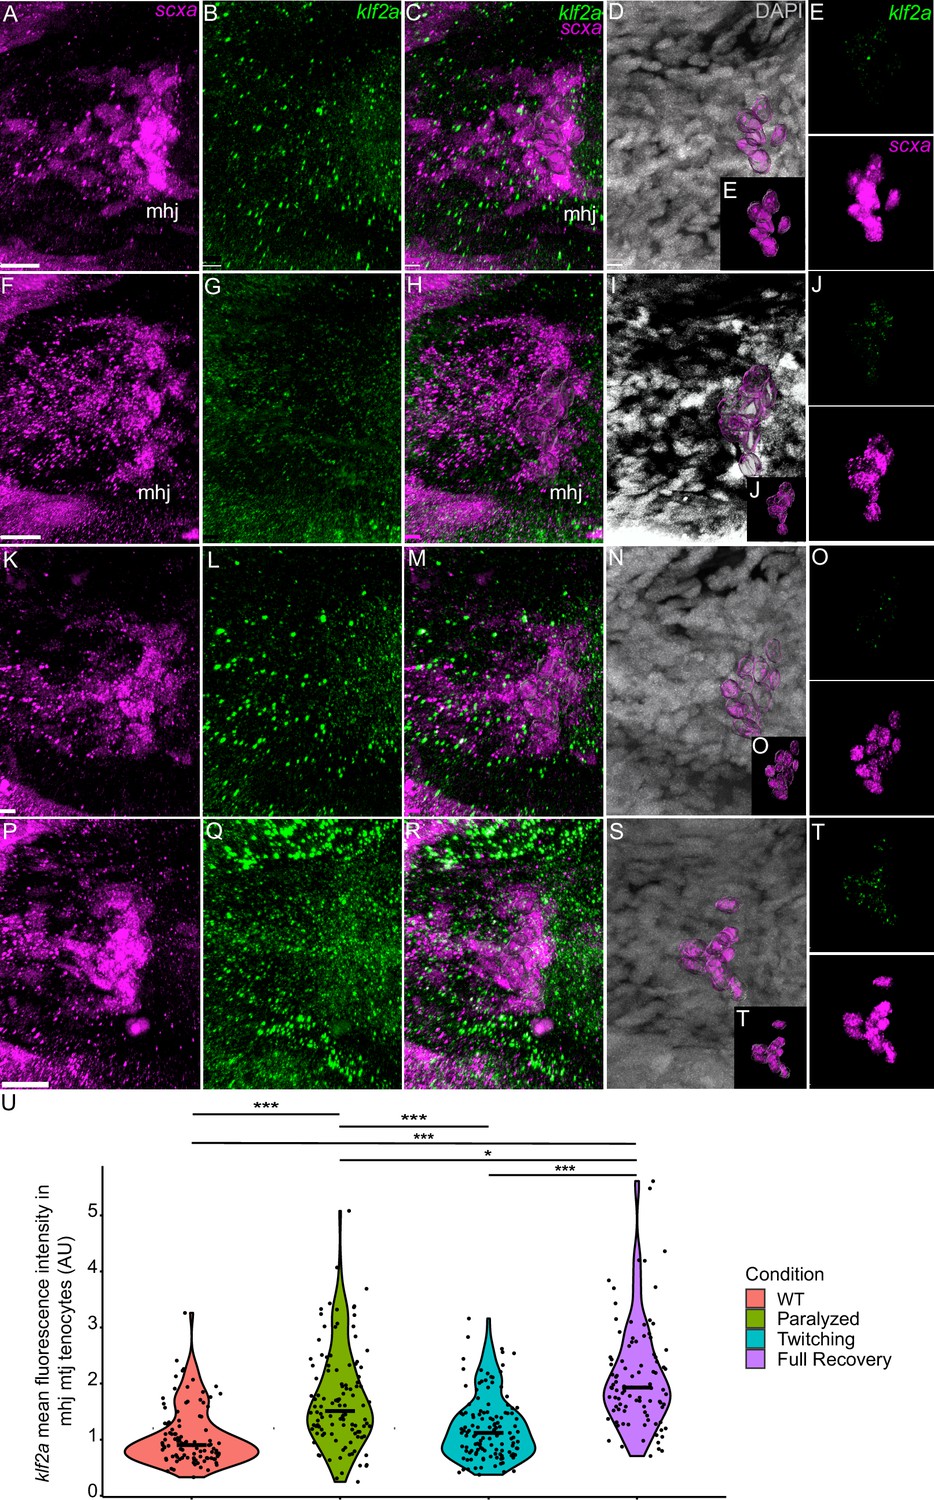
Mechanical force regulates expression of klf2a in mhj myotendinous junction tenocytes.
Ventral views of mandibulohyoid junction (mhj), myotendinous junction (MTJ) associated tenocytes showing in situ Hybridization Chain Reaction (isHCR) of klf2a (green) and anti-mCherry immunofluorescence (magenta) marking the tenocytes in Tg(scxa:mCherry) embryos at 72 hpf in WT uninjected (WT) (A–E), aBTX-inj (Paralyzed) (F–J), partially recovered aBTX-inj (Twitching) (K–O), and completely recovered aBTX-inj (Full Recovery) (P–T) conditions. (D, I, N, S) Grayscale images showing nuclei stained with DAPI with ROIs showing isolated 3D volumes of mhj tenocytes (magenta) based on DAPI signal. (E, J, O, T) Insets showing magnified views of the 3D volumes of tenocytes associated with mhj MTJ depicting expression of klf2a and stained for mCherry. (U) Violin plot showing changes in mean fluorescence intensity of klf2a in mhj MTJ tenocyte nuclei between WT (n = 17), Paralyzed (n = 15), Twitching (n = 14), and Full Recovery (n = 11) with ~10 nuclei measured per embryo. p-value calculated with linear mixed effects model with Tukey post hoc test. *p < 0.05, ***p < 0.001. Scale bars = 20 µm.
-
Figure 6—source data 1
Measurements of klf2a isHCR signal intensity in mhj MTJ tenocytes.
- https://cdn.elifesciences.org/articles/105802/elife-105802-fig6-data1-v2.xlsx
For matn1, we quantified expression by measuring its fluorescence intensity in individual tenocytes in 3D at the intermandibularis anterior (ima) enthesis where the ima attaches to meckel’s (mc) cartilage and the sht enthesis at the anterior end of the ch cartilage (Figure 4A–T, Figure 4—figure supplement 1A–L; Subramanian et al., 2023). Cells were selected for quantification by their co-expression of matn1 and Scxa and positions near chondrocytes expressing matn1 alone and tenocytes expressing Scxa alone, as described previously (Subramanian et al., 2023). In these ima tenocytes, we found no significant difference in matn1 expression between WT and paralyzed embryos, but increased expression in fully recovered (aBTX-R) embryos relative to WT, Paralyzed, and Twitching (aBTX-T) embryos (Figure 4U). Conversely, tenocytes of the sht enthesis showed no significant difference in expression across any of the conditions (Figure 4—figure supplement 1M).
We also examined fluorescence intensity in scxa/mxra5b or scxa/klf2a double positive tenocytes located at ima and sht entheses, as well as mhj and sht MTJs. mxra5b expression in the ima enthesis was significantly reduced in paralyzed, aBTX-T twitching, and remained low in aBTX-R fully recovered embryos compared to WT (Figure 5—figure supplement 1Z). However, in tenocytes of all other measured attachment sites (sht enthesis, mhj MTJ, sht MTJ), mxra5b expression returned to WT levels upon full recovery (Figure 5, Figure 5—figure supplement 2M, Figure 5—figure supplement 3M). klf2a expression in ima and sht entheses was significantly increased in paralyzed and aBTX-T embryos compared to WT and further increased upon full recovery (Figure 4—figure supplement 1Z, Figure 5—figure supplement 1M). However, unlike entheses, klf2a expression in sht MTJ tenocytes only increased significantly from twitching to full recovery, and in mhj MTJ tenocytes the pattern was much more variable, increasing upon paralysis, decreasing to WT levels at twitching, and re-increasing beyond WT levels at full recovery (Figure 5—figure supplement 3, Figure 6U).
To address functions of matn1, klf2a, and mxra5b in tenocytes we used multiplex CRISPR/Cas9 mutagenesis (Wu et al., 2018) to generate F0 CRISPants for matn1, klf2a, and mxra5b. While we did not observe obvious phenotypic defects in matn1 and klf2a CRISPants, possibly due to genetic redundancy with other similar proteins, Tg(scxa:mCherry) embryos injected with four mxra5b gRNAs had qualitatively fewer trunk tenocytes when compared to uninjected controls (Figure 7A). Additionally, trunk VMS in mxra5b CRISPR-injected embryos displayed a wider sb angle (Figure 7B), although this may reflect a role for mxra5b in the notochord, where it is also expressed (Figure 2—figure supplement 2G–I). These results suggest that mxra5b may be required for embryonic axial tenocyte migration and/or differentiation.
Figure 7
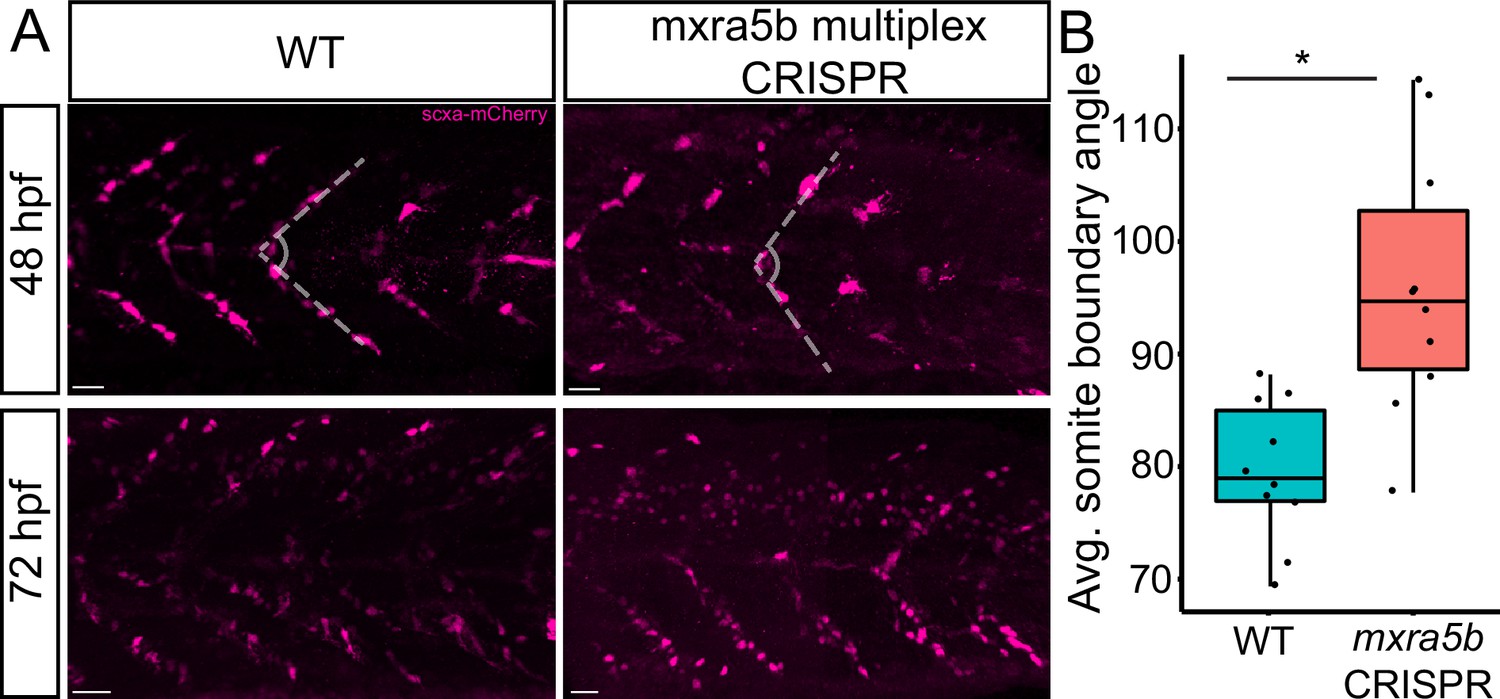
Loss of mxra5b function affects somite boundary structure.
(A) Lateral views of WT and mxra5b multiplex CRISPants at 48 and 72 hpf Tg(scx:mCherry) embryos stained with anti-mCherry to show tenocytes at the somite boundary (SB). (B) Quantification of somite boundary angle measurements of 48 hpf WT or mxra5b multiplex CRISPant embryos. p-value calculated with Watson’s U2 test. *p < 0.05.
Discussion
Previous studies of mechanotransduction in tenocytes, particularly at the transcriptional level, have largely been limited to adult tendons or in vitro assays using mesenchymal stem cells. Few have addressed how functional differences in tendons are established during embryonic development. We report the first genome-wide survey of embryonic mechanoresponsive genes and transcriptional responses across multiple tendon types. We identify three genes induced at the onset of muscle attraction and later maintained by contractile force (Figure 8A). Paralysis of zebrafish embryos alters expression of two ECM proteins in tenocytes, matn1 and mxra5b, as well as the transcription factor klf2a. All three are expressed in cranial entheses, while mxra5b and klf2a are also expressed in trunk MTJs (Figure 2, Figure 8B, Figure 2—figure supplement 1, Figure 2—figure supplement 2). Our previous studies have shown that in both tissues embryonic tenocytes in zebrafish acquire specialized morphologies and gene expression profiles as muscles first form functional attachments (Subramanian et al., 2018; Subramanian et al., 2023; Subramanian and Schilling, 2015). In contrast to classical studies of mature tendons these results suggest that cells with distinct enthesis or MTJ signatures arise in the embryo to fine-tune the ECM to match the functional demands of and forces exerted by individual muscles.
Figure 8
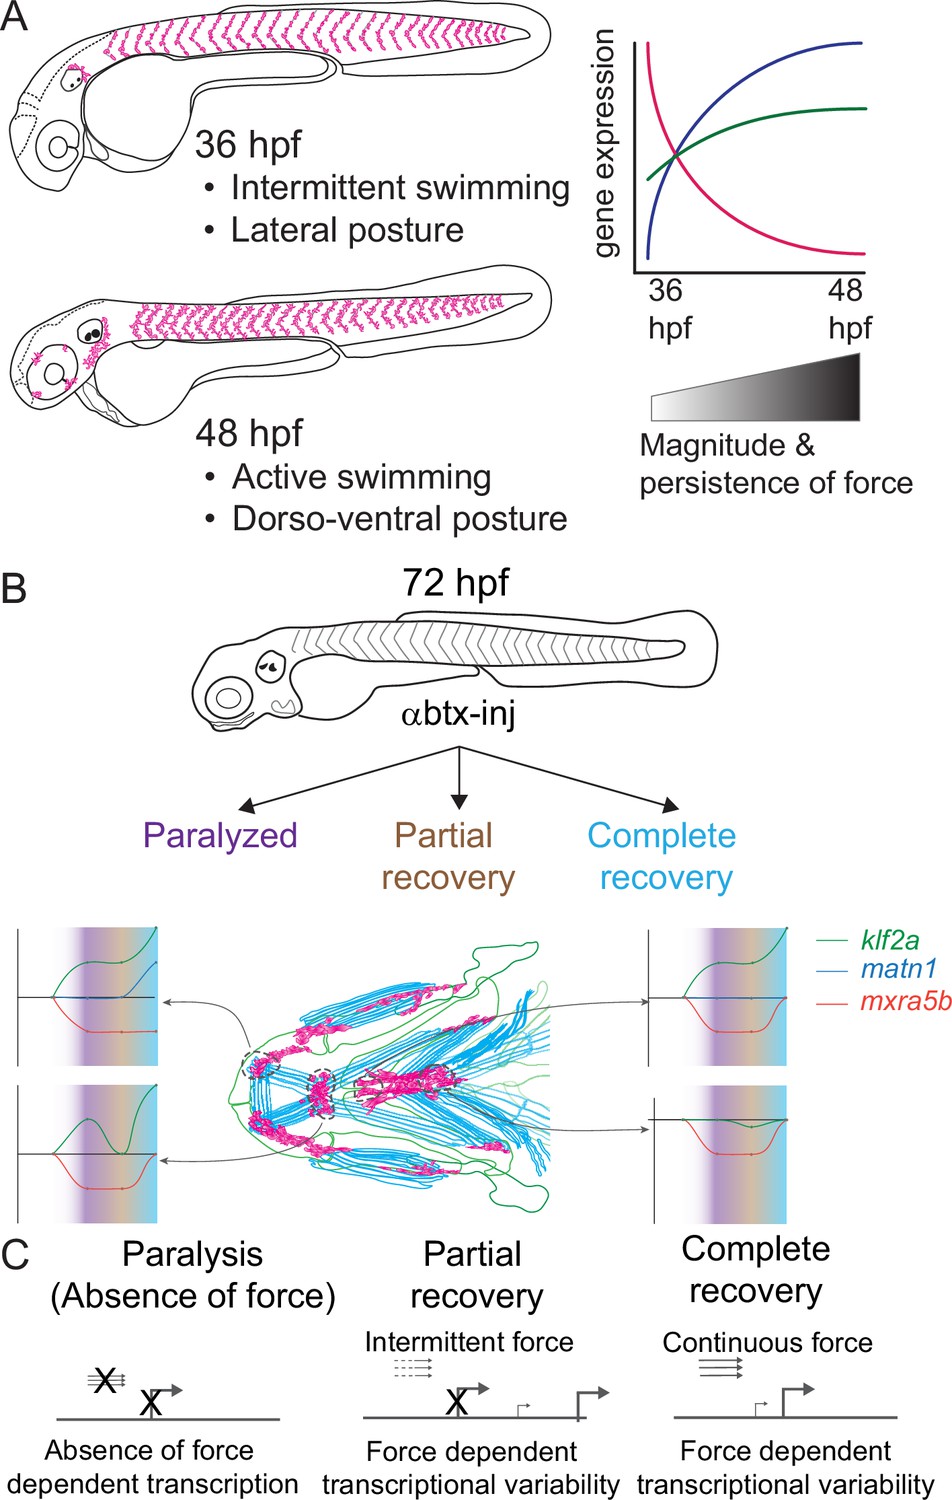
Model depicting role of mechanical force in regulating expression of genes in tenocytes during onset of active muscle contraction.
(A) Cartoon showing role of force in regulating tenocyte morphogenesis and gene expression in tenocytes between 36 and 48 hpf stages correlating with onset of active swimming The variability in gene expression is related to increase in both magnitude and persistence of muscle contraction force. (B) Representative model summarizing the multifaceted role of muscle contractile force on expression dynamics of matn1, klf2a, and mxra5b genes in cranial tendon attachments. (C) Force-responsive gene expression is more nuanced than a binary on/off control.
Classically tendon types and subdomains are distinguished by their collagen composition, and many collagens are direct Scx or Mkx transcriptional targets (Bobzin et al., 2021; Felsenthal and Zelzer, 2017; Subramanian and Schilling, 2015). This helps explain the gradient of stiffness and corresponding Scx/Sox9 expression within an enthesis (Blitz et al., 2013; Lu and Thomopoulos, 2013; Subramanian et al., 2023; Zelzer et al., 2014). Our results highlight additional genes implicated in cartilage (i.e. matn1) and fibrocartilage (i.e. KLF) in entheseal tenocytes and their force responses. Though typically thought of as cartilage-specific, matn1 and its relatives have been reported in single-cell RNA-seq (scRNA-seq) analyses of adult tenocytes and fibrocartilage (Kaji et al., 2021). We find that zebrafish matn1 regulation differs between entheses that form at different stages (Figure 4, Figure 4—figure supplement 1). Whereas paralyzed embryos at both twitching and swimming stages show reduced tenocyte matn1 expression (Figure 3D), our isHCR data reveal that expression only rebounds after full recovery of muscle contraction in the ima enthesis (Figure 8B, Figure 4—figure supplement 1; Figure 4). These spatial and temporal differences support our hypothesis that these are bona fide embryonic entheseal tenocytes specified at the edges of cartilages as muscles first attach (Subramanian et al., 2023). They are also consistent with studies showing that matn1 transcription is upregulated upon mechanical load in cultured chondrocytes (Chen et al., 2016). Chondrocyte ECM becomes disorganized in Matn1−/− mutant mice exposed to mechanical loads after medial meniscus destabilization surgery (Chen et al., 2016; Li et al., 2020). Our data implicate matn1 in tendon/fibrocartilage mechanotransduction and in the initial establishment of ECM stiffness gradients at entheses during embryogenesis (Figure 4, Figure 4—figure supplement 1; Lu and Thomopoulos, 2013).
Mxra5 (also known as adlican) encodes a secreted proteoglycan implicated in cell–cell adhesion and ECM remodeling, mainly in the context of colorectal and other cancers (He et al., 2015; Wang et al., 2013). Mxra5 is expressed in tendons and other connective tissues of developing chick embryos as well as human fibroblasts (Chondrogianni et al., 2004; Robins and Capehart, 2018). We find that zebrafish mxra5b expression is downregulated in all tenocytes at the onset of embryonic muscle contraction, unlike matn1 (Figures 3 and 5, Figure 5—figure supplements 1–3). Consistent with a force-responsive gene, MXRA5 is inhibited by TGF-β1 (Poveda et al., 2017), and associated with migration of dental pulp stem cells (Yoshida et al., 2023). Our results provide the first evidence for regulation of mxra5b transcription in tenocytes by mechanotransduction. However, despite reductions in mxra5b levels overall with loss of active muscle contraction, our isHCR results suggest that these changes differ between distinct tendons and force conditions (Figure 5). For example, in the ima enthesis, paralysis downregulates mxra5b expression, with little rebound after recovery (Figure 8B; Figure 5—figure supplement 1). In contrast, at other entheses and MTJs mxra5b expression returns to WT levels upon full recovery after paralysis (Figures 5 and 8, Figure 5—figure supplements 2 and 3). mxra5b expression may require continuous mechanical activation, levels of which differ between tendons as well as entheses or MTJs (Figure 8B). This heterogeneity may help explain differences between our RNA-seq results for mxra5b and isHCR expression data, since the RNA-seq experiments were performed on FAC-sorted tenocytes of all tendons (Figure 3).
Similar to matn1 and mxra5b, (1) zebrafish klf2a expression localizes to embryonic cranial entheses, (2) its transcription increases in tenocytes at the onset of muscle contraction, and (3) these responses vary between spatially distinct tendons and tendon subdomains (Figure 8B, Figure 3, Figure 4—figure supplement 1, Figure 5—figure supplements 1 and 3, Figure 6). Mammalian Klf2 and Klf4 have been implicated in cell differentiation at tendon-bone entheses (Kult et al., 2021). Cranial tenocytes in zebrafish upregulate klf2a upon recovery from paralysis (Figures 3 and 6, Figure 4—figure supplement 1, Figure 5—figure supplements 1 and 3), though there are discrepancies between isHCR, bulk RNA-seq, and RT-qPCR measurements. These may reflect the fact that klf2a is also expressed in other tissues, such as embryonic vascular and endocardial cells (Figure 2; Goddard et al., 2017) or differences in expression between trunk and cranial tenocyte populations. The isHCR data show distinct entheseal klf2a and MTJ expression patterns (Figure 4—figure supplement 1, Figure 5—figure supplements 1 and 3, Figure 6 and Figure 8B). Klf2-binding sites have been identified upstream of ECM genes such as Col5 in sorted entheseal tenocytes (Kult et al., 2021). Klf2 expression is also upregulated by fluid forces in endocardial cells leading to fibronectin synthesis (Boselli et al., 2015; Lee et al., 2006; Steed et al., 2016). Thus, force-dependent klf2a expression may be critical for tissue-specific ECM remodeling in many contexts.
Together, our bulk RNA-seq analysis of embryonic zebrafish tenocytes and their transcriptional responses to muscle contraction: (1) identifies new regulators of tenocyte–ECM, going beyond the better studied collagens, and (2) highlights the importance of considering developmental events that specify the mechanical properties of tendons as they form. Genes such as matn1, mxra5b, and klf2a show unique expression profiles and changes due to perturbation of muscle contraction, both during normal embryonic development and in response to paralysis (Figure 8B). The presence of these genes in embryonic tendons and their responses to force during normal development versus recovery from paralysis raises questions as to whether the mechanisms that initially establish these structures differ from those that control their maintenance (Figure 8B). Though cell–ECM feedback mechanisms have been studied in controlled 3D microenvironments in vitro, extrapolating these mechanisms into an understanding of in vivo biological processes like development and tissue homeostasis is necessary (Saraswathibhatla et al., 2023). Given the large variation of cell–ECM feedback mechanisms throughout embryonic development, understanding specific tenocyte–ECM interactions will require novel approaches to measuring the effect of varying (1) ECM microenvironment protein compositions, or local ‘matrisomes’, on tenocyte gene expression and (2) intrinsic gene expression patterns of heterogeneous tenocyte populations spatially and functionally. Single-cell approaches (e.g. scRNA-seq) at different developmental stages and in the presence or absence of force, will provide a clearer understanding of how individual spatially and functionally distinct tenocyte populations respond to force in development. Integrating such knowledge of the basic biology of tenocytes at multiple scales will be essential for developing a better picture of tenocyte–ECM interactions at individual tendons, paving the path to advance personalized translational therapies for tendon injuries.
Materials and methods
Key resources table
| Reagent type (species) or resource | Designation | Source or reference | Identifiers | Additional information |
|---|---|---|---|---|
| Strain (Danio rerio) | AB | Schilling lab | RRID:NCBITaxon_7955 | |
| Genetic reagent (Danio rerio) | Tg(scxa:mCherry) | Galloway lab | fb301Tg; RRID:ZFIN_ZDB-GENO-180925-6 | scx BAC transgenic in AB background |
| Genetic reagent (Danio rerio) | cacnb1−/−; Tg(scxa:mCherry) | Schilling lab | Ir1092;fb301; RRID:ZFIN_ZDB-ALT-191023-1 | cacnb1 mutant in Tg(scx:mCherry) background |
| Sequence-based reagent | T7 sequence-tagged primers | This paper | Supplementary file 7 | 2 mM final concentration |
| Commercial assay or kit | Protoscript II first strand cDNA synthesis kit | New England Biolabs | Cat # E6560 | |
| Commercial assay or kit | T7 RNA polymerase | Millipore Sigma (Roche) | Cat # 10881767001 | |
| Commercial assay or kit | Monarch Total RNA Miniprep kit | New England Biolabs | Cat # T2010S | |
| Commercial assay or kit | DIG RNA labeling mix | Millipore Sigma (Roche) | Cat # 11277073910 | |
| Commercial assay or kit | MEGAshortscript T7 transcription kit | Thermo Fisher Scientific (Invitrogen) | Cat # AM1354 | |
| Commercial assay or kit | Luna Universal qPCR master mix | New England Biolabs | Cat # M3003S | |
| Commercial assay or kit | Zirconium beads | Benchmark Scientific | Cat # D1032-10 | |
| Commercial assay or kit | RNEasy Micro Kit | QIAGEN | Cat # 74004 | |
| Commercial assay or kit | 40 µm filter | Pluriselect-USA | Cat # 43-10040-50 | |
| Commercial assay or kit | HCR Buffers (v3.0) | Molecular Instruments | Hybridization buffer, Wash buffer, Amplifier buffer | |
| Antibody | Anti-Digoxigenin-AP, Fab fragments | Millipore Sigma (Roche) | Cat # 11093274910 RRID:AB_514497 | 1:2000 |
| Antibody | Rat monoclonal anti-mCherry antibody | Invitrogen (Thermo Fisher Scientific) | Cat # M11217 RRID:AB_2536611 | 1:500 |
| Antibody | Chicken polyclonal anti-GFP antibody | abcam | Cat # ab13970 RRID:AB_300798 | 1:1000 |
| Antibody | Mouse monoclonal anti-myosin heavy chain antibody | Developmental Studies Hybridoma Bank (DHSB) | Cat # A4.1025 RRID:AB_528356 | 1:200 |
| Antibody | Alexa Fluor 594 AffiniPure F(ab’)2 Fragment Donkey polyclonal anti-Rat IgG (H+L) | Jackson ImmunoResearch Laboratories | Cat # 712-586-153 RRID:AB_2340691 | 1:1000 |
| Antibody | Alexa Fluor 488 AffiniPure F(ab’)2 Fragment Donkey polyclonal anti-Chicken IgY IgG (H+L) | Jackson ImmunoResearch Laboratories | Cat # 703-546-155 RRID:AB_2340376 | 1:1000 |
| Antibody | Alexa Fluor 647 AffiniPure F(ab’)2 Fragment Donkey polyclonal anti-Mouse IgG (H+L) | Jackson ImmunoResearch Laboratories | Cat # 715-606-151 RRID:AB_2340866 | 1:1000 |
| Chemical compound, drug | Nitro Blue Tetrazolium chloride solution (NBT) | Millipore Sigma (Roche) | Cat # 11383213001 PubChem CID: 9281 | |
| Chemical compound, drug | 5-Bromo-4-chloro-3-indolyl phosphate solution | Millipore Sigma (Roche) | Cat # 11383221001 PubChem CID: 81059 | |
| Chemical compound, drug | Ethylenediaminetetraacetic acid disodium salt | Millipore Sigma (Roche) | Cat # E5134 PubChem CID: 8759 | |
| Chemical compound, drug | Calcium chloride hexahydrate | Millipore Sigma (Roche) | Cat # 21108 PubChem CID: 6093252 | |
| Chemical compound, drug | Dulbecco’s phosphate-buffered saline (DPBS) 1× | Thermo Fisher Scientific (Gibco) | Cat # 14190144 | |
| Chemical compound, drug | Agarose low gelling temperature | Millipore Sigma (Sigma-Aldrich) | Cat # A9414 | |
| Chemical compound, drug | SSC buffer 20× | Millipore Sigma (Sigma-Aldrich) | Cat # S6639-1L | |
| Chemical compound, drug | DAPI | Millipore Sigma (Sigma-Aldrich) | Cat # D9542 PubChem CID: 2954 | |
| Sequence-based reagent | matn1-B1 | Molecular instruments | NM_001099740.2 | 20 probe set |
| Sequence-based reagent | mxra5b-B1 | Molecular instruments | XM_017357865.2 | 20 probe set |
| Sequence-based reagent | mxra5b-B1 | Molecular instruments | XM_017357865.2 | 20 probe set |
| Sequence-based reagent | klf2a-B3 | Molecular instruments | NM_131856.3 | 20 probe set |
| Sequence-based reagent | scxa-B2 | Molecular instruments | NM_001083069 | 18 probe set |
| Sequence-based reagent | B1-h1&h2- Alexa Fluor 488 amplifier hairpins | Molecular instruments | HCR RNA-FISH (v3.0) | |
| Sequence-based reagent | B2-h1&h2- Alexa Fluor 546 amplifier hairpins | Molecular instruments | HCR RNA-FISH (v3.0) | |
| Sequence-based reagent | B3-h1&h2- Alexa Fluor 647 amplifier hairpins | Molecular instruments | HCR RNA-FISH (v3.0) | |
| Other | BD FACSAria II Cell Sorter | Becton, Dickinson and Company | RRID:SCR_018934 | |
| Other | Bioanalyzer 2100 instrument | Agilent | RRID:SCR_018043 | |
| Other | HiSeq 4000 sequencing system | Illumina | RRID:SCR_016386 | |
| Other | NextSeq 550 system | Illumina | RRID:SCR_016381 | |
| Other | LightCycler 480 Real Time PCR System | Roche | RRID:SCR_018626 | |
| Other | SP8 Lightning Confocal microscope | Leica | RRID:SCR_018169 | |
| Other | Zeiss Axioplan 2 imaging system | Zeiss | RRID:SCR_020918 | |
| Other | MicroPublisher color RTV-5.0 CCD camera | QImaging | ||
| Other | BeadBug 3 microtube homogenizer | Benchmark Scientific | Cat # D1030 | |
| Peptide, recombinant protein | Protease (Subtilisin Carlsberg) from Bacillus licheniformis | Millipore Sigma (Sigma-Aldrich) | Cat # P5380 UniProtKB: P00780.SUBC_BACLI | |
| Peptide, recombinant protein | Collagenase Type IV from Hathewaya histolytica (Clostridium histolyticum) | Thermo Fisher Scientific (Gibco Life technologies) | Cat # 17104019 | |
| Peptide, recombinant protein | Deoxyribonuclease I (DNase I) from bovine pancreas | Millipore Sigma (Roche) | Cat # 10104159001 UniProtKB: P00639.DNAS1_BOVIN | |
| Peptide, recombinant protein | Bovine serum albumin stock solution (10%) | Miltenyi Biotec | Cat # 130-091-376 | |
| Recombinant DNA reagent | pmtb-t7-alpha-bungarotoxin | Addgene (Megason lab) | Cat # 69542 RRID:Addgene_69542 | |
| Software, algorithm | Spliced Transcripts Alignment to a Reference (STAR) v2.5.2a | Dobin lab | RRID:SCR_004463 | |
| Software, algorithm | Smart-seq2 single sample pipeline | Broad Institute | RRID:SCR_021228 | |
| Software, algorithm | RSEM v1.2.31 | Dewey lab | RRID:SCR_000262 | |
| Software, algorithm | DESeq2 v1.30.1 | Anders lab | RRID:SCR_015687 | |
| Software, algorithm | ClustVis | Vilo lab | RRID:SCR_017133 | |
| Software, algorithm | ClusterProfiler R package | Qing-Yu lab | RRID:SCR_016884 | |
| Software, algorithm | ShinyGO | Ge lab | RRID:SCR_019213 | |
| Software, algorithm | VennDiagram v1.7.3 | Boutros lab | RRID:SCR_002414 | |
| Software, algorithm | GeneOverlap v1.26.0 | Shen lab | RRID:SCR_018419 | |
| Software, algorithm | LightCycler Software | Roche | RRID:SCR_012155 | |
| Software, algorithm | Zeiss Zen Microscopy software | Zeiss | RRID:SCR_013672 | |
| Software, algorithm | Leica Application Suite X | Leica | RRID:SCR_013673 | |
| Software, algorithm | Imaris | Bitplane | RRID:SCR_007370 | |
| Other | Optical Biology Core at UCI | Department of Developmental Biology, UCI | RRID:SCR_026614 | Core facility |
| Other | Genomics Research and Technology Hub Core at UCI | Department of Biological Chemistry, UCI | RRID:SCR_026615 | Core facility |
| Other | Flow Cytometry Core at UCI | Stem Cell Research Center, UCI | RRID:SCR_026616 | Core facility |
Zebrafish embryos, transgenics, and mutants
Request a detailed protocolWT zebrafish (AB strain; RRID:NCBITaxon_7955), TgBAC(scxa:mCherry)fb301 transgenics referred to as Tg(scxa:mCherry) (RRID:ZFIN_ZDB-GENO-180925-6), or cacnb1ir1092/ir109;fb301Tg (referred to as cacnb1−/− mutants; RRID:ZFIN_ZDB-ALT-191023-1) embryos were raised in embryo medium at 28.5°C (Westerfield, 2000) and staged as described (Kimmel et al., 1995). Craniofacial musculoskeletal structures were identified and annotated as described previously (Schilling and Kimmel, 1997; Subramanian et al., 2023). All protocols performed on embryos and adult zebrafish in this study had prior approval from the IACUC at UC Irvine (protocol # AUP-23-099).
In situ hybridization
Request a detailed protocolDigoxigenin-labeled antisense RNA probes for matn1, klf2a, and mxra5b were generated using T7 sequence-tagged primers (Supplementary file 7). Total embryo RNA was extracted from 72 hpf WT embryos using Trizol (Invitrogen 15596026) and a Monarch Total RNA Miniprep kit (New England Biolabs (NEB) T2010S). cDNA was synthesized using oligo dT primers and a ProtoScript II First Strand cDNA Synthesis Kit (NEB E6560) and used as a template to synthesize RNA probes using T7 RNA polymerase (Roche, 10881767001) and DIG RNA labeling mix (Roche, 11277073910). Whole-mount ISH was performed with anti-DIG-AP fragments (Roche, 11093274910) at 1:2000 dilution, as described in Thisse and Thisse, 2008.
In situ hybridization chain reaction (isHCR) and immunohistochemistry
Request a detailed protocolisHCR probes were designed by Molecular Instruments Inc (Los Angeles, CA) and whole mount isHCR was performed with amplifiers/probes obtained from Molecular Instruments according to the isHCR v3.0 protocol as described (Choi et al., 2014; Subramanian et al., 2023; Trivedi et al., 2018). Probes/amplifier combinations used were: matn1 (NCBI ref # NM_001099740.2); mxra5b (NCBI ref # XM_017357865.2) in B1 with B1 Alexa Fluor 488, scxa (NCBI ref # NM_001083069) in B2 with B2 Alexa Fluor 546, klf2a (NCBI ref # NM_131856.3) in B3 with B3 Alexa Fluor 647.
Whole embryo immunohistochemistry was performed as described in Subramanian et al., 2018. Primary antibodies used: rat monoclonal anti-mCherry (Molecular Probes − 1:500 dilution, M11217, RRID:AB_2536611), chicken anti-GFP (Abcam – 1:1000 dilution, ab13970, RRID:AB_300798), mouse anti-myosin heavy chain (Developmental Hybridoma – 1:250, A1025, RRID:AB_528356). Secondary antibodies used: Alexa Fluor 594 conjugated donkey anti-rat IgG (Jackson ImmunoResearch – 1:1000 dilution, 712-586-153, RRID:AB_2340691), Alexa Fluor 488 conjugated donkey anti-chicken IgY (Jackson Immunoresearch, 1:1000 dilution, 703-546-155, RRID:AB_2340376), Alexa Fluor 647 conjugated donkey anti-mouse IgG (Jackson Immunoresearch, 1:1000 dilution, 715-606-151, RRID:AB_2340866).
Embryo dissociation and FAC sorting
View detailed protocolFor WT 36–48 hpf bulk RNA-sequencing (bulk RNA-seq), transgenic Tg(scxa:mCherry) zebrafish embryos were dissociated using collagenase IV (Gibco, 17104019) at a concentration of 6.25 mg/ml without trypsin addition at a temperature of 28°C for roughly 40 min, homogenizing every 5 min using a P1000 pipette as described in Barske et al., 2016. Cells were then filtered through a 40-μm filter (Pluriselect-usa, 43-10040-50). Dissociated cell suspensions were sorted on a BD FACS Aria II cell sorter (RRID:SCR_018934) at the Flow Cytometry Core facility (RRID:SCR_026616). mCherry-positive cells were gated and sorted for those expressing at high levels.
For aBTX-injected 48 hpf bulk RNA-seq, transgenic Tg(scxa:mCherry) embryos, aBTX- or uninjected siblings, were dissociated using Subtilisin A cold-active protease in a stock solution consisting of: 5 µl of 1 M CaCl2 (Sigma 21108; PubChem CID: 6093252), 100 µl of protease stock solution (100 mg of Bacillus licheniformis protease (Sigma P5380; UniProtKB: P00780.SUBC_BACLI) solubilized in 1 ml of Ca and Mg free PBS), 889 µl of 1× DPBS (Thermo Fisher 14190144), 1 µl of 0.5 M EDTA (Sigma E5134; PubChem CID: 8759), and 5 µl of DNAse I (Roche 10104159001; UniProtKB: P00639.DNAS1_BOVIN) stock (25 U/µl in PBS, stored at –80°C) adapted from O’Flanagan et al., 2019. Embryos were triturated once every 2 min for 15 s using a wide bore 1 ml pipette. Every 15 min, the tissue suspension was checked under a dissecting scope to verify dissociation. Full dissociation took ~30 min per sample, and samples were subsequently run through a 40-μm filter to separate dissociated cells from clumps of aggregated undissociated tissue/ECM and washed with 10 ml of PBS/BSA (0.01% BSA in PBS, made fresh on the day of dissociation) and transferred to a 15 ml conical tube. Cells were centrifuged at 600 × g for 5 min at 4°C, supernatant discarded, and cells were resuspended in 1 ml of ice-cold PBS/BSA before being placed on ice (Subramanian et al., 2025). Cells expressing high levels of mCherry+ cells were gated and sorted on a BD FACS Aria II cell sorter.
Bulk RNA-seq library preparation and sequencing
Request a detailed protocolFor comparing 36–48 hpf bulk RNA-seq samples an RNEasy Micro Kit (QIAGEN, 74004) was used for RNA extraction of cell lysates from FAC-sorted cells. RNA quality was checked at the UC Irvine Genomics High Throughput Facility (GHTF; RRID:SCR_026615) using a Bioanalyzer 2100 (Agilent; RRID:SCR_018043). The Smart-seq2 protocol (RRID:SCR_021228) was utilized for cDNA library construction (Picelli et al., 2014). Libraries were sequenced at the GHTF using a HiSeq 4000 sequencer (Illumina; RRID:SCR_016386) at a read depth of ~35 M reads per replicate. From 11 total biological replicates (7 for 36 hpf, 4 for 48 hpf) we obtained approximately 10,000 cells per sample replicate.
For 48 hpf bulk RNA-seq experiments, library preparations from aBTX-injected and uninjected siblings were performed by the UCI GHTF. Libraries were sequenced at GHTF on a NextSeq 550 sequencer (Illumina; RRID:SCR_016381) at a read depth of ~35 M reads per replicate.
Bulk RNA-seq data analysis
Request a detailed protocolBulk RNA-seq reads were mapped to the zebrafish genome version GRCz10 and quantified using STAR v2.5.2a (RRID:SCR_004463) (Dobin et al., 2013) and RSEM v1.2.31 (RRID:SCR_000262) (Li and Dewey, 2011). Differential gene expression analysis and PCA were performed using R package DESeq2 v1.30.1 (RRID:SCR_015687) (Love et al., 2014). Pairwise comparisons were performed between 36 and 48 hpf sorted tenocytes, and a Benjamini–Hochberg FDR adjusted p-value <0.05 was used as a threshold for considering significant differences in gene expression levels. PCA was performed on normalized count data which underwent variance-stabilization-transformation using DESeq2. Heatmaps were generated using ClustVis (RRID:SCR_017133) (Metsalu and Vilo, 2015). GO term enrichment analysis was performed using the ClusterProfiler R package (RRID:SCR_016884) (Wu et al., 2021) and ShinyGO (RRID:SCR_019213) (Ge et al., 2020).
aBTX injections
Request a detailed protocolaBTX mRNA was synthesized from the pmtb-t7-alpha-bungarotoxin vector (Megason lab, Addgene, 69542; RRID:Addgene_69542) as described in Subramanian et al., 2018; Subramanian and Schilling, 2014 and injected into embryos at the 1-cell stage at a volume of 500 picoliters per embryo. aBTX mRNA was injected at a concentration of 90 ng/μl (45 pg/embryo)to paralyze embryos that were collected for analysis at 48 hpf and 150 ng/μl (90 pg/embryo) to paralyze embryos that were collected for analysis at 72 hpf.
RT-qPCR
Request a detailed protocolWT, cacnb1−/−, aBTX-paralyzed, twitching, and recovered embryos were collected at respective timepoints, homogenized in Trizol with prefilled tube kits using high impact zirconium beads (Benchmark Scientific, D1032-10) using a BeadBug 3 Microtube Homogenizer D1030 (Benchmark Scientific), and RNA was extracted as described previously (Subramanian et al., 2018). cDNA was prepared according to the standard oligo-dT primer protocol using the ProtoScript II First Strand cDNA Synthesis Kit (NEB E6560). cDNA was diluted 1:25 in water and used as template for RT-qPCR using the Luna Universal qPCR master mix (NEB M3003S). Primers used are listed inSupplementary file 7. Primer efficiencies were calculated with the formula PCR-efficiency = 10(−1/slope) from a linear regression of Cp/ln(DNA) using a serial dilution of each primer with 72 hpf embryo cDNA as described in Pfaffl, 2001. PCR reactions were performed on a LightCycler 480 II Real Time PCR Instrument (Roche; RRID:SCR_018626) and analyzed using LightCycler 480 Software (Roche; RRID:SCR_012155). Each RT-qPCR experiment was repeated in triplicate for each biological replicate, and at least two biological replicates were used for each analysis. p-values were calculated using a two-tailed Student’s t-test with α = 0.05 in Microsoft Excel. Bar charts in Figure 3 present mean ± standard error. Venn diagram was created using the VennDiagram v1.7.3 (RRID:SCR_002414) R package with the gene list overlap tested with the Fisher’s exact test from the GeneOverlap v1.26.0 (RRID:SCR_018419) R package (Li Shen, 2017).
Imaging and isHCR quantification
Request a detailed protocolWhole embryos imaged for chromogenic ISH were mounted on slides in 80% glycerol and imaged using a Zeiss Axioplan 2 compound microscope (RRID:SCR_020918) utilizing an AxioCam 305 Color Micropublisher 5.0 RTV camera with Zeiss Zen 3.1 (blue edition; RRID:SCR_013672) software. Embryos imaged for isHCR were embedded in 1% low melting point agarose/5× SSC and imaged on a Leica SP8 confocal microscope (RRID:SCR_018169) using the PL APO CS2 40×/1.10 W objective. Whole embryos imaged for isHCR were mounted in slide dishes in 1% low melt agarose with either 5× SSC (if only isHCR was performed) or 1× PBT (if isHCR combined with immunofluorescence was performed) and imaged using a Leica SP8 confocal microscope with LASX software (RRID:SCR_013673). isHCR voxel colocalizations in Figure 2 and Figure 2—figure supplement 1 were performed using the ‘Coloc’ function in Imaris 10.0.1 (RRID:SCR_007370) at the Optical Biology Core (RRID:SCR_026614) as described in Subramanian et al., 2023. Voxel colocalization only shows overlap of fluorescent channels within a particular voxel which may not, in some instances, fully reflect actual colocalization of fluorescence within a particular cell due to the punctate nature of isHCR fluorescence. isHCR single-cell quantification was performed in Imaris 10.0.1 using DAPI (Sigma D9542; PubChem CID: 2954) as a nuclear marker, as described in Subramanian et al., 2023. Embryo imaging for a single experiment was performed with identical parameters across conditions. Briefly, an ROI of the DAPI-stained nucleus from each 3D stack was traced through individual z-slices and mean voxel-intensity (AU) was measured. matn1/Scxa co-expressing cells measured were located at the ima enthesis on Meckels cartilage and sht enthesis at the anterior edge of the ch cartilage. klf2a/Scxa and mxra5b/Scxa co-expressing cells measured were located at the ima enthesis and sht enthesis, mhj MTJ and sht MTJ. Experimental conditions pertaining to each embryo image were saved separately, measurements were performed, and conditions were matched to each image. All p-values were calculated using a linear mixed effects model with individual embryos set as the random variable, and cells set as the fixed variable using the lme4 and lmetest R packages. Tukey–Kramer post hoc tests for pairwise analyses were then performed (ns = not significant, *p < 0.05, **p < 0.01, ***p < 0.001).
Multiplex CRISPR–Cas9 genome editing of matn1, klf2a, and mxra5b
Request a detailed protocolmatn1, klf2a, and mxra5b multiplex gRNA injections were performed using the methodology described in Wu et al., 2021 using gRNA primer sequences obtained from the primer database provided. Briefly, PCR was performed with four primers (per gene) targeting coding regions with T7 and spacer sequences for template gRNA synthesis. Transcription was performed with the T7 Megashortscript kit (Invitrogen AM1354). A 500-ng/µl solution of all four gRNAs were incubated at 37°C and injected into 1-cell stage embryos at a 500-pl volume per embryo.
Data availability
We have uploaded our datasets, software code, etc. to the GEO portal. We have received the GEO accession numbers for the datasets – GSE292682 and GSE292683. All source data (quantification data) have been uploaded with the manuscript and referred to in the figure legends, respectively.
-
NCBI Gene Expression OmnibusID GSE292682. Raw reads for bulk RNAseq of FAC sorted tenocytes from 36 hpf vs. 48 hpf zebrafish embryos.
-
NCBI Gene Expression OmnibusID GSE292683. Raw reads of bulk RNAseq from FAC sorted tenocytes of 48 hpf WT vs. aBTX injected paralyzed zebrafish embryos.
References
-
Smad3 binds scleraxis and mohawk and regulates tendon matrix organizationJournal of Orthopaedic Research 31:1475–1483.https://doi.org/10.1002/jor.22382
-
Development and maintenance of tendons and ligamentsDevelopment 148:dev186916.https://doi.org/10.1242/dev.186916
-
KLF2 suppresses TGF-beta signaling in endothelium through induction of Smad7 and inhibition of AP-1Arteriosclerosis, Thrombosis, and Vascular Biology 27:532–539.https://doi.org/10.1161/01.ATV.0000256466.65450.ce
-
Blood flow mechanics in cardiovascular developmentCellular and Molecular Life Sciences 72:2545–2559.https://doi.org/10.1007/s00018-015-1885-3
-
Mechanotransduction: tuning stem cells fateJournal of Functional Biomaterials 2:67–87.https://doi.org/10.3390/jfb2020067
-
STAR: ultrafast universal RNA-seq alignerBioinformatics 29:15–21.https://doi.org/10.1093/bioinformatics/bts635
-
Mechanical regulation of musculoskeletal system developmentDevelopment 144:4271–4283.https://doi.org/10.1242/dev.151266
-
Role of physical forces in embryonic developmentSeminars in Cell & Developmental Biology 47–48:88–91.https://doi.org/10.1016/j.semcdb.2015.10.011
-
Stages of embryonic development of the zebrafishDevelopmental Dynamics 203:253–310.https://doi.org/10.1002/aja.1002030302
-
Klf2 is an essential regulator of vascular hemodynamic forces in vivoDevelopmental Cell 11:845–857.https://doi.org/10.1016/j.devcel.2006.09.006
-
Mice lacking the matrilin family of extracellular matrix proteins develop mild skeletal abnormalities and are susceptible to age-associated osteoarthritisInternational Journal of Molecular Sciences 21:666.https://doi.org/10.3390/ijms21020666
-
Functional attachment of soft tissues to bone: development, healing, and tissue engineeringAnnual Review of Biomedical Engineering 15:201–226.https://doi.org/10.1146/annurev-bioeng-071910-124656
-
Tendon cells in vivo form a three dimensional network of cell processes linked by gap junctionsJournal of Anatomy 189 ( Pt 3):593–600.
-
Enhancing and maintaining chondrogenesis of synovial fibroblasts by cartilage extracellular matrix protein matrilinsOsteoarthritis and Cartilage 16:1110–1117.https://doi.org/10.1016/j.joca.2007.12.011
-
A new mathematical model for relative quantification in real-time RT-PCRNucleic Acids Research 29:e45.https://doi.org/10.1093/nar/29.9.e45
-
Full-length RNA-seq from single cells using smart-seq2Nature Protocols 9:171–181.https://doi.org/10.1038/nprot.2014.006
-
MXRA5 is a TGF-β1-regulated human protein with anti-inflammatory and anti-fibrotic propertiesJournal of Cellular and Molecular Medicine 21:154–164.https://doi.org/10.1111/jcmm.12953
-
Hippo-Yap/Taz signalling in zebrafish regenerationNPJ Regenerative Medicine 7:9.https://doi.org/10.1038/s41536-022-00209-8
-
Matrix remodeling associated 5 expression in trunk and limb during avian developmentThe International Journal of Developmental Biology 62:335–340.https://doi.org/10.1387/ijdb.170225ac
-
Cell-extracellular matrix mechanotransduction in 3DNature Reviews. Molecular Cell Biology 24:495–516.https://doi.org/10.1038/s41580-023-00583-1
-
Mechanobiology of tendonJournal of Biomechanics 39:1563–1582.https://doi.org/10.1016/j.jbiomech.2005.05.011
-
Identification of MXRA5 as a novel biomarker in colorectal cancerOncology Letters 5:544–548.https://doi.org/10.3892/ol.2012.1038
-
BookThe Zebrafish Book. A Guide for the Laboratory Use of Zebrafish (Danio Rerio)Oregon Press.
-
A Rapid method for directed gene knockout for screening in G0 zebrafishDevelopmental Cell 46:112–125.https://doi.org/10.1016/j.devcel.2018.06.003
-
Tendon-to-bone attachment: from development to maturityBirth Defects Research. Part C, Embryo Today 102:101–112.https://doi.org/10.1002/bdrc.21056
Article and author information
Author details
Thomas F Schilling

Funding
National Science Foundation (MCB2028424)
- Thomas F Schilling
National Institutes of Health (R01 DE13828)
- Thomas F Schilling
National Institutes of Health (R01 DE30565)
- Thomas F Schilling
National Institutes of Health (R01 AR67797)
- Thomas F Schilling
National Science Foundation- Simons Center for Multiscale Cell Fate (594598)
- Pavan K Nayak
The funders had no role in study design, data collection, and interpretation, or the decision to submit the work for publication.
Acknowledgements
We would like to acknowledge Dr. Daniel Dranow for reviewing the manuscript and assistance provided for experimental design. This study was made possible in part through access to the Optical Biology Core Facility of the Developmental Biology Center, a shared resource supported by the Cancer Center Support Grant (CA-62203). This work was supported by the National Science Foundation (MCB2028424), the National Institutes of Health (R01 DE13828, R01 DE30565, and R01 AR67797 to TFS) and by a fellowship awarded to PKN from the National Science Foundation-Simons Center for Multiscale Cell Fate supported by the Simons Foundation (594598).
Ethics
This study was performed in strict accordance with the recommendations in the Guide for the Care and Use of Laboratory Animals of the National Institutes of Health. All of the animals were handled according to approved Institutional Animal Care and Use Committee (IACUC) protocols (#AUP-23-099) of the University of California Irvine. The protocol was approved by the UCI IACUC Committee and ULAR (University Laboratory Animal Welfare).
Copyright
© 2025, Nayak, Subramanian et al.
This article is distributed under the terms of the Creative Commons Attribution License, which permits unrestricted use and redistribution provided that the original author and source are credited.
Metrics
-
- 1,033
- views
-
- 135
- downloads
-
- 5
- citations
Views, downloads and citations are aggregated across all versions of this paper published by eLife.
Citations by DOI
-
- 5
- citations for umbrella DOI https://doi.org/10.7554/eLife.105802
Download links
A two-part list of links to download the article, or parts of the article, in various formats.
Downloads (link to download the article as PDF)
Open citations (links to open the citations from this article in various online reference manager services)
Cite this article (links to download the citations from this article in formats compatible with various reference manager tools)
Transcriptome profiling of tendon fibroblasts at the onset of embryonic muscle contraction reveals novel force-responsive genes
eLife 14:e105802.
https://doi.org/10.7554/eLife.105802


