Huntingtin’s spherical solenoid structure enables polyglutamine tract-dependent modulation of its structure and function
- Massachusetts General Hospital, United States
- Harvard Medical School, United States
- McMaster University, Canada
- Eidgenössische Technische Hochschule Zürich, Switzerland
- Korea Advanced Institute of Science and Technology, Republic of Korea
- Karolinska Institute, Sweden
- KTH Royal Institute of Technology, Sweden
- University of Zurich, Switzerland
Figures
Figure 1 with 1 supplement
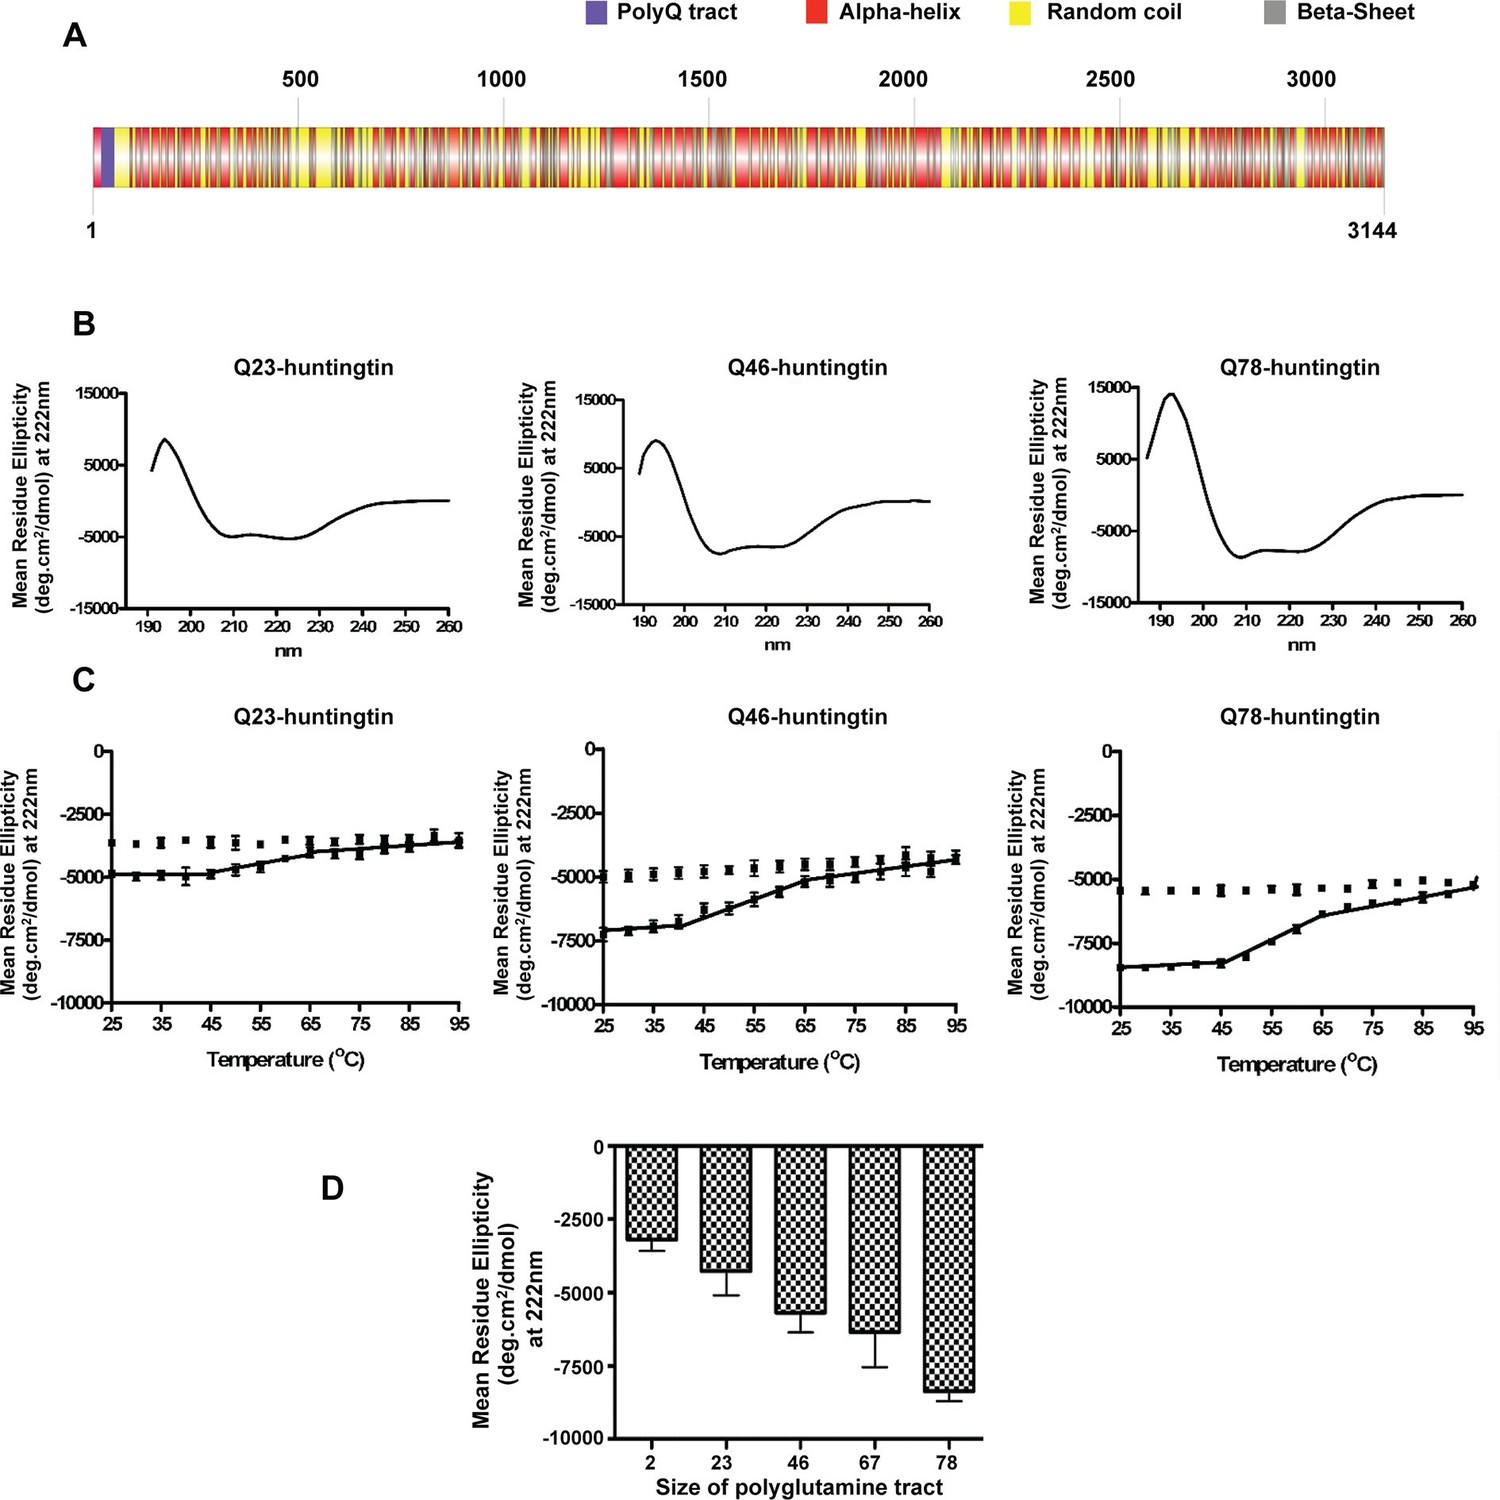
Huntingtin secondary structure is modulated by the length of polyglutamine tract.
(A) Human huntingtin amino acid sequence (Homo sapiens; NP_002102) was analyzed for predicted secondary structure using: NORSp (Liu and Rost, 2003) and PROF (Profile network prediction Heidelberg) (Rost et al.,1994). Stick model of human huntingtin protein (3144 amino acids) was generated depicting the predicted alpha helical (red), random coil (yellow) and beta sheet (grey) regions. The polyglutamine tract in the amino-terminus is indicated in purple. (B) The far UV-wavelength scan at 25°C of these purified huntingtin proteins generates a curve typical of α-helical proteins. (C) Thermal behavior of Q23-, Q46- and Q78-huntingtin. The heat denaturation curves, from 25 to 95°C, of all proteins showed the similar pattern of irreversible thermal denaturation starting their denaturation above 40°C by MRE values at 222 nm. Due to inherent variation caused by inefficient mixing in the cuvette with taking readings every five degrees of heating, their heat denaturation curves were acquired in duplicates. Solid line represents heating to 95°C; dotted line represents cooling from 95°C. (D) An average (MRE) in units of deg.cm2/dmol, at 222 nm wavelength characteristic of an α-helix), from two independent experiments, was plotted against the length of the polyglutamine tract of huntingtin proteins (bars represent mean ± SEM). Temperature was 25°C.
Figure 1—figure supplement 1
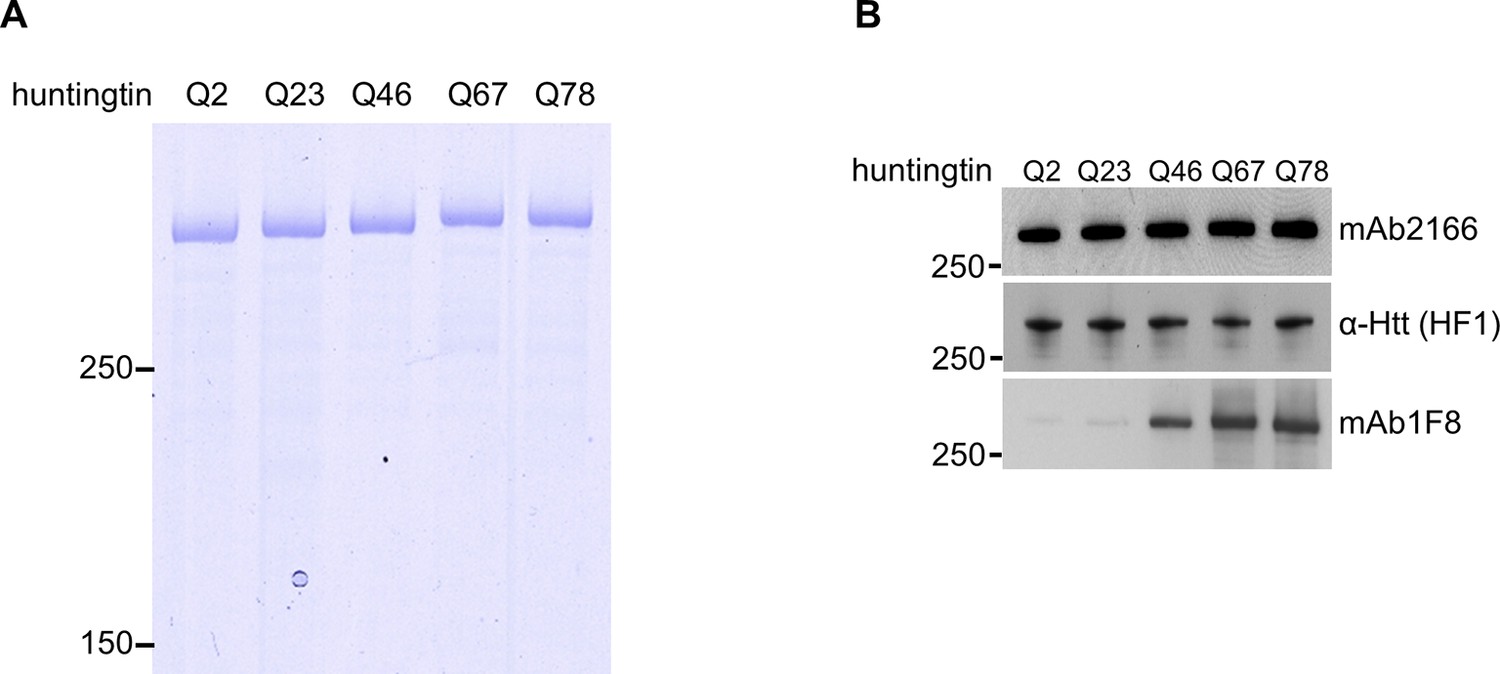
Normalization of purified huntingtin proteins with varied polyglutamine tract length.
(A) Recombinant human huntingtin proteins with indicated polyglutamine tract length were purified as described in the methods. Purity was judged by Coomassie Blue stain after SDS PAGE analysis. Equal amounts (2 μg) of the proteins were separated by SDS-PAGE followed by coomassie staining to indicate purity of the preparations. These proteins were used throughout the study. (B) Equal amount (50 ng) of indicated purified huntingtin proteins were separated by SDS-PAGE and transferred onto nitrocellulose membrane and probed with anti-Htt antibodies with amino-terminal (mAb2166) or carboxyl-terminal (HF-1) epitope to show equal loading. To demonstrate huntingtin polyglutamine repeat length, the blot was also probed with polyglutamine length-specific antibody (mAb1F8). Moreover, as expected, as the polyglutamine tract size was increased, the highly purified huntingtins exhibited decreasing mobility (A) and increasing detectability with polyglutamine-directed antibody mAb1F8 (B).
Figure 2 with 5 supplements
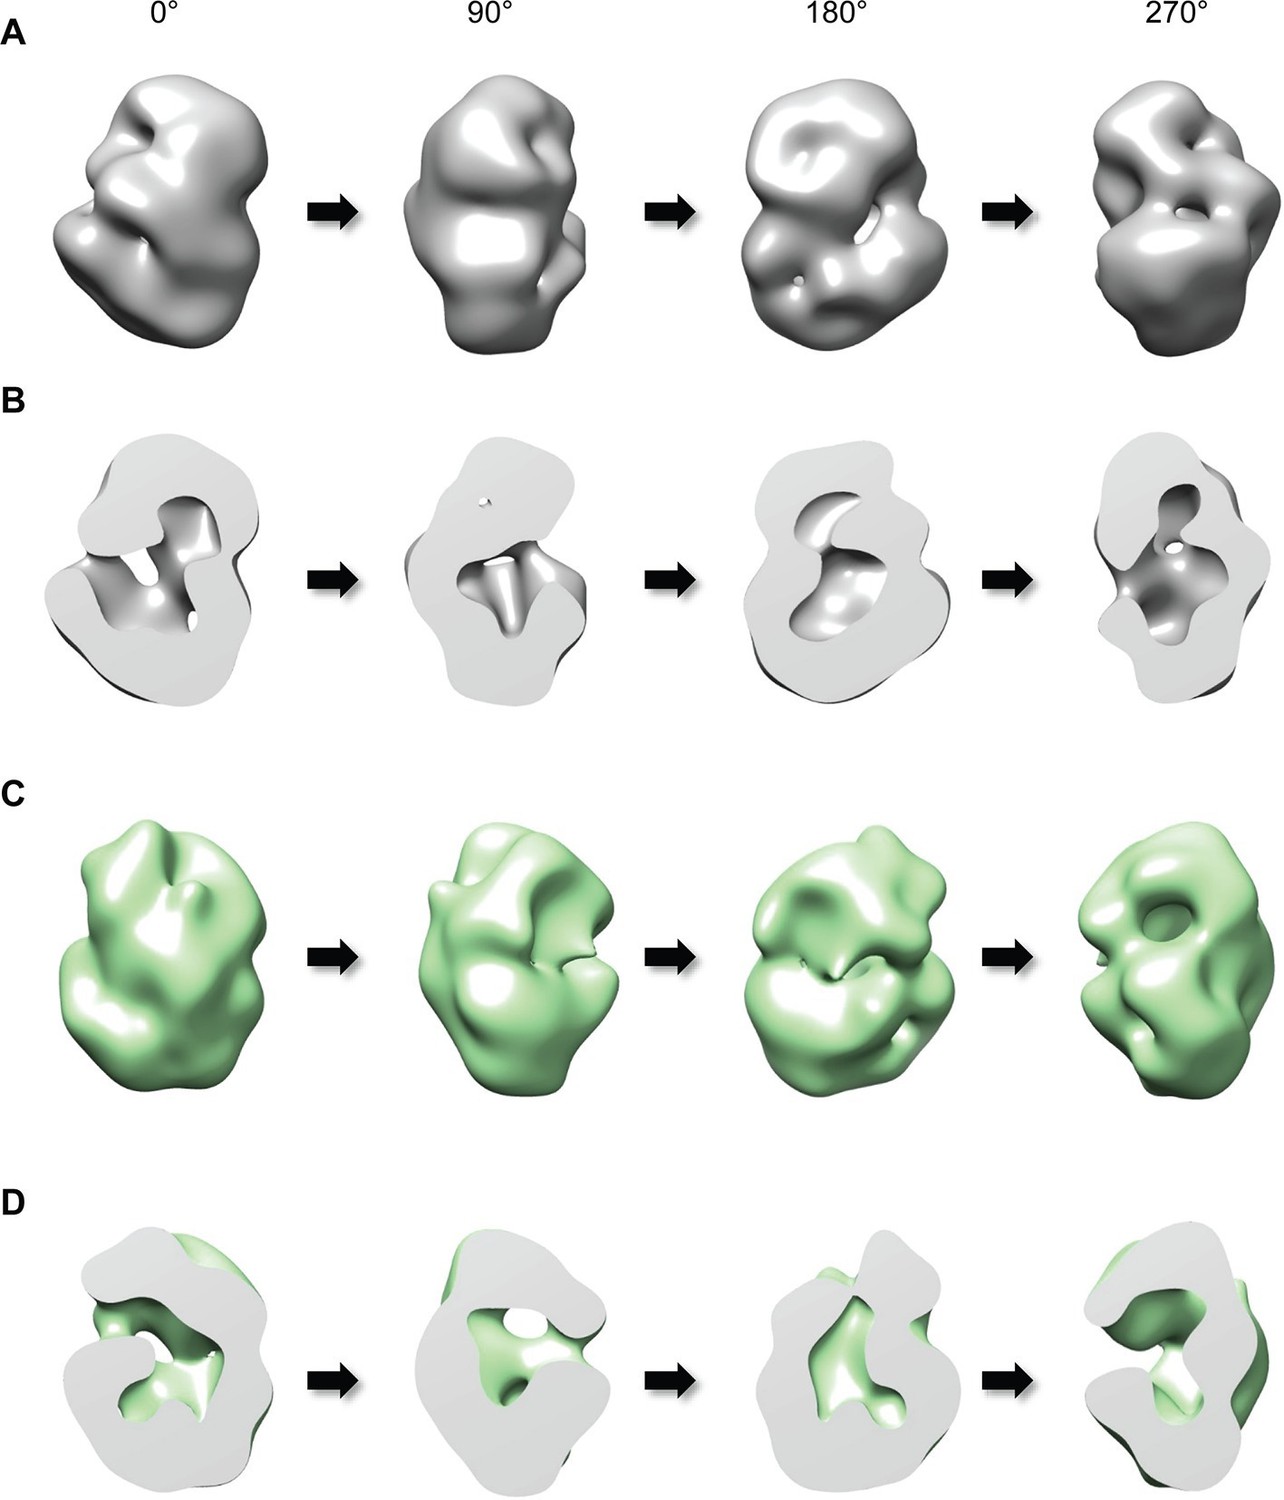
Three-dimensional reconstruction of negatively-stained Q23- and Q78-huntingtin.
(A) 3D EM map of Q23-huntingtin was reconstructed from negatively-stained particles of Q23 monomer separated by GraFix. The resolution was estimated as 33.5 Å at 0.5 FSC. 3D map of Q23-huntingtin is shown in different orientation rotated about the y axis (0°, 90°, 180°, 270°). (B) Sectioned view of 3D EM map of Q23-huntingtin in the same orientation as in A revealing a large cavity inside of Q23-huntingtin. (C) 3D EM map of Q78-huntingin (32.0 Å at 0.5 FSC) was reconstructed as for Q23-huntingtin and shown in different angles rotated about the y axis (0°, 90°, 180°, 270°). (D) Sectioned view of 3D EM map of Q78-huntingtin in the same orientation as in C also showing a large cavity inside of Q78-huntingtin. This figure has additional supplement files: Figure supplement 1, 2, 3, 4, and 5
Figure 2—figure supplement 1

Purification of huntingtin by GraFix.
(A) The blue native gel (4–16%) show that Q23-huntingtin was separated by a 5–20% sucrose gradient ultracentrifugation in the presence of glutaraldehyde gradient. M: marker, Inp: input, 2–9: fractions from the bottom of the tube after ultracentrifugation. (B) Q78-huntingtin was separated and prepared in the same way as Q23-huntingtin.
Figure 2—figure supplement 2

Negatively-stained micrographs of huntingtin at 50,000X magnification.
(A) 2% Uranyl acetate-stained micrograph of Q23-huntingtin without GraFix. (B, C) 2% Uranyl acetate-stained micrograph of Q23-, and Q78-huntingtin after separation by GraFix. Most of the particles exhibit a globular shape and existed as monomer in electron micrographs, which reflects the homogeneity of huntingtin protein.
Figure 2—figure supplement 3

2D Class averages of Q23- and Q78-huntingtin.
Reference-free class averages were computed by EMAN2. From about 80 initial class averages, 30, 30, 27, and 28 representative classes were selected from four data sets. Each class contains information from 30 to 150 particles. (A, B) 2D class averages from the data set of monomeric Q23-, and Q78-huntingtin separated by GraFix in the presence of 0–0.2% glutaldehyde. (C) 2D class averages from the data set of monomeric Q23-huntingtin separated by Grafix in the absence of glutaldehyde show similar shapes with 2D class averages shown in A indicating that the fixation reagent did not cause substantial structural change. (D) 2D class averages from the data set of monomeric Q23-huntingtin without tag separated by GraFix in the presence of 0–0.2% glutaldehyde showing that the tag did not cause substantial structural alteration.
Figure 2—figure supplement 4
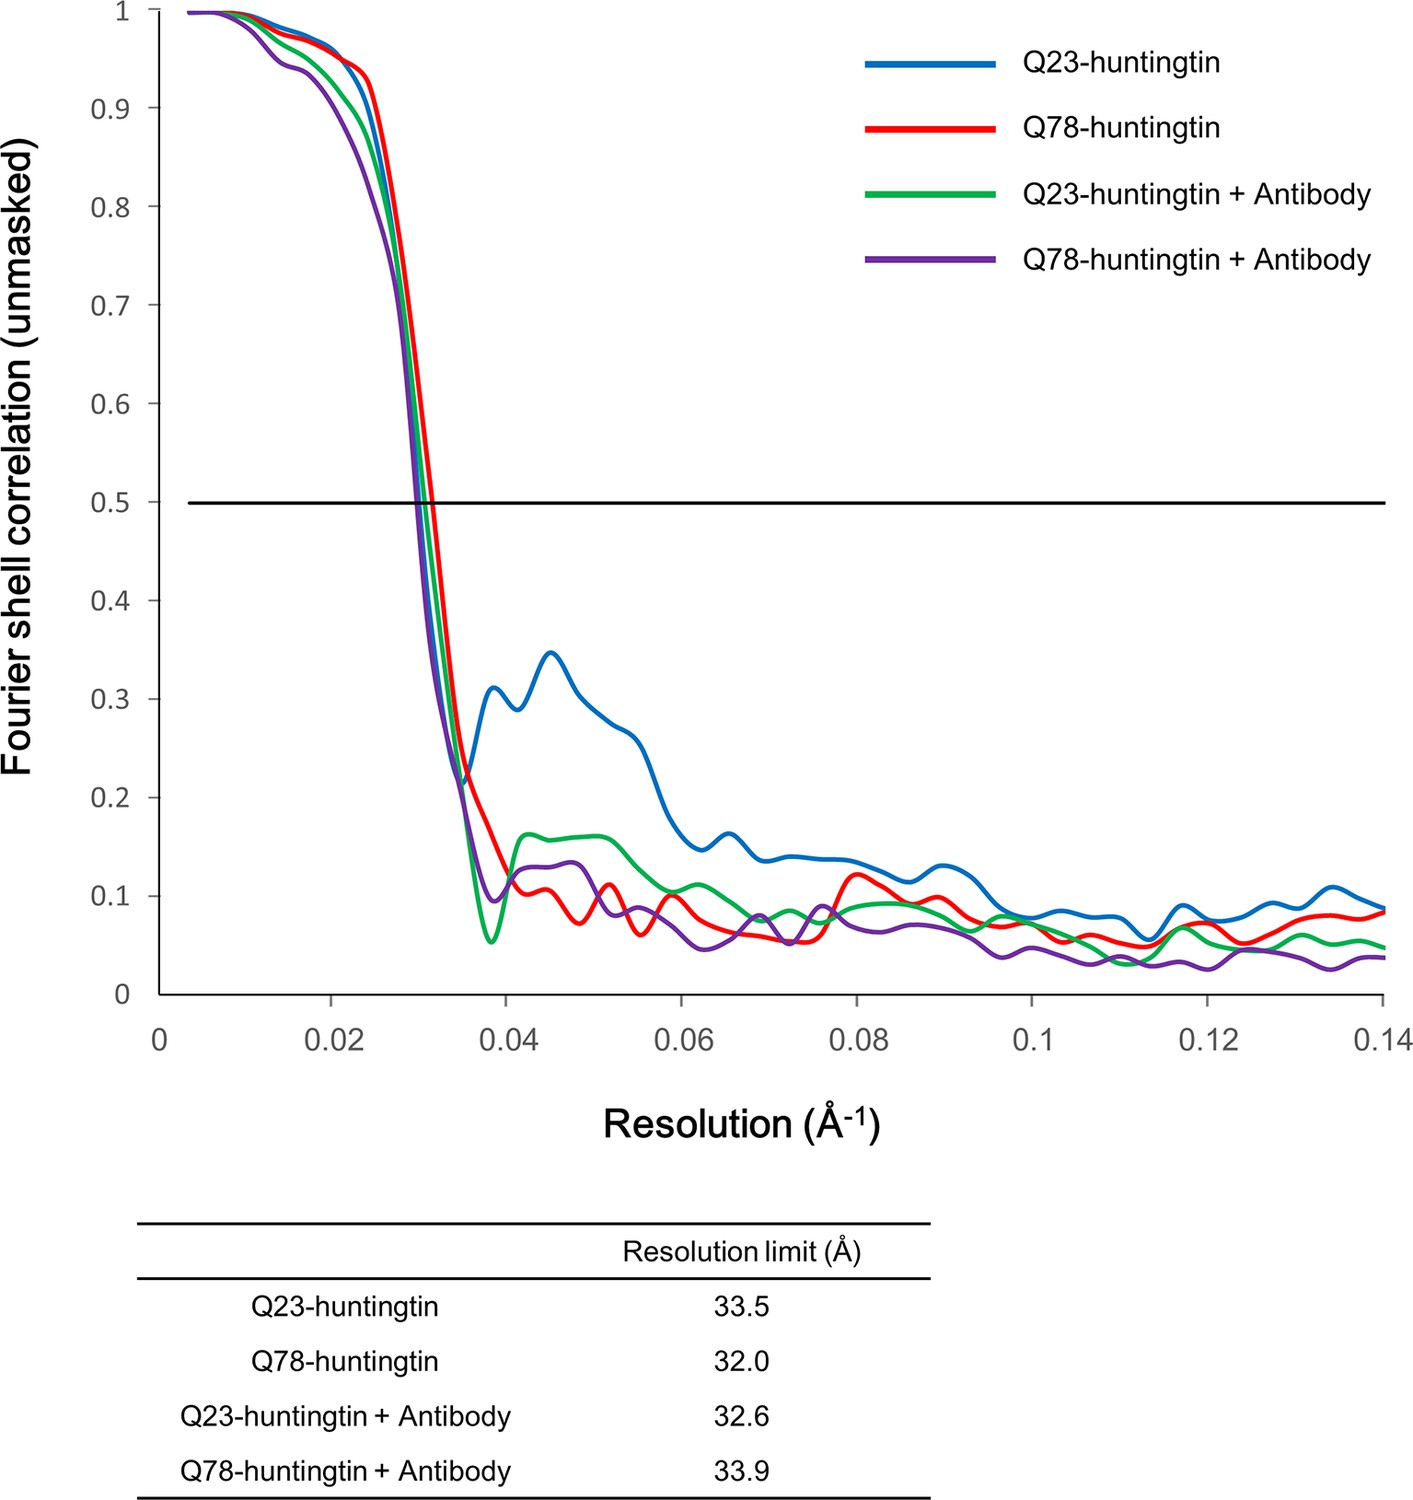
Fourier Shell Correlation (FSC) curves.
Gold standard FSC was calculated with the EMAN2 refinement of half data subset (even/odd test). Even/odd maps were refined totally independently (blue for Q23-huntingtin, red for Q78-huntingtin, green for Q23-huntingtin antibody complex and purple for Q78-huntingtin antibody complex). The estimated resolutions at FSC=0.5 cut-off are shown in the table below the graph.
Figure 2—figure supplement 5
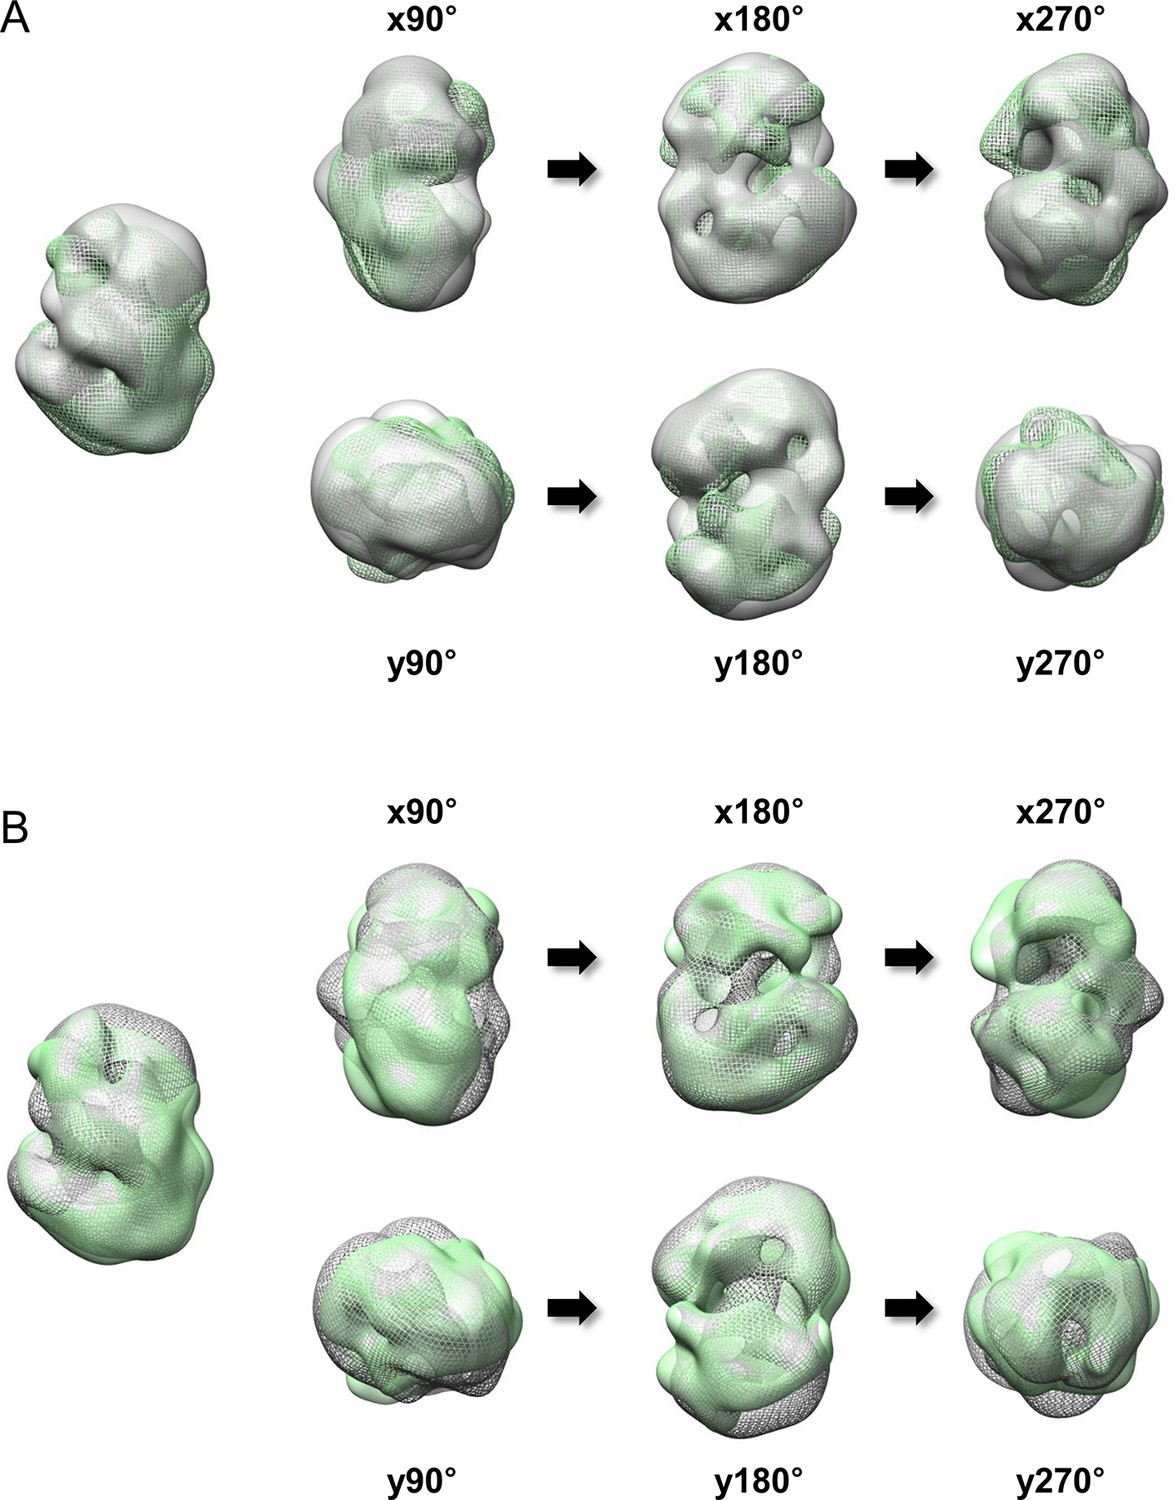
Superimposition between 3D EM maps of Q23 and Q78-huntingtin.
3D EM maps from Q23- and Q78-huntingtin were loaded and compared in UCSF Chimera program (contour level was 1.2). (A) Superimposition between Q23-huntingtin (shown in ivory surface) and Q78-huntingtin (shown in green mesh) in different angles rotated about the x- and y- axes. (B) Superimposition between Q23-huntingtin (shown in ivory mesh) and Q78-huntingtin (shown in green surface) in same angles as shown above.
Figure 3 with 2 supplements
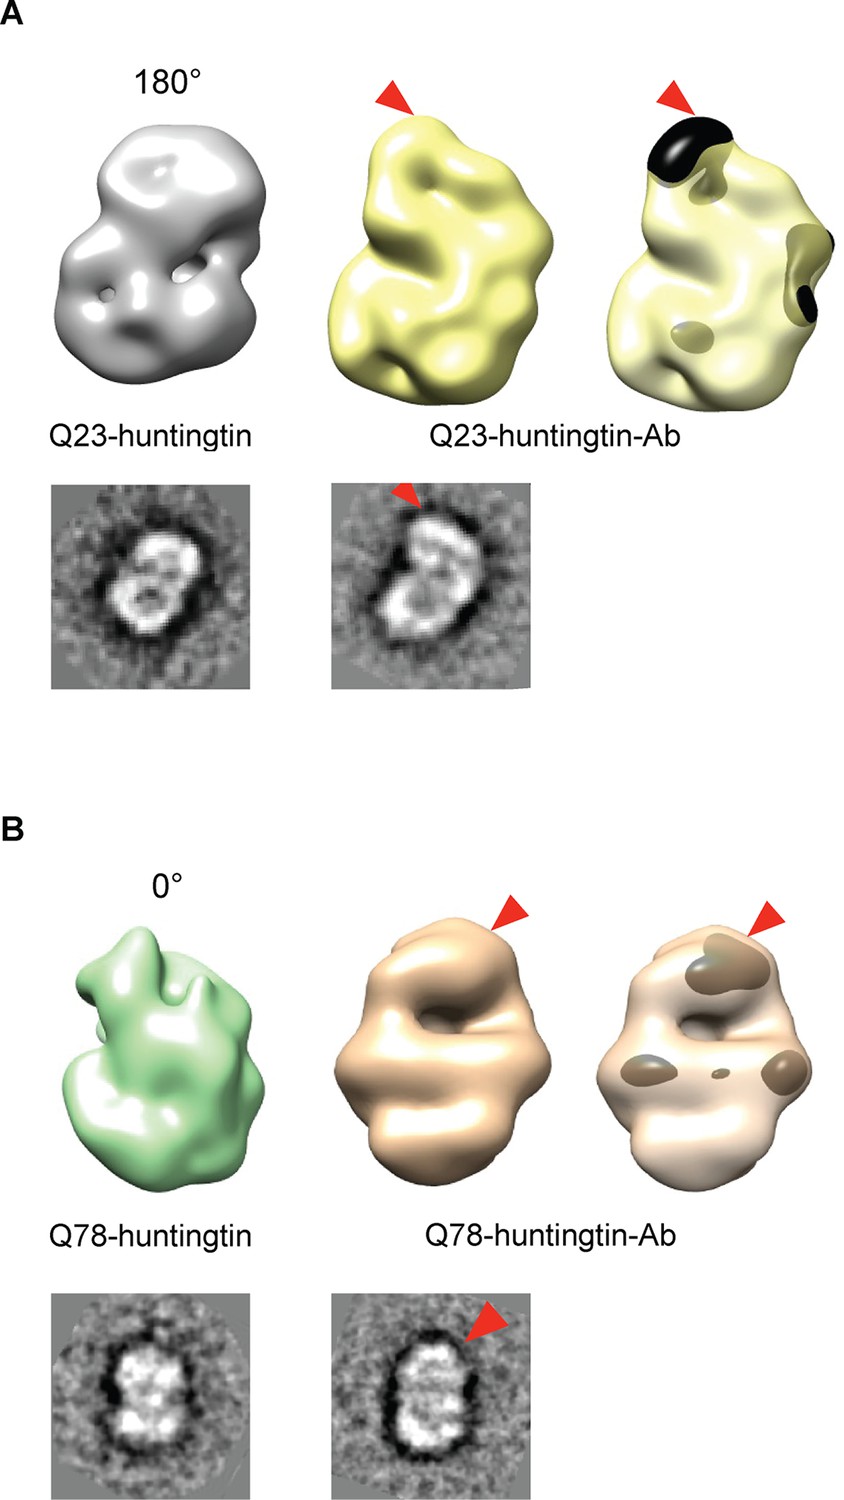
Detection of the amino-terminus region of huntingtin by electron microscopy.
3D reconstitutions of Q23-huntingtin and Q23-huntingtin antibody complex (A) or Q78-huntingtin and Q78-huntingtin antibody complex (B) are shown in gray and yellow or in green and brown, respectively. 2D class averages corresponding to each huntingtin and its antibody complex are shown below the 3D reconstituted EM map and the extra density is marked with a red triangle. The extra-density indicating antibody on 3D EM map is colored in black (A) or dark brown (B) with red triangles.
Figure 3—figure supplement 1

Producing huntingtin-FLAG-Aantibody complex.
Q78-huntingtin was incubated with two-fold molar ratio of anti-FLAG antibody for 16 hr at 4°C. The blue native gel (4–16%) shows separation and location of huntingtin alone (Q78) and huntingtin-FLAG-antibody complex (Q78+Ab). Q23-huntingtin-FLAG-antibody complex was also prepared in the same conditions for the subsequent EM analysis (data not shown).
Figure 3—figure supplement 2
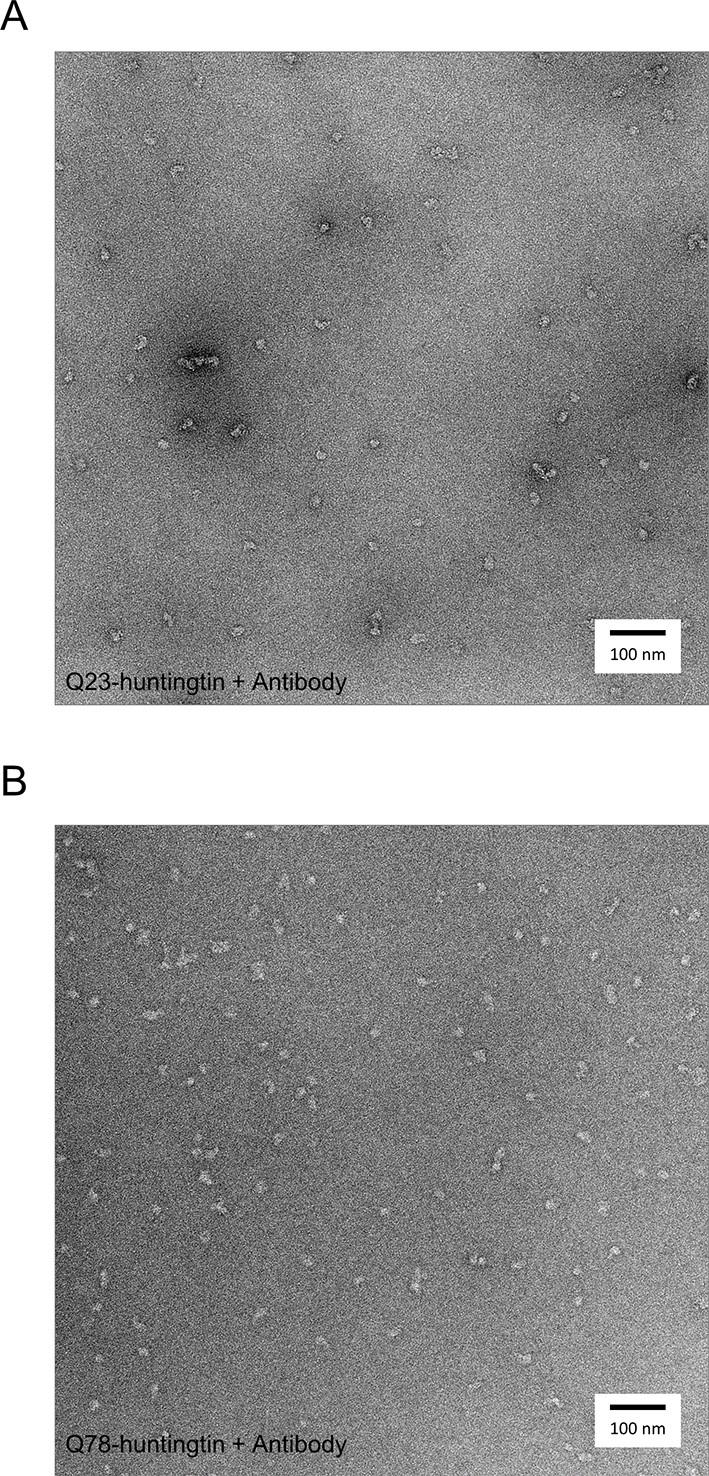
Negatively-stained micrographs of huntingtin-antibody complexes at 50,000X magnification.
2% uranyl acetate stained micrograph of Q23- (A), and Q78 (B)-huntingtin complexes with FLAG antibodies.
Figure 4 with 1 supplement
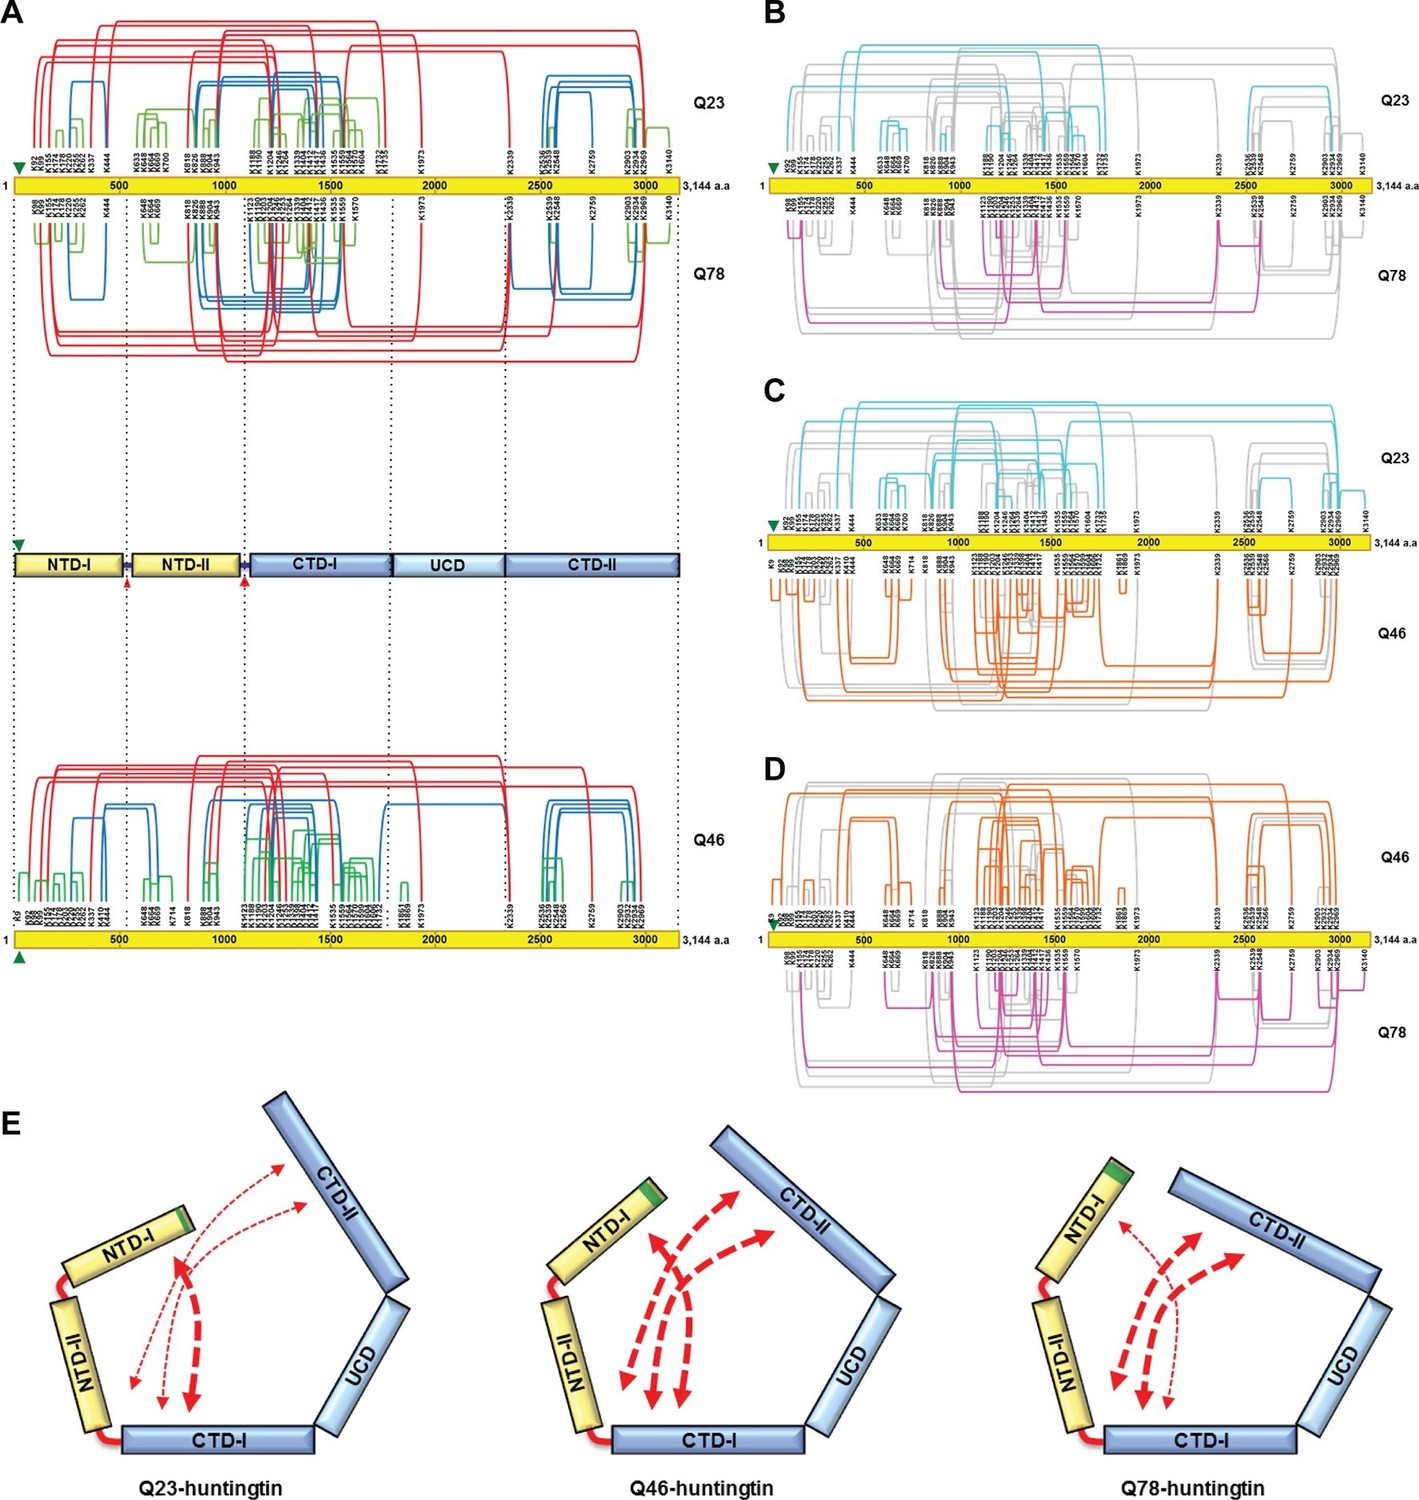
Cross-linking mass spectrometry analysis shows the intra-molecular interactions of Q23-, Q78- and Q46-huntingtin.
The 3,144 amino acid primary huntingtin sequence (by convention Q23-huntingtin) is depicted as a yellow bar with the location of the polyglutamine tract indicated by the green arrowhead (A). The short-, mid- and long-range Lys-Lys cross-links by DSS identified in Q23-huntingtin (above the bar, Q23) and Q78-huntingtin (below the bar, Q78) by XL-MS are depicted by the green, blue and red-colored lines, respectively. Below that is a schematic view of huntingtin with five sub-domains delineated by the shared patterns of intra-molecular interactions; two amino-terminal (NTD-I, NTD-II) and three carboxyl-terminal (CTD-I, UCD and CTD-II), as defined relative to the landmark major protease-sensitive site at ~ residue 1200 identified previously (Seong et al., 2010), which is denoted by the large red arrowhead, while the secondary minor cleavage site is denoted by the small red arrowhead. The cross-links of Q46 huntingtin (Q46) identified in XL-MS analysis are also shown under the five sub-domains schematic. Lys-Lys cross-links by DSS unique to Q23-huntingtin, Q78-huntingtin and Q46-huntingtin are shown in cyan, pink, and orange, respectively in each pair-wise comparison of Q23 vs Q78 (B), Q23 vs Q46 (C) or Q46 vs Q78 (D). The amino-terminal (yellow) and carboxyl-terminal (blue) sub-domains are depicted in cartoons (E) to show more substantial interactions (red thicker dashed arrows) between NTD-I and CTD-I in Q23-huntingtin (left) and between CTD-II and NTD-II or CTD-I in Q78-huntingtin (right) and throughout both amino- and carboxyl-terminal sub-domains in Q46-huntingtin (middle). In all three huntingtins (all red dashed arrows), NTD-I folds to contact CTD-I and CTD-II also contacts CTD-I as well as NTD-II, implying that the physical impact of the polyglutamine tract at the very amino-terminal end has the opportunity to subtly but globally alter the entire huntingtin structure and function in a polyglutamine length-dependent manner.
Figure 4—figure supplement 1
Purification of huntingtin by ultracentrifugation after DSS cross-linking.
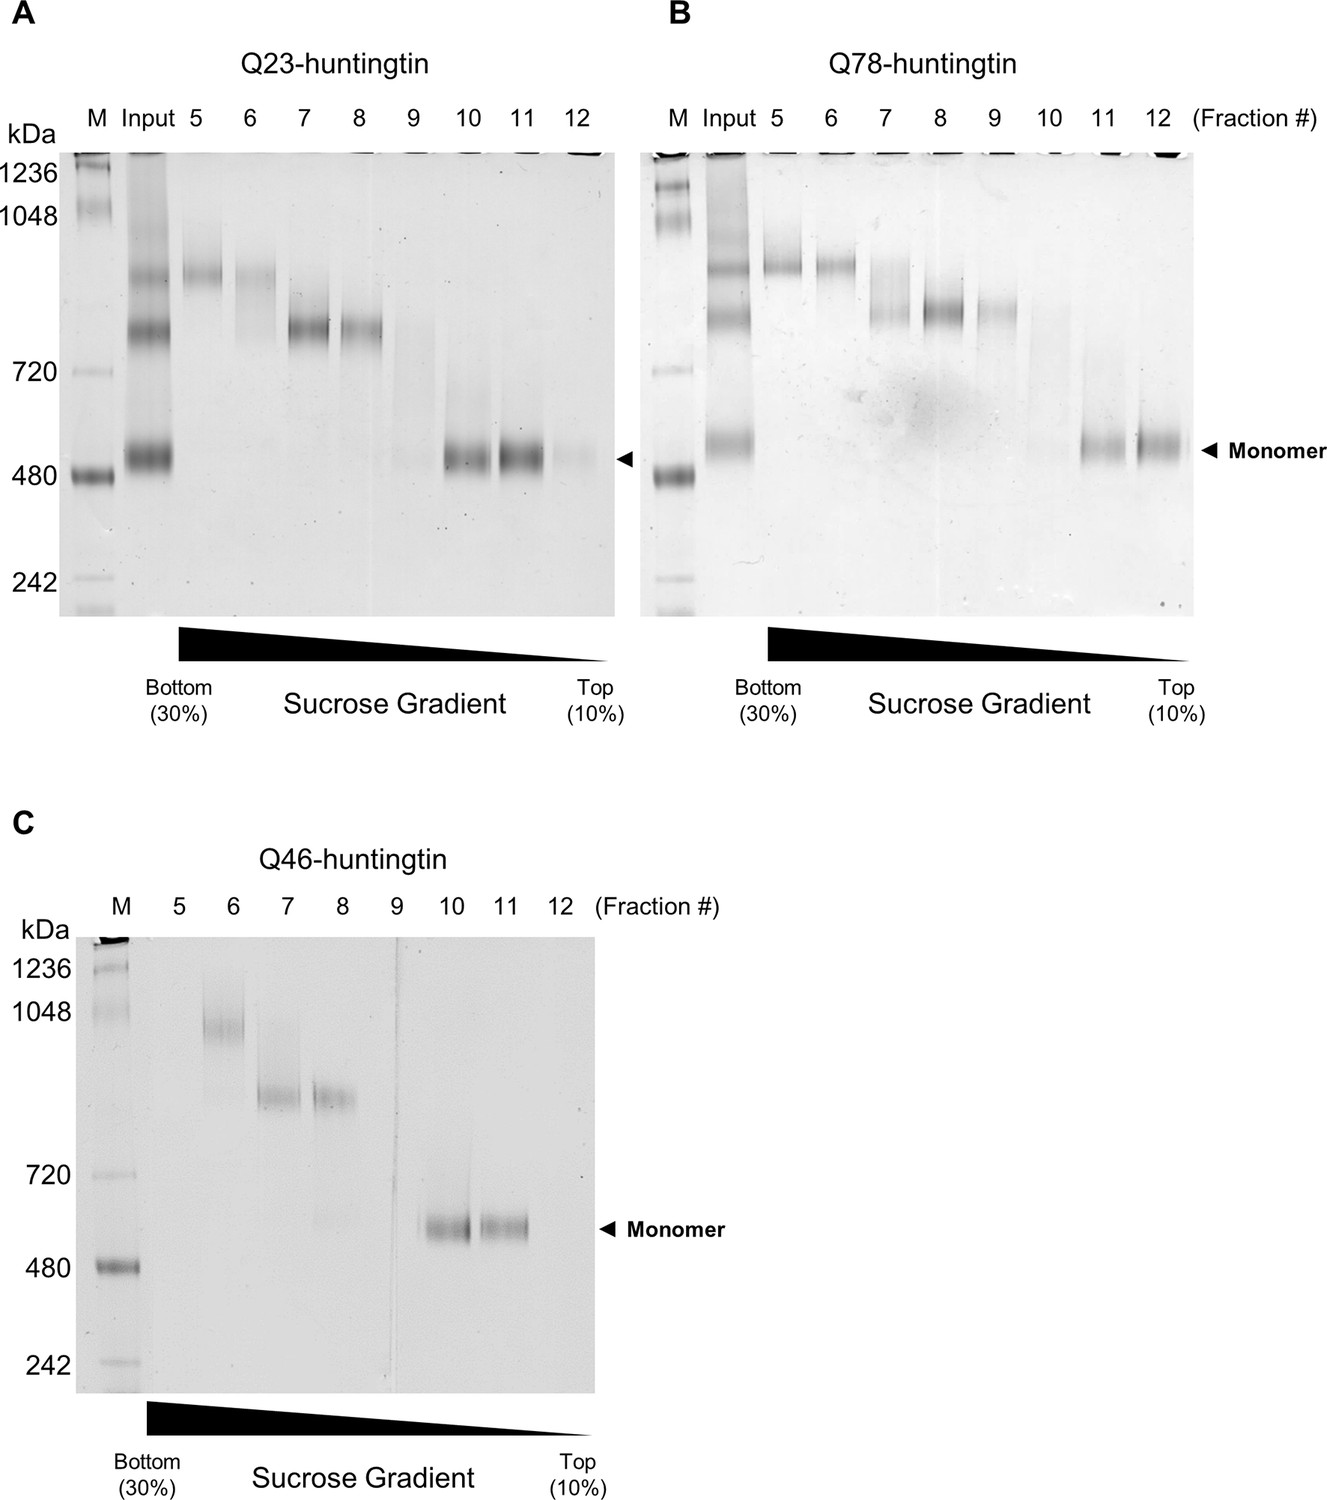
(A) Q23-huntingtin was separated by 10–30% sucrose gradient ultracentrifugation after DSS crosslinking. Fractions 5–12 were analyzed on a Tris-Acetate gel (3–8%) with Tris-Glycine native running buffer (M: marker, input: Q23-huntingtin before ultracentrifugation. Q78-huntingtin (B) or Q46-huntingtin (C) was separated and prepared in the same way as Q23-huntingtin. Notably, we found that the glutaraldehyde crosslinked huntingtin and DSS crosslinked huntingtin behave differently. We achieved a better separation with a 10–30% sucrose gradient for the DSS crosslinked huntingtin, but with a 5–20% sucrose gradient for the glutaraldehyde crosslinked huntingtin in Figure 2—figure supplement 1.
Additional files
-
Supplementary file 1
The list of DSS modified peptides of human Q23- (A), Q46- (B) and Q78- (C) huntingtin identified in XL-MS.
Huntingtin amino acid sequences of crosslinked peptides indicating the relative position of the linked lysines; Position1, Position2, absolute amino acid position of linked lysines.
- https://doi.org/10.7554/eLife.11184.016
Download links
A two-part list of links to download the article, or parts of the article, in various formats.
Downloads (link to download the article as PDF)
Open citations (links to open the citations from this article in various online reference manager services)
Cite this article (links to download the citations from this article in formats compatible with various reference manager tools)
Huntingtin’s spherical solenoid structure enables polyglutamine tract-dependent modulation of its structure and function
eLife 5:e11184.
https://doi.org/10.7554/eLife.11184


