Comparative analysis of viral RNA signatures on different RIG-I-like receptors
- Institut Pasteur, CNRS UMR-3569, France
- Université Paris Diderot - Paris 7, France
- Institut Pasteur, France
- Institut de Recherche Biomédicale des Armées, France
- University of Reunion Island, France
Figures
Figure 1
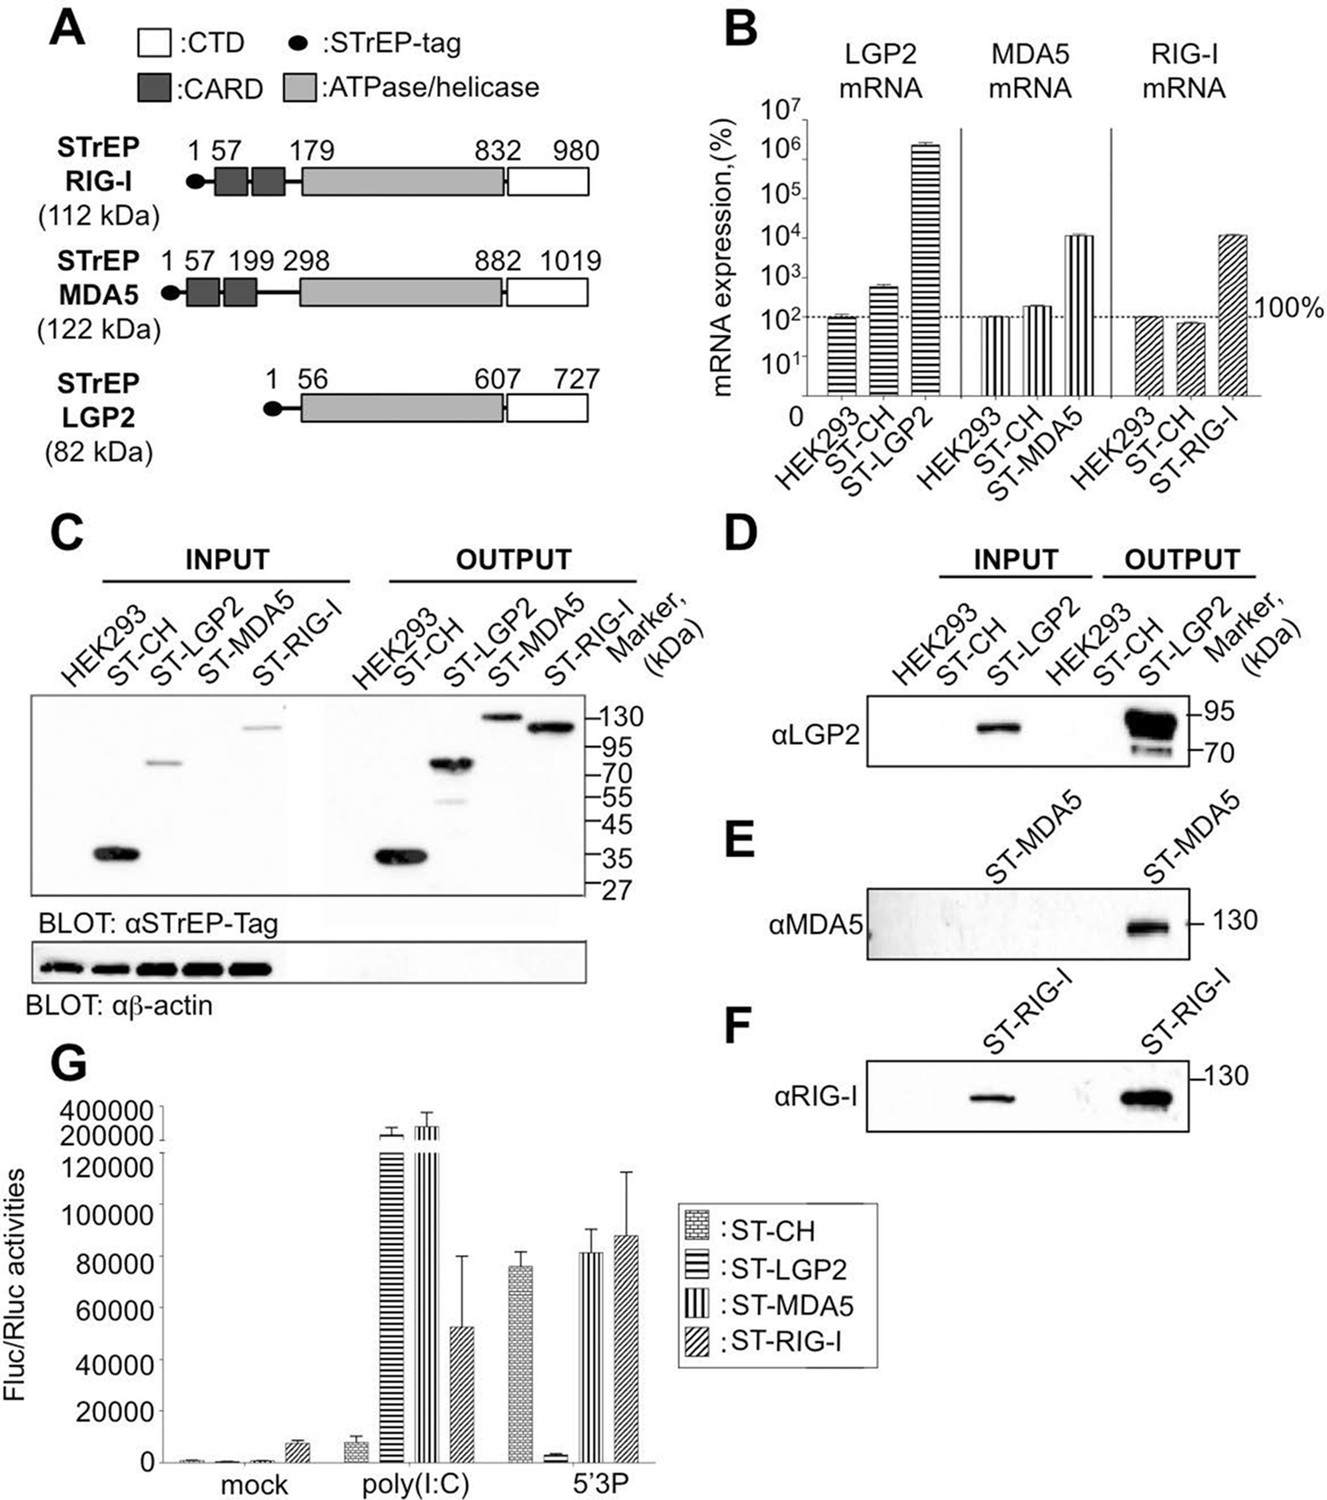
Rig-I Like Receptor (RLR) gene expression in stable cell lines encompassing ST-RLRs.
(A) Schematic representation of the protein domains for each RLR. Domain boundaries are indicated for human RIG-I, MDA5, and LGP2 proteins according to interpro (www.ebi.ac.uk/interpro). (B) LGP2, MDA5 and RIG-I mRNA levels in ST-RLR cells. RLR mRNA expression were calculated by relative RT-qPCR using specific probes for LGP2, MDA5 or RIG-I (on 100 ng of total RNA). Ct were normalized using a specific probe against GAPDH house keeping gene. Percentage of mRNA expression was done by setting HEK293 cells as 100% of gene expression for each probe. Samples were analyzed in triplicates with standard deviation represented on the figure. (C–F) Analysis of RLR protein expression in ST-RLR cells and efficiency of tagged RLR purification by affinity chromatography. ST-RLR cell lysates (INPUT) were affinity-purified using STrEP-Tactin beads (OUTPUT). Western blot analysis was performed using (C) α-STrEP-Tag, (D) anti-LGP2, (E) anti-MDA5 or (F) anti-RIG-I antibodies. (G) IFNβ promoter activity assay in ST-RLR cells. Cells were transfected with pIFNβ-FLuc, pTK-Rluc and either mock, poly(I:C) or 5’3P.
Figure 2
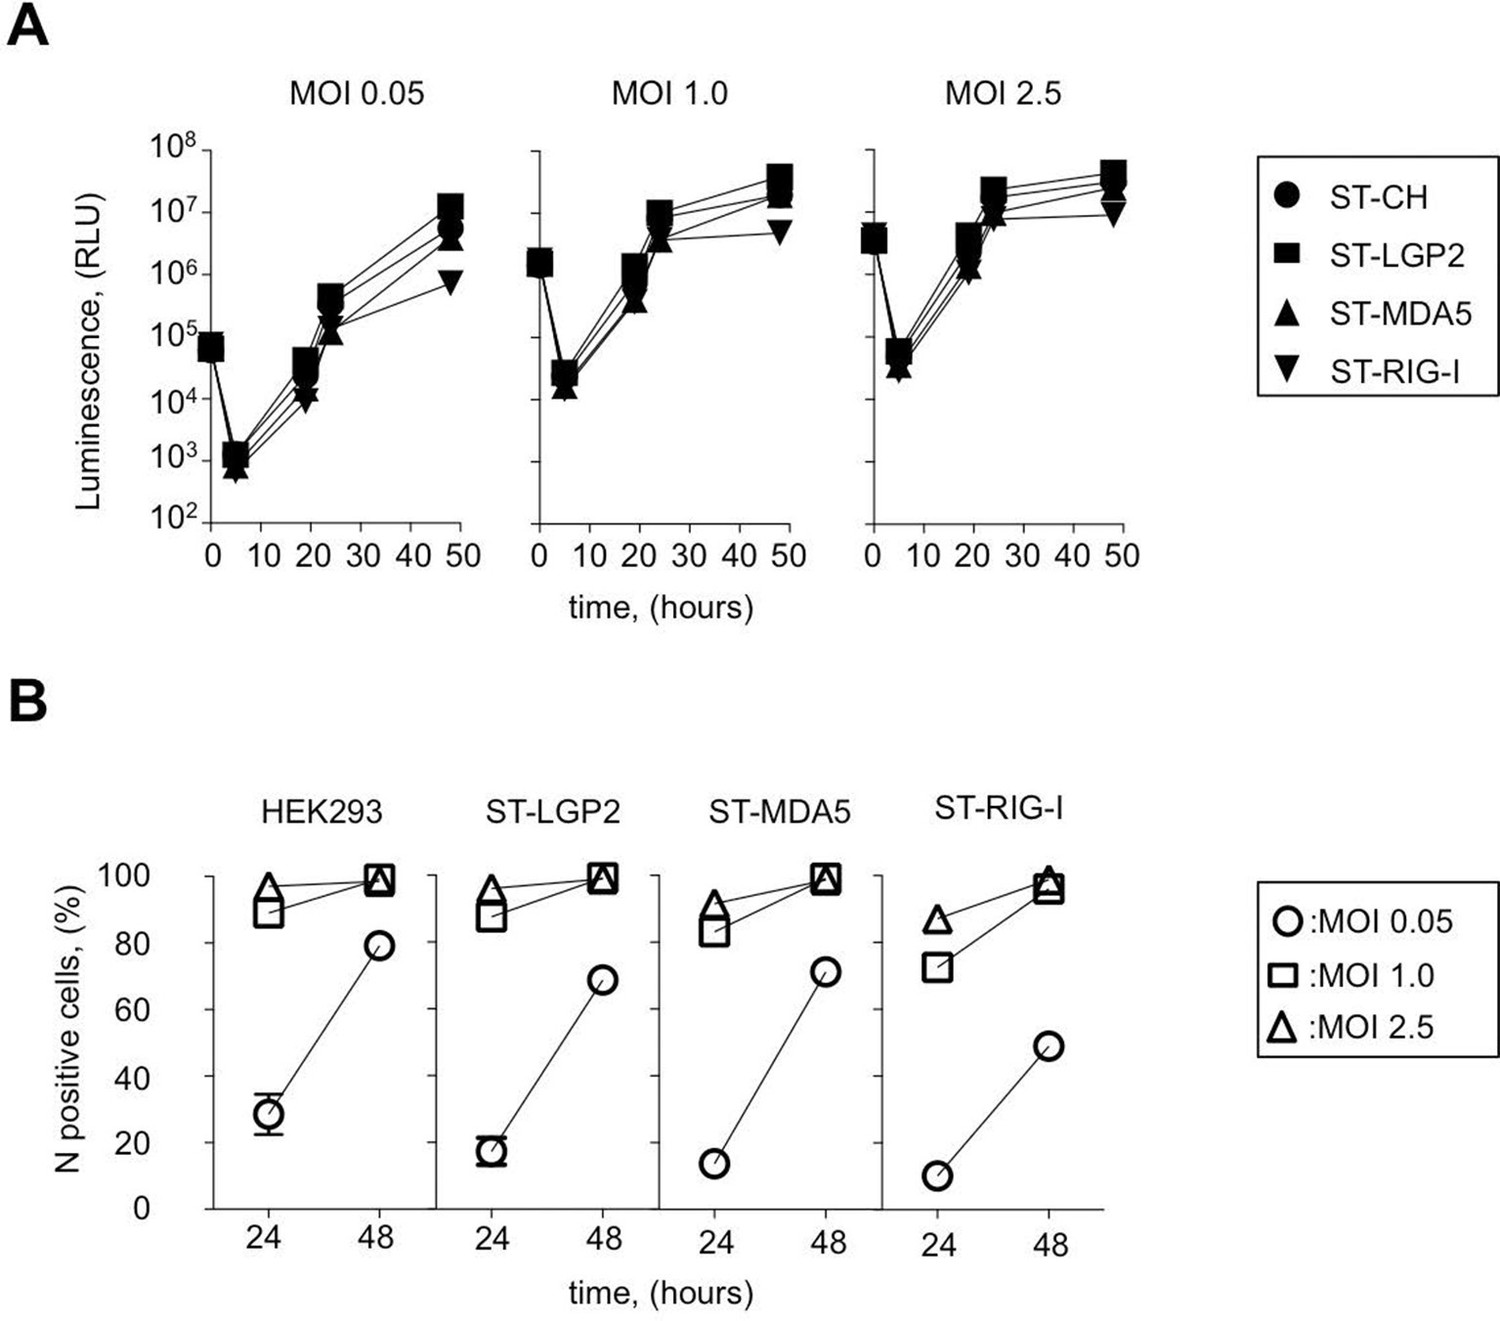
Efficiency of ST-RLR cells infection by negative-sense RNA virus (MV).
(A) Efficiency of Fluc (rMV2/Fluc) expressing MV replication in ST-RLR cells. ST-RLR cells were infected with the rMV2/Fluc (MOIs: 0.05, 1, 2.5). Luc activity was analyzed 5, 19, 24 and 48 hr post-infection. (B) Efficiency of MV replication in ST-RLR analyzed by FACS. ST-RLR cells were infected by MV. After 24 and 48 hr, cells were harvested, fixed and stained using an anti-N antibody to measure percentage of N positive cells. Experiments were performed two times and data represent means ± SD of the technical triplicates of the most representative experiment.
Figure 3 with 1 supplement
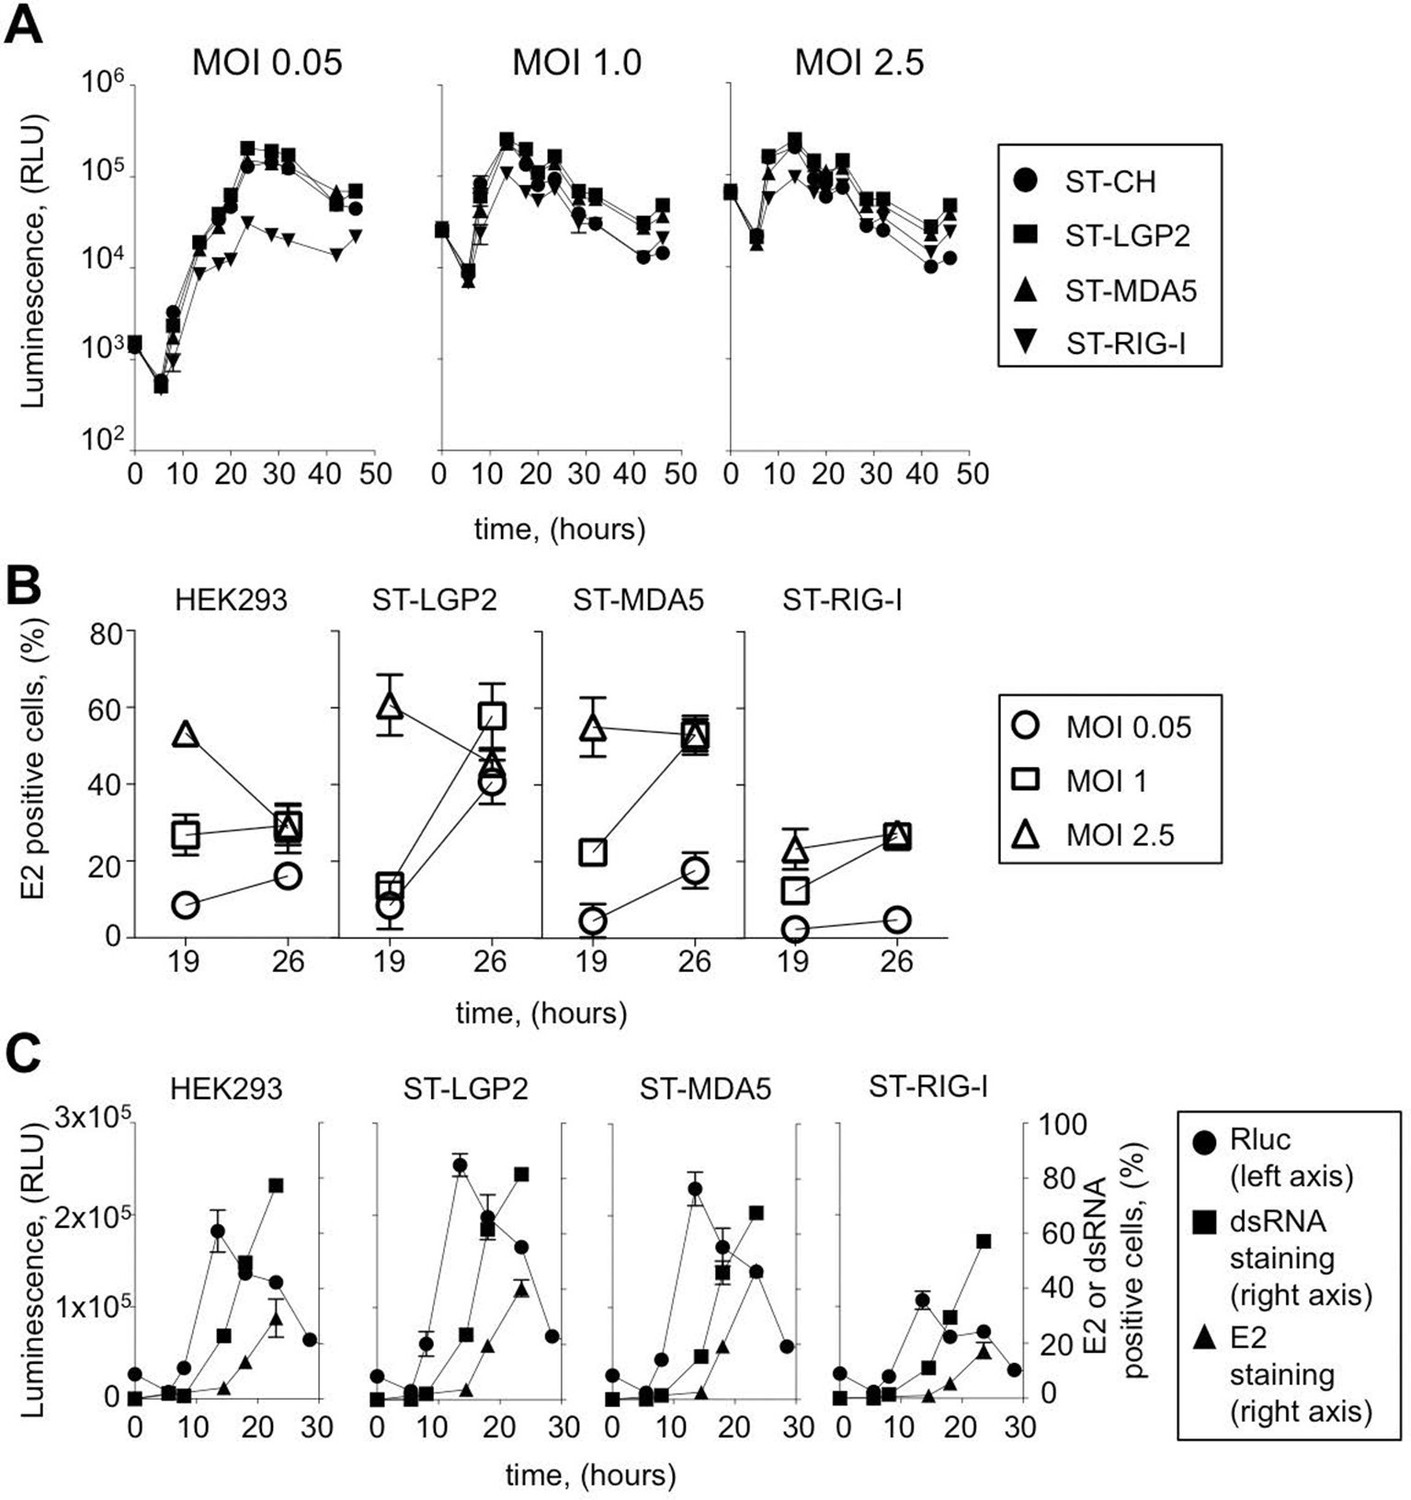
Efficiency of ST-RLR cells infection by positive-sense RNA viruses (CHIKV).
(A) Replication efficiency of CHIKV-Rluc in ST-RLR cells. ST-RLR cells were infected with a CHIKV-Rluc (MOIs: 0.05, 1, 2.5). renLuc activity was analyzed 0, 5, 8, 10, 13, 19, 24, 32 and 40 hr post-infection. (B) Efficiency of CHIKV replication in ST-RLR cells analysed by FACS. ST-RLR cells were infected with wt CHIKV (MOIs: 0.05, 1, 2.5). Immunostaining of the E2 glycoprotein was performed and percentage of positive cells was determined. (C) Analysis of early and late steps of CHIKV replication. ST-RLR cells were infected with CHIKV-Rluc or wt CHIKV at an MOI 1. Rluc activity was measured for the CHIKV-Rluc infection (left axis) 6, 9, 15, 18, 23 and 28 hr post-infection. wt CHIKV-infected cells were harvested 6, 9, 15, 18 and 23 hr post-infection, stained with an antibody recognizing double stranded RNA or E2 (right axis) and percentage of positive stained cells was determined by FACS. Experiments were performed two times and data represent means ± SD of the technical triplicates of the most representative experiment.
Figure 3—figure supplement 1
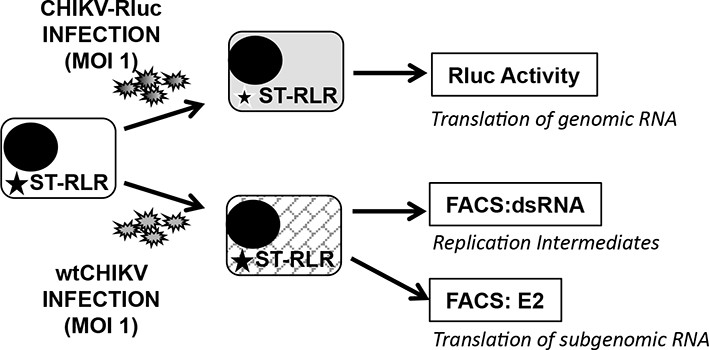
Experimental approaches used to determine early and late steps of CHIKV replication.
ST-RLR cells were infected with CHIKV-Rluc or wt CHIKV at an MOI of 1. Rluc activity was measured for the CHIKV-Rluc infection. wt CHIKV-infected cells were harvested stained with an antibody recognizing double stranded RNA or E2 and percentage of positive stained cells was determined by FACS.
Figure 4
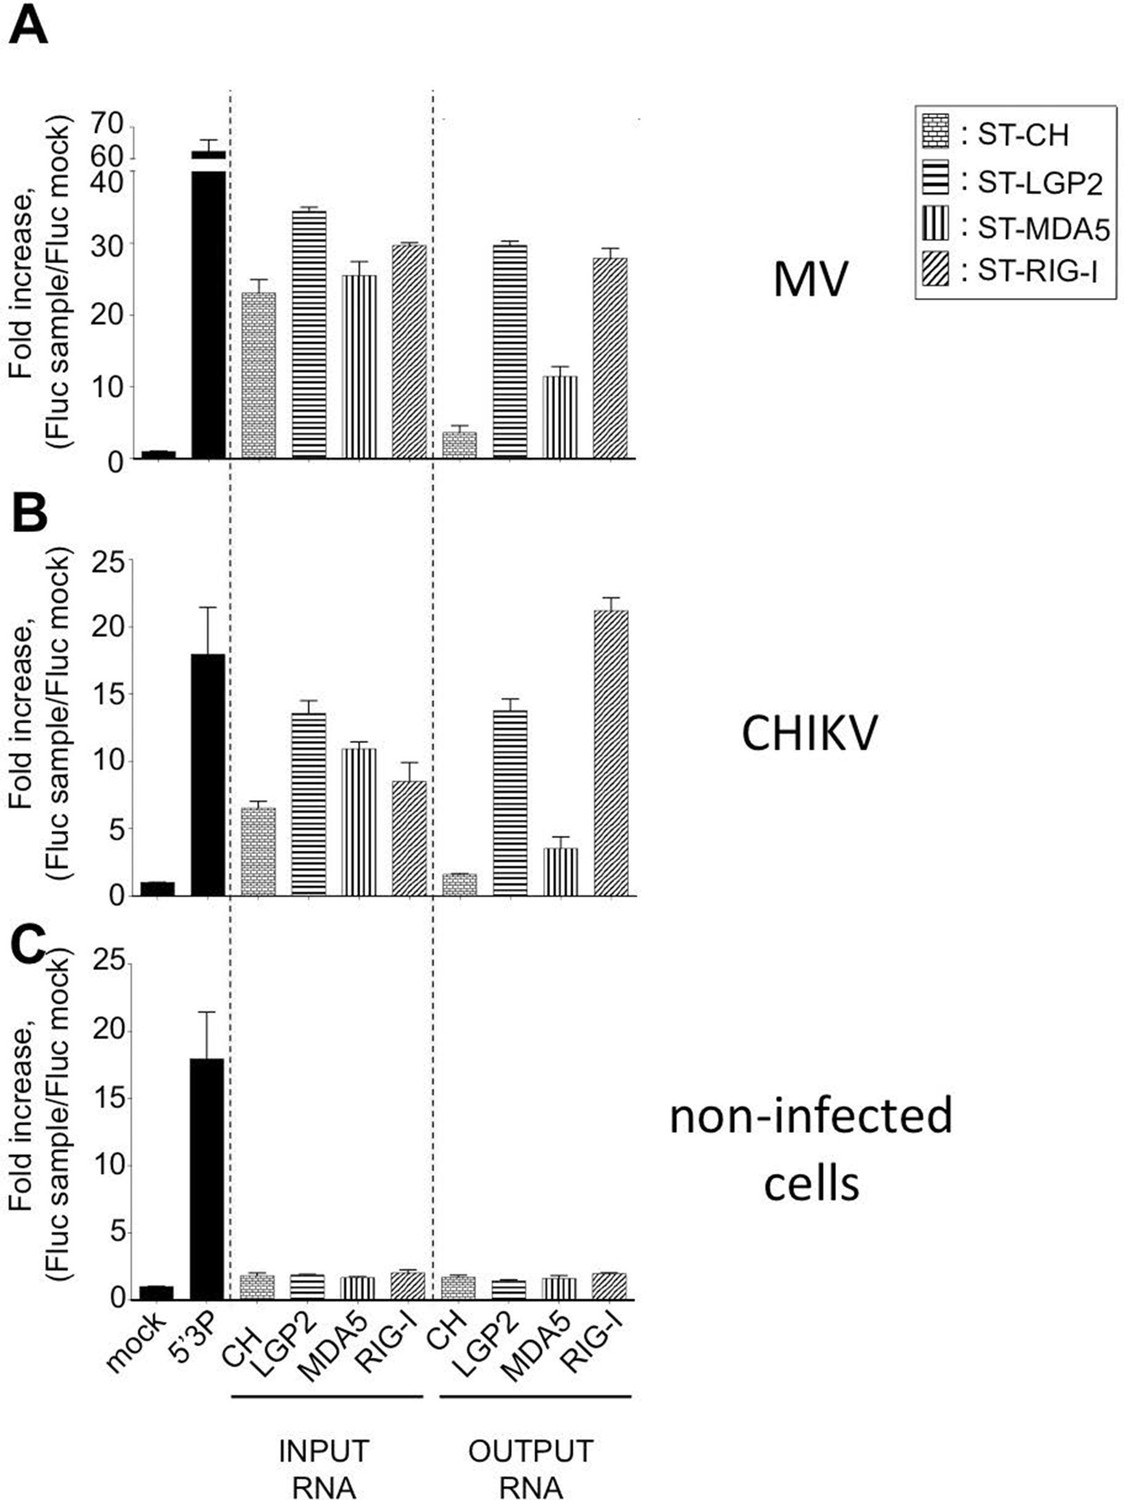
Immunostimulatory activity of RNA-ligands co-purified with ST-RLRs upon infection with MV and CHIKV.
ST-RLR cells were infected with MV for 24 hr (A), CHIKV for 13 hr (B) or mock infected (C). Total cell lysate was used for total RNA purification (INPUT) and for affinity purification of RLR RNA complexes, followed by RNA extraction (OUTPUT). Immunostimulatory activity was assessed by transfection into STING-37 reporter cell lines (Lucas-Hourani et al., 2013). Fluc activity was measured and normalised to mock transfected cells, 5’3P was used as a positive control. Experiments were performed two times and data represent means ± SD of the technical triplicates of the most representative experiment.
Figure 5
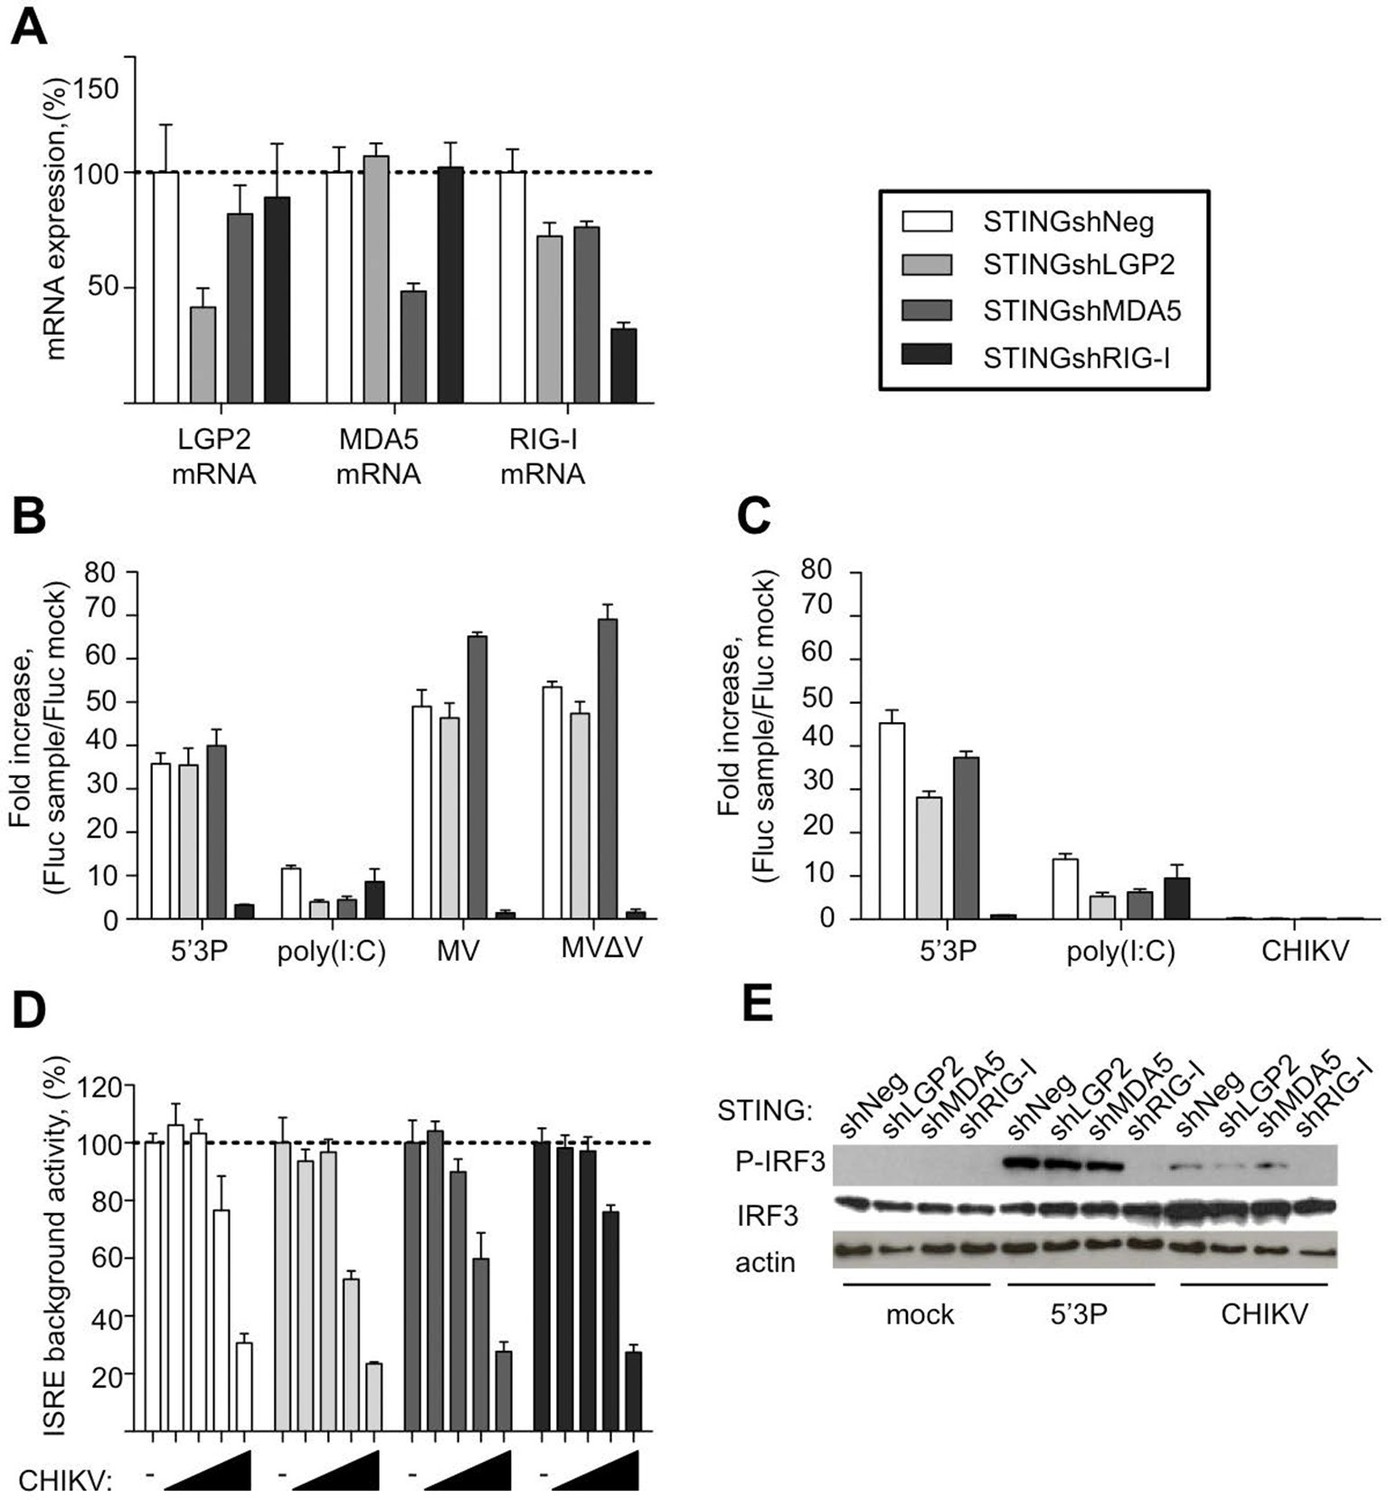
Innate sensing of MV and CHIKV infections by different RLRs.
(A) LGP2, MDA5 and RIG-I mRNA levels in STINGshRLR cells. STING-37 reporter cell line was transduced by lentiviral vectors expressing an shRNA directed against either LGP2 (shLGP2),or MDA5 (shMDA5), or RIG-I (shRIG-I), or non-silencing (shNeg). qPCR analyses with specific probes against the mRNA of each of the RLRs were performed. Relative mRNA expression was done using GAPDH as reference gene and shNeg as reference sample. ISRE activation in STINGshRLR cells by MV or MVΔV (B) or CHIKV (C) infection. 5’3P and poly(I:C) were used as controls. Results are represented as fold increase of ISRE expression compared to mock infected cells. (D) Analysis of STINGshRLR promoter activity in the presence of different loads of CHIKV. MOIs 0; 0.001; 0.01; 0.1 and 1 were used. Fluc activity was measured 13 hr post-infection and normalized by setting MOI 0 as 100% of ISRE background activity for the corresponding cell line. (E) RLR-dependent IRF3 phosphorylation upon CHIKV infection. IRF3 phosphorylation was analysed in STINGshRLR cells after CHIKV infection by Western Blot using a specific antibody recognizing the phosphorylated form of IRF3. Experiments were performed three times and data represent means ± SD of the technical triplicates of the most representative experiment.
Figure 6 with 1 supplement
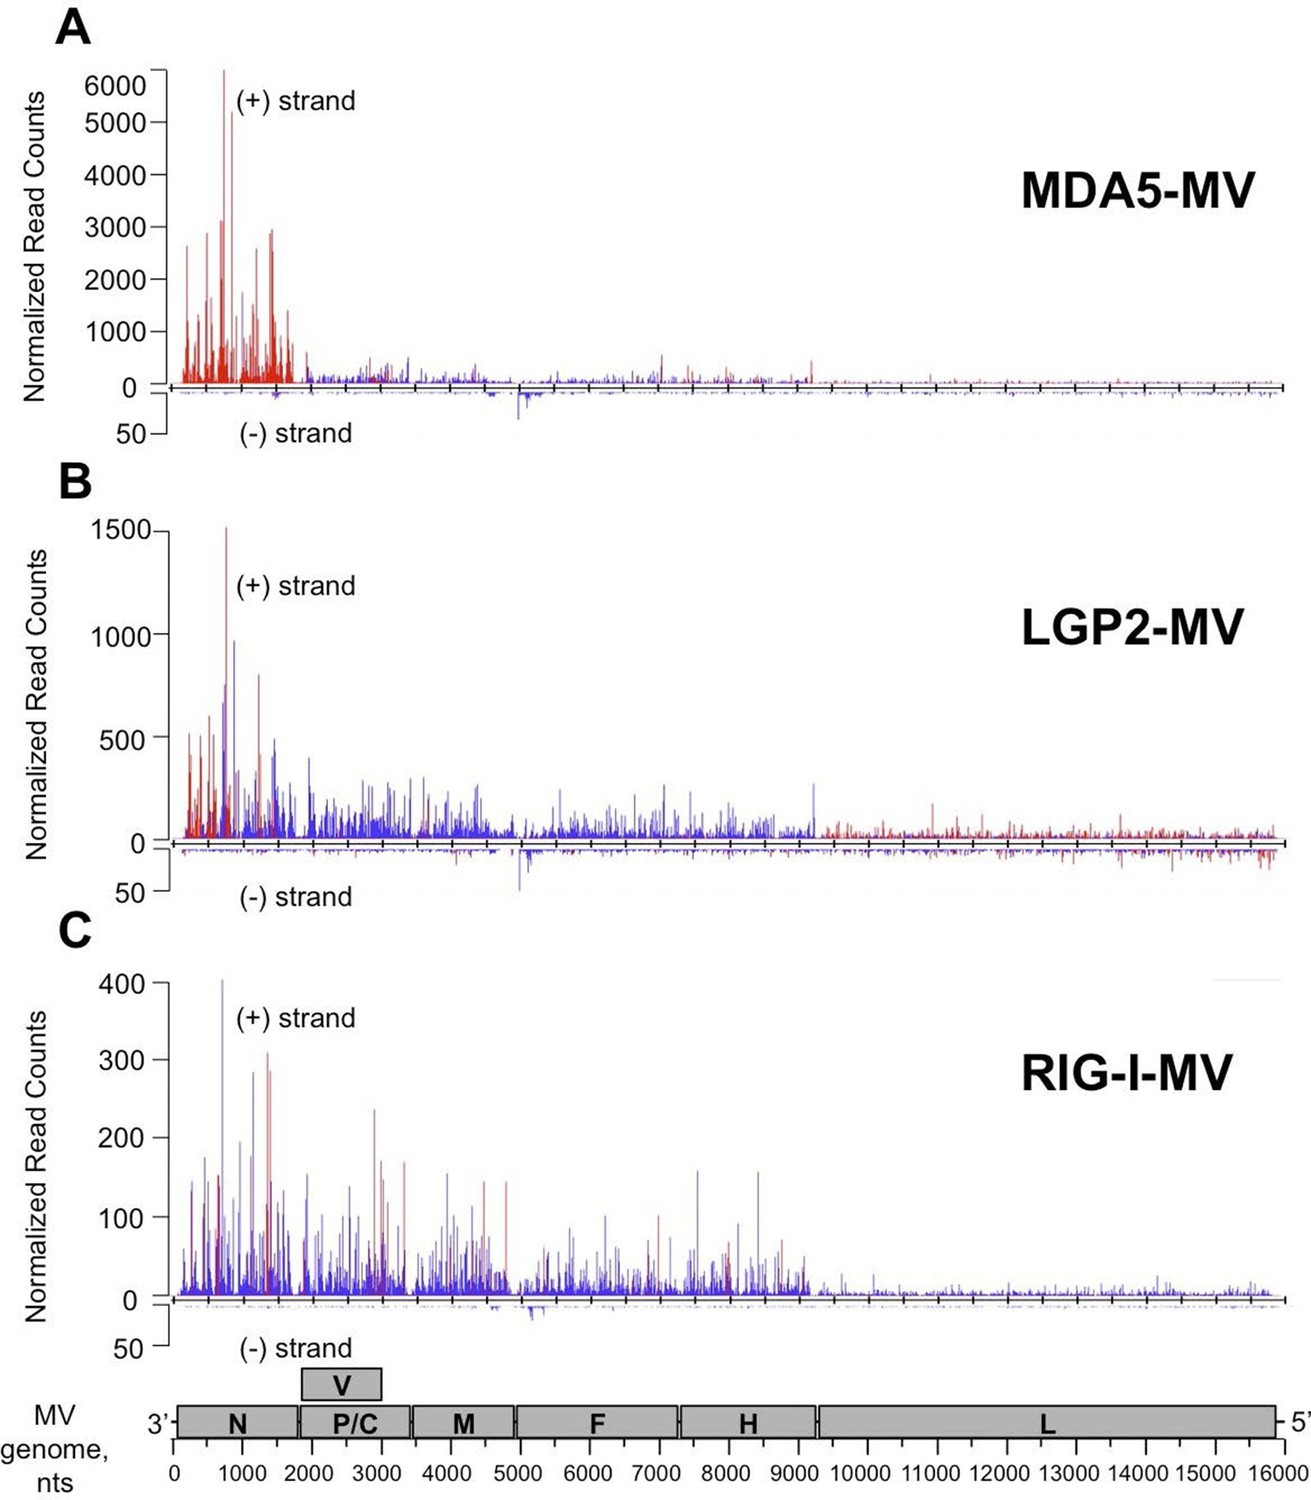
NGS analysis of specific RLR viral partners purified upon infection with MV.
MDA5/RNA (A), LGP2/RNA (B) and RIG-I/RNA (C) samples were subjected to Illumina strand-specific NGS analysis. Sequencing reads were mapped to the MV genome and only the first nucleotide was retained. Differential analyses were performed between RLR/RNA and CH/RNA on one hand and total RLR/RNA and total CH/RNA on the other hand. The distributions of normalized read counts matching the MV genome are represented along the viral genome with the X axis corresponding to all possible positions on the MV genome, and the Y axis showing the normalized number of reads that begin at that position on the positive (+) or the negative (-) strand of the genome. Significantly enriched reads are represented in red and non-significantly enriched reads are in blue. N, P/V/C, M, F, H, L are MV genome regions coding for the corresponding proteins.
Figure 6—figure supplement 1

NGS profile of total RNA aligned on the MV genome from ST-CH cells infected with the MV.
First position of raw read counts are plotted in a strand specific manner (light blue=Watson, dark blue=Crick strand) per position.
Figure 7 with 2 supplements

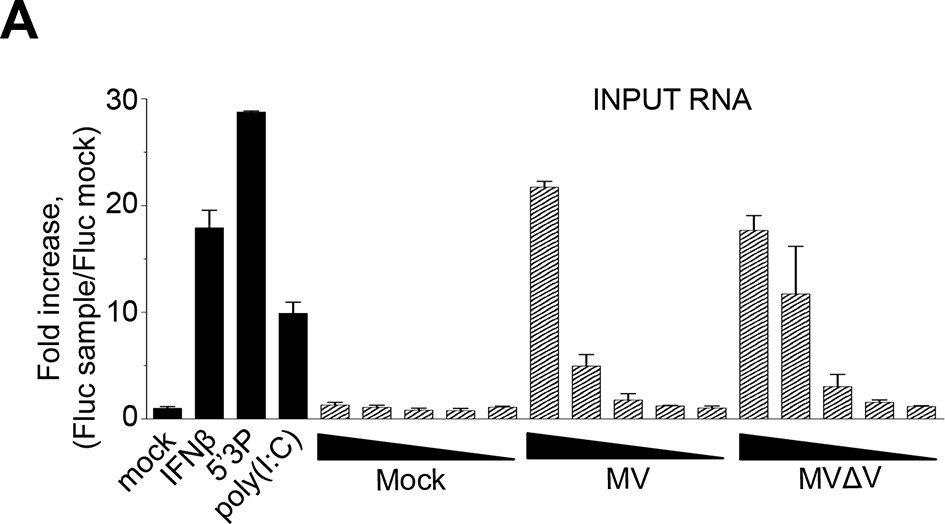
5’ copy-back DI-genome is specifically associated with RIG-I upon infection with MVΔV.
(A) RT-PCR amplification of 5’ copy-back DI-genome from cells infected with MVΔV using specific primers. Primers JM396 and JM403 were used for 5’ copy-back DI-genome amplification and JM402 and JM396 – for MV full-length genome amplification (Shingai et al., 2007). (B) Comparison of immunostimulatory activities of RIG-I associated RNAs purified from MV and MVΔV infected cells. 10, 5, 2 and 1 ng of RNA were tranfected into STING-37cells, 5’3P, poly(I:C) and IFNβ (200 UI/mL) were used as controls and Fluc activity was measured after 24 hr post-transfection. Experiments were performed two times and data represents means ± SD of the technical triplicates of the most representative experiment. (C) RIG-I recognizes 5’ copy-back DI-genome in MVΔV infected cells. ST-RIG-I cells were infected with MVΔV. RIG-I/RNA samples were subjected to Illumina strand-specific NGS. Reads were mapped to the MV genome and only the first nucleotide was retained in the X axis. Normalization and presentation of NGS results as Figure 6.
Figure 7—figure supplement 1
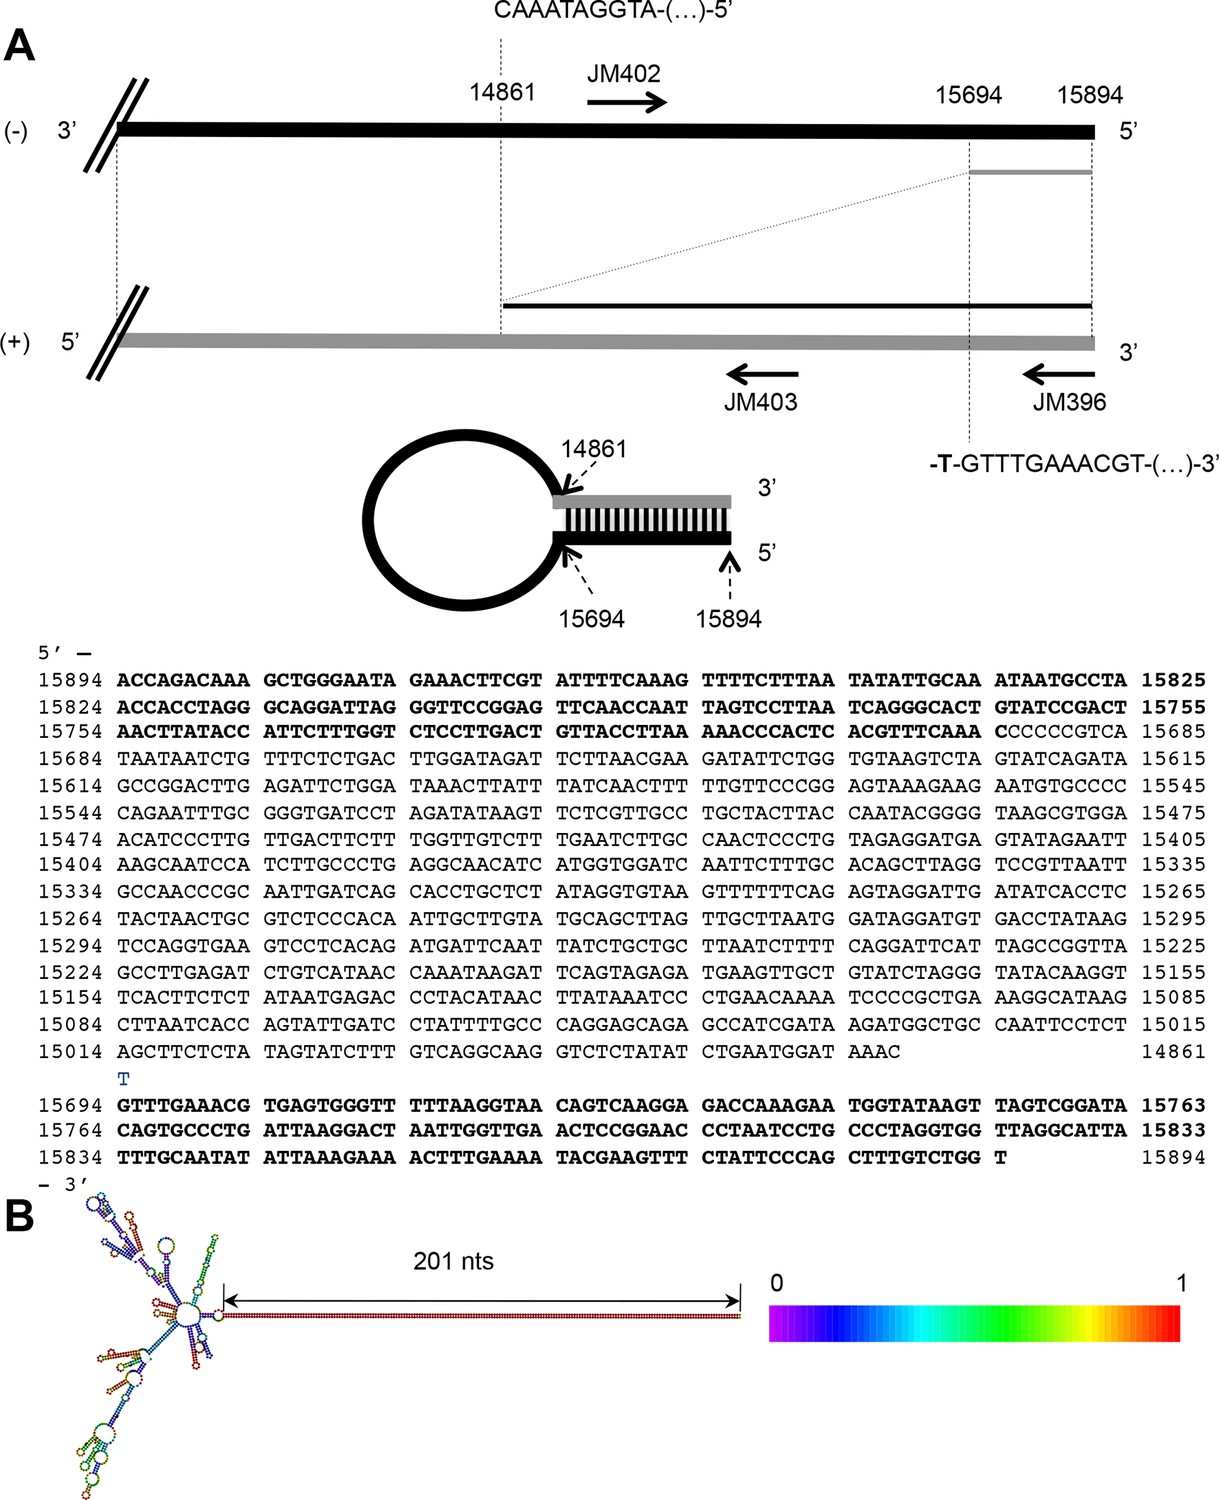
The 5’ copy-back DI genome of MVΔV.
(A) Exact sequence of the 5’ copy-back 1,236 nucleotide-long DI genome of MVΔV. Nucleotides at the position where viral polymerase resumes synthesis to transcribe the complementary 'stem' structure are indicated. (B) Structure of the 5’copy-back DI-genome: The 1236 DI-genome was submitted to RNAfold. The structure is coloured by base-pairing probability. The free energy of the structure is -608,81 kcal/mol.
Figure 7—figure supplement 2
Comparison of immunostimulatory activities of total RNA purified from ST-RIG-I cells infected by either MV or MVΔV recombinant viruses.
100, 10, 5, 2 and 1 ng of total RNA were tranfected in STING-37 cells and Fluc activity was measured. Experiments were performed 2 times and data represents means ± SD of the technical triplicates of the most representative experiment.
Figure 8
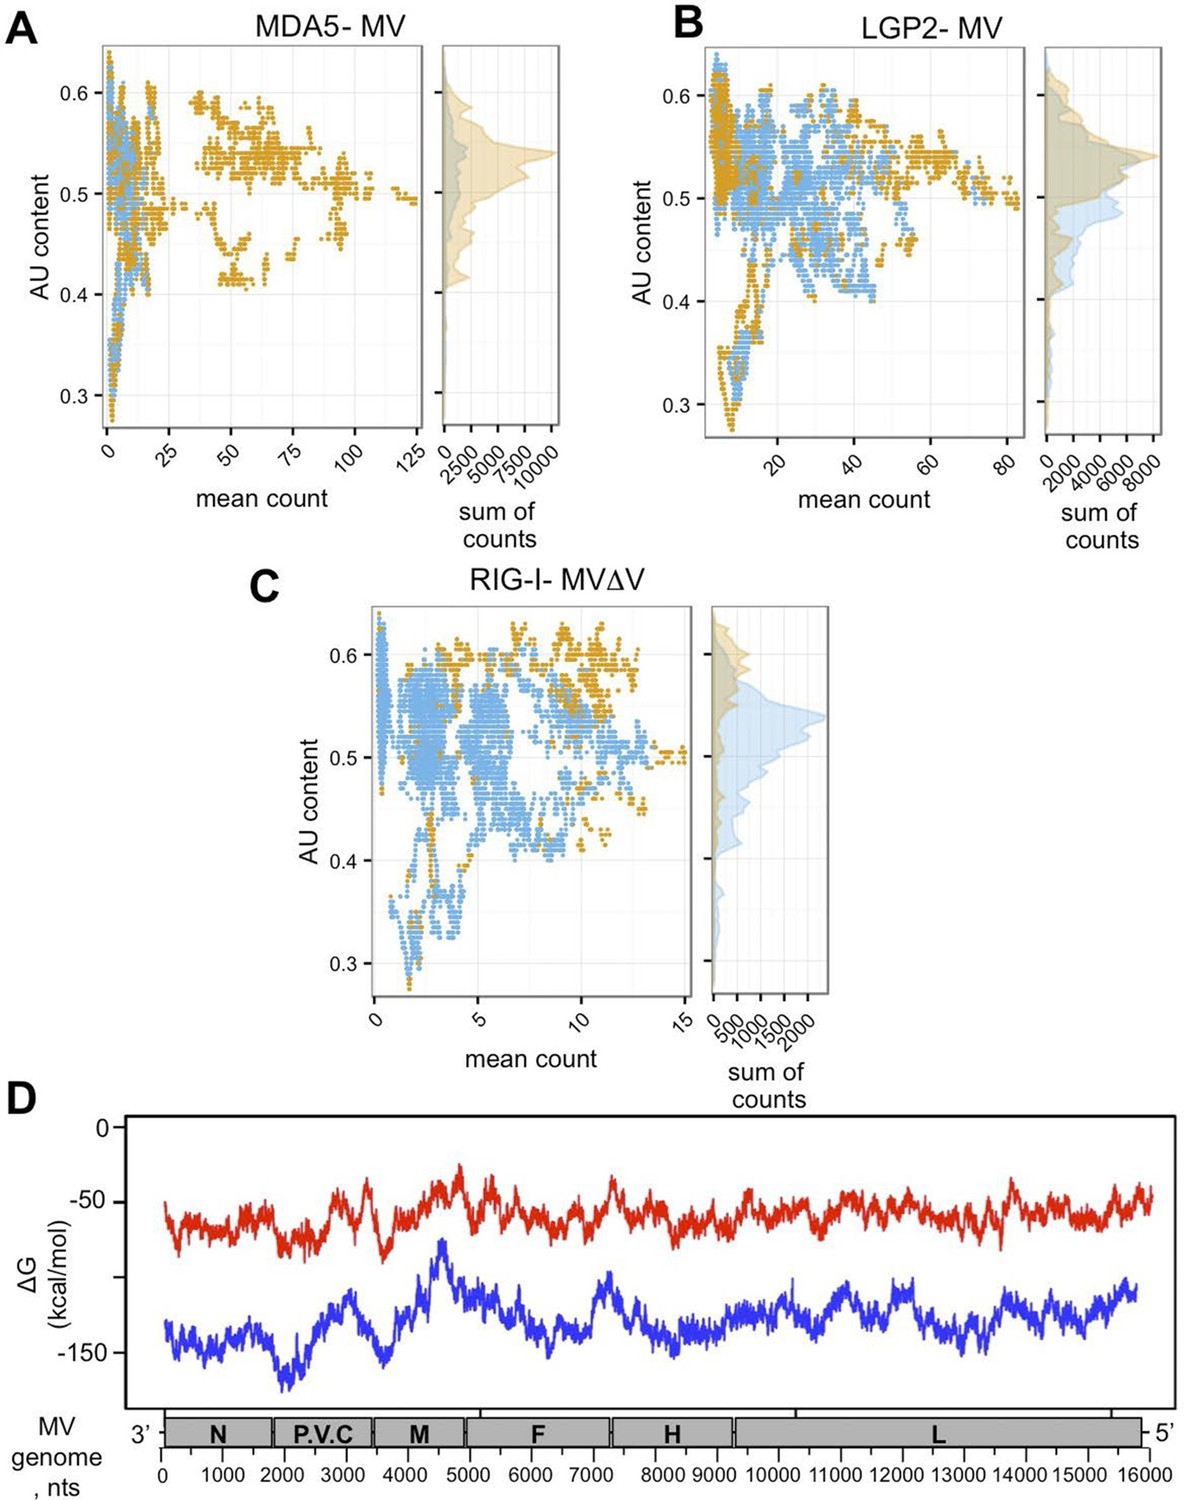
In silico analysis of NGS data.
(A, B, C) AU content of RLR-specific RNA ligands. Number of sequenced reads (extended to 200nts) with a given AU content. Significantly enriched reads/positions are represented in orange and non-significantly enriched reads are coloured in blue. (A) MDA5, (B) LGP2, (C) RIG-I NGS data. (D) Secondary structure analysis of the MV genome. Either 250 (red) or 500 (blue) nucleotide long MV genome fragments were analysed. ΔG (free energy) vs. position on the MV genome is shown.
Figure 9 with 1 supplement

Analysis of purified RIG-I-specific RNA partners by NGS upon CHIKV infection.
RIG-I/RNA samples were subjected to Illumina strand-specific NGS. Sequencing reads were mapped to the CHIKV genome and only the first nucleotide was retained in the X axis. Normalization and presentation of NGS results as Figure 6. The start of subgenomic RNA transcription is shown with the black arrow.
Figure 9—figure supplement 1
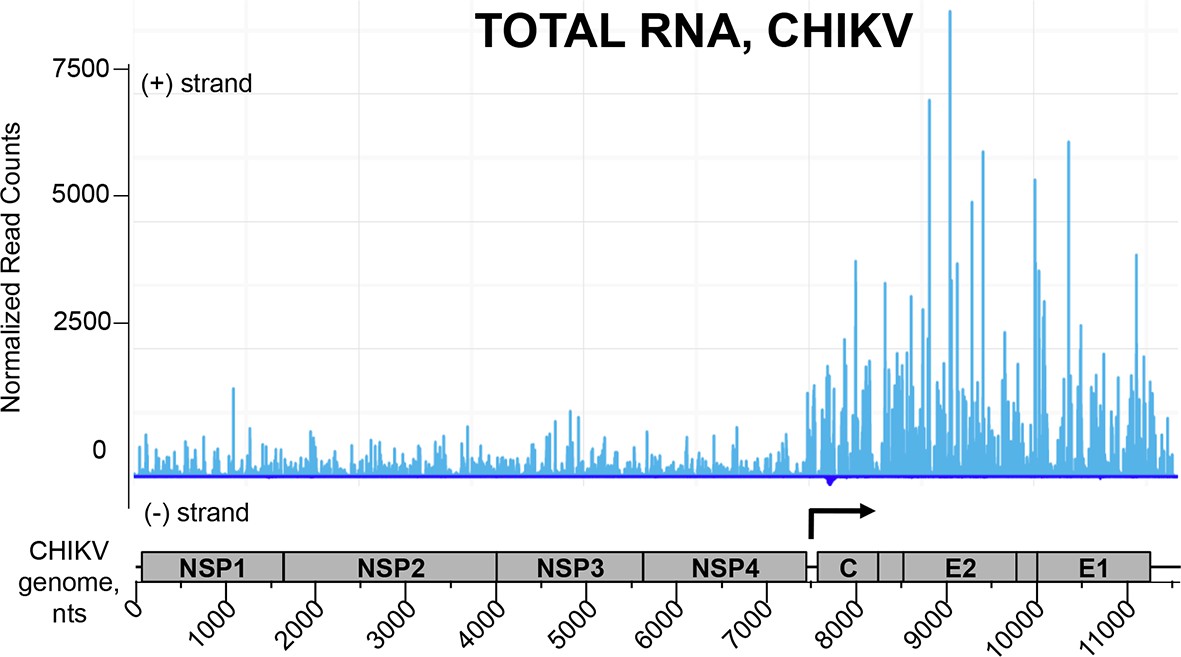
NGS profile of total RNA aligned on the CHIKV genome from ST-CH cells infected with the CHIKV.
First position of raw read counts are plotted in a strand specific manner (ligth blue=Watson, dark blue= Crick strand) per position. The start of subgenomic RNA transcription is shown with the black arrow.
Figure 10 with 1 supplement
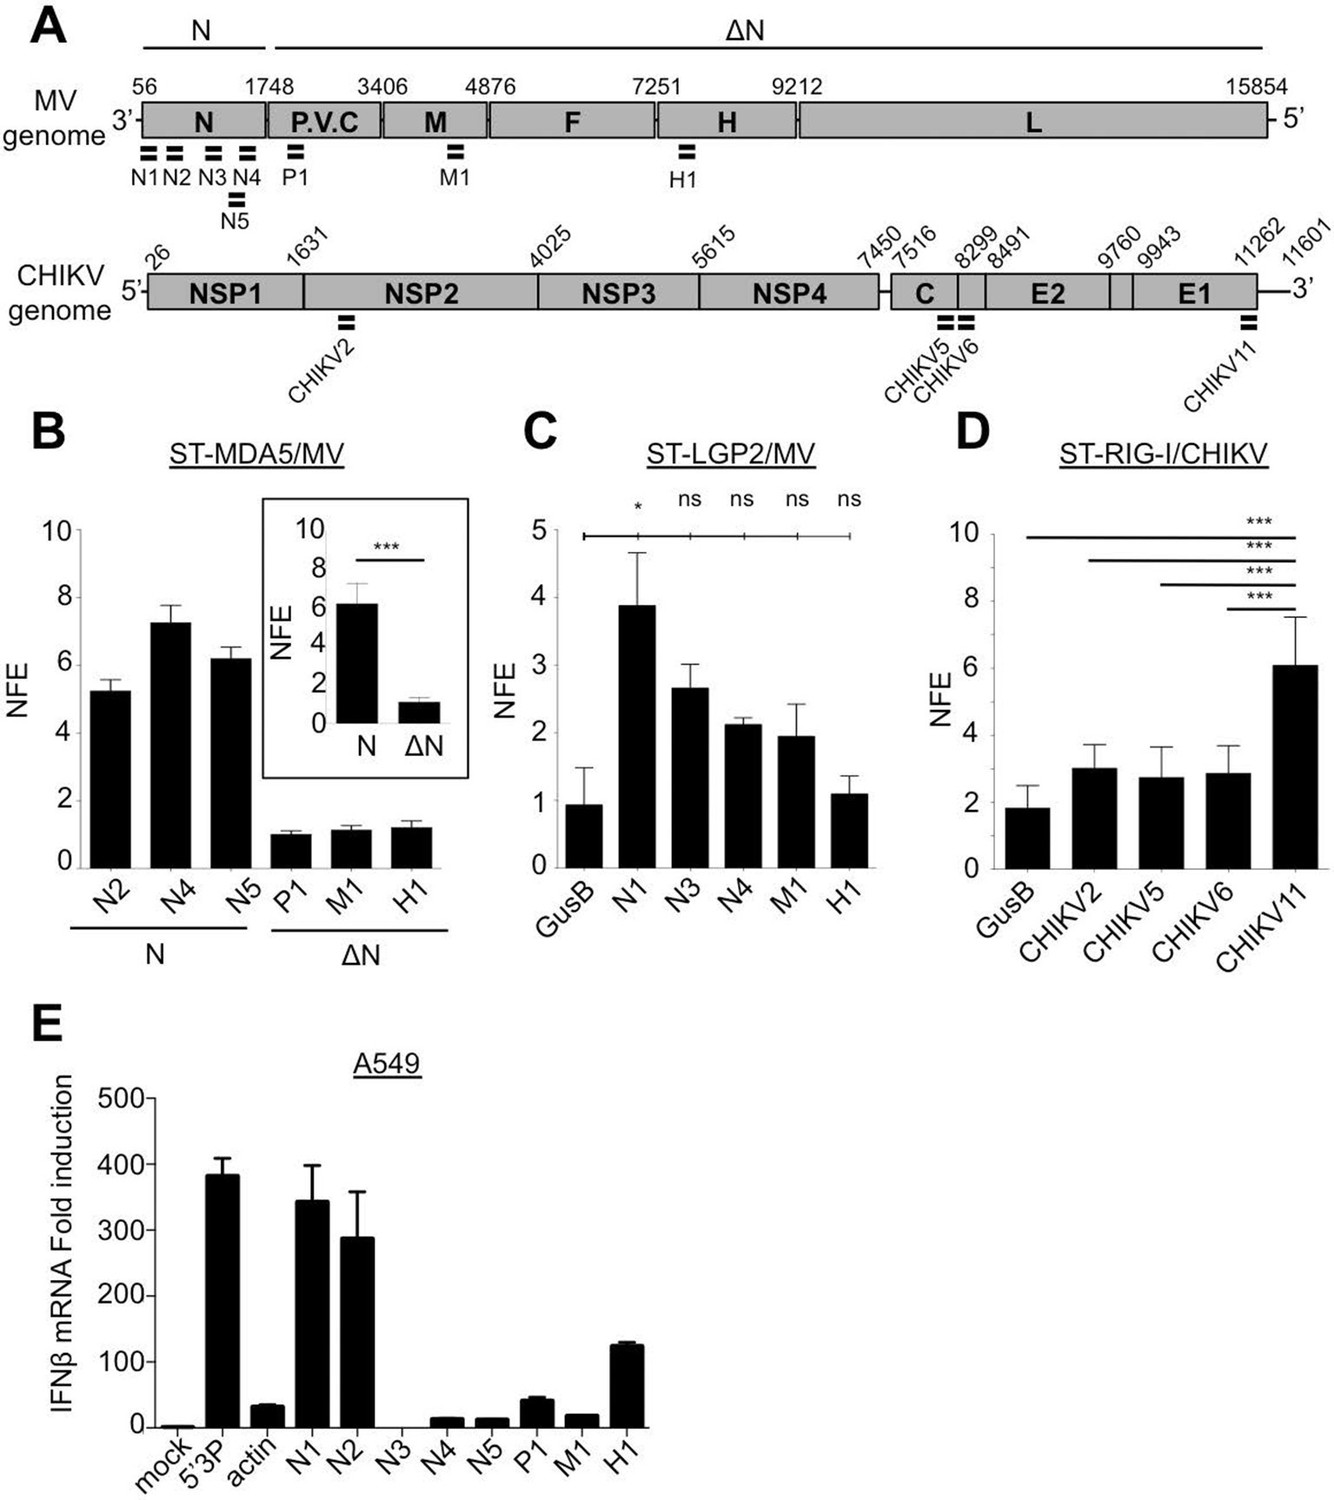
qPCR analysis of specific RLR RNA signatures from MV- and CHIKV-infected cells and their immunostimulatory activity.
(A) Locations of qPCR primers on MV and CHIKV genomes. (B) MDA5 specific interaction with the N coding region upon MV infection. MDA5/RNA samples were subjected to RT-qPCR analysis with specific primers within N, P, M and H mRNAs. Relative Normalized Fold Enrichments (NFE) against the control CH samples are shown. Small window represents comparison of NFE of the amplicons obtained with set of primers located in the N region (N2, N4, N5) to the NFE of primers located elsewhere in the genome (P1, M1, H1). Comparisons were performed by a non-parametric Mann Whitney Test. (C) LGP2 specific interaction with the 5’-end of the N coding region upon MV infection.LGP2/RNA samples were subjected to RT-qPCR analysis with specific primers within N, P and M mRNAs and housekeeping gene GusB. Relative NFE against the control CH samples are shown. Fold enrichment for different primers were compared by One-Way-ANOVA and a Tukey Multiple Comparison test. (D) RIG-I specific interaction with the 3’-end of the CHIKV genome. RIG-I/RNA samples were subjected to RT-qPCR analysis with specific primers along CHIKV genome. Fold enrichment for different primers were compared by One-Way-ANOVA and a Tukey Multiple Comparison test (*p<0.05 ***p<0.001) (E) Immunostimulatory activity of in vitro transcribed RNA fragments corresponding to the RLR-specific regions on MV genome. RNA fragments were synthesized in vitro and transfected in A549 cells. IFNβ mRNA induction was measured by RT-qPCR analysis.
Figure 10—figure supplement 1
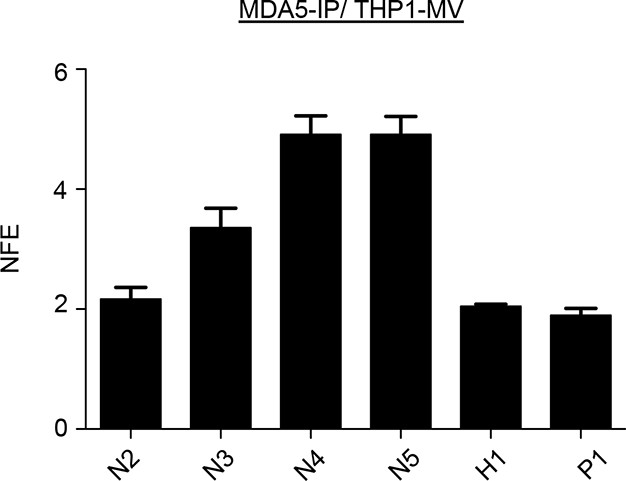
co-IP of MV-N mRNA on MDA5 from human monocytes.
THP1 cells were infected with MV at an MOI of 2 for 24 hr. MDA5-associated RNA molecules were obtained by co-IP. As a negative control, antibodies against a missing protein (anti-STrEP-Tag) were used. qPCR analysis of specific MDA5 RNA ligands was performed as on Figure 10. The experiment was performed two times and data represent means ± SD of the technical triplicates of the most representative experiment.
Additional files
-
Supplementary file 1
Number of positions within the MV or CHIKV genomes different in total RLR RNA samples with respect to the negative control CH sample.
- https://doi.org/10.7554/eLife.11275.019
-
Supplementary file 2
List of primers used for the study.
- https://doi.org/10.7554/eLife.11275.020
Download links
A two-part list of links to download the article, or parts of the article, in various formats.
Downloads (link to download the article as PDF)
Open citations (links to open the citations from this article in various online reference manager services)
Cite this article (links to download the citations from this article in formats compatible with various reference manager tools)
Comparative analysis of viral RNA signatures on different RIG-I-like receptors
eLife 5:e11275.
https://doi.org/10.7554/eLife.11275


