ERG signaling in prostate cancer is driven through PRMT5-dependent methylation of the Androgen Receptor
- Novartis Institutes for BioMedical Research, United States
- Harvard Medical School, United States
- Novartis Institutes for Biomedical Research, United States
- Novartis Institutes for Bio Medical Resarch, United States
Figures
Figure 1 with 1 supplement
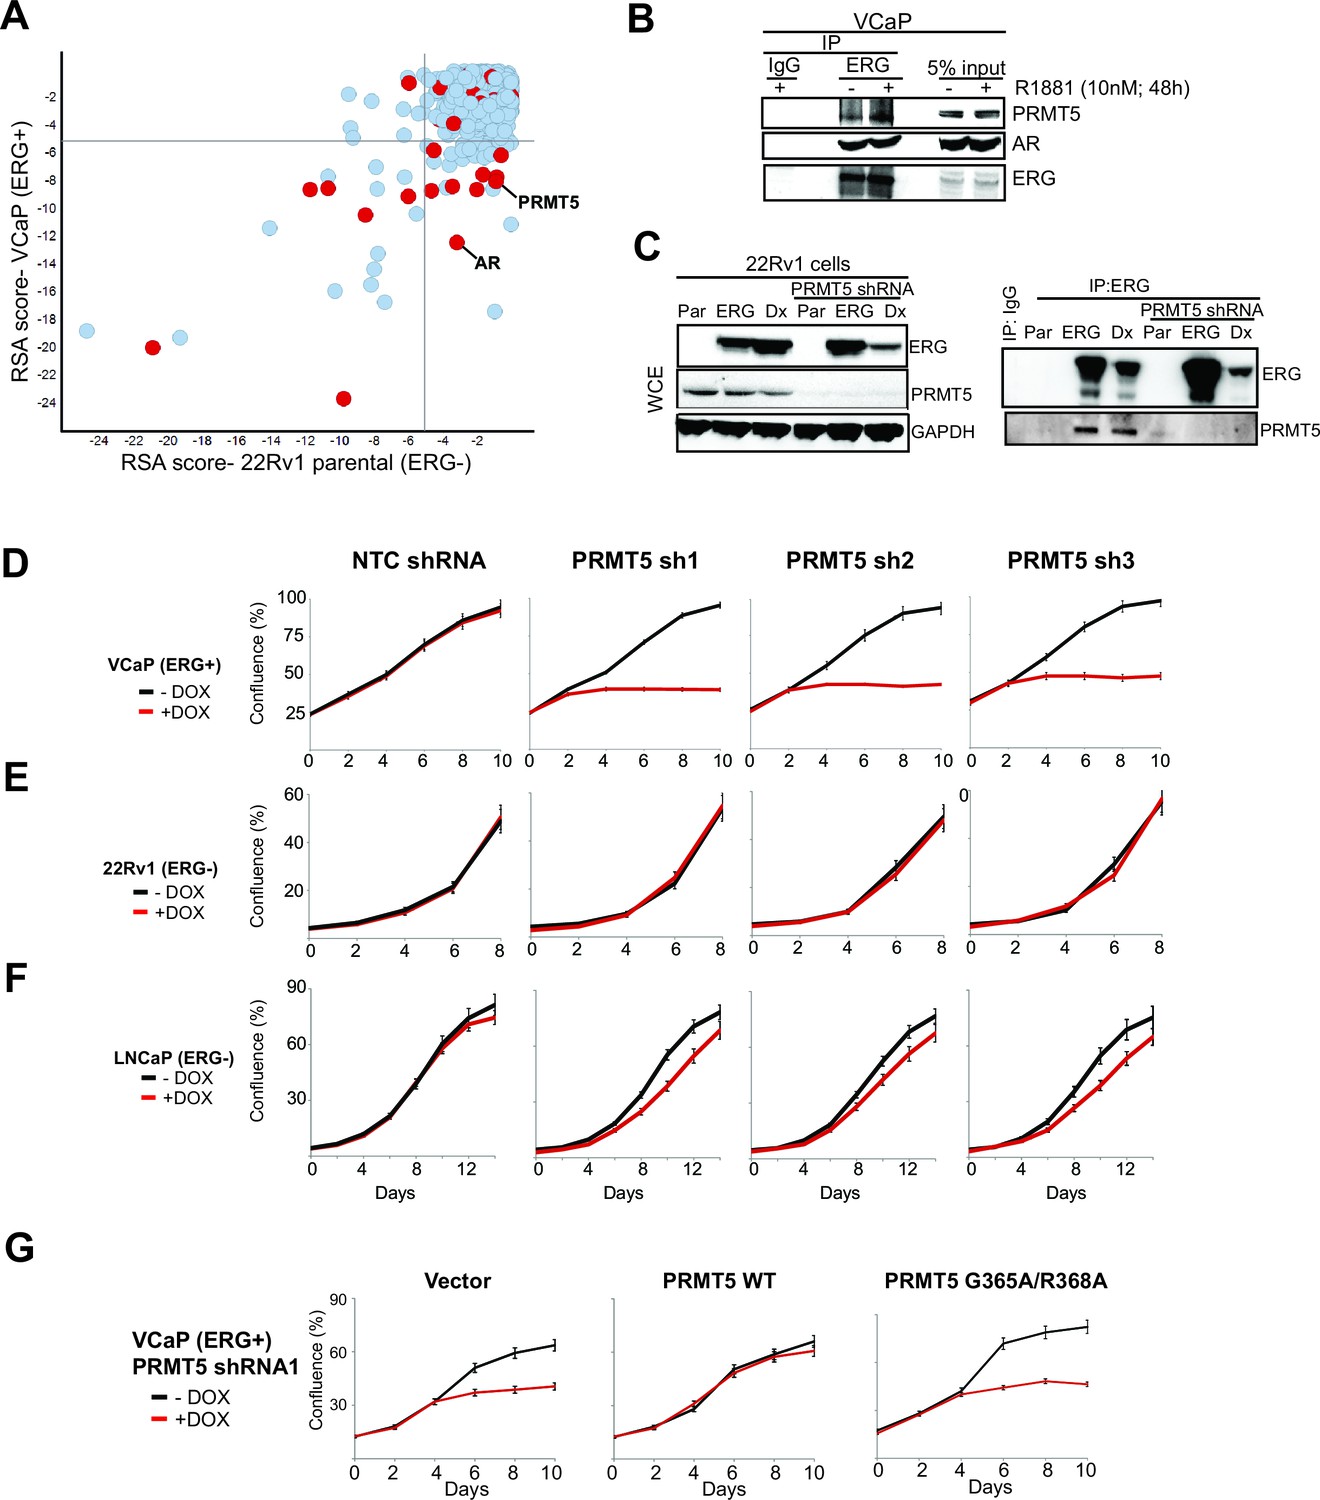
Identification of PRMT5.
(A) Log p-value plots (RSA metric, see Materials and methods) of shRNA depletion from VCaP cells (y-axis) versus 22Rv1 cells (x-axis). Grey lines denote p-value cutoff for screen hits (10-5), with bottom right quadrant enriched for VCaP-selective screen hits. Red dots indicate screen hits that are also candidate ERG interactors from Supplementary file 2. (B) Western blot of PRMT5, AR, and ERG following ERG or control IgG immunoprecipitation from untreated (-) or R1881-treated (+) VCaP cells. (C) Left panel: western blots of noted proteins from 22Rv1 whole cell extracts (WCE), either in parental (Par) cells, cells expressing exogenous ERG ('ERG'), or cells expressing a DNA-binding defective ERG ('Dx'); PRMT5 knockdown under these conditions is as noted. Right panel: Western blot of ERG immunoprecipitation (IP) from 22Rv1 for ERG and PRMT5. (D) PRMT5 proliferation after PRMT5 knockdown (sh1, sh2 and sh3) in VCaP cells (see Materials and methods). NTC: non-targeting control. Error bars represent + SEM of three biological replicates, each with three technical repeats. (E) 22Rv1 proliferation as in (C). (F) LNCaP proliferation as in (C). (G) VCaP proliferation as in (C) alongside expression of shRNA-resistant wild-type (WT) PRMT5, catalytically inactive PRMT5 (G365A/R368A), or vector control (Vector). Error bars represent + SEM of three biological replicates, each with three technical repeats.
Figure 1—figure supplement 1

PRMT5 knockdown in prostate cancer cells.
(A) Western blot of candidate ERG interactors from Figure 1A, as presented in Figure 1B. (B) Left panel: western blot for FLAG-PRMT5 and GFP-ERG constructs after immunoprecipitation of FLAG-PRMT5 in 293 cells. Right panel: western blot for HA-ERG and V5-PRMT5 after immunoprecipitation of HA-ERG from PC3 cells. (C) Top panel: schematic representation of four ERG deletion mutants. ERG FL: full-length ERG; ERG△NTD: ERG lacking N-terminal domain; ERG△CTD: ERG lacking C-terminal domain; ERG△PNT: ERG lacking pointed domain. Bottom left panel: western blot of noted proteins from WCEs of 293 cells expressing FLAG-PRMT5 and either ERG construct. Bottom right panel: Western blot of FLAG-PRMT5 IP from 293 cells. (D) VCaP, LNCaP and 22Rv1 cells targeted by PRMT5 knockdown using three shRNA sequences (sh1, sh2, sh3) or NTC shRNA. Cells were left either treated or untreated with 100ng/ml doxycycline (Dox) for 7, 4 and 5 days respectively to induce shRNA expression. Western blots were analyzed for levels of PRMT5, total histone H4, AR and GAPDH as loading control. (E) Top panel: waterfall plot of Achilles cell line panel sensitivity to knockdown of PRMT5 using PRMT5 shRNA#1 (Kryukov et al., 2016). Prostate cancer cell lines are in red and ERG status is noted. Bottom panel: replotting of the data, colored for MTAP status—red arrows indicate the locations of the prostate cancer cell lines noted in the top panel.
Figure 2 with 3 supplements

PRMT5 is an ERG-dependent inhibitor of AR signaling.
(A) Heat map showing all genes upregulated (red) or downregulated (blue) by at least 1.5 fold following knockdown with PRMT5 shRNA1 (sh1) or shRNA2 (sh2) compared to NTC shRNA. Rows represent probe sets; columns represent individual samples (technical replicates are marked by 1 or 2). Table indicates pathways significantly upregulated by PRMT5 knockdown (see Materials and methods, and Supplementary file 3 for significantly downregulated pathways). (B) qRT-PCR of AR targets PSA, NKX3-1, and SLC45A3 in VCaP cells expressing the noted shRNA constructs. Expression levels were normalized as described in Materials and methods; bars represent + SEM of three biological replicates, each with three technical repeats. (C) qRT-PCR of PSA and NKX3-1 from VCaP cells expressing the noted shRNA constructs alongside cDNAs expressing vector control (Vector), wild-type (WT) PRMT5, or a catalytically dead PRMT5 mutant (G365A/R368A). Data and error bars represented as in (B). (D) Top panels: cartoons of the PSA and NKX3-1 loci. ERG and AR binding sites (and control regions) are noted and numbered relative to the transcription start site (TSS) as described in Materials and methods. Bottom panels: ERG, PRMT5, and AR ChIP qPCR for the noted regions of PSA (left) or NKX3-1 (right) in VCaP cells upon ERG or PRMT5 knockdown. Normalization to IgG control ChIP is as described in Materials and methods; error bars represent + SEM of three biological replicates, each with three technical repeats. (E) Heatmap visualization of AR binding from ChIP-sequencing data as determined by normalized reads across the AR Cistrome (Materials and methods) in replicate samples induced using AR ligands (DHT or R881 as indicated) and harboring inducible PRMT5 shRNA1 (sh1), shRNA2 (sh2), or shRNA3 (sh3) compared to NTC shRNA. 1659 peaks show differential binding with at least 1.5 fold difference (p-value of 0.01, q-value 0.151). The majority of differentially bound sites exhibit increased binding (6% of the total Cistrome) under PRMT5 knockdown conditions.
Figure 2—figure supplement 1
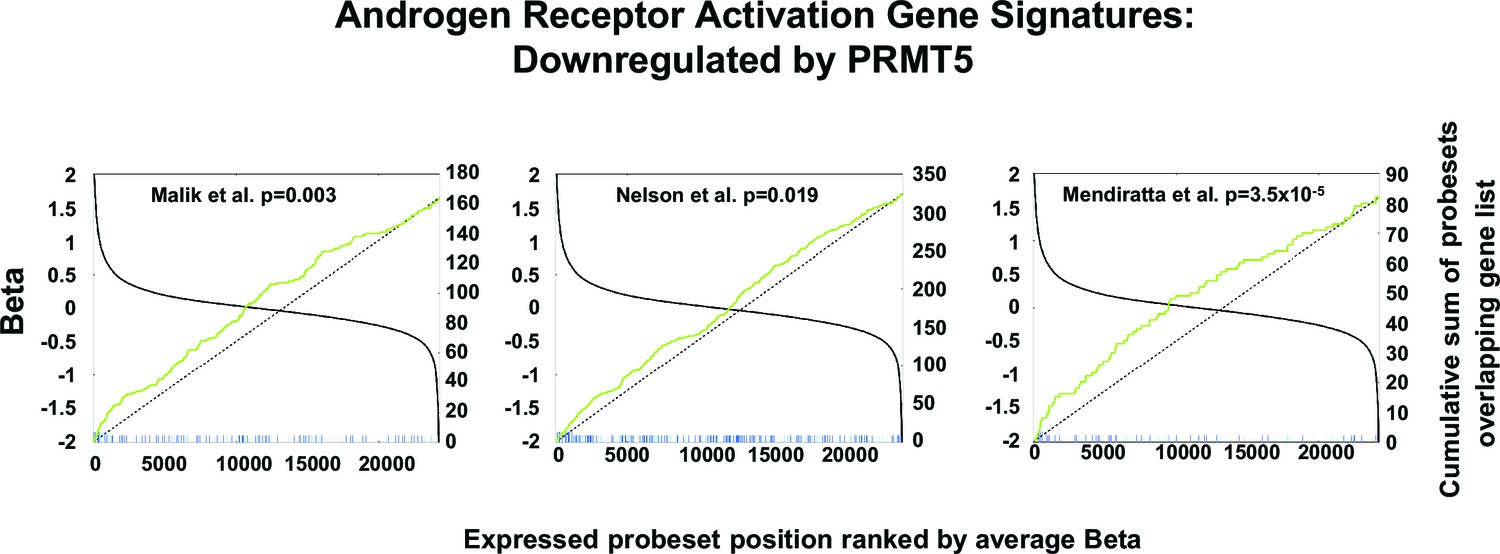
AR signature analysis.
Correlation between three independent androgen receptor activation gene signatures (Malik et al., 2015; Mendiratta et al., 2009; Nelson et al., 2002) in comparison with the top-ranked upregulated genes following PRMT5 knockdown by shRNA in VCaP cells (Figure 2A).Each vertical line (green, blue, or red) represents the highest expressed probe set for each gene in the gene signatures. Lines are elongated if the probe set was upregulated following PRMT5 knockdown by at least 1.5 fold with a nominal p value <0.05. The p values shown are based on a two-tailed Fisher’s exact test described in Materials and methods.
Figure 2—figure supplement 2
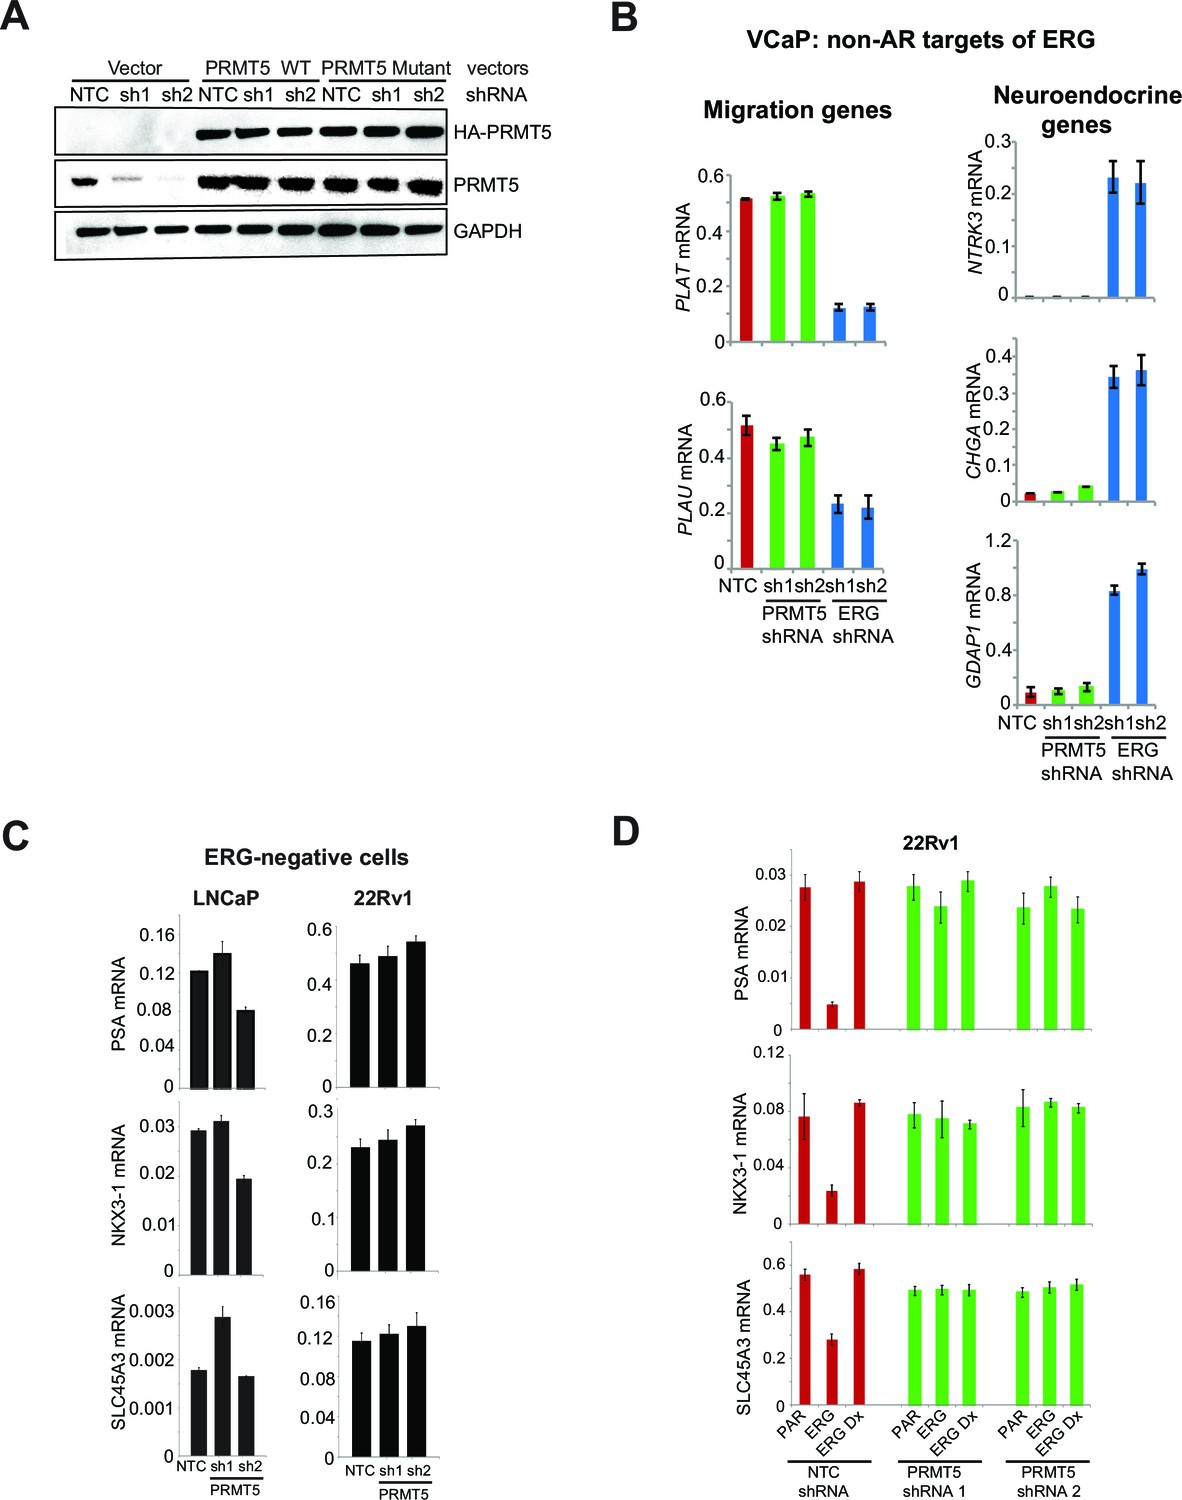
ERG and PRMT5 effects on AR target genes are specific.
(A) Western blot of VCaP cells expressing wild-type (WT) PRMT5, a catalytic dead PRMT5 mutant (PRMT5 G365A/R368A) or a vector control (Vector) in the background of two independent shRNA vectors (sh1 and sh2). Cells were maintained in culture for 10 days in presence of 100 ng/ml doxycycline (Dox). Western blot analysis shows expression levels of HA affinity tag (overexpressed PRMT5), total PRMT5, and GAPDH as a loading control. (B) qRT-PCR of the migration genes PLAT, PLAU and the neuroendocrine genes NTRK3, CHGA, GDAP1 in VCaP cells expressing either ERG or PRMT5 shRNA constructs. Expression levels were normalized as described in Materials and methods; bars represent + SEM of three replicates. (C) qRT-PCR of PSA, NKX3-1 and SLC45A3 in LNCaP and 22Rv1 cells expressing either NTC shRNA, PRMT5 shRNA 1 or PRMT5 shRNA 2. Data represent normalized expression of PSA, NKX3-1 and SLC45A3 mRNA relative to the B2M transcript. Error bars represent + SEM of three replicates. (D) qRT-PCR for PSA, NKX3-1 and SLC45A3 in parental (PAR) 22Rv1 cells and following expression of either ERG or ERG DNAx and expressing either NTC shRNA, PRMT5 shRNA 1 or PRMT5 shRNA 2 (see Materials and methods for description) normalized relative to the B2M transcript. Error bars represent + SEM of three replicates.
Figure 2—figure supplement 3
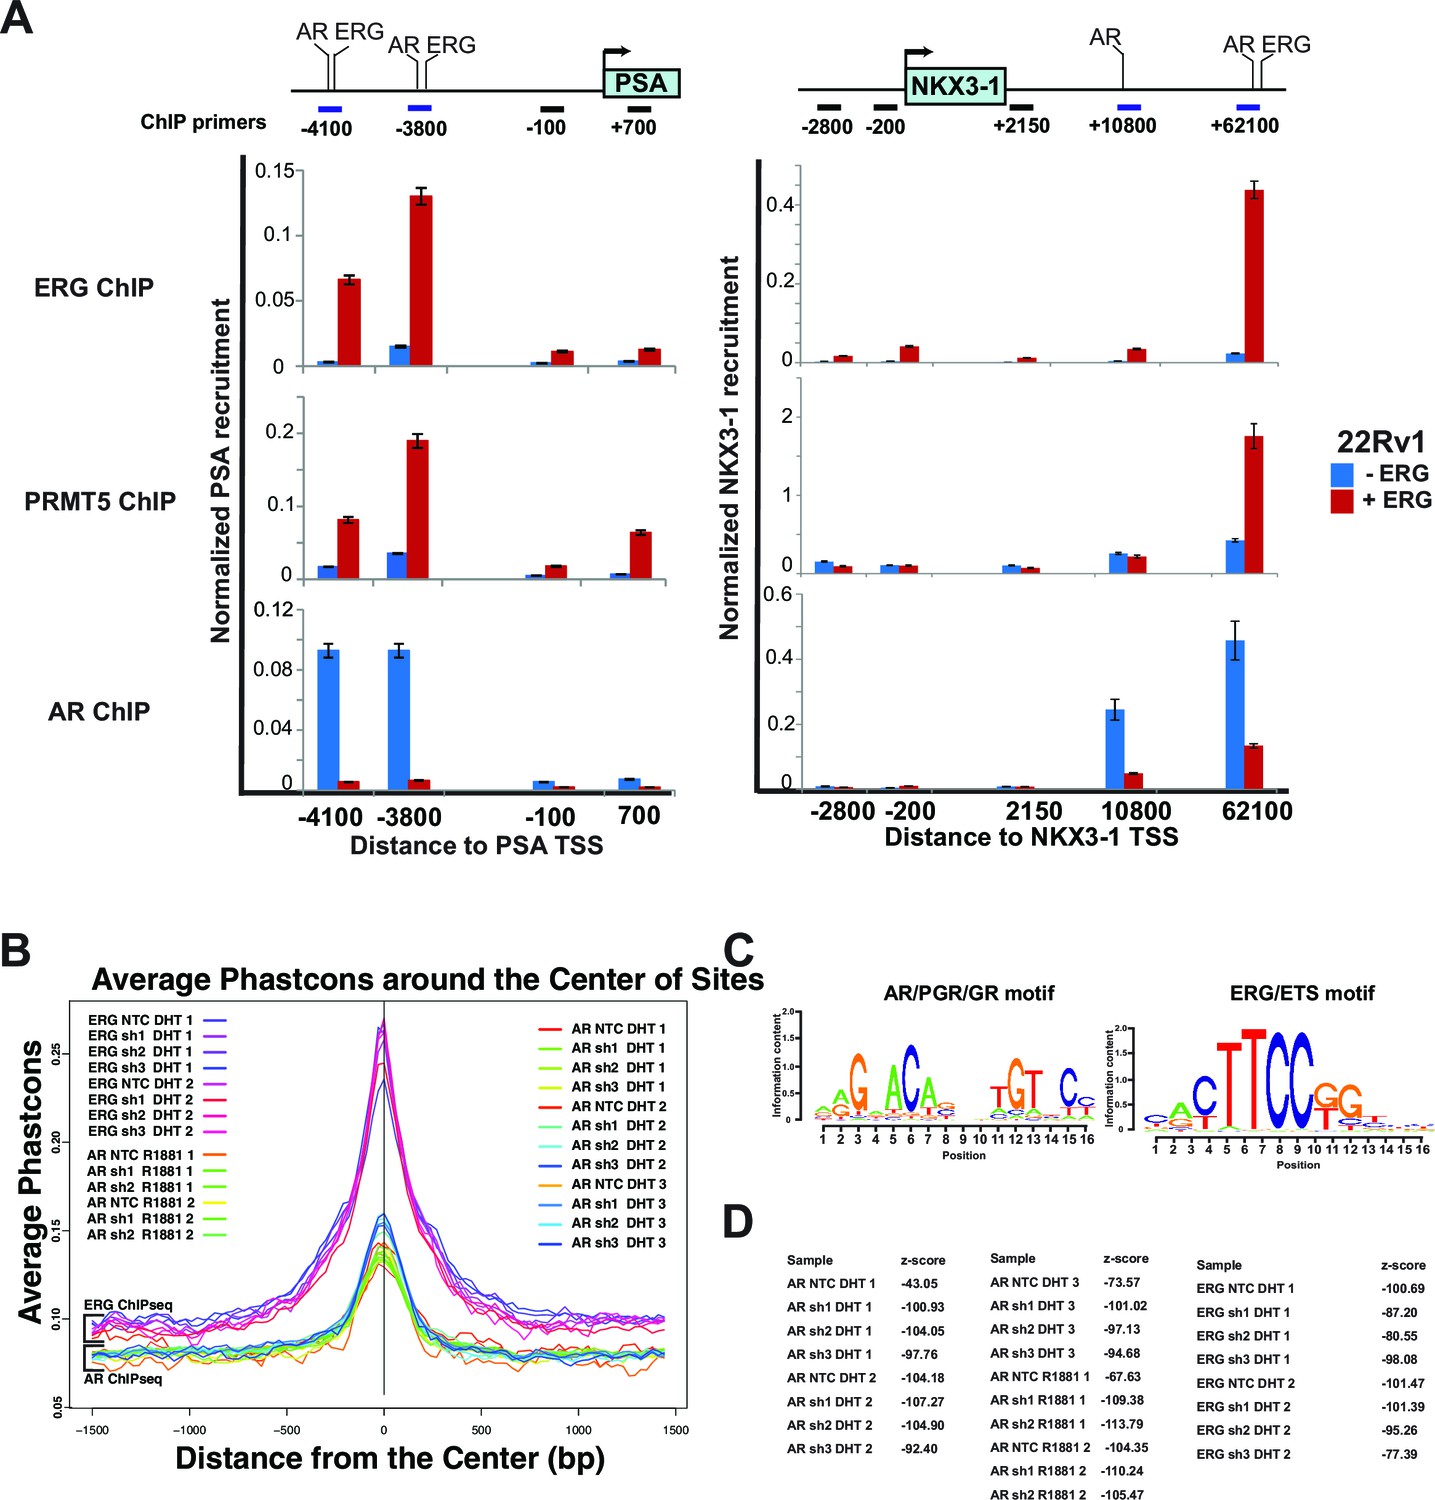
ERG, AR and PRMT5 recruitment.
(A) Top panel: cartoons of the PSA and NKX3-1 loci including the promoter and enhancer regions bound by ERG and AR (-4100 and -3800 on PSA; +10800 and +62100 on NKX3-1) along with other control regions. All distances shown are relative to the PSA and NKX3-1 transcription start site (TSS). Bottom panels: chromatin Immunoprecipitations (ChIP) for ERG, PRMT5, and AR followed by quantitative PCR using primers specific to each region as shown by the horizontal bars in top panels. Shown are the recruitments to the PSA promoter and enhancer regions (left) and to the NKX3-1 promoter and enhancer regions (right) in 22Rv1 cells in the absence and presence of ERG. All recruitments are normalized to the IgG control ChIP. Normalization and error bars are described in Materials and methods. (B) The top 1000 (MACS mfold rank) AR and ERG recruitment peaks, analyzed for evolutionary conservation in mammalian species using Phastcons, showing that ERG and AR samples have internally consistent performance. (C) Top-scoring motifs in all samples for AR ChIPseq (left panel) and ERG ChIP-seq (right panel). (D) z-scores for the motifs identified in (C).
Figure 3 with 3 supplements
PRMT5 methylates AR on arginine 761.
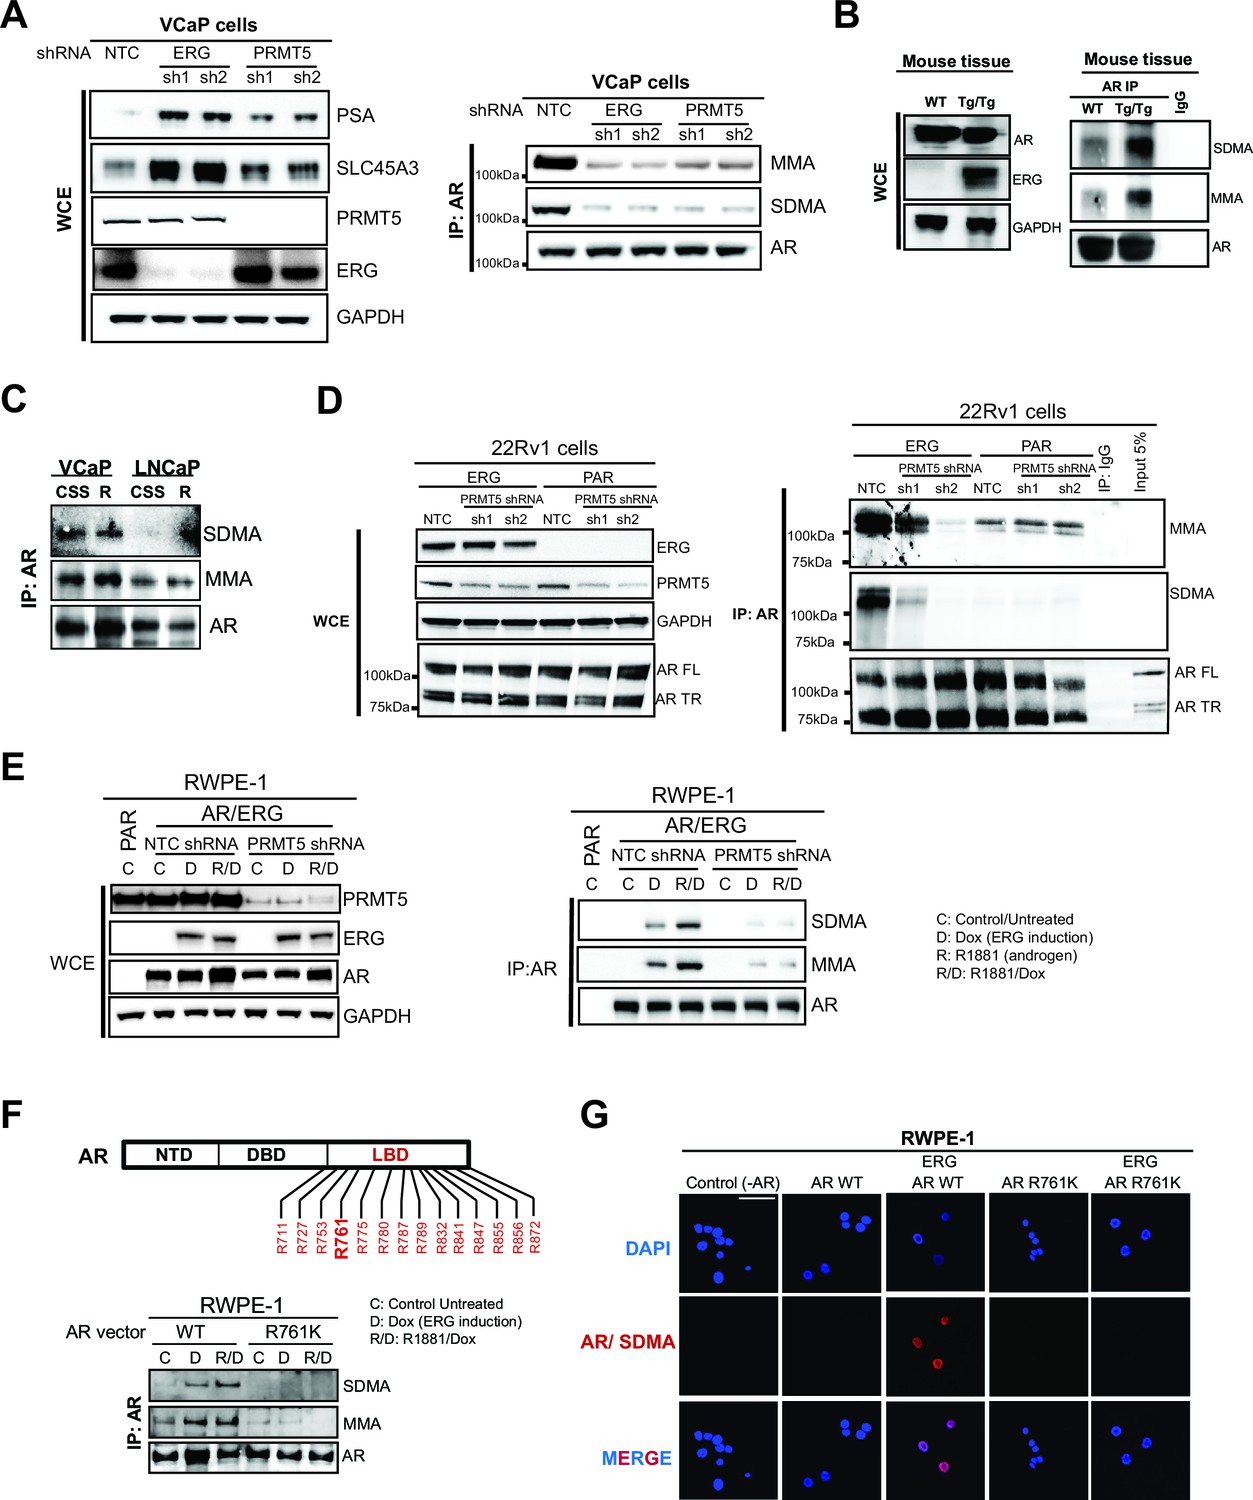
(A) (A) Left panel: western blots of noted proteins from VCaP whole cell extracts (WCE) after ERG or PRMT5 knockdown. Right panel: Western blot of AR immunoprecipitation (IP) from VCaP. SDMA: symmetric di-methyl arginine; MMA: mono-methyl arginine. (B) Left panel: Western blot analysis of noted proteins from homozygous TMPRSS2:ERG transgenic (Tg/Tg) and WT mouse tissues. Right panel: AR or IgG IP from mouse tissues followed by western blot analysis of MMA, SDMA and total AR levels. (C) Western blot of AR immunoprecipitation (IP) from VCaP and LNCaP cells grown in charcoal-stripped serum (CSS) and stimulated with 10nM R1881. SDMA: symmetric di-methyl arginine; MMA: mono-methyla arginine. (D) Left panel: western blot of noted proteins from 22Rv1 parental (PAR) or ERG-expressing (ERG) WCEs. FL: full-length; TR: truncated (lacking ligand binding domain, LBD). Right panel: Western blot of AR IP from 22Rv1. (E) Left panel: RWPE-1 parental (PAR) and AR and ERG-expressing (AR/ERG) cells targeted by PRMT5 knockdown (PRMT5 shRNA) or NTC shRNA were left either untreated (C) or treated with 100ng/ml doxycycline (D) in the absence or presence of 1nM R1881 (R) for 24 hr. Western blot analysis shows expression levels of PRMT5, ERG, AR and GAPDH from input samples (WCE). Right panel: Lysates were then used for AR immunoprecipitation (AR IP) followed by western blot analysis using antibodies against MMA, SDMA or total AR levels. (F) Top panel: location of all arginines (R) in the AR LBD. NTD: N-terminal domain; DBD: DNA binding domain. Right panel: western blot of AR IPs from RWPE-1 cells expressing ERG with wild-type AR (AR WT) or R761K mutant. C: control untreated; D: Dox-treated (ERG induction); R: R1881-treated. Bottom panel: western blot analysis of MMA, SDMA and total AR levels from AR IPs in RWPE-1 cells expressing ERG with either wild-type AR (AR WT) or R761K mutant. C: control untreated; D: Dox-treated (ERG induction); R: R1881-treated. (G) Representative immunofluorescence images of Dox- and R1881-treated RWPE-1 cells expressing ERG or AR as noted above each column. AR/SDMA: proximity ligation signals using antibodies detecting AR and SDMA (see Materials and methods). Scale bar, 50 µm. Data shown is a representative example of three biological replicates.
Figure 3—figure supplement 1
H4R3me2s ChIP.
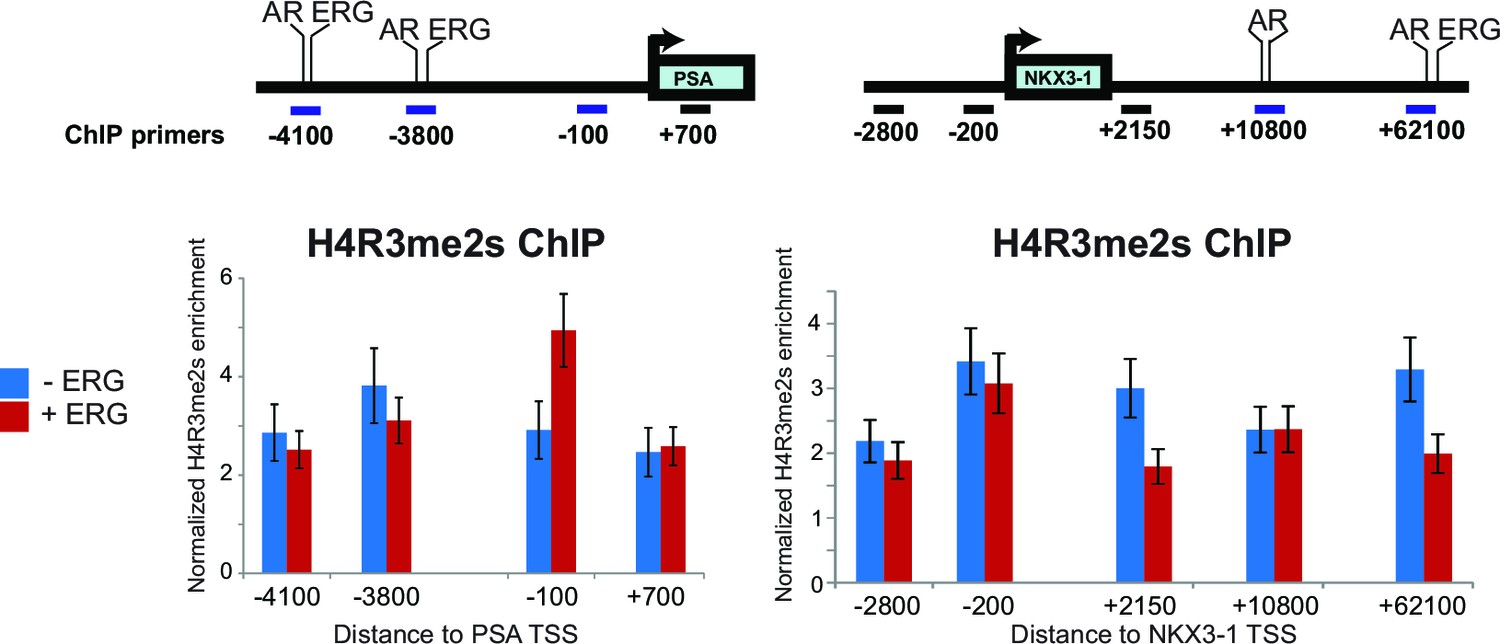
Top panel: schematic representation of the PSA and NKX3-1 loci including the promoter and enhancer regions bound by ERG and AR (-4100 and -3800 on PSA; +10800 and +62100 on NKX3-1) along with other control regions.All distances shown are relative to the PSA and NKX3-1 transcription start site (TSS). Bottom panel: enrichment analysis of symmetric di-methyl arginine 3 on histone 4 (H4R3me2s) was performed by Chromatin Immunoprecipitations (ChIP) for H4R3me2s followed by quantitative PCR amplification using primers specific to each region as shown by the horizontal bars. Enrichment analysis was performed in 22Rv1 cells in the absence or presence of ERG. All enrichments are normalized to the IgG control ChIP. Data shown from three biological replicates, each with three technical repeats.
Figure 3—figure supplement 2
PRMT5 methylates AR in vitro.
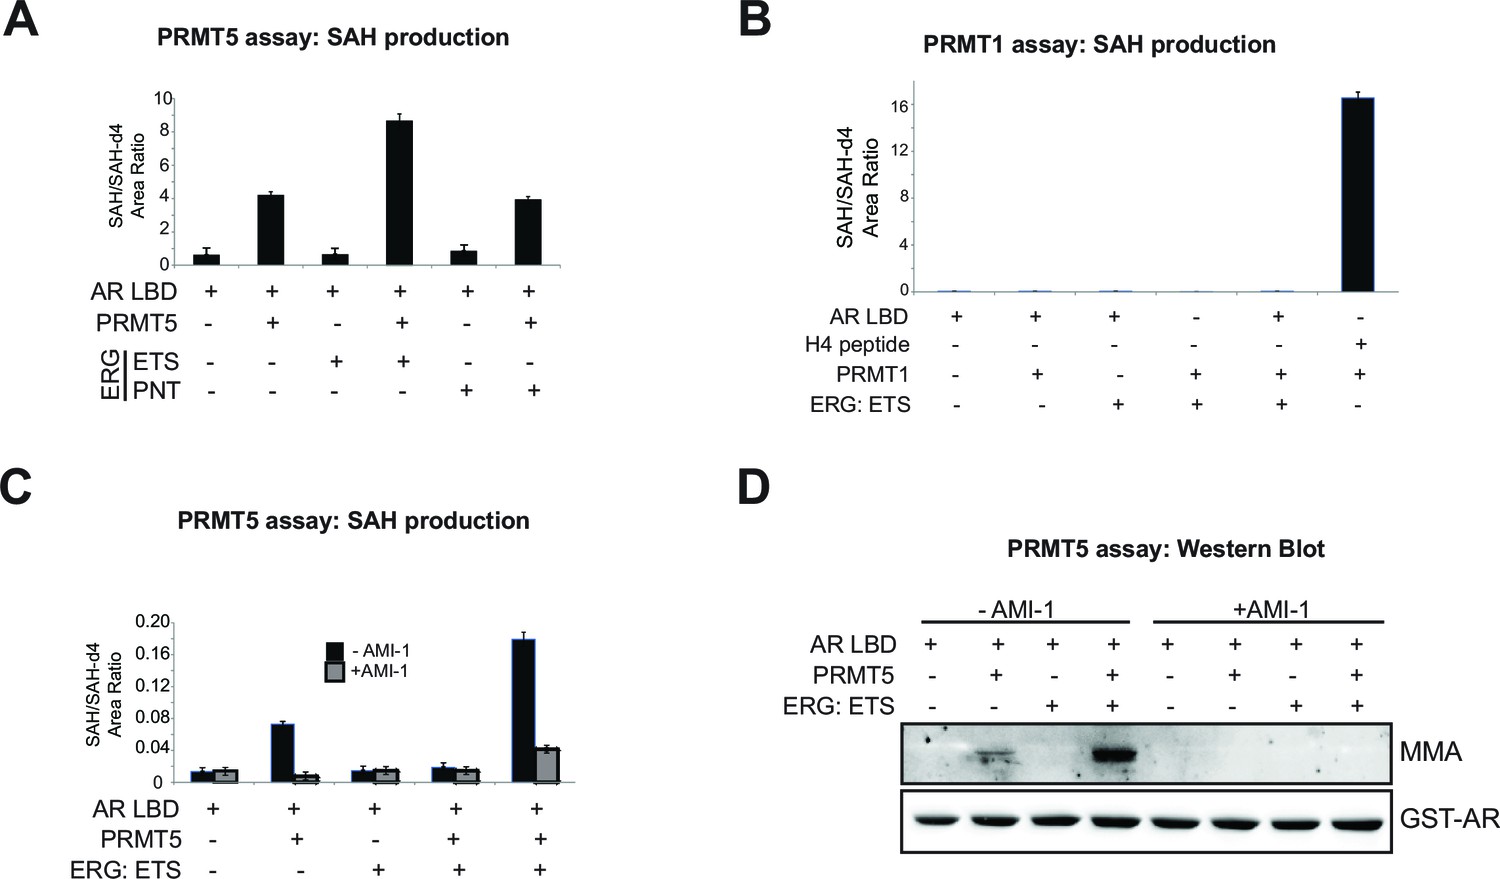
(A) Area ratio of SAH levels normalized to spike-in control SAH-d4 in methyltransferase assay including PRMT5 enzyme, SAM, AR LBD (ligand binding domain), ETS (ERG ETS domain) or PNT (ERG PNT domain) as noted. (B) Area ratio of SAH levels normalized to spike-in control SAH-d4 in methyltransferase assay including PRMT1 enzyme, SAM, AR LBD (ligand binding domain), ETS (ERG ETS domain) or H4 control peptide as noted. (C) Area ratio of SAH levels normalized to spike-in control SAH-d4 in methyltransferase assay including PRMT5 enzyme, SAM, AR LBD (ligand binding domain) and ETS (ERG ETS domain) as noted; in the presence or absence of pan-PRMT inhibitor AMI-1. (D) Western blot analysis of MMA and GST-AR levels from samples in (C).
Figure 3—figure supplement 3
AR and ERG expression in RWPE-1, and mutation of AR LBD.
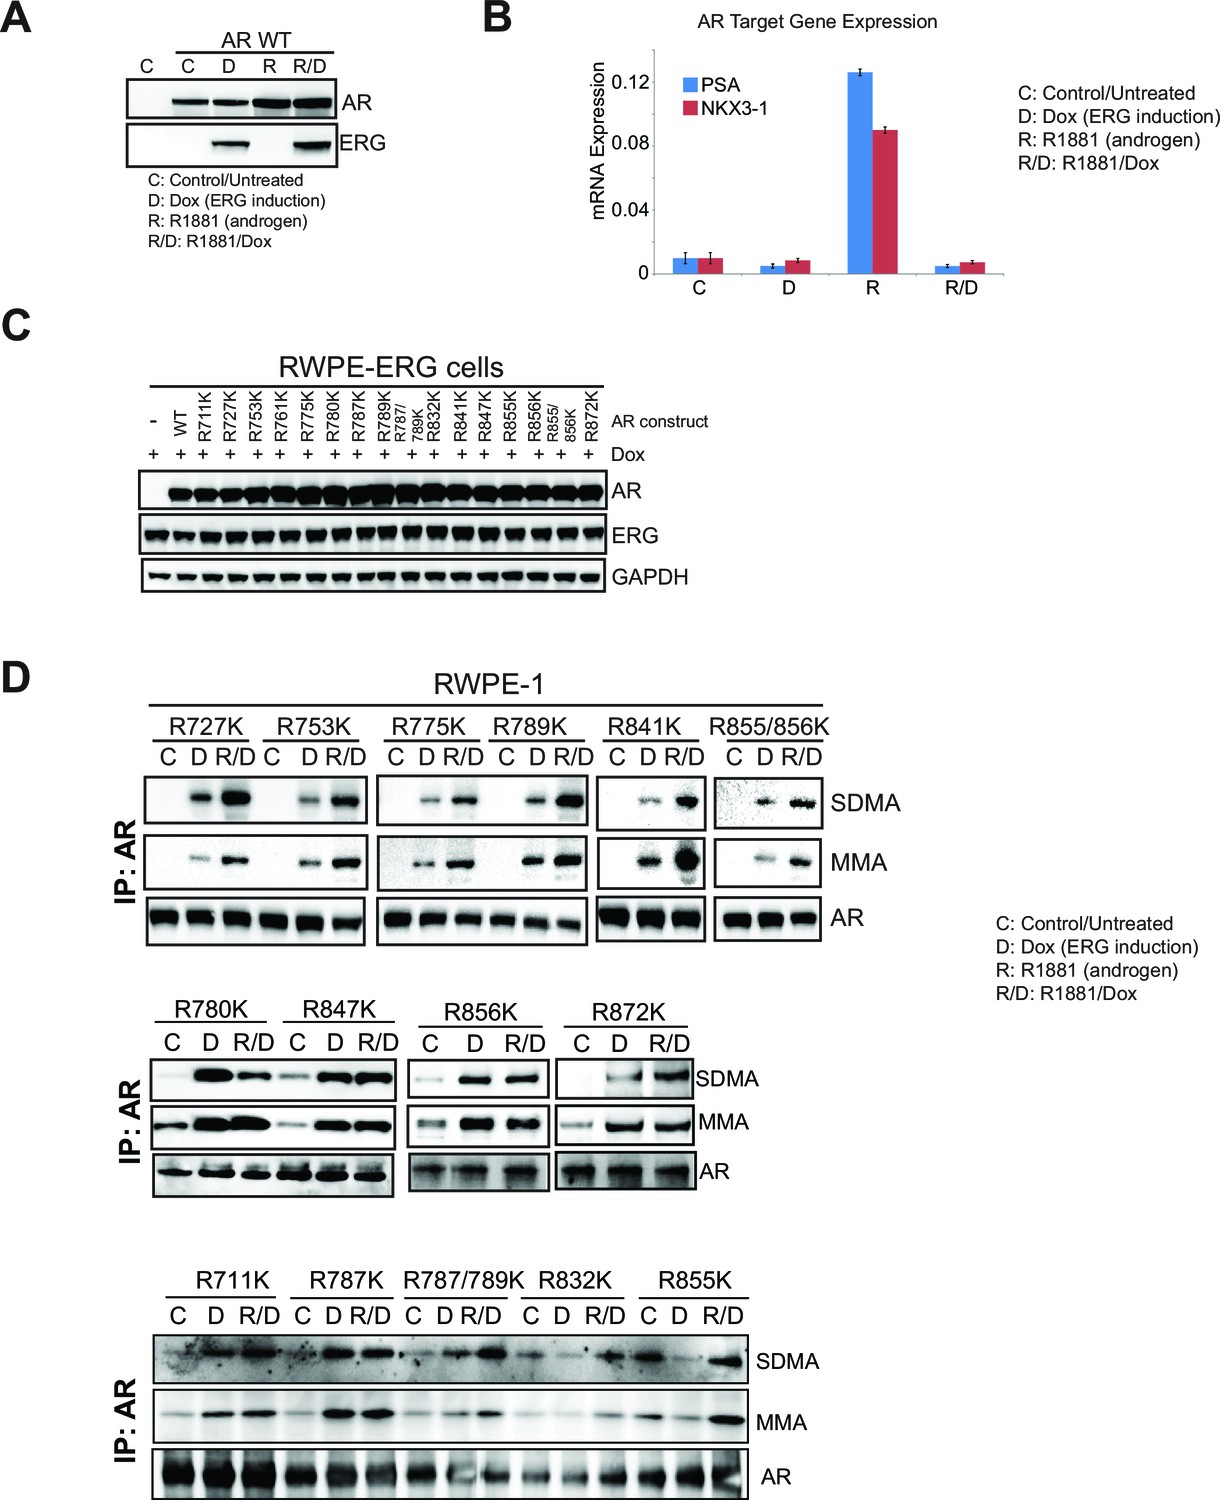
(B) RWPE-1 control cells and stably expressing AR wild type (AR WT) were either left untreated (C) or treated with 100ng/ml doxycycline (D) to induce ERG expression, in the absence (D) or presence (R/D) of 1nM R1881 for 24 hr. Western blot analysis shows expression levels of AR and ERG. (B) qRT-PCR of the luminal genes PSA (blue) and NKX3-1 (red) from RWPE-1 cells treated as in (A). Data represent normalized expression of PSA and NKX3-1 mRNA relative to the B2M transcript. Error bars represent + SEM of three replicates. (C) Western blot analysis of AR, ERG and GAPDH expression levels from RWPE-1 parental cells or cells stably expressing either AR wild type (WT), R711K, R727K, R753K, R761K, R775K, R780K, R787K, R789K, R787/789K, R832K, R841K, R847K, R855K, R856K, R855/856K or R872K AR mutant. (D) RWPE-1 cells stably expressing either AR R711K, R727K, R753K, R775K, R780K, R787K, R789K, R787/789K, R832K, R841K, R847K, R855K, R856K, R855/856K or R872K mutant were used for AR IP followed by western blot analysis for MMA, SDMA and total AR levels.
Figure 4 with 1 supplement

R761 methylation regulates AR recruitment, transcription, and proliferation.
(A) Model of AR LBD (PDB: 2AO6; yellow) and AR DBD (PDB: 1R4I; green) interactions (see Materials and methods). A modeled di-methylated R761 is shown (red). Grey ribbon: TIF2 coactivator peptide. Cyan spheres: R1881. DNA is shown as orange/blue sticks. (B) AR ChIP qPCR for regions of the PSA gene as in Figure 2D from RWPE-1 cells expressing wild-type (WT, left) AR or AR R761K (right). DOX: ERG expression; R1881 is 1nM. Error bars represent + SEM of three biological replicates, each with three technical repeats. (C) PSA qRT-PCR in RWPE-1 cells expressing WT AR (left) or AR R761K (right). Error bars represent + SEM of three biological replicates, each with three technical repeats. (D) RWPE-1 parental cells and cells expressing either wild type AR (AR WT) or AR R761K mutant were left either untreated (control) or treated with 0.1, 1 or 5nM R1881 for 6 days and confluence measurements (see Materials and methods for description) were collected. Error bars represent + SEM of three biological replicates, each with three technical repeats. (E) PSA qRT-PCR from VCaP cells expressing the noted AR constructs, grown in androgen-depleted media (charcoal-stripped serum). (F) VCaP cell proliferation upon expression of the noted AR constructs.
Figure 4—figure supplement 1
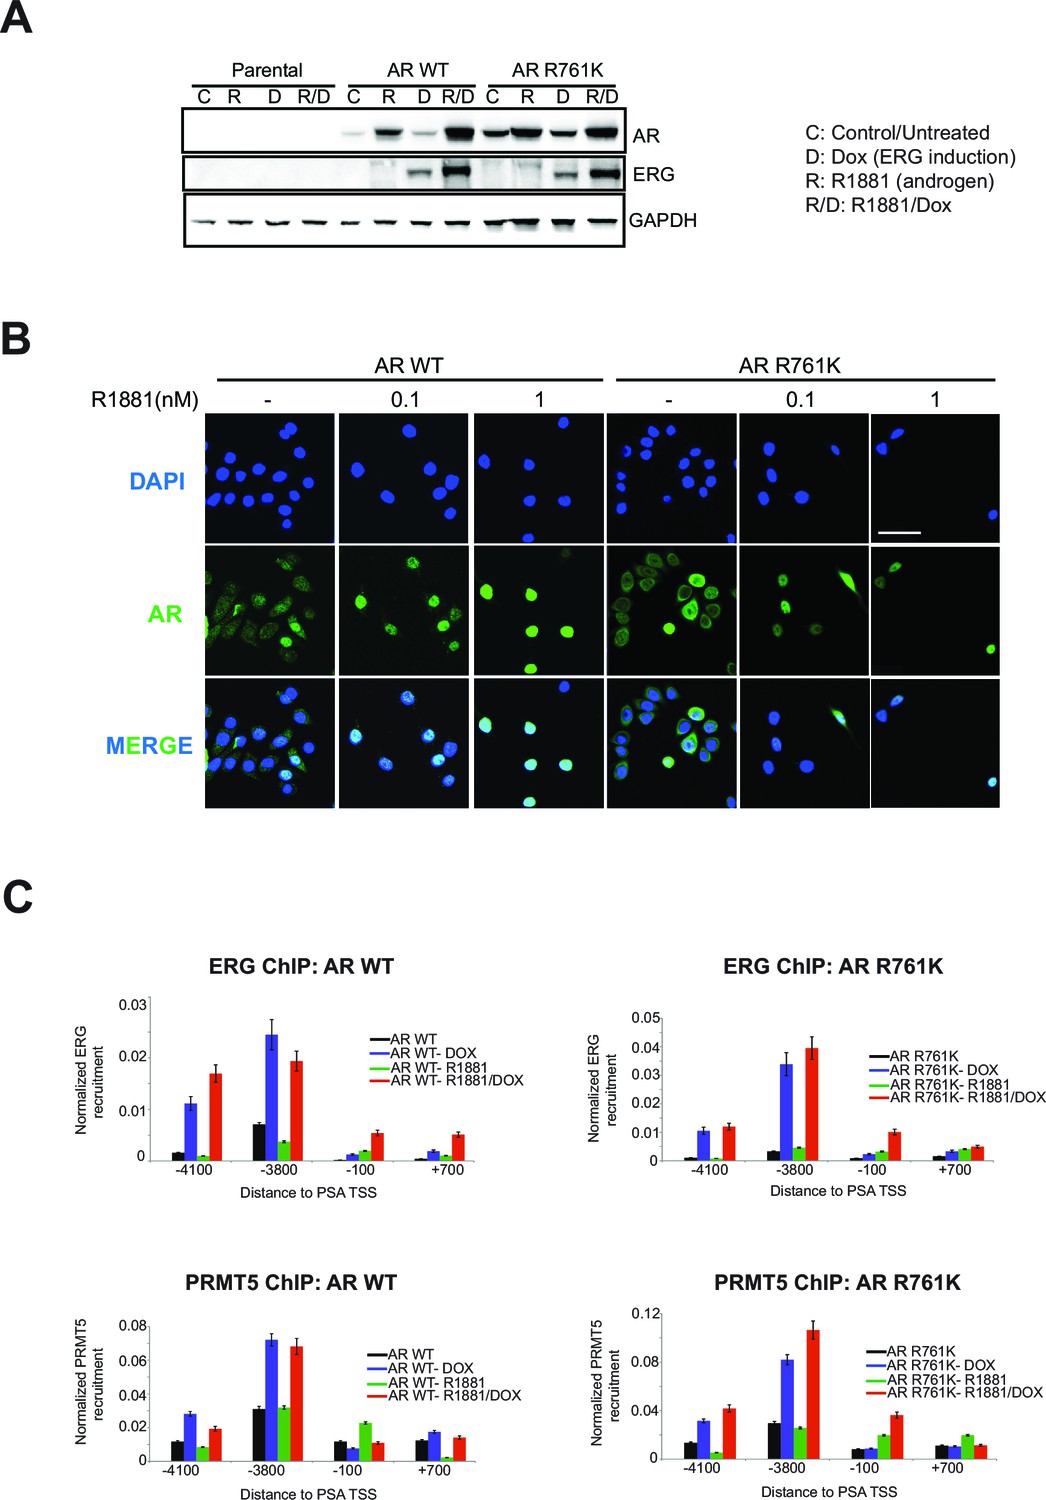
AR R761K mutation effects in RWPE-1.
(A) Western blot of RWPE-1 parental cells and cells stably expressing AR wild type (AR WT) or AR R761K mutant. Cells were either untreated (C) or treated with 100ng/ml doxycycline (D) to induce ERG expression, in the absence or presence of 1 nM R1881 for 24 hr (R, R/D). Blots for AR, ERG, and GAPDH are shown. (B) Representative immunofluorescence images of AR from RWPE-1 cells stably expressing either AR WT or R761K mutant. Cells were either untreated (-) or treated with 0.1 or 1nM R1881 for 24 hr. Cells were also stained with DAPI to visualize nuclei. Cells were fixed and stained as described in Materials and methods. Scale bar, 50 µm. Data shown is a representative example of three biological replicates. (C) ChIP qPCR of ERG (top row) and PRMT5 (bottom row) at the PSA promoter and enhancer regions in RWPE-1 cells expressing either wild type AR (AR WT, left column) or AR R761K mutant (right column) in the absence and presence of ERG (Dox) or R1881 (R; 1nM for 24 hrs). All recruitments are normalized to the IgG control ChIP. Error bars represent + SEM of three biological replicates, each with three technical repeats.
Author Response Image 1

Additional files
-
Supplementary file 1
shRNA screen hits selective to ERG-positive prostate cancer
- https://doi.org/10.7554/eLife.13964.015
-
Supplementary file 2
List of candidate ERG protein interactors identified by Mass Spectrometry analysis of an ERG pulldown
- https://doi.org/10.7554/eLife.13964.016
-
Supplementary file 3
PRMT5 activated pathways
- https://doi.org/10.7554/eLife.13964.017
Download links
A two-part list of links to download the article, or parts of the article, in various formats.
Downloads (link to download the article as PDF)
Open citations (links to open the citations from this article in various online reference manager services)
Cite this article (links to download the citations from this article in formats compatible with various reference manager tools)
ERG signaling in prostate cancer is driven through PRMT5-dependent methylation of the Androgen Receptor
eLife 5:e13964.
https://doi.org/10.7554/eLife.13964


