Many-molecule encapsulation by an icosahedral shell
- Brandeis University, United States
Figures
Figure 1
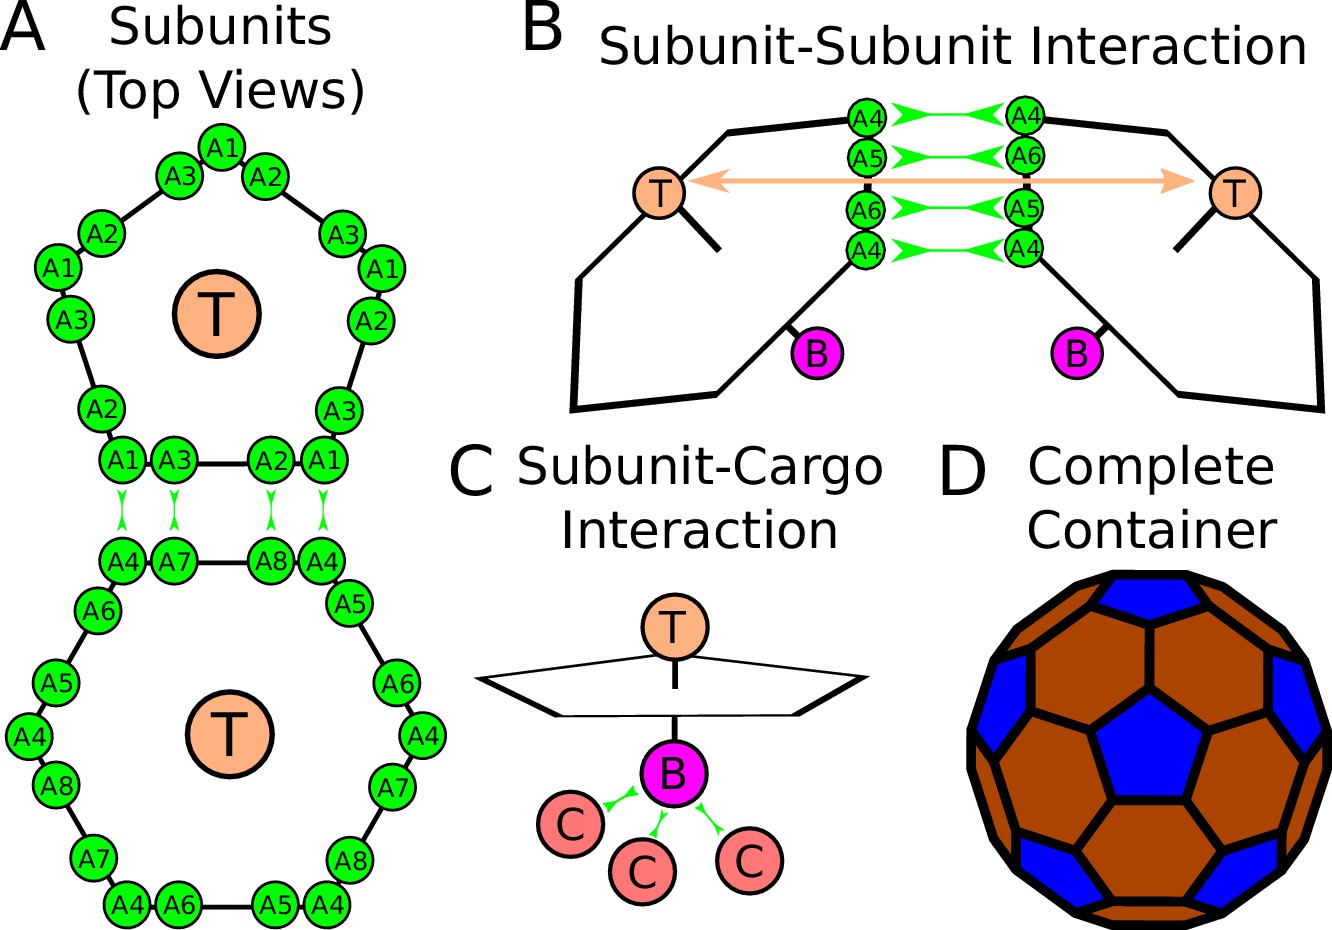
Description of the model.
(A) Each shell subunit contains ‘Attractors’ (green circles) on the perimeter, a ‘Top’ (tan circle, ‘T’) in the center above the plane, and a ‘Bottom’ (purple circle, ‘B’ below the plane). (B) Interactions between complementary Attractors drive subunit dimerization, with the Top-Top repulsions (tan arrow) tuned to favor the subunit-subunit angle in a complete shell. Complementary pairs of attractors are indicated by green arrows in (A) for the pentamer-hexamer interface and in (B) for the hexamer-hexamer interface. (C) Bottom psuedoatoms bind cargo molecules (terra cotta circles, ‘C’), while excluder atoms (blue and brown pseudoatoms in (D)) placed in the plane of the pentagon experience excluded volume interactions with the cargo. (D) The positions of excluder atoms in the lowest energy shell geometry, a truncated icosahedron with 12 pentamers (blue) and 20 hexamers (brown).
Figure 2 with 2 supplements
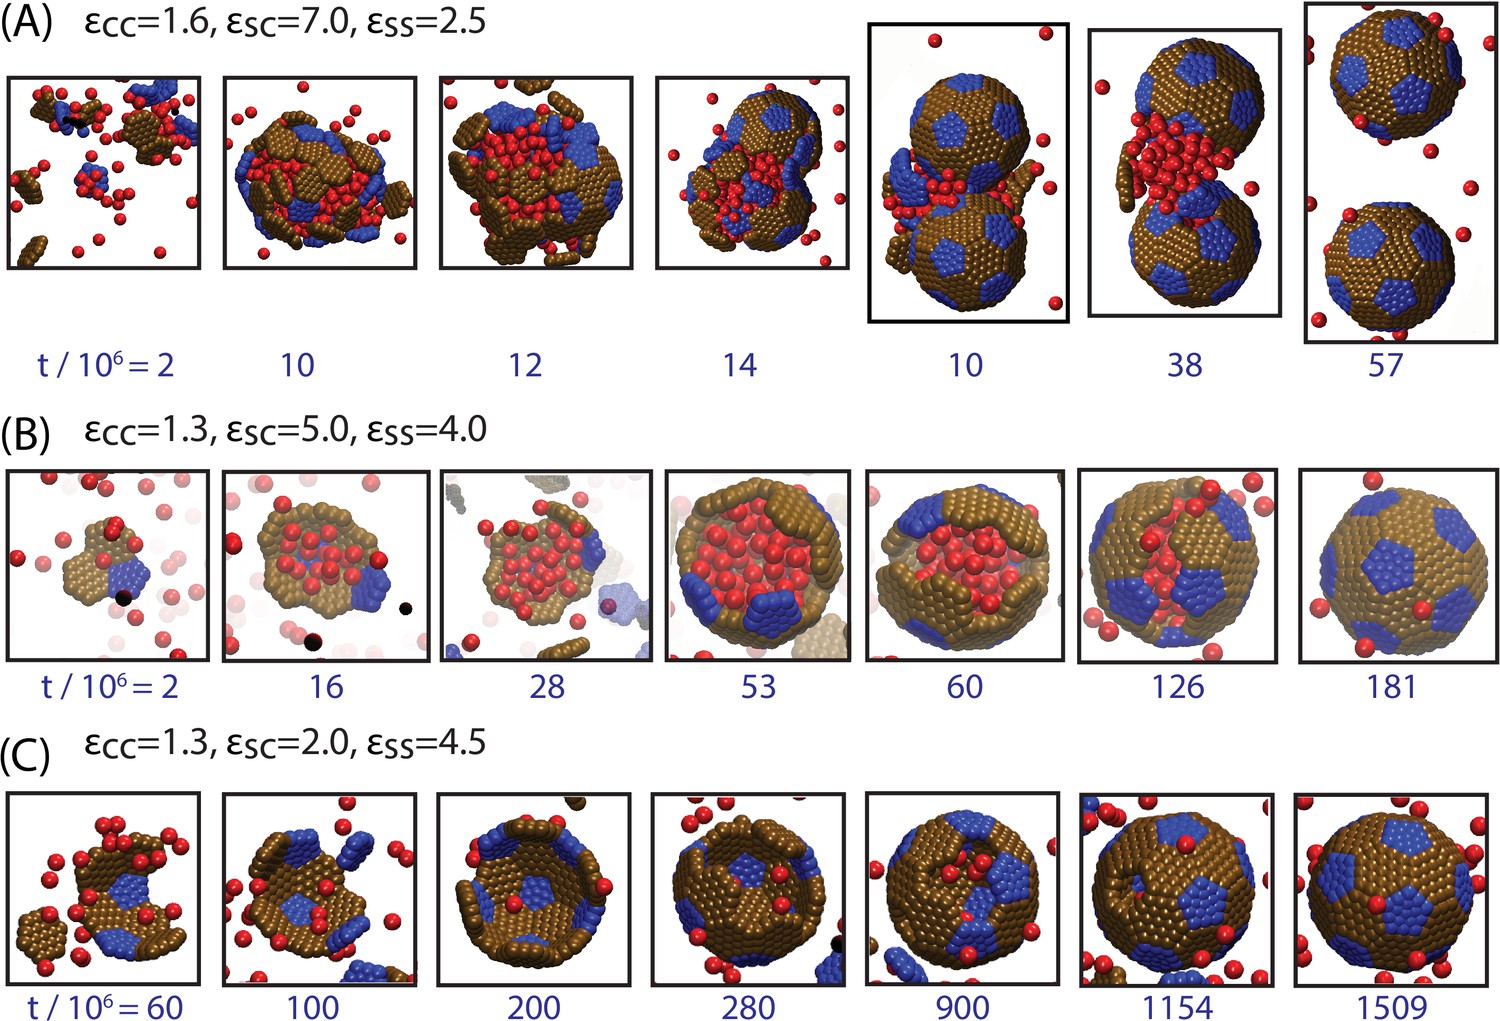
Snapshots illustrating typical assembly trajectories.
(A) Multi-step assembly involving an amorphous globule of cargo and shell subunits. (B) Single-step assembly, in which shell assembly drives local cargo condensation. and (C) when shell-cargo interactions are too weak to condense the cargo. The values of the cargo-cargo (), shell subunit-cargo (), and subunit-subunit () interaction strengths are listed above each panel (all energies are in units of the thermal energy ), and the time (in units of timesteps) is noted below each image. The color scheme here and throughout the manuscript is: Red=Cargo, Blue=Pentagon Excluder, Brown=Hexagon Excluder. Attractor and Bottom pseudoatoms are omitted to aid visibility. Videos of assembly trajectories are included below.
Figure 2—figure supplement 1
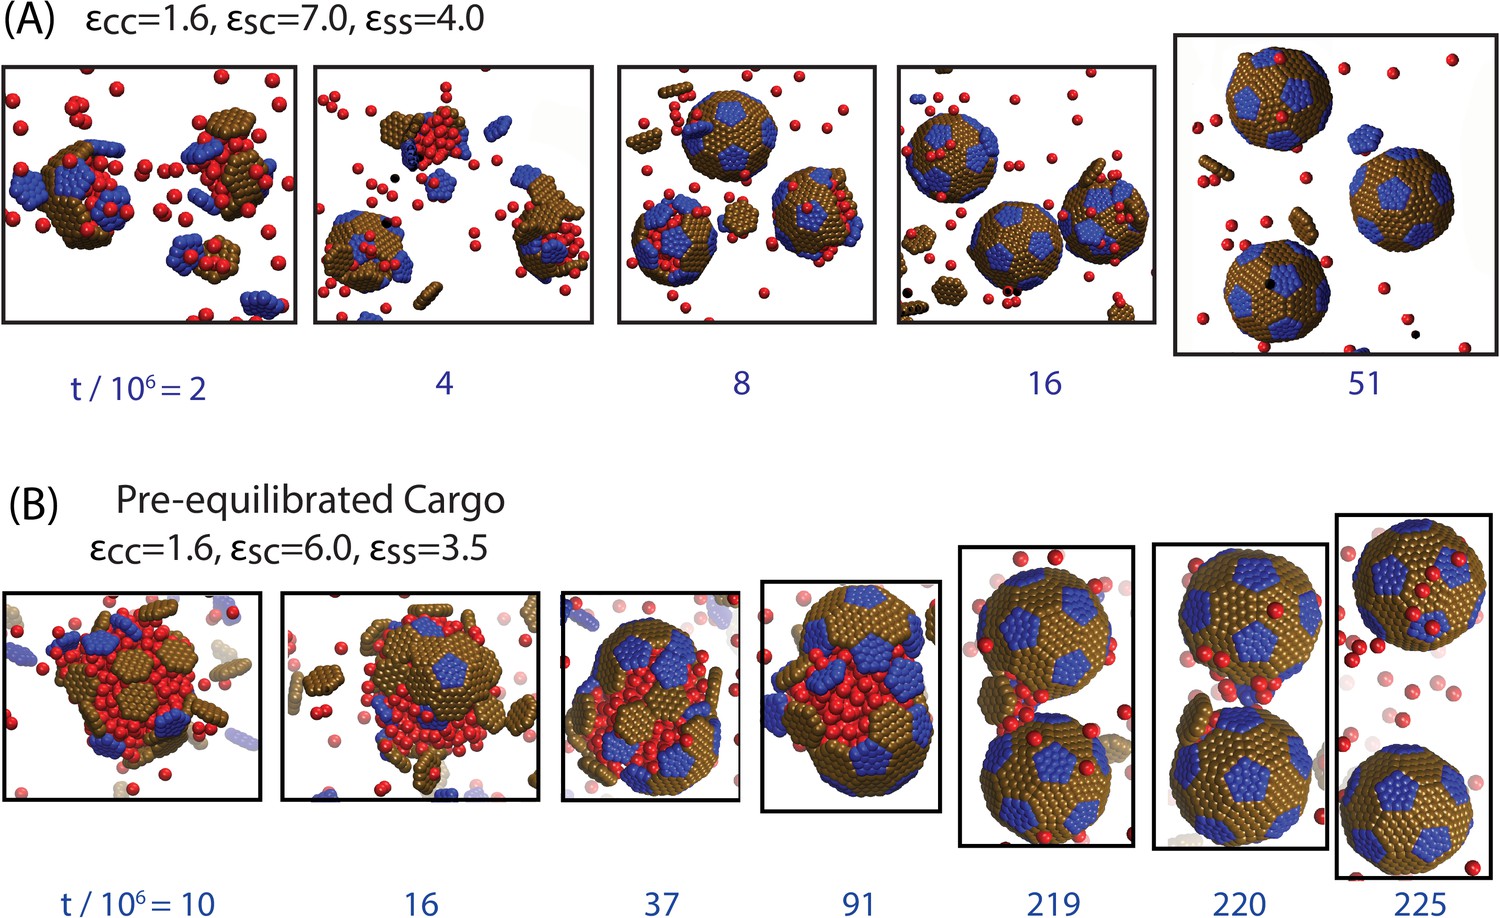
Snapshots from additional trajectories, including a trajectory with a pre-equilibrated cargo globule.
(A) Globule-mediated assembly under stronger shell-cargo interactions, leading to the simultaneous formation of multiple globules. Parameters are indicated in the figure, and the initial conditions are random (no pre-equilibration). (B) Assembly around a pre-equilibrated cargo globule (see text and Figure 3—figure supplement 1 for an explanation of this alternative initial condition).
Figure 2—figure supplement 2
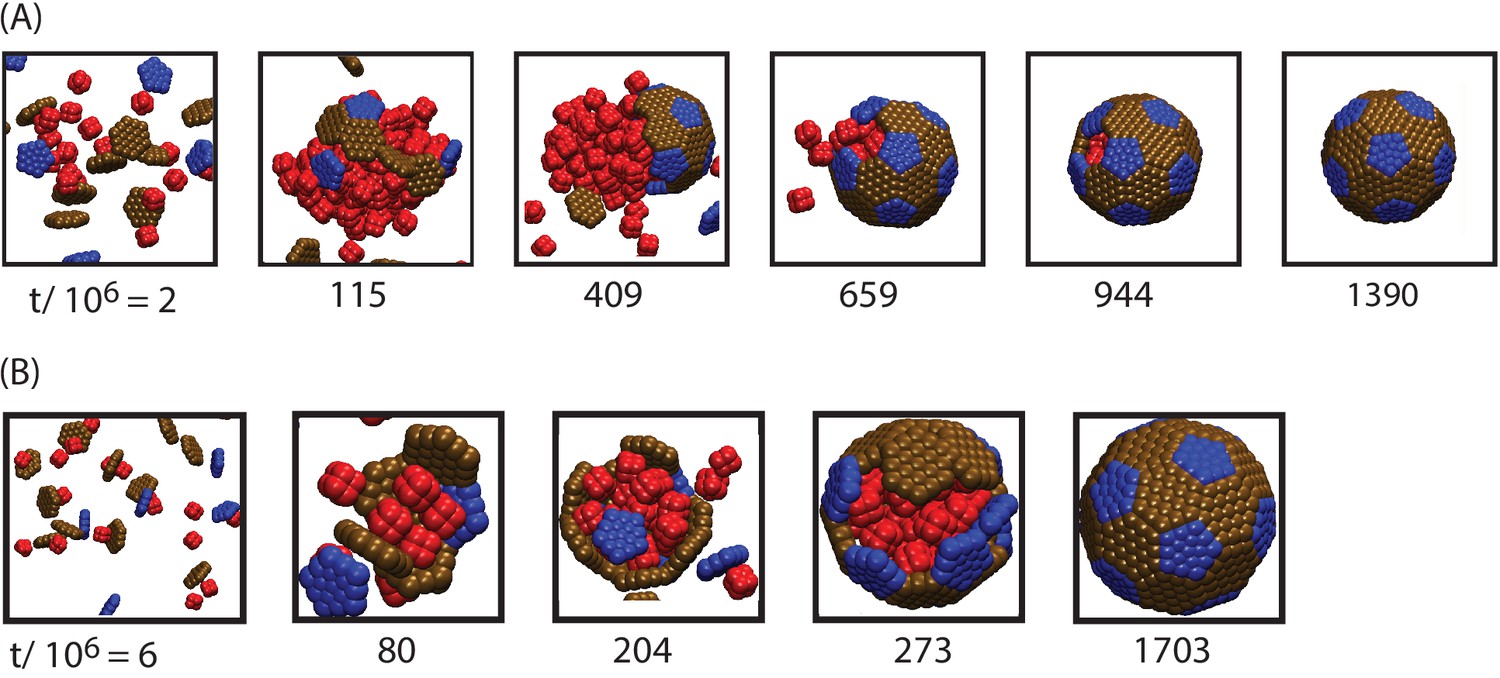
Snapshots from assembly trajectories around anisotropic cargo particles, for (A) strong cargo-cargo interactions leading to two-step, globule-mediated assembly, and (B) weak cargo-cargo interactions leading to simultaneous assembly and cargo condensation.
Motivated by the octomer structure of RuBisCO, we constructed model cargo particles, each containing eight pseudoatoms positioned at the corners of a cube, with center-to-center spacing of . Each pseudoatom interacts with other particles in the system as described for cargo particles in appendix 1. Parameters are (A) , , , and (B) , , , (the magnitude of the shell-cargo and cargo-cargo interaction strengths is reduced because multiple cargo pseudoatoms participate in each interaction). To keep the cargo volume fraction equal to those in other simulations in this manuscript, we set the number of octomer cargo particles to 132 (each has a volume of ). Other parameters are as described in the Model section.
Figure 3 with 3 supplements
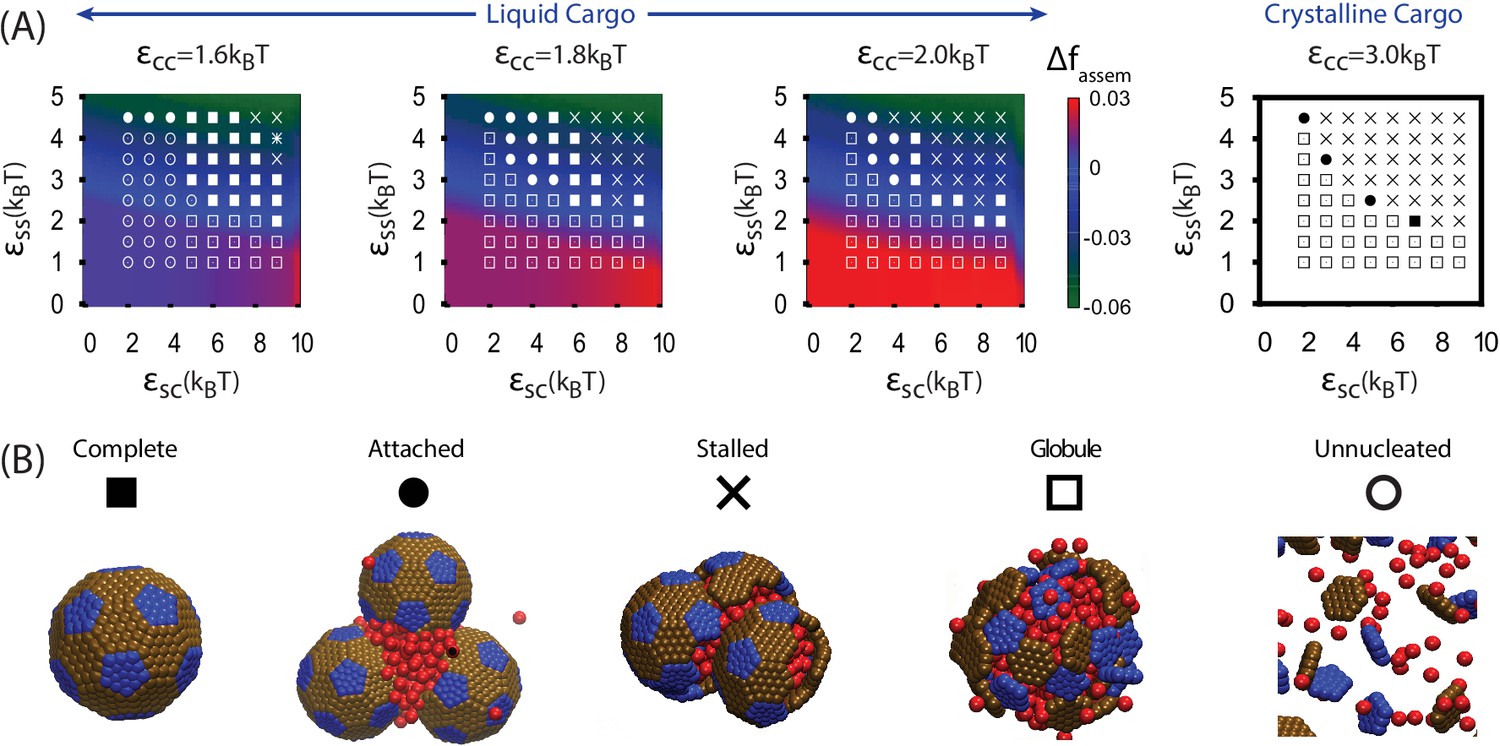
Results of assembly around a cargo globule.
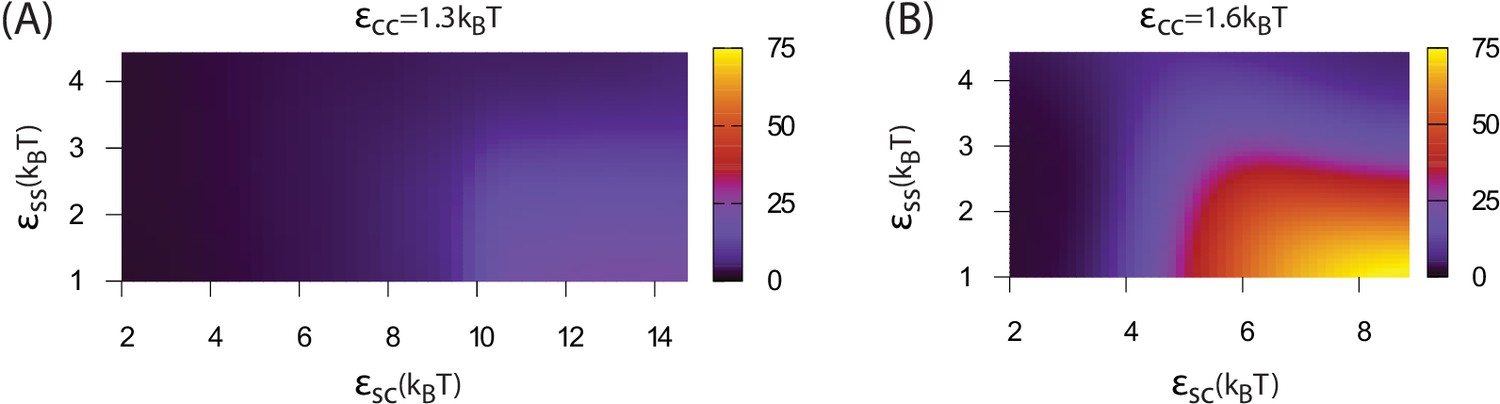
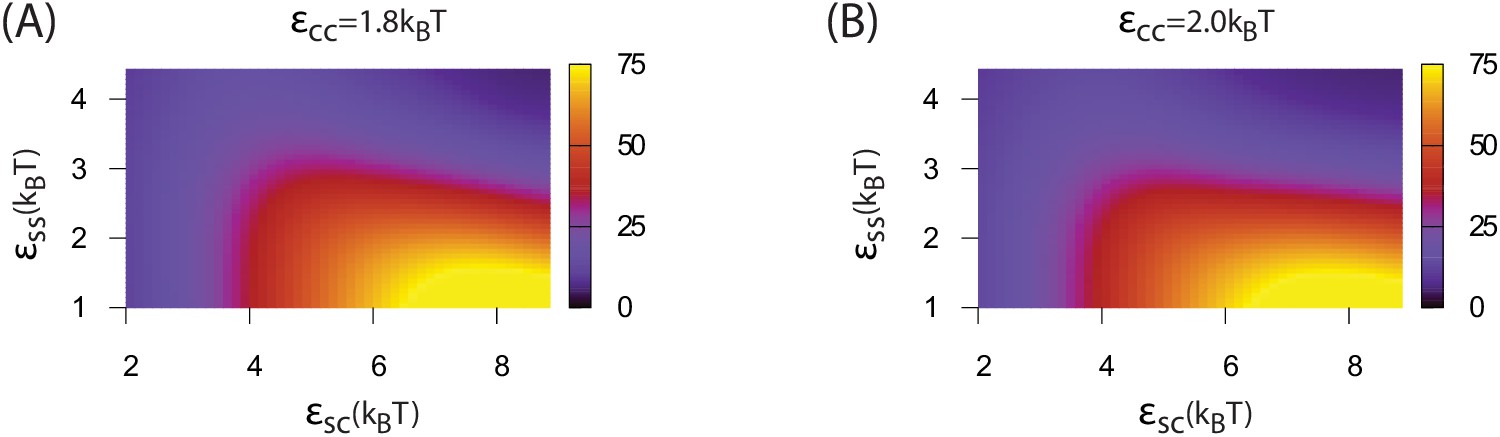
(A) The most frequently observed assembly outcome is overlaid on a color map of the theoretical free energy density difference (Equation (3)) between assembled shells and the unassembled globule. Results are plotted against the shell-cargo adsorption strength and the shell-shell interaction strength for indicated values of the cargo-cargo interaction strength . (B) Representative snapshots of the predominant assembly outcomes shown in (A).
-
Figure 3—source data 1
List of all simulation outcomes for Figures 3A,5A.
- https://doi.org/10.7554/eLife.14078.010
-
Figure 3—source data 2
Criteria used to categorize assembly outcomes.
The sizes of each cargo globule and shell assemblage, and associations between shell assemblages and cargo globules, were determined by clustering. The outcome was then categorized according to the criteria listed in this table.
- https://doi.org/10.7554/eLife.14078.011
Figure 3—figure supplement 1
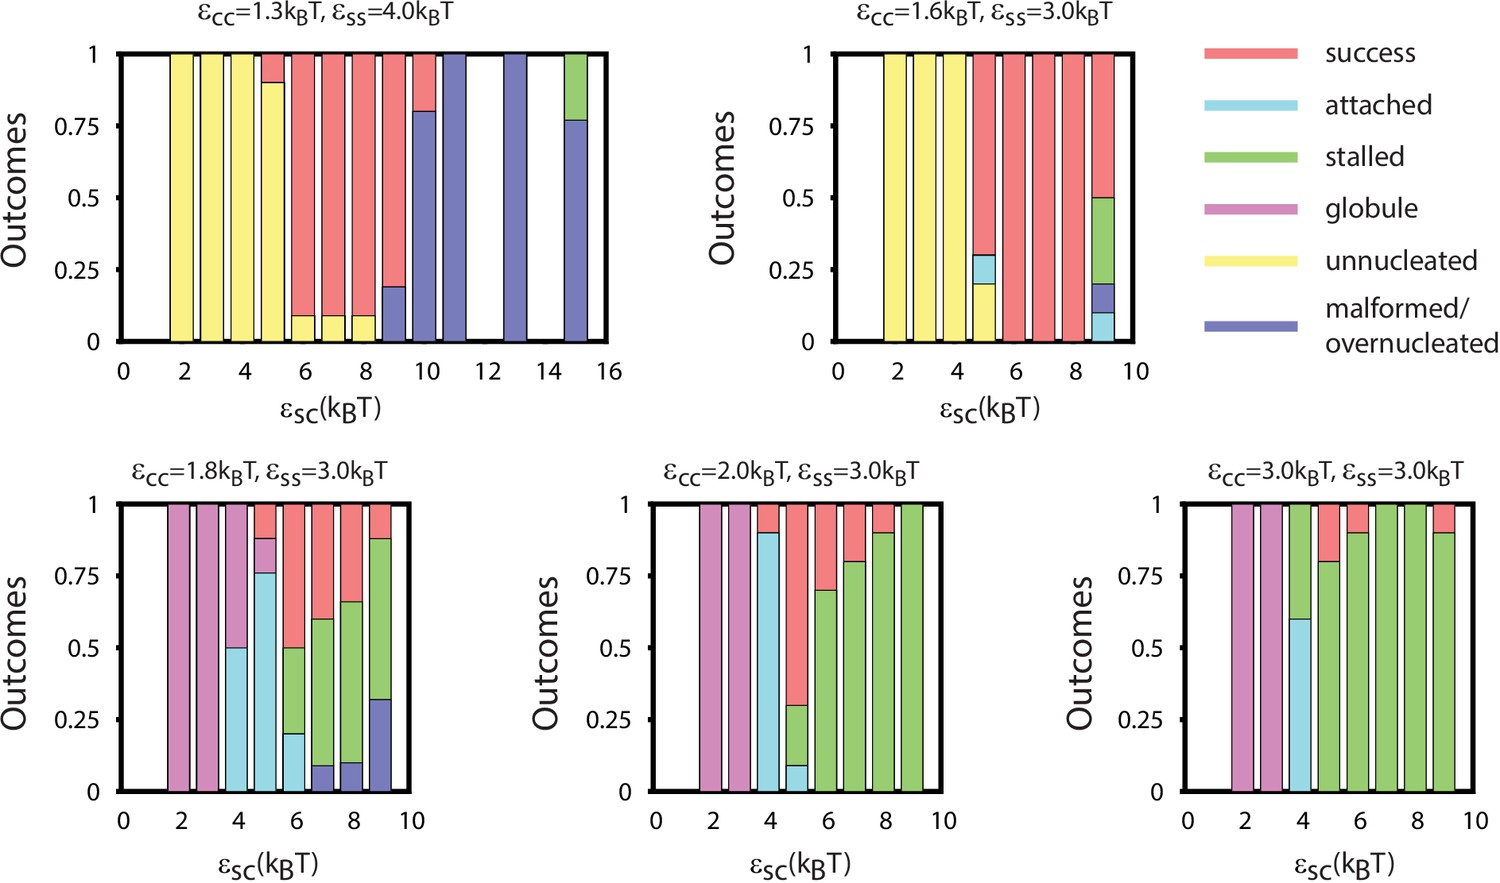
The distribution of assembly outcomes in Figure 3A is shown as a function of for indicated values of and .
Ten simulations were performed at each set of parameter values. Representative snapshots corresponding to each outcome are shown in Figure 3B. Simulations were performed for timesteps.
Figure 3—figure supplement 2
Results of assembly around a pre-equilibrated cargo globule.
The most frequently observed assembly outcome is overlaid on a color map of the theoretical free energy density difference (Equation (3)) between assembled shells and the unassembled globule. Results are plotted against the shell-cargo adsorption strength and the shell-shell interaction strength for indicated values of the cargo-cargo interaction strength . Outcomes are defined as in Figure 3B of the main text. The outcome of each simulation for this figure is listed in Figure 3—figure supplement 2—source data 1.
-
Figure 3—figure supplement 2—source data 1
List of all simulation outcomes for Figure 3—figure supplement 1—2.
- https://doi.org/10.7554/eLife.14078.014
Figure 3—figure supplement 3
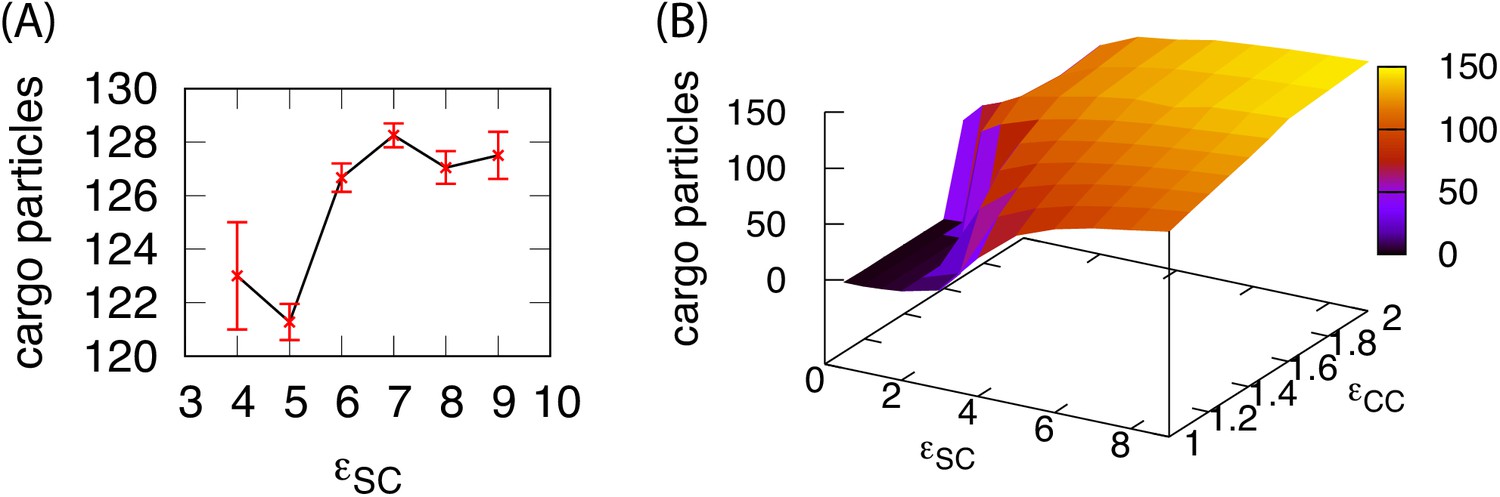
The number of cargo particles packaged as a function of parameters.
(A) The mean number of cargo molecules encapsulated by shells assembled in dynamics simulations for . The results are averaged over all complete shells (for any ) assembled at each value of , the error bars indicate 95% confidence intervals. (B) The equilibrium number of cargo particles packaged in shells as a function of the shell-cargo and cargo-cargo interaction strengths. The equilibrium cargo loading was calculated by performing simulations initialized with a pre-assembled shell, for which the excluders on one subunit were made permeable to cargo particles. We then performed two simulations at each parameter set, each of length timesteps.
Figure 4 with 1 supplement
Dependence of assembly pathway on shell-cargo and shell-shell interaction strength.
The assembly order parameter, defined as the maximum number of unassembled shell subunits adsorbed on a globule at any point during a trajectory, is shown as a function of and for indicated values of the cargo-cargo interaction . Large numbers of adsorbed unassembled subunits () indicate the two step assembly mechanism (Figure 2A), whereas smaller values correspond to simultaneous assembly and cargo condensation (Figure 2B).
Figure 4—figure supplement 1
Assembly order parameter values for and .
https://doi.org/10.7554/eLife.14078.017
Figure 5 with 2 supplements

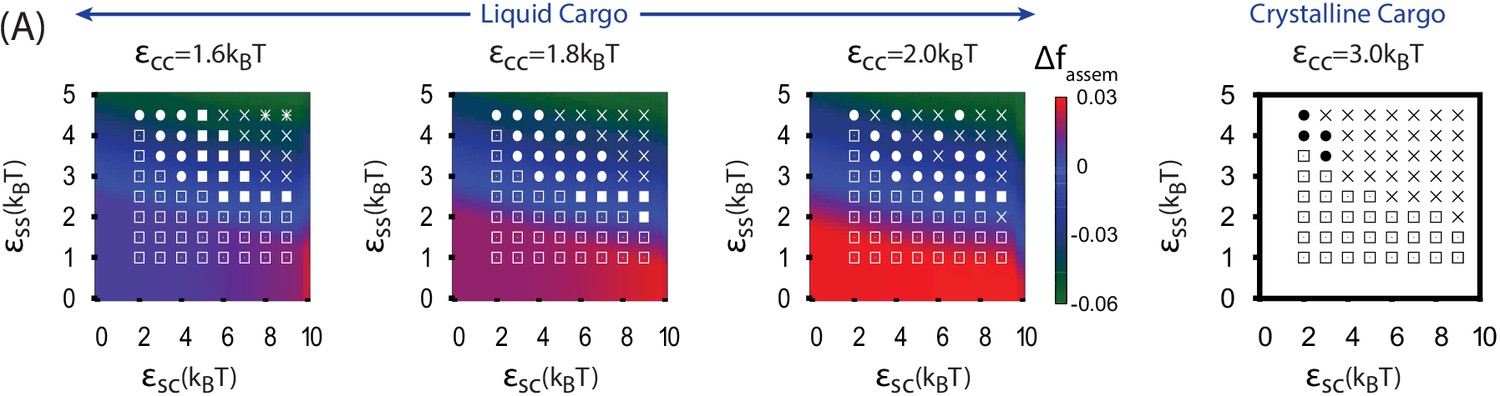
Results of assembly around a cargo with weak interactions ().
(A) The most frequently observed assembly outcome as a function of and . The distribution of outcomes for is shown in Figure 3—figure supplement 2, and a data file containing the outcome for each trial at each parameter set is included (Figure 3—source data 1). (B) Representative snapshots for the outcomes shown in (A). The complete shell outcomes are shown with the excluders rendered opaque (left) and transparent (right) to enable visualizing the encapsulated cargo. (C) The number of cargo molecules encapsulated by shells assembled in dynamics simulations (red symbols) is compared to the results of equilibrium simulations (black line). The dynamics results are averaged over all complete shells (for any ) assembled at each value of , the error bars indicate 95% confidence intervals. Most simulations were performed for timesteps; simulations with , , and exhibited partially assembled shells at timesteps, and were continued up to timesteps.
Figure 5—figure supplement 1
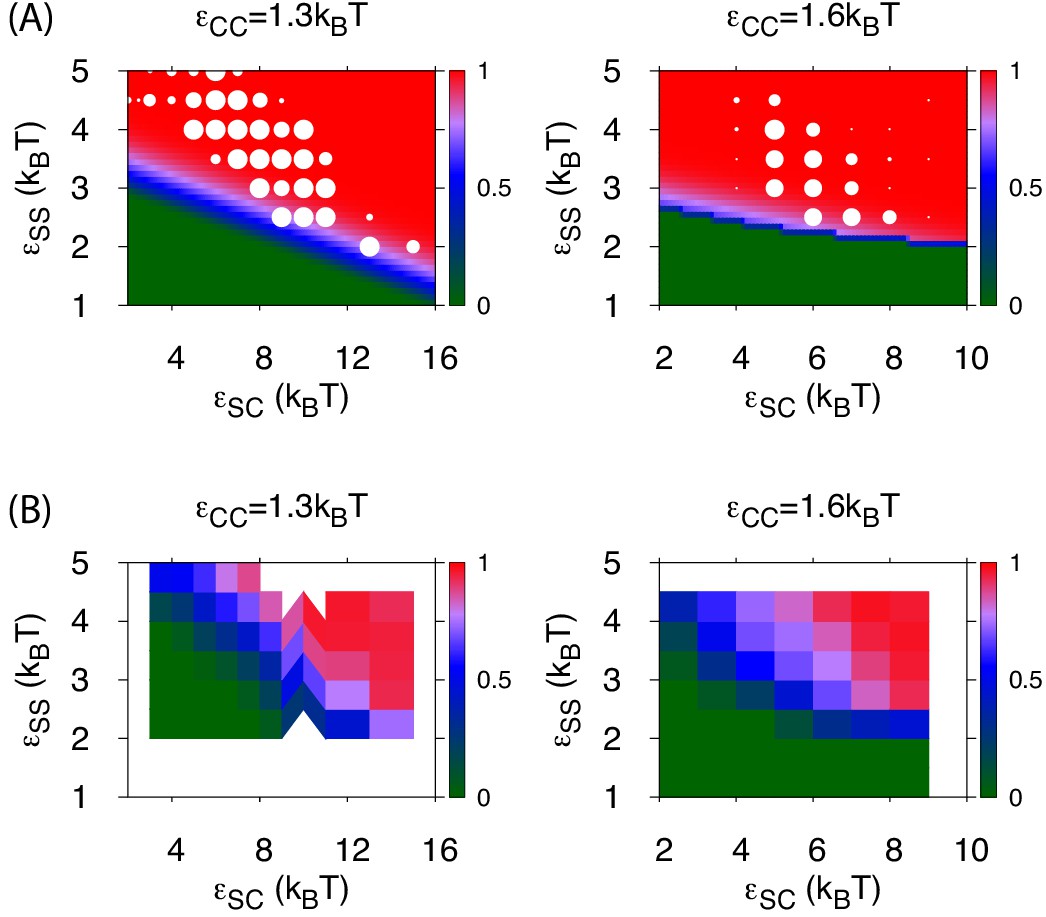
Assembly yields calculated by simulation and theory.
(A) The color map shows the fraction of subunits in assembled shells () obtained from numerically solving Equation (1–2), using the parameter values described in appendix 2, as a function of and for assembly around gas phase cargo (left) and assembly and budding from a pre-equilibrated globule (right). The white circles overlaid on the plots quantify the fraction of dynamical simulations that led to at least one well-formed capsid (defined as shells containing 12 pentamers and 20 hexamers, each interacting with respectively 5 or 6 neighbors). The size of each white circle is proportional to the yield obtained from dynamical simulations at that parameter set, with the largest circle corresponding to 100%. (B) The color map shows the simulation result for the fraction of subunits in of any type of assemblage (defined as any assemblage comprising 10 or more subunits) as a function of and for (left) and (right). We see that the theoretical prediction of the onset of assembly roughly corresponds to the boundary between assembly and no assembly in the simulations, except that the simulation boundary is seen at slightly higher parameter values in all cases, and for the simulation boundary slopes upward with more sharply than the theoretical prediction. Both of these differences can be attributed to prohibitive nucleation barriers which arise for parameter values near the threshold equilibrium values. As discussed in the main text, decreasing reduces the ability for a partially assembled shells to condense cargo molecules, leading to longer nucleation timescales and hence a wider range of between the equilibrium threshold for assembly and the threshold for observing nucleation within our simulation timescale.
Figure 5—figure supplement 2
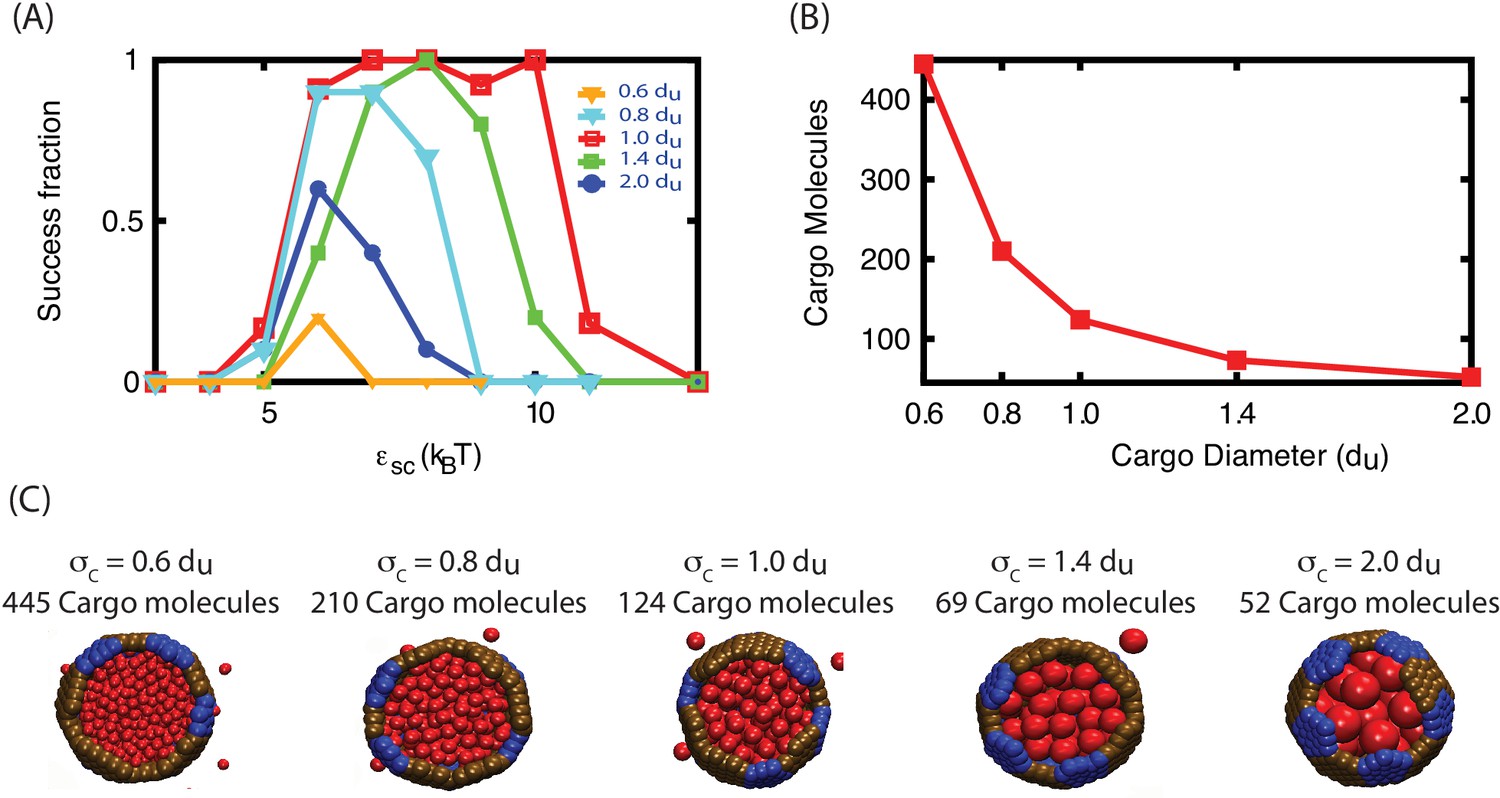
The effect of varying cargo diameter on assembly.
(A) The fraction of trajectories resulting in assembly of a complete shell is shown as a function of for indicated cargo diameters () and . Each data point corresponds to 10 independent simulations. (B) The maximum number of cargo particles encapsulated into a complete shell for each diameter in the simulations shown in (A). (C) Cutaway view of assembled shells corresponding to each data point in (B). Further information. For most results shown in this article, we set the size of the cargo to be commensurate with the size of the shell subunits. This is qualitatively consistent with BMCs; e.g., for carboxysomes the diameter of a RuBisCO holoenzyme is about twice the circum-diameter of a hexamer or pentamer. To investigate how sensitive cargo encapsulation is to the ratio of cargo and shell subunits sizes, we performed additional simulations with cargo diameters in the range , where is the cargo diameter in Equation (A5). In these simulations we maintained a constant cargo volume fraction and box size, so the number of simulated cargo particles varies inversely with the cargo volume. As shown in (A), assembly can accommodate such variations in the cargo diameter, but the yields and robustness to variations in diminish as varies from 1. This may suggest that commensurate shell subunits and cargo sizes are optimal for encapsulation; however, further exploration is required to determine whether varying other parameters such as the cargo volume fraction or the length scale of the subunit-cargo interaction would change this result.
Figure 6 with 1 supplement
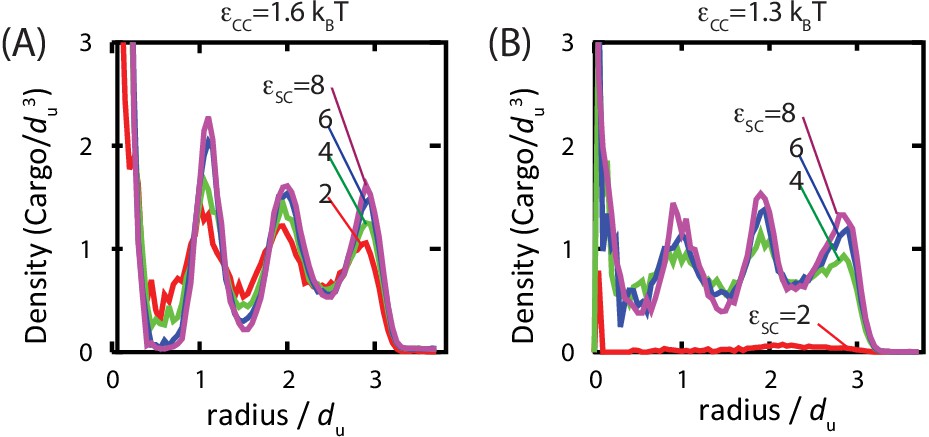
Order of the encapsulated cargo.
The spherically averaged density of cargo molecules inside a shell is shown as a function of radius for (A) and (B) for indicated values of the cargo-shell adhesion strength , measured in equilibrium simulations. The density of the encapsulated cargo ranges from below random close packing to near hexagonal close packing density as and are increased (see Figure 3—figure supplement 3). A snapshot of cargo inside the shell is shown in Figure 5—figure supplement 2. The raw data for this figure is provided in Figure 6—source data 1.
-
Figure 6—source data 1
Raw data for Figure 6.
- https://doi.org/10.7554/eLife.14078.023
Figure 6—figure supplement 1
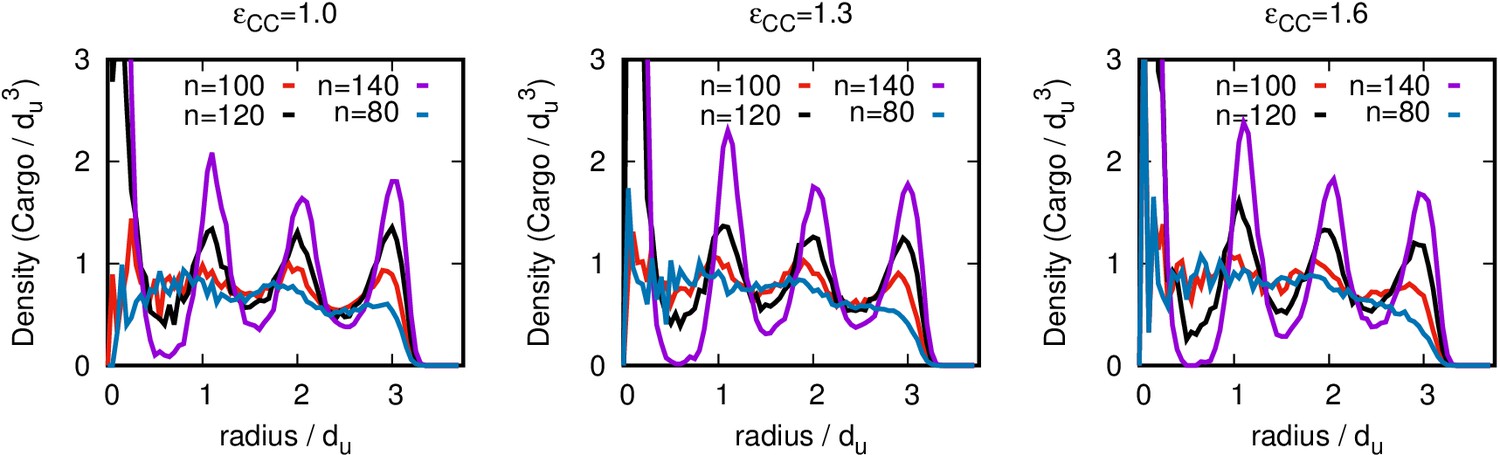
Ordering of the encapsulated cargo is primarily driven by confinement, not adhesion to the inner surface of the shell.
The spherically averaged density distribution is shown as a function of distance from the shell center, for simulations in which a preset number of cargo molecules are trapped within a complete shell, with the cargo-shell attraction turned off (). The value of corresponding to each curve is given in the legend, and the value of the subunit-shell energy is shown above each plot. These simulations were each run for timesteps. The simulations shown in Figure 6 were also run with a complete shell; however, one excluder was rendered permeable to cargo molecules allowing the number of encapsulated cargo molecules to equilibrate. Those simulations were also each run for timesteps. Raw data for this figure is provided in Figure 6—figure supplement 1—source data 1.
-
Figure 6—figure supplement 1—source data 1
Raw data for Figure 6—figure supplement 1.
- https://doi.org/10.7554/eLife.14078.025
Appendix 2—figure 1
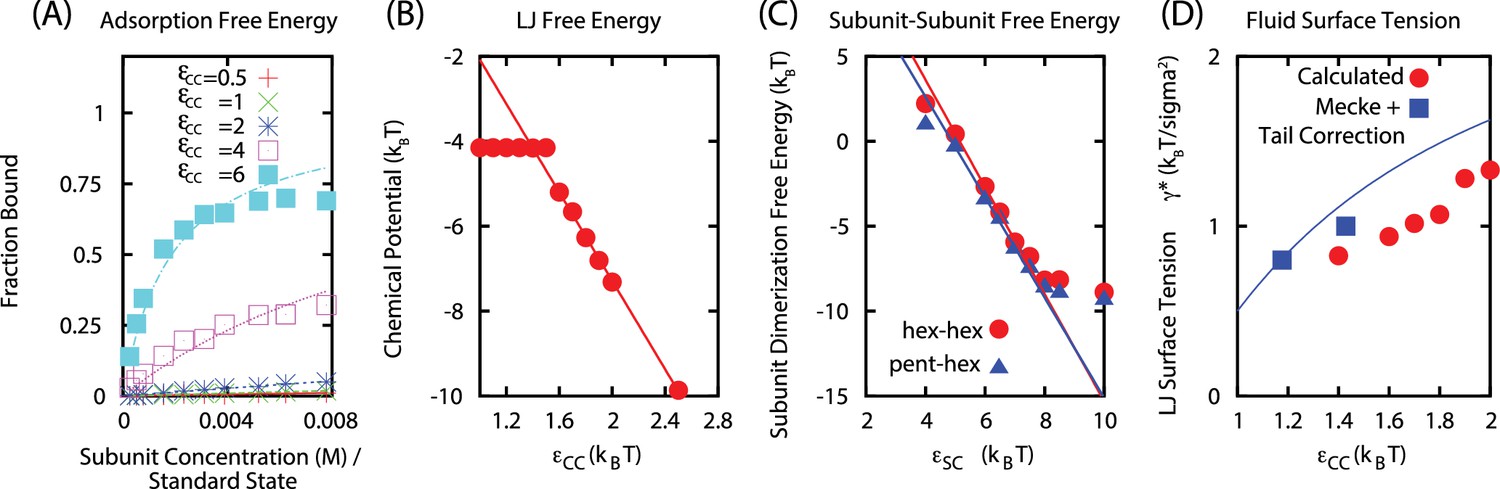
(A) Langmuir isotherms to estimate .
(B) Estimate of the chemical potential for an equilibrated LJ system (before correcting for the finite size of liquid droplet). (C) Fit of the subunit dimerization free energies and as a function of the well depth parameter . (D) Fit of LJ droplet surface tension, including the tail correction.
Videos
Video 1
Animation of a typical simulation showing assembly around a cargo globule.
Parameters are , , and .
Video 2
Animation of a typical simulation showing simultaneous assembly and cargo condensation.
Parameters are , , and .
Video 3
Animation of a simulation with a pre-equilibrated cargo globule.
Parameters are , , and .
Tables
Table 1
| Symbol | Name | Description |
|---|---|---|
| ▪ | Complete shell (full) | Complete shell, full of cargo molecules |
| ◆ | Complete shell (empty)r | Complete shell, almost empty of cargo molecules |
| ⚫ | Attached | Nearly complete shells attached to a globule by a neck of cargo |
| ✳ | Over-nucleated/Malformed | Multiple globules, with incomplete or malformed shells on their surfaces |
| Stalled | Large globule with multiple incomplete or malformed shells on its surface | |
| Globule | Cargo globule with unassembled shell subunits on its surface | |
| Unnucleated | Diffuse subunits and cargo molecules |
Download links
A two-part list of links to download the article, or parts of the article, in various formats.
Downloads (link to download the article as PDF)
Open citations (links to open the citations from this article in various online reference manager services)
Cite this article (links to download the citations from this article in formats compatible with various reference manager tools)
Many-molecule encapsulation by an icosahedral shell
eLife 5:e14078.
https://doi.org/10.7554/eLife.14078


