Acute exposure to apolipoprotein A1 inhibits macrophage chemotaxis in vitro and monocyte recruitment in vivo
- University of Oxford, United Kingdom
- NYU School of Medicine, United States
- John Radcliffe Hospital, United Kingdom
- Queen Mary University of London, United Kingdom
- Lerner Research Institute of the Cleveland Clinic, United States
Figures
Figure 1 with 1 supplement
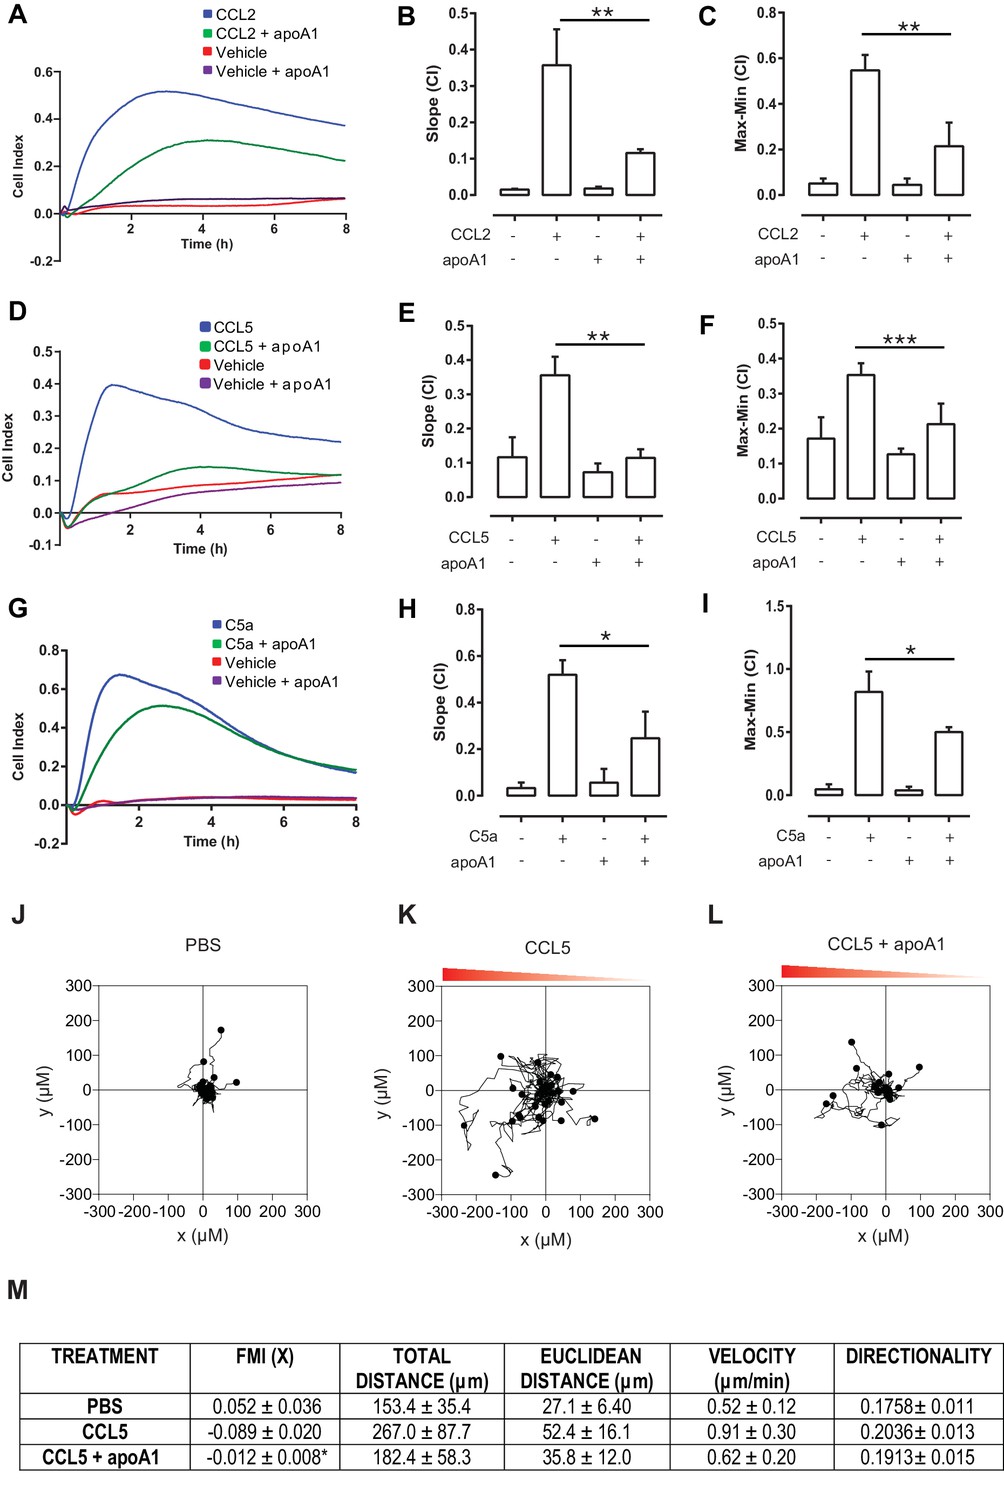
Acute pre-treatment with apoA1 inhibits macrophage chemotaxis.
Biogel elicited macrophages were incubated with apoA1 (40 μg/ml) for 60 min before being added to the upper chamber (4 × 10⁵/well) of a CIM-16 plate and allowed to migrate for 7–8 hr toward 10 nM CCL2, CCL5, or C5a. Representative traces are shown in panels (A, D, G). Migration was measured with slope (B, E, H) and max-min analysis (C, F, I). Data expressed as mean + SEM, n = 4–8 biological replicates with 3–4 technical replicates per condition. Statistical analysis was conducted by one-way ANOVA with Dunnett’s multiple comparison post-test. *p,0.05, **p,0.01, ***p,0.01 relative to CCL2, CCL5, or C5a alone. Biogel elicited macrophages from Cd68-GFP mice were incubated with either vehicle (J and K) or apoA1 (40 μg/ml) (L) for 60 min before being seeded into ibidiµ-Slide Chemotaxis3D slides (1.8 × 10⁴ cells/chamber). Migration of biogel elicited macrophages in the presence (K and L) or absence (J) of a CCL5 gradient (indicated by the red triangle) was followed by time-lapse microscopy and quantified by cell tracking. Data for FMI, Euclidean distance, total distance and velocity are summarised (M) and expressed as mean ± SEM of three independent experiments. Statistical analysis was conducted by an unpaired Students T test. *p,0.05, CCL5 vs CCL5 + apoA1.
Figure 1—figure supplement 1
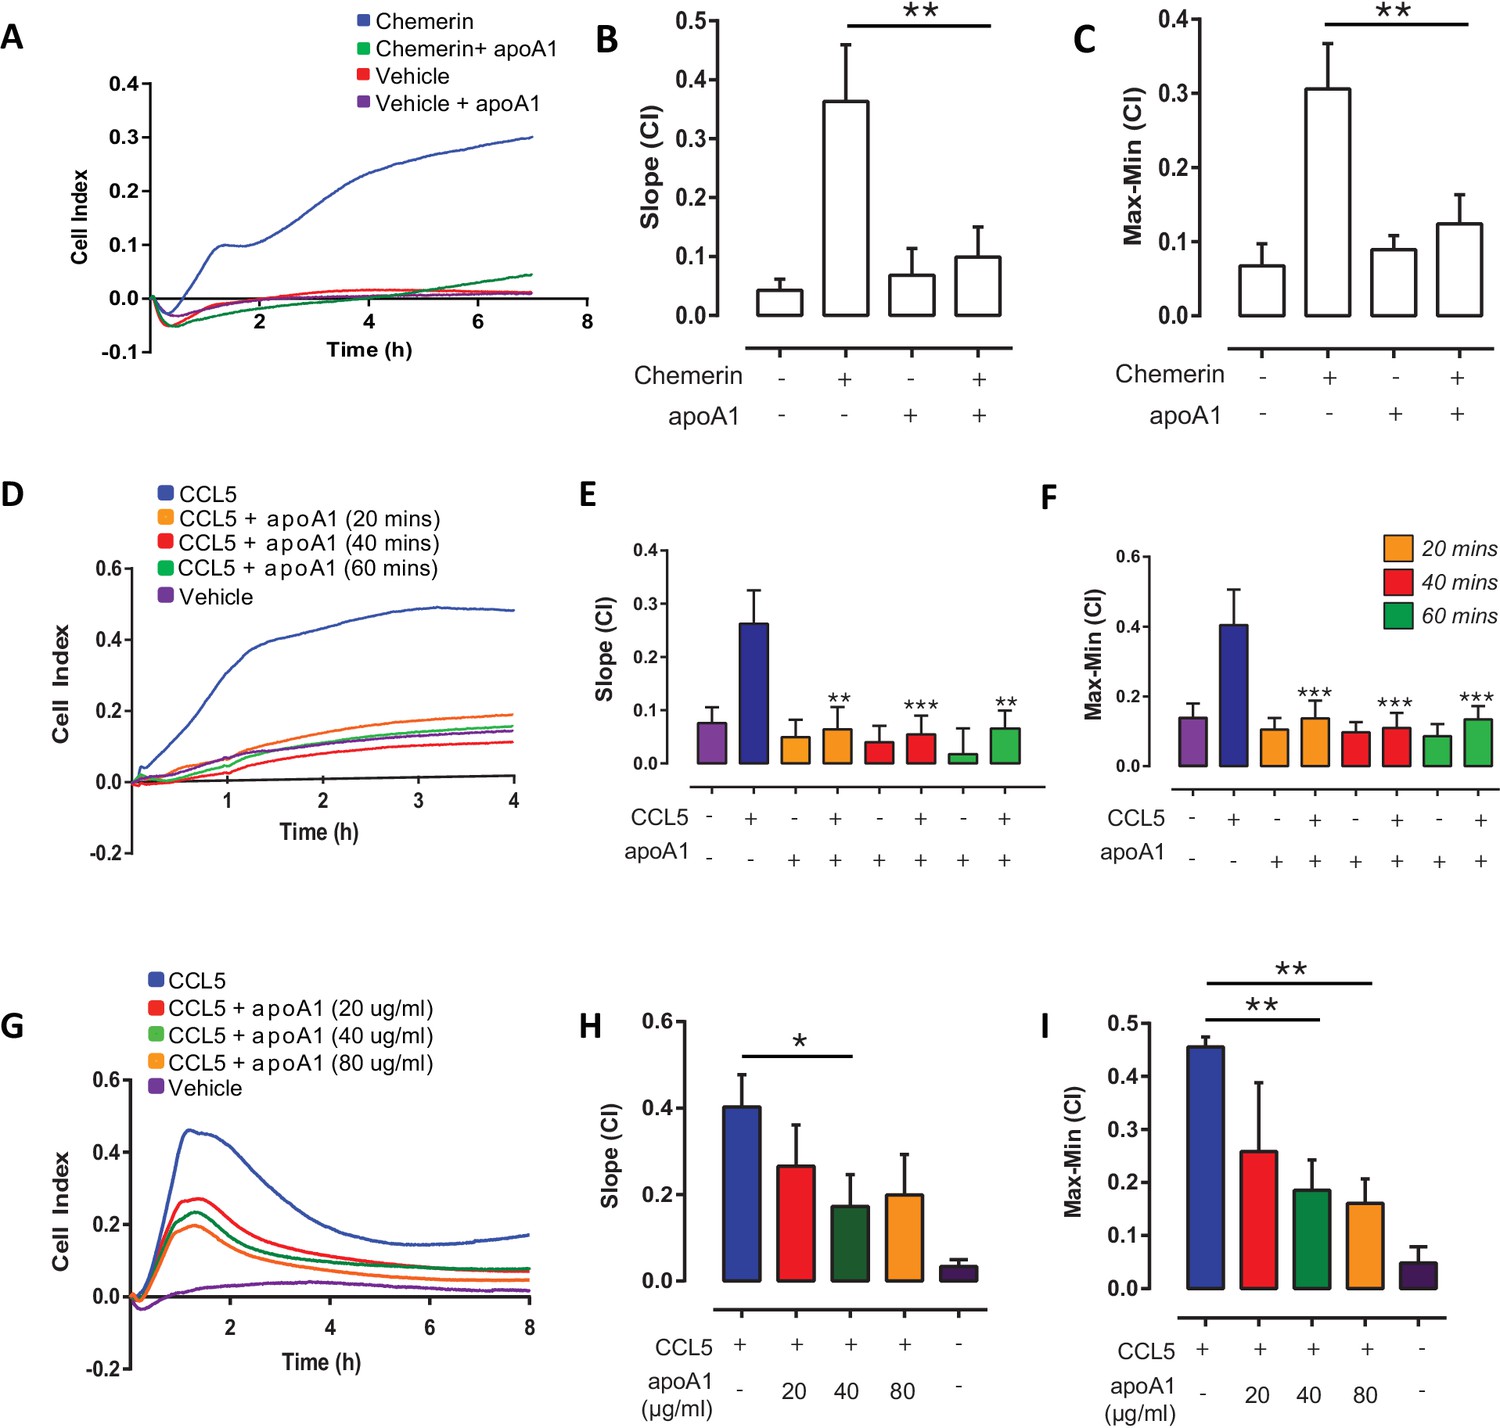
Short term incubations and different doses of apoA1 inhibit macrophage chemotaxis.
Biogel elicited macrophages were incubated with apoA1 (40 μg/ml) for 60 min before being added to the upper chamber (4 × 10⁵/well) of a CIM-16 plate and allowed to migrate for 7–8 hr toward 10 nM chemerin. Representative traces are shown in panel (A). Migration was measured with slope (B) and max-min analysis (C). Biogel elicited macrophages were pre-incubated with apoA1 (40 μg/ml) for the indicated times before chemotaxis towards 10 nM CCL5. Panel (D) shows a representative tracing, migration was measured with slope (E) and max-min analysis (F). Biogel elicited macrophages were pre-incubated with various amounts of apoA1 (20–80 μg/ml) as indicated before chemotaxis towards 10 nM CCL5. Panel (G) shows a representative tracing, migration was measured with slope (H) and max-min analysis (I). Data are expressed as mean ± SEM, n = 4–8 biological replicates with 3–4 technical replicates per condition. Statistical analysis was conducted by one-way ANOVA with Dunnett’s multiple comparison post-test. *p<0.05, **p<0.01, ***p<0.001,****p<0.0001 relative to 10 nM chemerin or CCL5 alone.
Figure 2
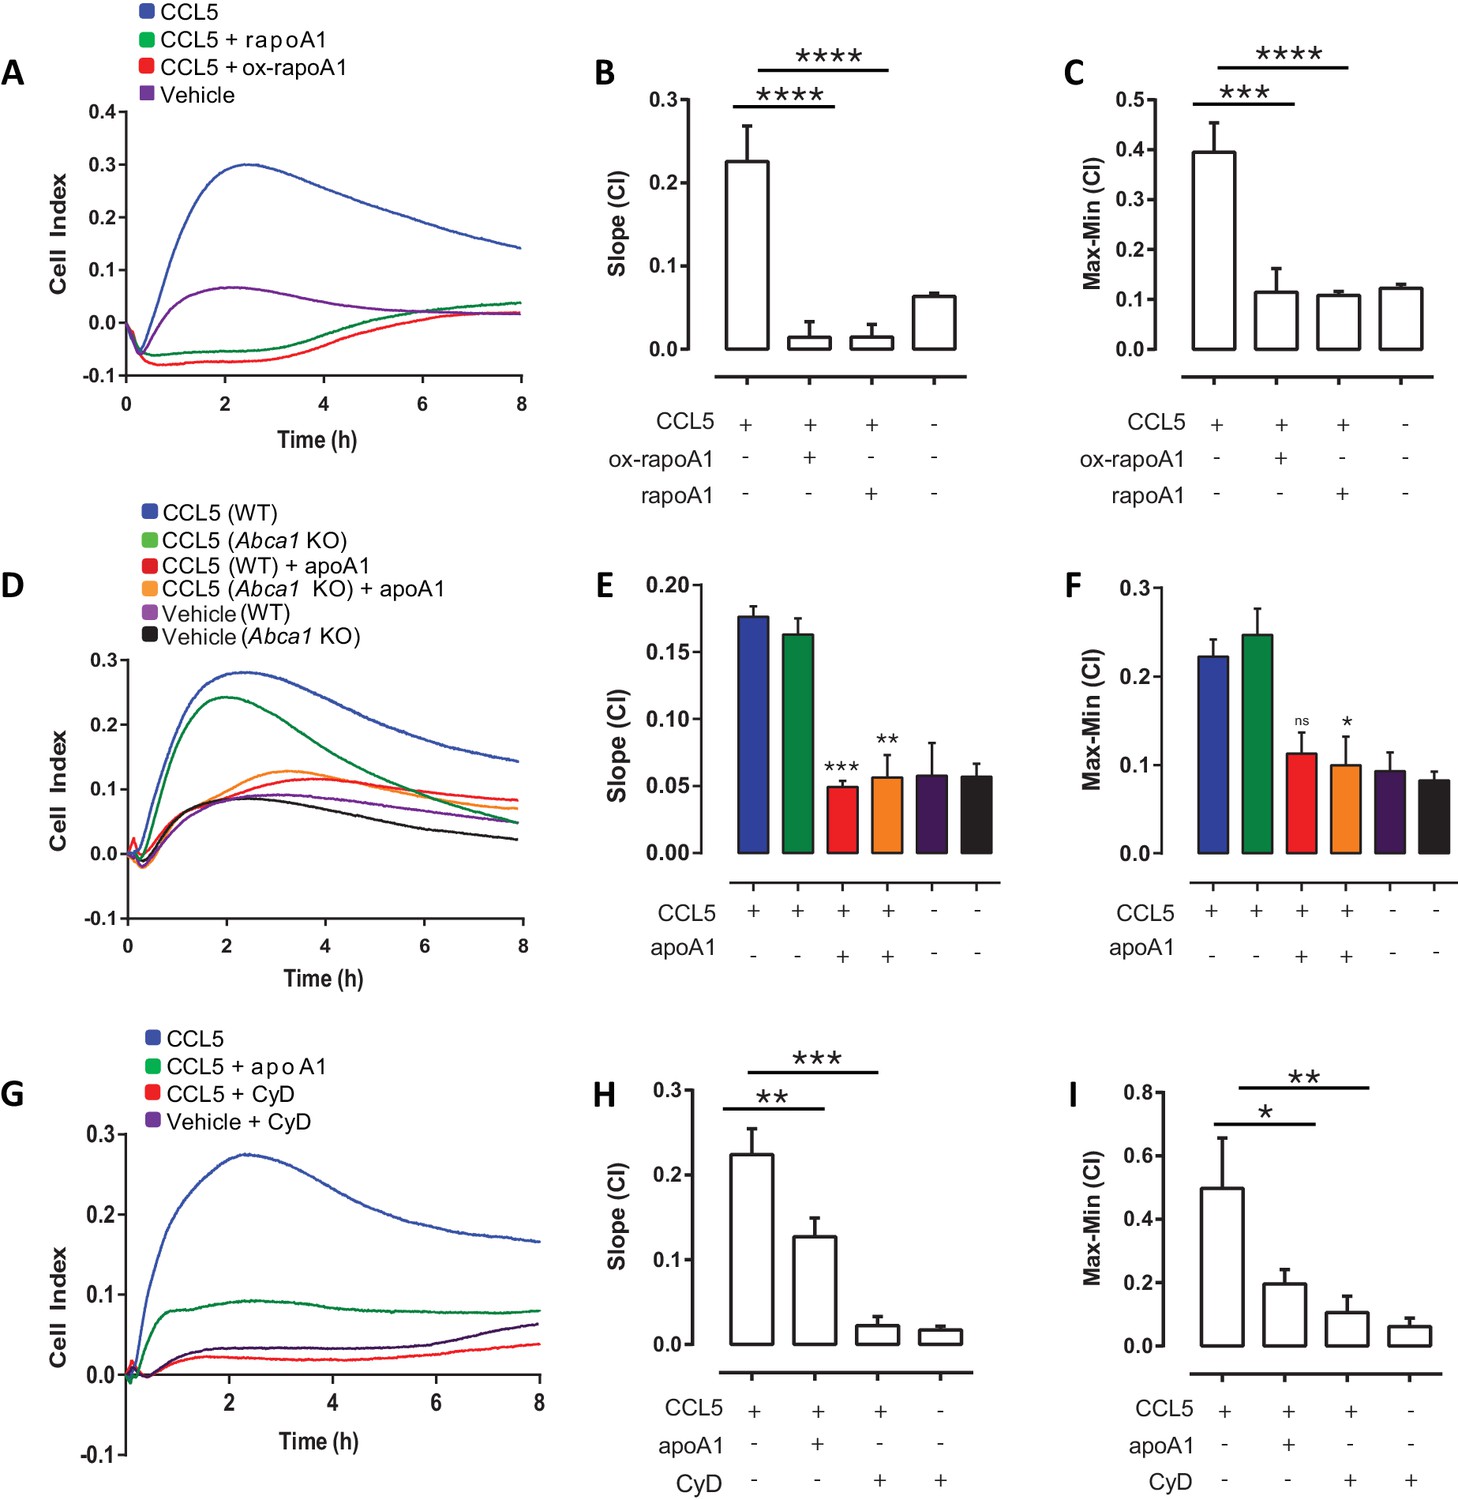
ApoA1 effects on macrophage chemotaxis are independent of ABCA1, but dependent on cholesterol efflux.
Biogel elicited macrophages from WT, Abca1-/- mice were pre-incubated with apoA1, recombinant apoA1 (rapoA1) or 5-OH-Trp72-rapoA1 (ox-rapoA1) as described in Materials and methods before measuring chemotaxis towards 10 nM CCL5. Panels (A, D, G) show representative traces, migration was measured with slope (B, E, H) and max-min analysis (C, F, I). Biogel elicited macrophages from WT mice were pre-incubated with 3 mM methyl β-cyclodextrin (CyD) as described in Materials and methods before measuring chemotaxis towards 10 nM CCL5. Data are expressed as mean + SEM, n = 4–8 biological replicates with 3–4 technical replicates per condition. Statistical analysis was conducted by one-way or two-way ANOVA with Dunnett’s multiple comparison post-test. *p,0.05, **p,0.01, ***p,0.001,****p,0.0001 relative to 10 nM CCL5 alone.
Figure 3 with 1 supplement
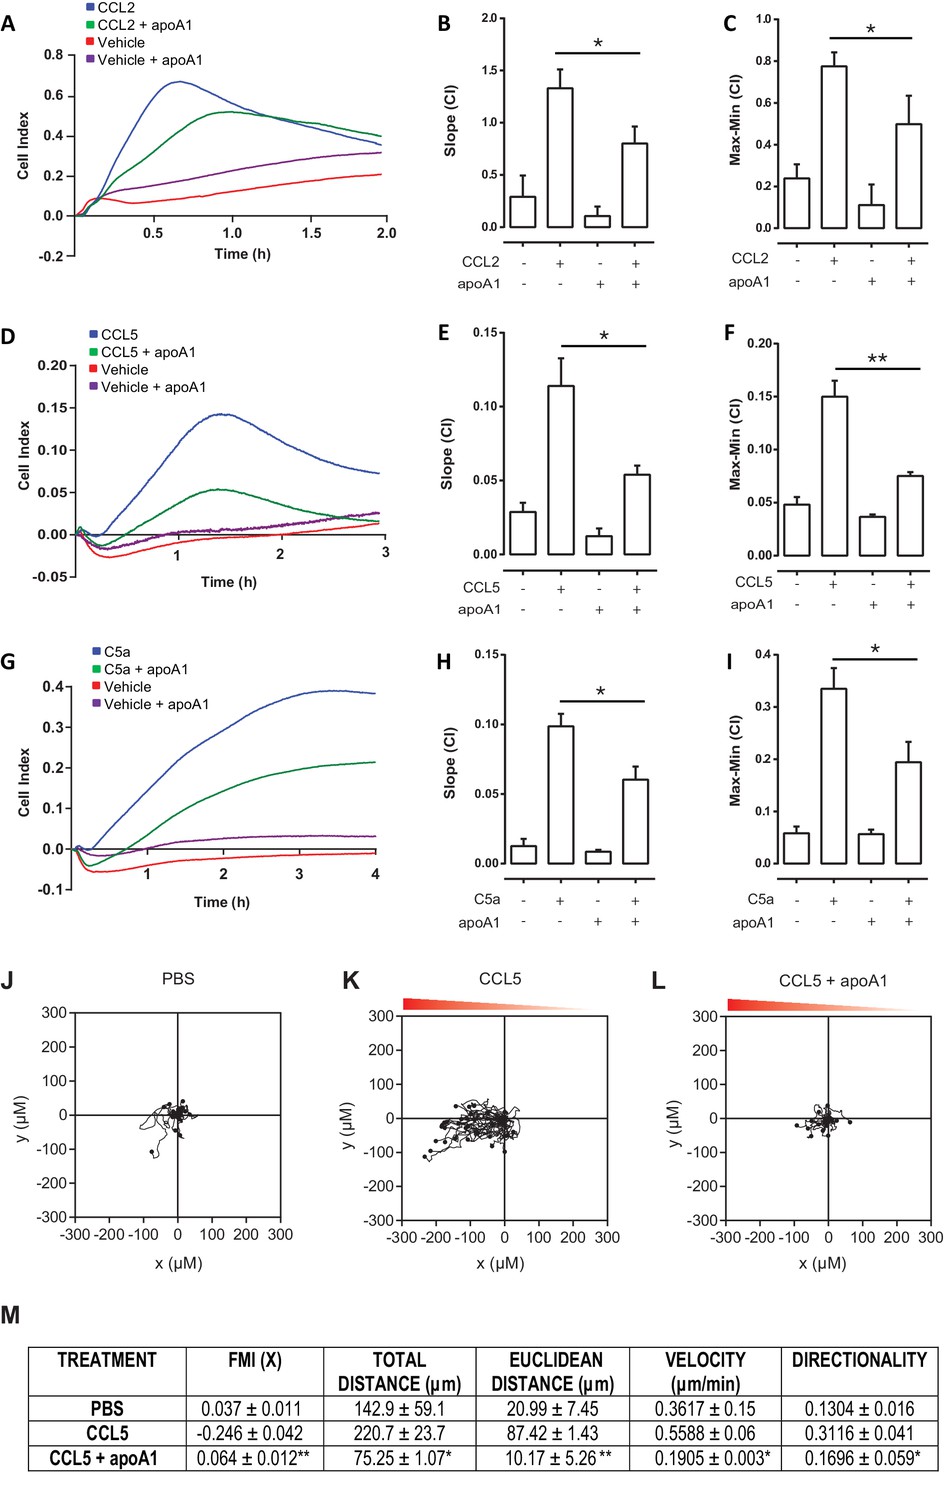
Acute pre-treatment with apoA1 reduces human monocyte chemotaxis.
CD14+ selected human monocytes (2 × 10⁵) were pre-treated with apoA1 (40 μg/ml) for 60 min before being added to the upper chamber of a CIM-16 plate and allowed to migrate for 2 hr toward 10 nM CCL2, CCL5 or C5a. Panels (A, D, G) show representative traces, and migration was measured with slope (B, E, H) and max-min analysis (C, F, I). Data are expressed as mean + SEM, n = 4 biological replicates with 3–4 technical replicates per condition. Statistical analysis was conducted with one-way ANOVA with Dunnett’s multiple comparison post-test. *p,0.05, relative to chemoattractant alone. CD14+ selected human monocytes were pre-treated (J and K) with apoA1 (40 μg/ml) (L) for 60 min before being seeded into ibidi µ-Slide Chemotaxis3D slides (1.8 × 10⁴ cells/chamber). Migration of human monocytes in the presence (K and L) or absence (J) of a CCL5 (50 nM) gradient (indicated by the red triangle) was followed by time-lapse microscopy and quantified by cell tracking. Data for FMI, Euclidean distance, total distance, velocity and directness are summarised (M) and expressed as mean ± SEM of two independent experiments. Statistical analysis was conducted by an unpaired Students T test. *p,0.05, **p,0.05, CCL5 vs CCL5 + apoa1.
Figure 3—figure supplement 1
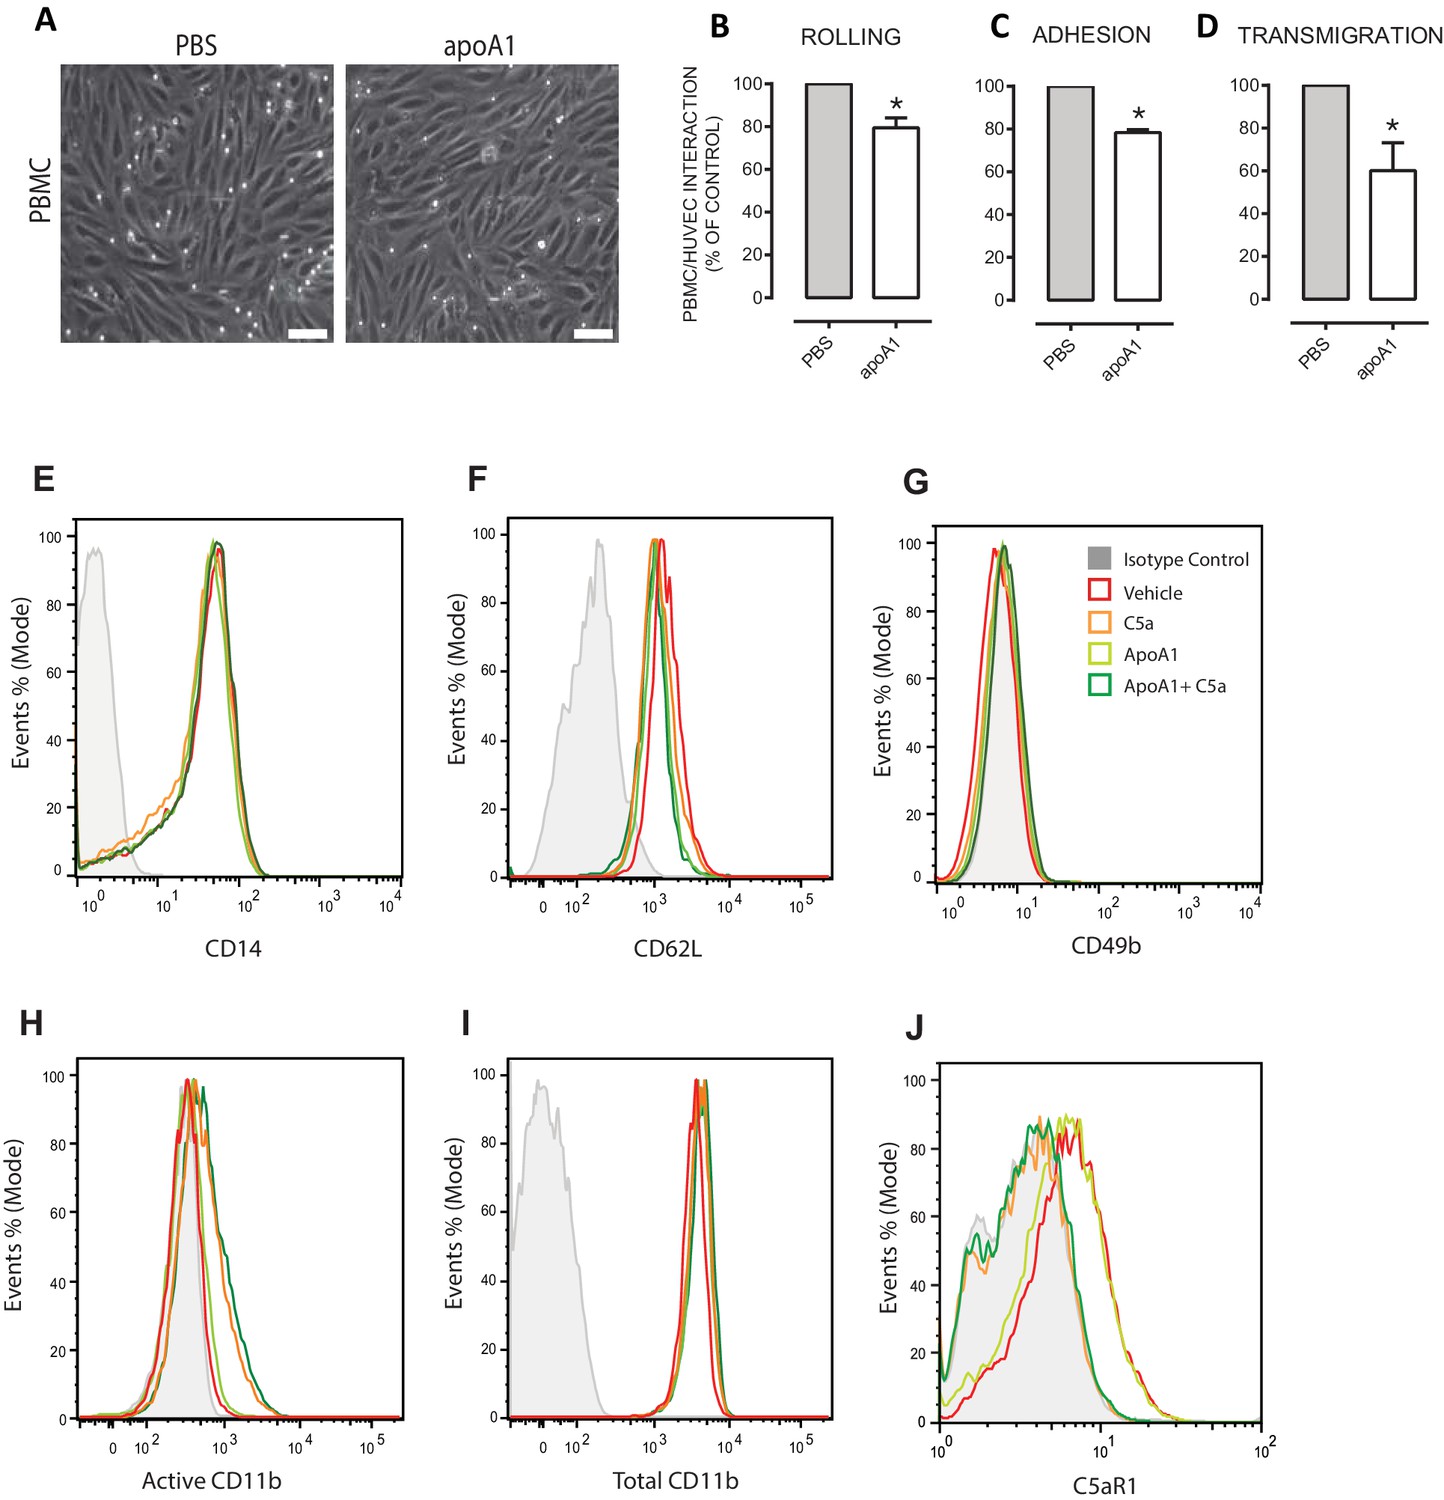
Acute pre-treatment with apoA1 reduces PBMC:HUVEC interactions under flow.
Isolated PBMCs (1 × 10⁶ cells/ml) were incubated with apoA1 (40 µg/ml) or buffer (control) for 60 min prior to perfusion over TNF-α stimulated HUVECs. Panel (A) are representative images of PBMC:HUVEC interactions following treatment with apoA1 vs control (Scale bar 20 µm). PBMC (B) rolling, (C) adhesion and (D) transmigration were quantified from six random fields/treatment. Results are expressed as percentage of control of two independent experiments. Statistical analysis was conducted with Mann-Whitney U test. 650 *p,0.05, versus control; n = 4 donors. (A) Human CD14+ monocytes were isolated (1 × 10⁶) and pre-treated with apoA1 (40 μg/ml) for 60 min before being stimulated with 10 nM C5a for 5 min. Representative histograms from flow cytometry for (E) CD14, (F) CD62L, (G) CD49b, (H) active CD11b, (I) total CD11b and (J) C5aR1 expression levels are shown from a total of four independent donors.
Figure 4 with 1 supplement
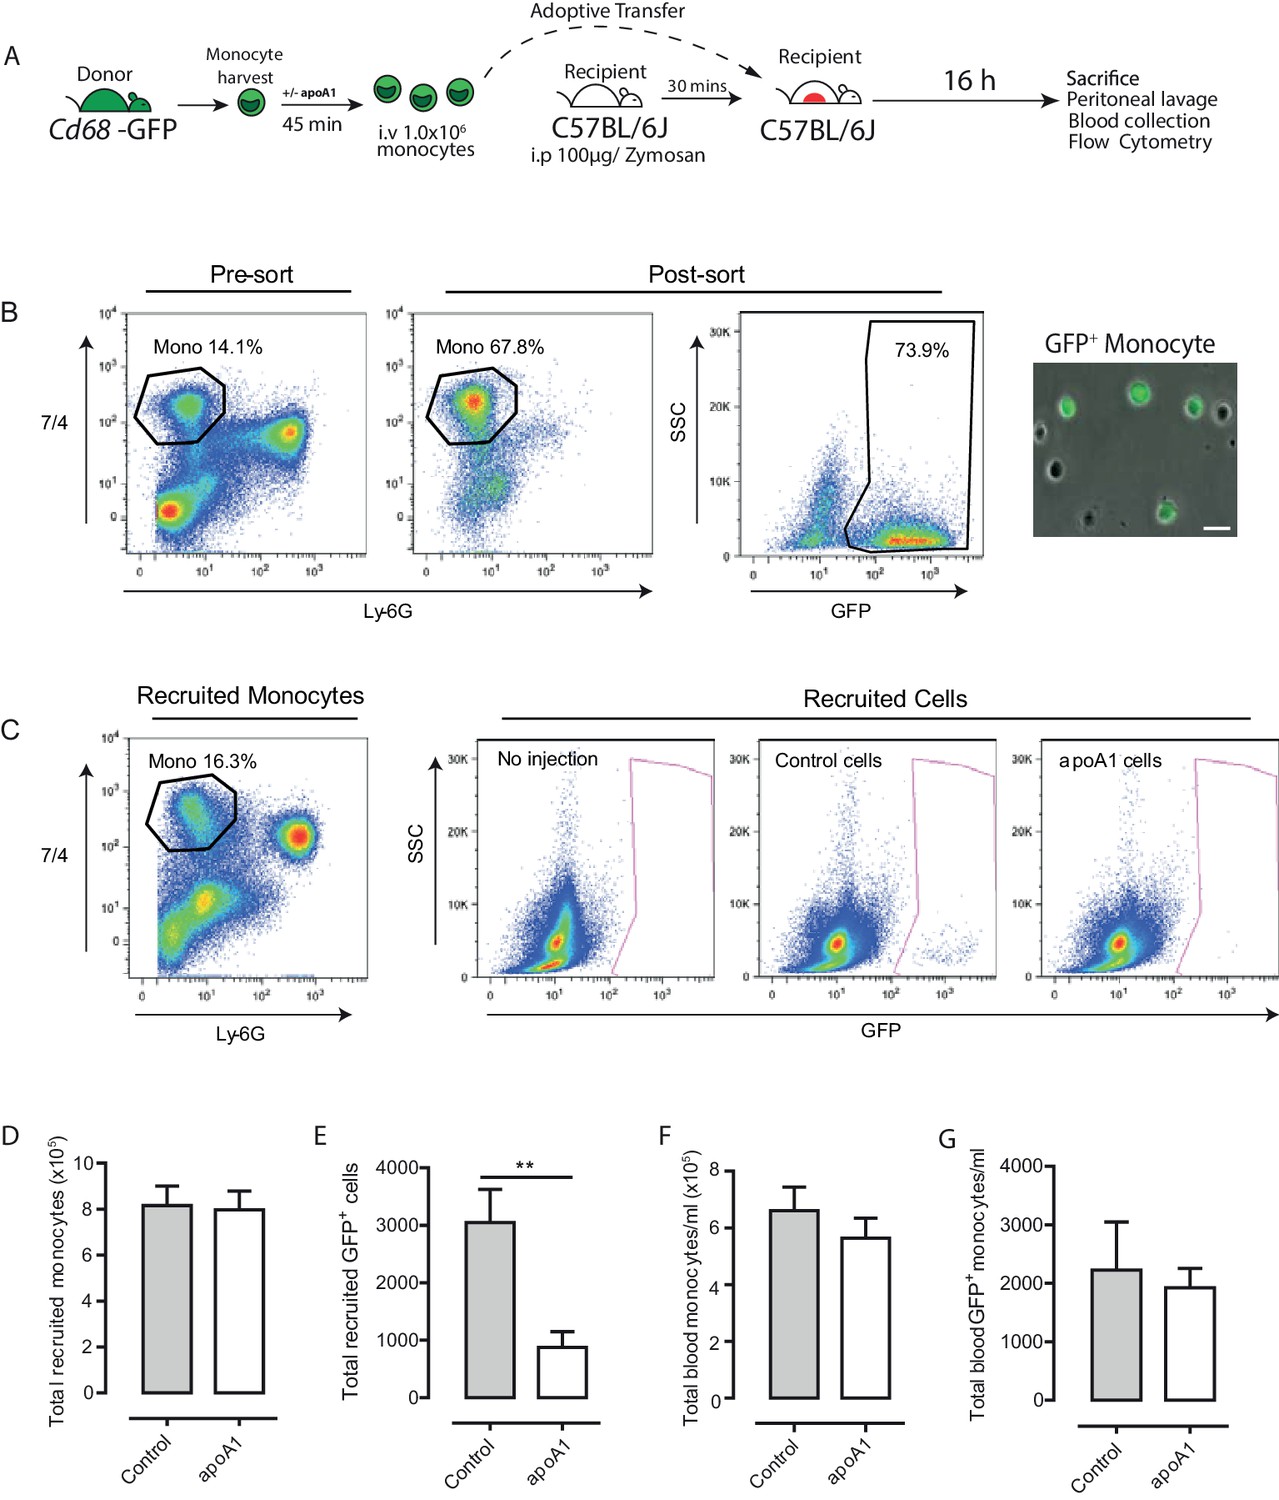
Acute exposure to apoA1 reduces the recruitment of adoptively transferred monocytes to sites of inflammation in vivo.
Diagram of the experimental design presented in (A). Monocytes were isolated from Cd68-GFP bone marrow using ‘no-touch’ negative immunomagnetic selection (B). Isolated monocytes were characterized as 7/4high/Ly6Glow, with a typical yield of 65–70% monocytes, of which 70–80% were GFP positive. Isolated Cd68-GFP monocytes (1 × 10⁶) treated for 45 min with either apoA1 (40 μg/ml) or PBS and were adoptively transferred into C57BL/6J mice by i.v. injection 30 min after i.p. injection with 100 μg zymosan. Mice were euthanized at 16 hr, and peritoneal lavage and blood samples were collected. Representative flow cytometry plots of peritoneal lavage from C57BL/6J mice that received adoptively transferred GFP positive monocytes treated with or without apoA1 during ongoing zymosan-induced peritonitis (C). Total monocytes and total adoptively transferred GFP+ monocytes were quantified in peritoneal lavage (D–E) and blood (F–G). Data are expressed as mean + SEM of 8–10 mice from two independent experiments. Statistical analysis was conducted by paired Students T test. **p,0.01, relative to control.
Figure 4—figure supplement 1
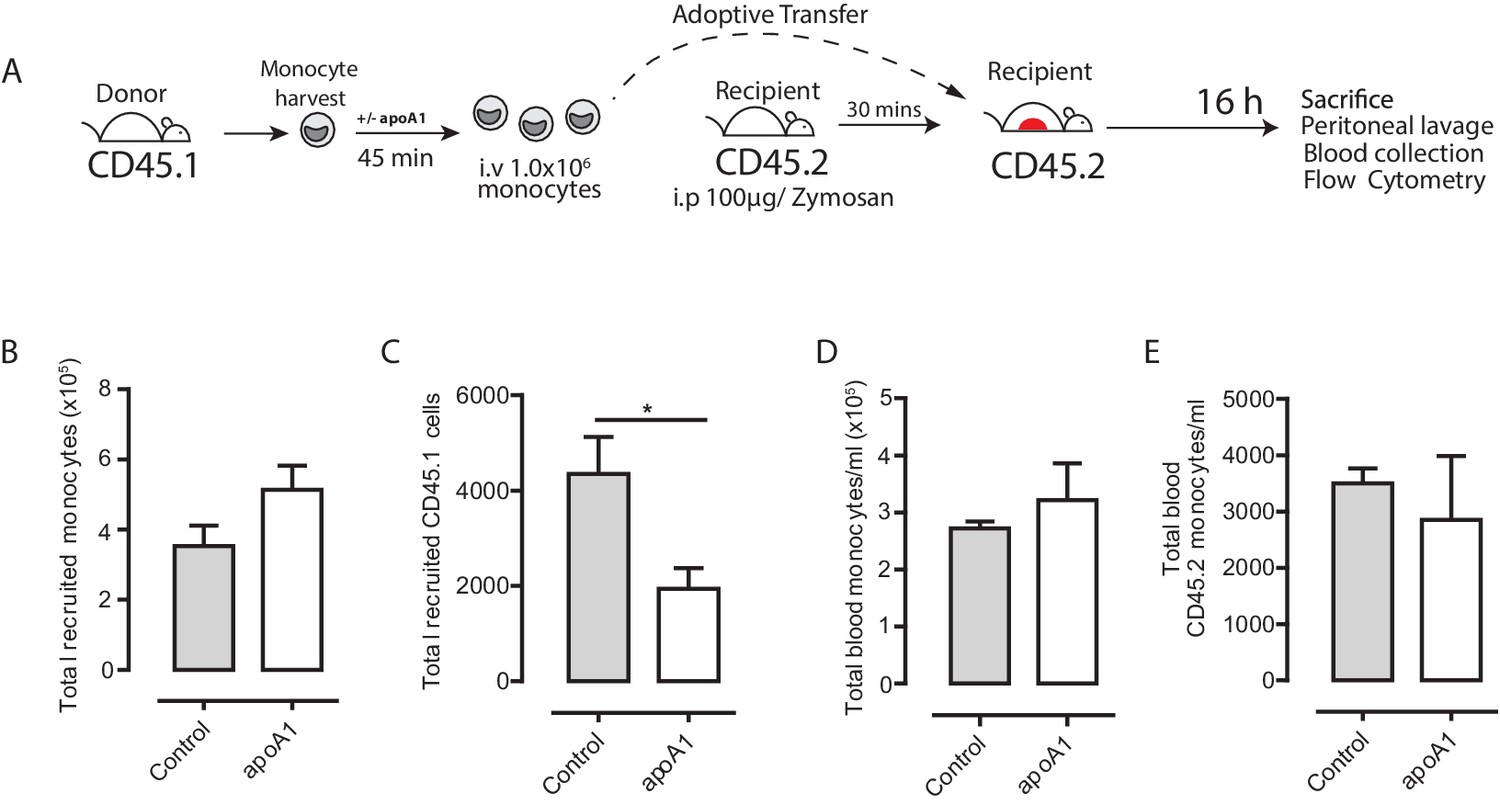
Acute exposure to apoA1 reduces the recruitment of adoptively transferred CD45.1 monocytes to sites of inflammation in CD45.2 recipient mice.
(A) Diagram of the experimental design. (B) Monocytes were isolated from SJL/1 mice (CD45.1 positive) bone marrow using ‘no-touch’ negative immunomagnetic selection. Isolated monocytes were characterized as 7/4high/Ly6Glow, with a typical yield of 65–70% monocytes. A total of 1 × 10⁶ isolated CD45.1+ monocytes treated with either apoA1 (40 μg/ml) for 60 min or PBS were adoptively transferred into C57BL/6J mice (CD45.2 positive) by i.v. injection 30 min after i.p. injection with 100 μg zymosan. Mice were euthanized at 16 hr, and peritoneal lavage and blood samples were taken. (B–E) Total monocytes and total adoptively transferred CD45.1+ monocytes were quantified in peritoneal lavage and blood. Data are expressed as mean ± SEM of 8–10 mice from two independent experiments. Statistical analysis was conducted by paired Students T test. **p<0.01, relative to control.
Figure 5
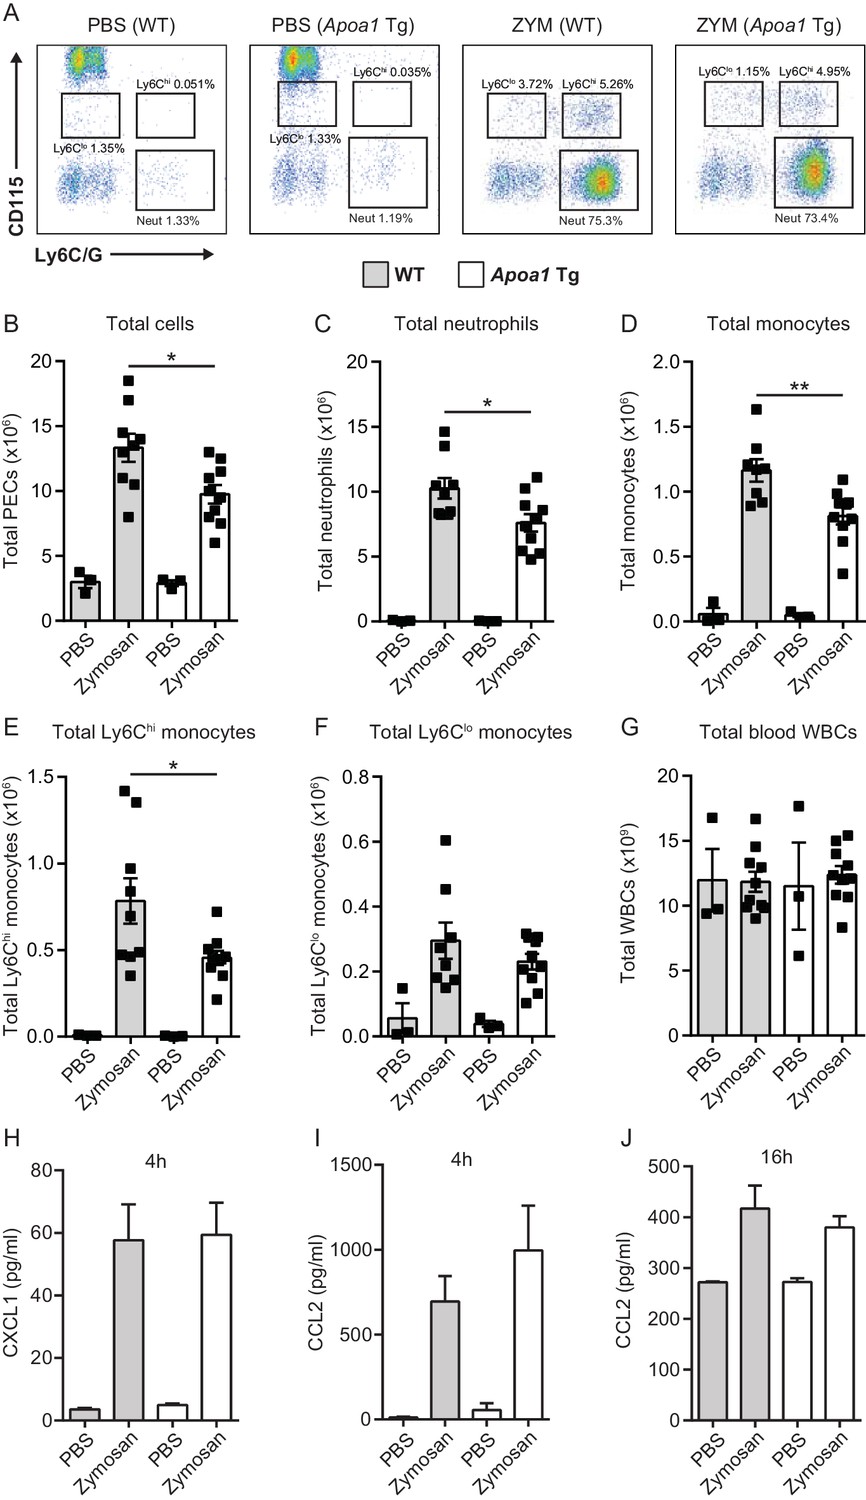
Apoa1Tg mice display reduced leukocyte recruitment in zymosan peritonitis.
Apoa1Tg and WT control mice were injected i.p. with 100 μg zymosan. Mice were euthanized at 16 hr and peritoneal lavage samples were collected. Representative flow cytometry plots are shown in panel (A) of neutrophils (Neut) characterised as CD45+/CD115-/Ly6G+ and monocytes characterised as CD45+/CD115+/Ly6Chi/lo from peritoneal lavage fluid. Total cells (B), neutrophils (C) total monocytes (D), Ly6Chi monocytes (E), Ly6Clo monocytes (F) within the peritoneal cavity following zymosan challenge are expressed. (G) Total circulating blood white cell counts from Apoa1Tg mice and WT controls are expressed as mean ± SEM of 3–9 mice per condition. (H–J) CXCL1 and CCL2 levels were measured in peritoneal lavage fluid by ELISA. Data are expressed as mean + SEM of 2–6 mice per genotype of two independent experiments. Statistical analysis was conducted by one-way ANOVA with Dunnett’s multiple comparison post-test. *p,0.05, **p,0.01 compared to WT.
Figure 6 with 1 supplement
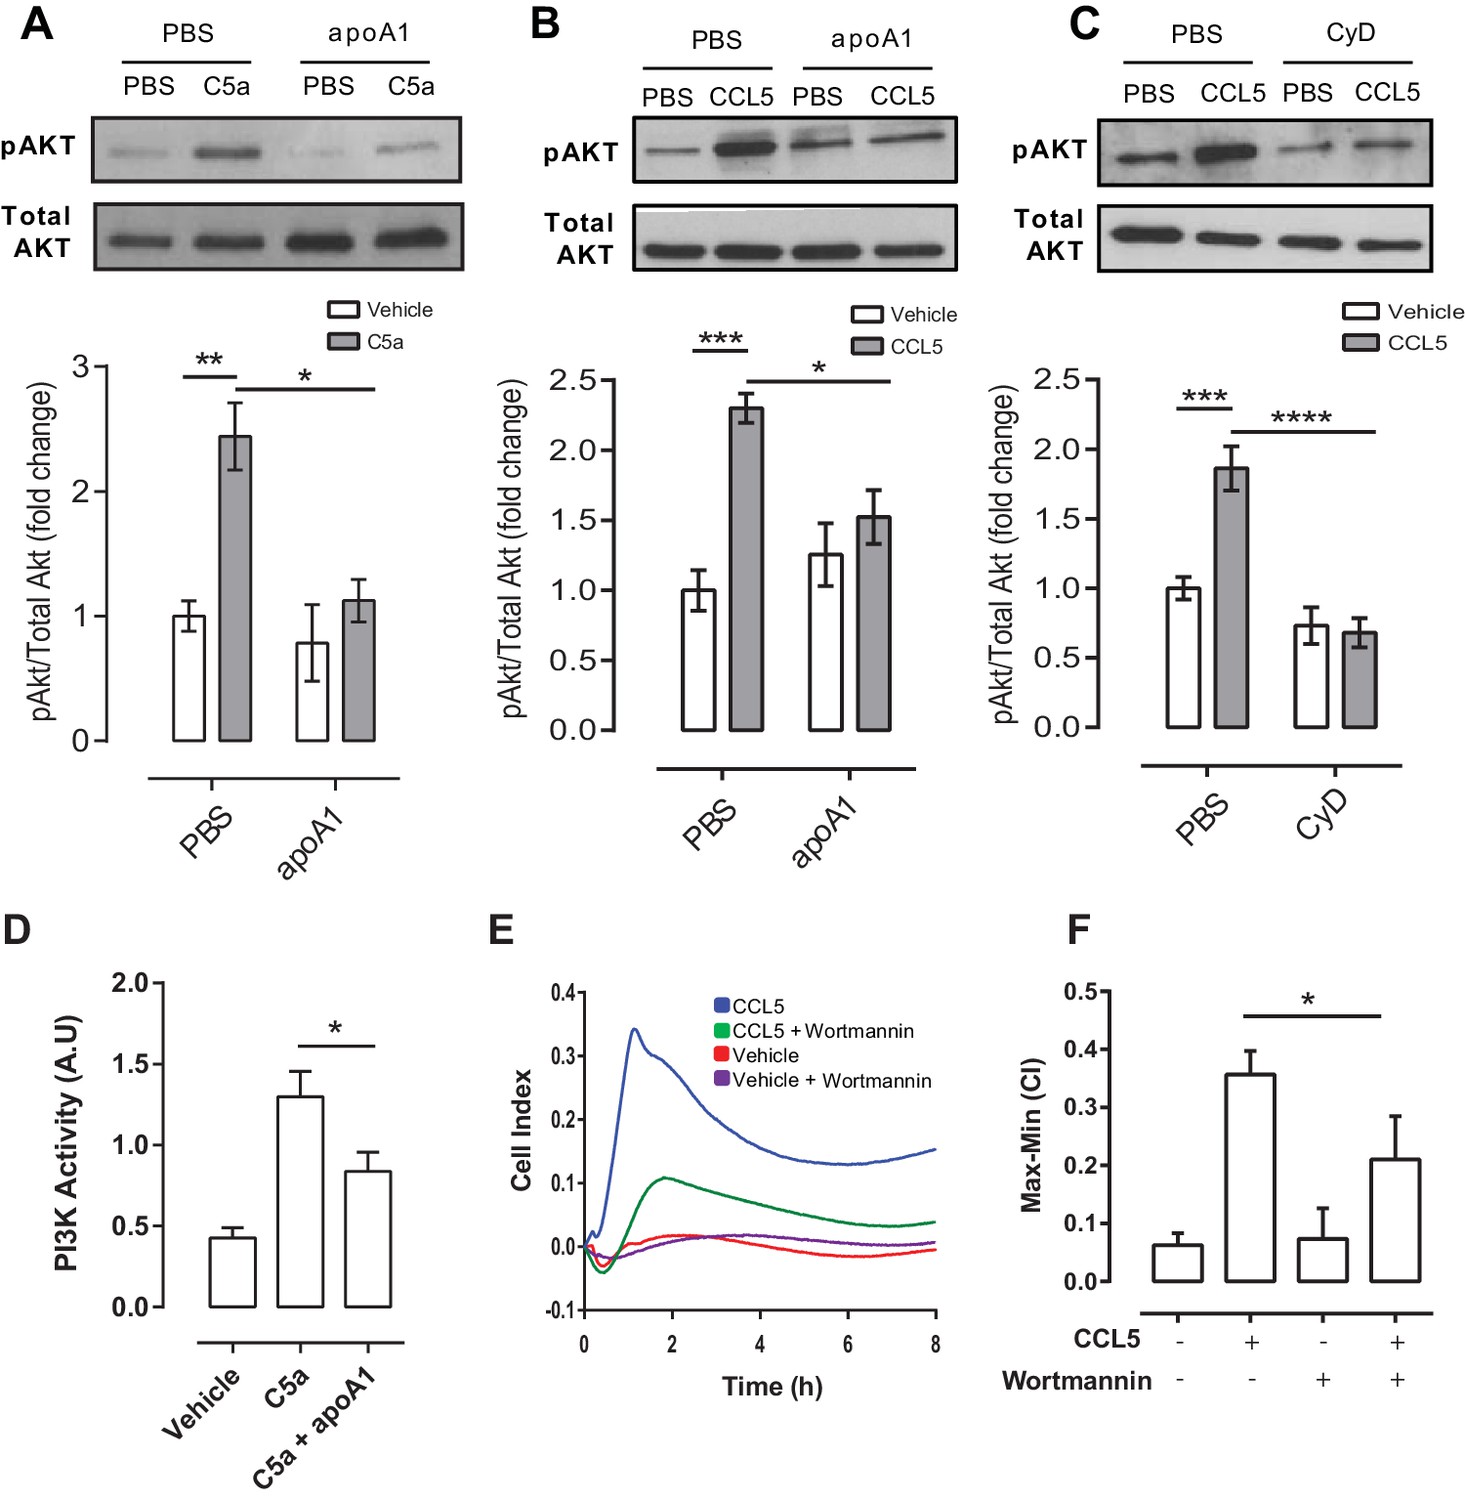
ApoA1 suppresses Akt signalling and PI3K activity following chemokine activation of human and murine monocyte-derived cells.
CD14+ selected human monocytes or biogel elicited murine macrophages (2 × 10⁵) were pre-incubated with either vehicle (PBS), apoA1 (40 μg/ml) or 3 mM methyl β-cyclodextrin (CyD) for 60 min as described in Materials and methods. Human CD14+ monocytes (A) or murine macrophages (B,C) were then stimulated with either 10 nM C5a or CCL5. Relative levels of phosphorylated Akt were determined by Western blotting. Representative blots from independent biological replicates are shown. Densitometry of western blots is shown in panels below representative western blots (n > 2/group). Data are expressed as mean ± SEM, n = 2–6 biological replicates. Murine RAW macrophages were pre-incubated with apoA1 (40 μg/ml) or vehicle for 60 min at 37°C, 5% CO2 prior to stimulation with C5a (10 nM) for 10 min (D). PI3K was immunoprecipitated from cell lysates and PI3K activity determined by incubating with PIP2 and measuring PIP3 production by competitive ELISA. Data are expressed as mean + SD, n = 4 independent experiments. Statistical analysis was conducted by one-way ANOVA with Dunnett’s multiple comparison post-test. *p<0.05, relative to C5a alone. Biogel elicited macrophages were incubated with 100 nM wortmannin for 60 min before being added to the upper chamber (4 × 10⁵/well) of a CIM-16 plate and allowed to migrate for 8 hr at 37°C, 5% CO2 towards 10 nM CCL5. Representative traces are shown in panel (E). Migration was measured by max-min analysis (F). Statistical analysis was conducted by one-way ANOVA with Dunnett’s multiple comparison post-test. *p<0.05, ***p<0.001 relative to CCL5 alone.
Figure 6—figure supplement 1
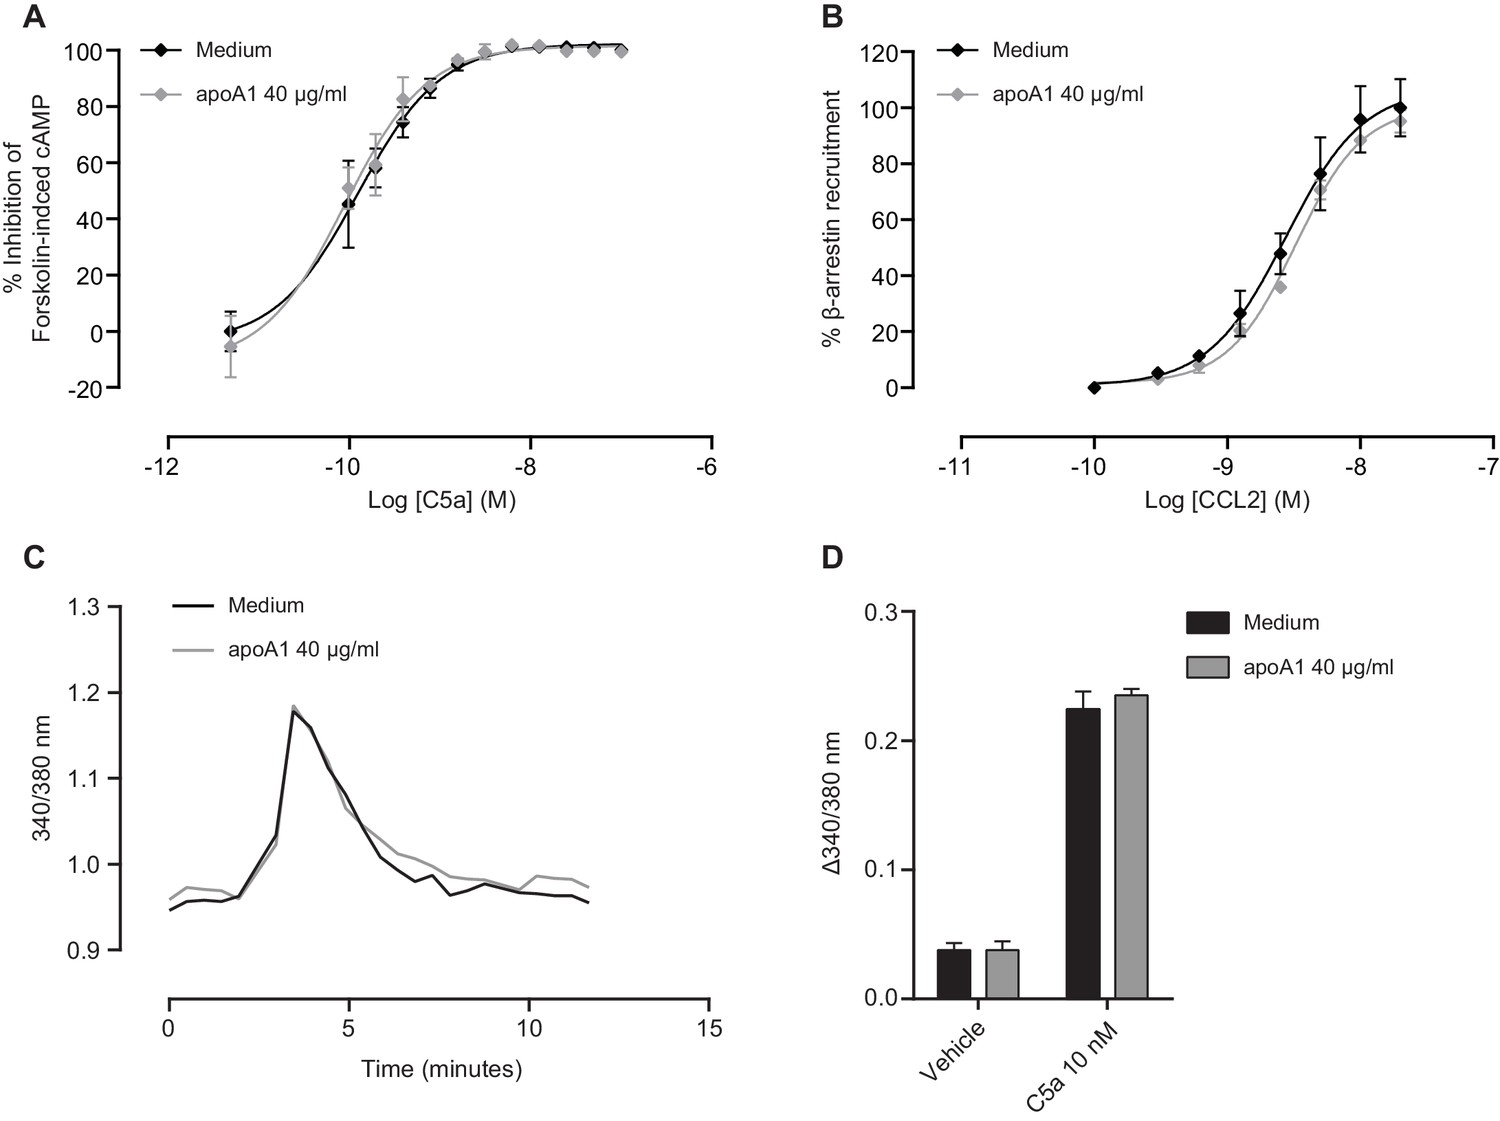
Gαi/o-signalling, β-arrestin recruitment and intracellular Ca2+ flux remain unaffected in response to apoA1.
(A) Intracellular cAMP levels were measured as described in Supplemental Methods in CHO-K1 cells expressing human C5aR1. Cells were incubated as described in Materials and methods with either vehicle or apoA1 (40 μg/ml) as indicated. Following treatment, vehicle or C5a was added in assay buffer containing forskolin (FSK: 20 µM final assay concentration) to give the indicated final concentrations. The cells were then incubated for 30 min before the addition of the detection reagents. Data are mean ± SEM, n = 3. (B) Recruitment of β-Arrestin was measured as described in Supplemental Methods in CHO-K1 cells expressing murine CCR2. Cells were incubated as described in Materials and methods with either vehicle or apoA1 as indicated. Following treatment, vehicle or CCR2 was added and cells incubated for 90 min before the addition of the detection reagents. Data are mean ± SEM, n = 3. Biogel elicited macrophages were loaded with FURA2-AM in the presence or absence of 40 μg/ml apoA1 for 45 min. Macrophages were then stimulated with either vehicle or 10 nM C5a. (C) Representative tracings of intracellular Ca2+ levels following C5a stimulation in vehicle or apoA1 pre-treated cells. (D) Pre-treatment with apoA1 has no effect on intracellular Ca2+ levels. Data are mean ± SEM, n = 4 biological replicates. Statistical analysis was performed by two-way ANOVA with Sidak’s multiple comparisons correction.
Figure 7 with 1 supplement
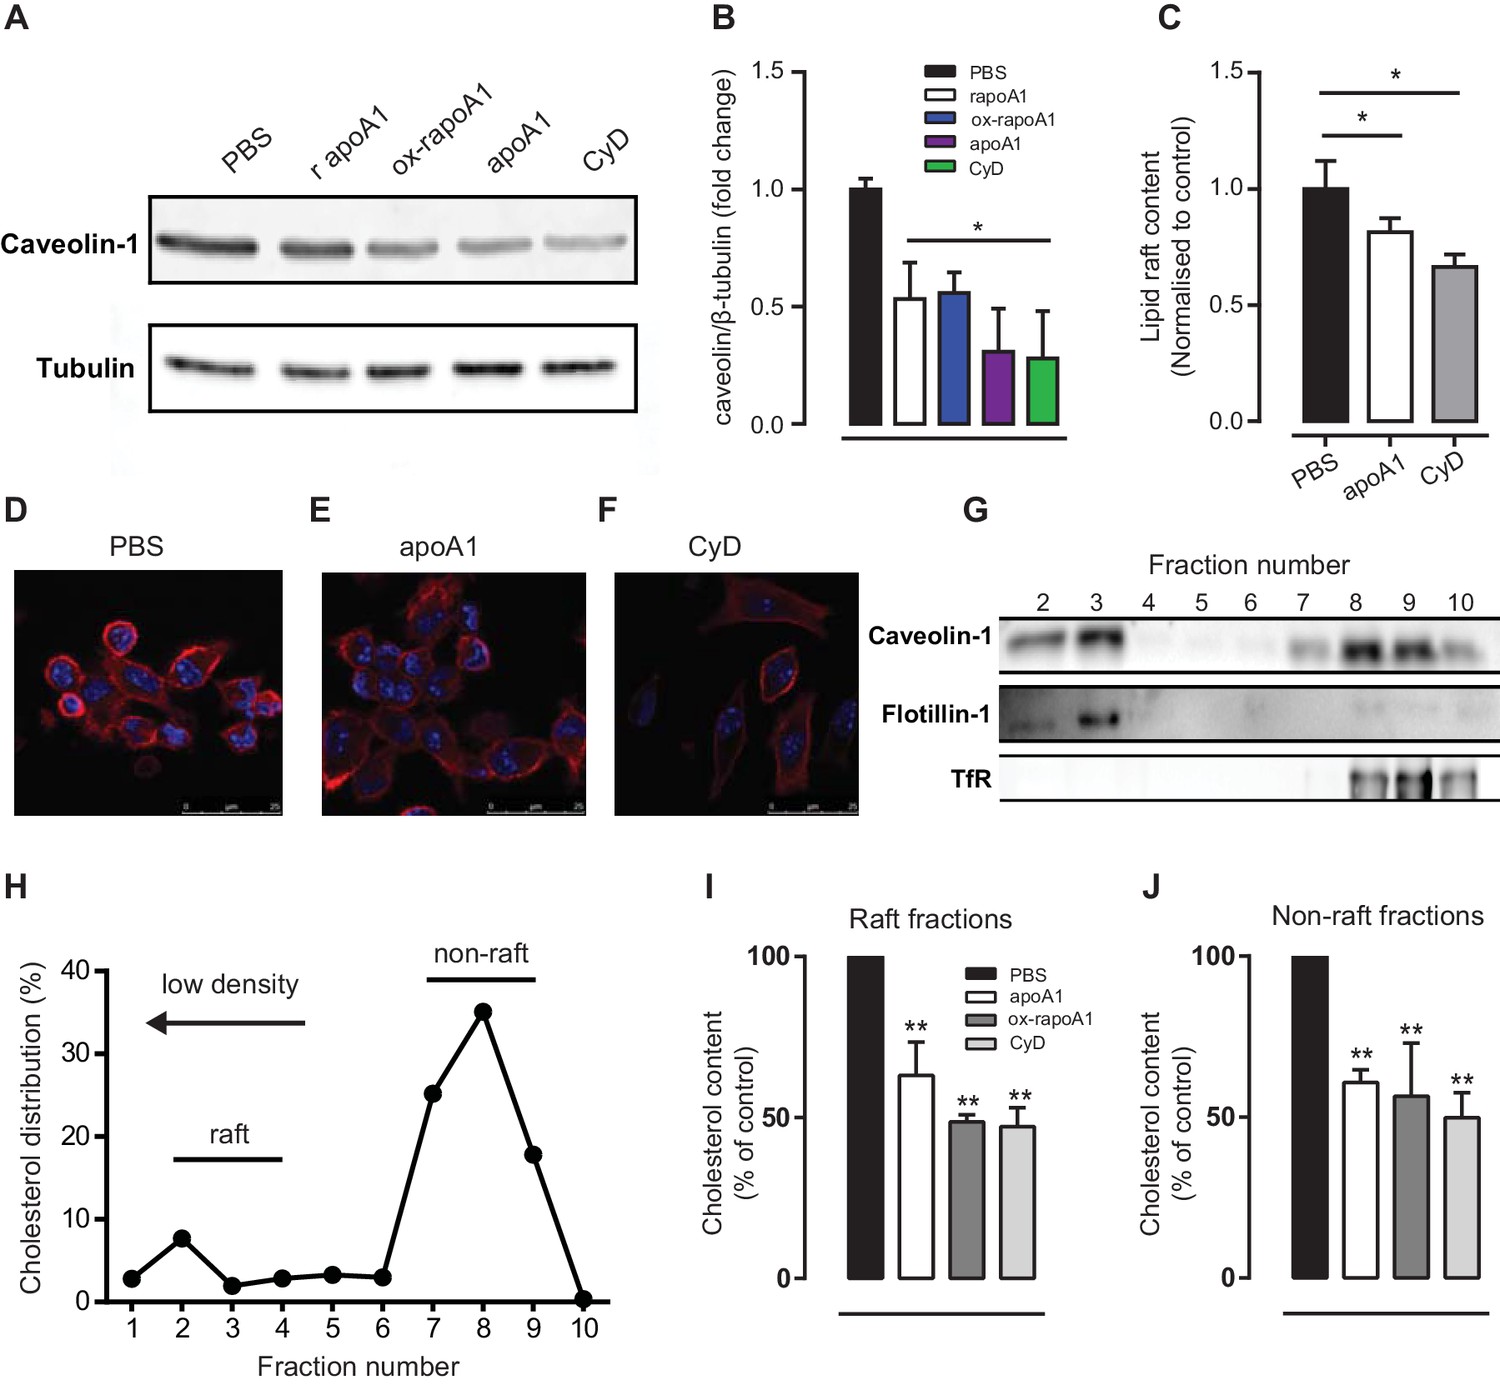
ApoA1 modulates monocyte-derived cell lipid raft cholesterol content in cells of murine and human origin.
(A–B) Total cell caveolin-1 was assessed by Western blotting following treatment of biogel elicited macrophages with apoA1 (40 μg/ml), ox-rapoA1 (40 μg/ml) or 3 mM methyl β-cyclodextrin (CyD) for 1 hr. The lipid raft content of biogel elicited macrophages was assessed following treatment with apoA1 (40 μg/ml) or 3 mM CyD for 1 hr, and incubation of the cells with cholera toxin B Alexa Fluor 647 conjugate to bind lipid raft ganglioside G M1. Relative fluorescence (compared to PBS-treated control cells) was assessed by flow cytometry (C), and cells were imaged by confocal microscopy (D–F). Prior to fractionation of membrane lipid rafts, human THP-1 macrophages were treated with either vehicle, apoA1 (40 μg/ml), ox-rapoA1 (40 μg/ml), or 3 mM CyD for 1 hr prior to stimulation with 10 nM CCL5 for 5 min. Cells were then homogenized in a 0.2% Triton-X 100 containing buffer prior to 5–45% sucrose density gradient centrifugation. Fractions were collected from the top (fraction 1, lightest fraction) to the bottom (fraction 10, heaviest fraction), and fraction proteins separated by SDS-PAGE, transferred to PVDF membranes and caveolin-1, flotillin-1, or transferrin receptor (TfR) content assessed by western blotting. Representative distribution of raft and non-raft marker proteins presented in panel (G). The cholesterol content of each fraction was determined via the amplex red assay, with a representative distribution shown in panel (H). The sums of the cholesterol content in lipid raft fractions (fractions 2–4), and non-raft fractions (fractions 8–10) following treatment with apoA1, ox-rapoA1 and CyD are shown in panels (I) and (J), respectively. Western blots are representative of three independent experiments. Cholesterol contents are means + SEM of three independent experiments. Statistical analysis was conducted by one-way ANOVA with Dunnett’s multiple comparison post-test. *p<0.05, **p<0.01 relative to PBS.
Figure 7—figure supplement 1
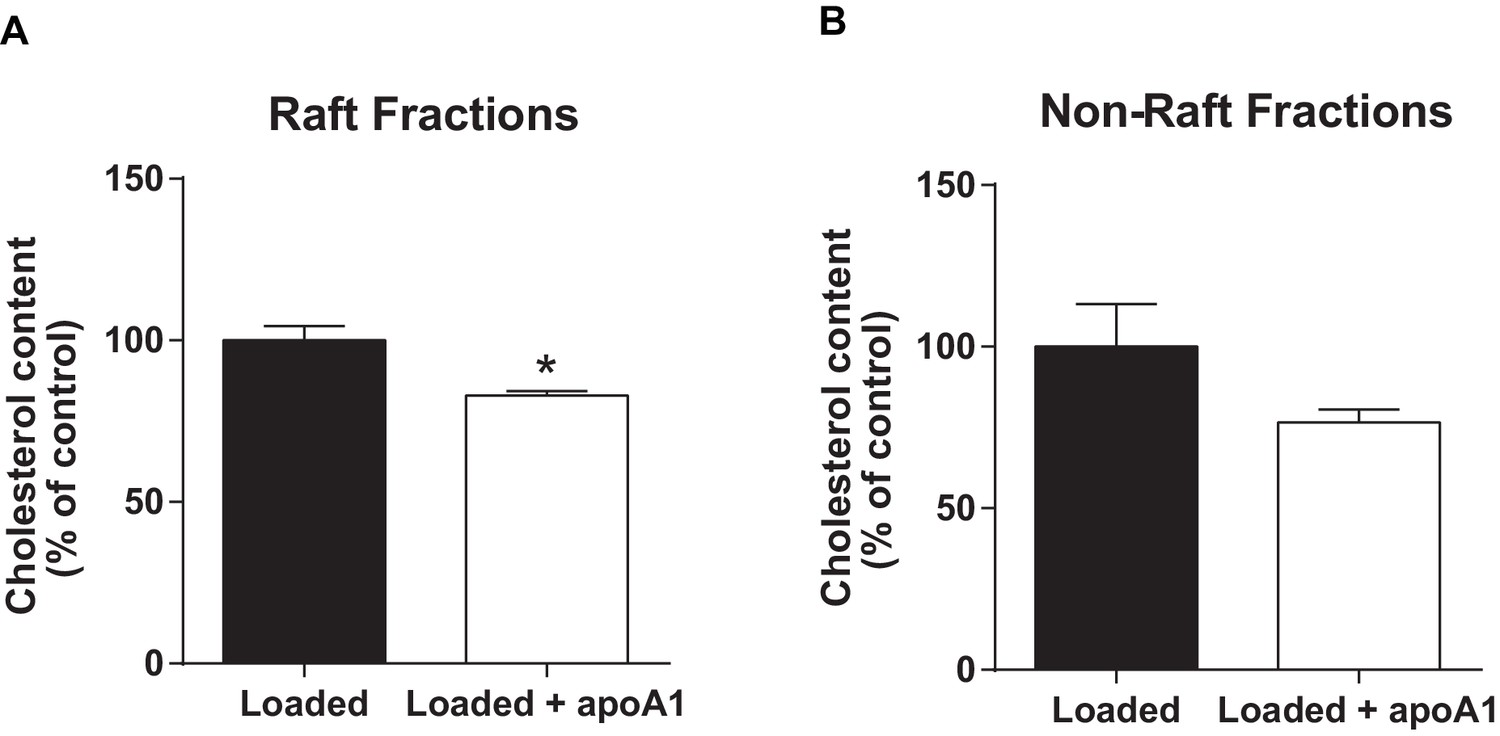
ApoA1 depletes membrane lipid rafts of cholesterol in cholesterol-loaded THP-1 cells.
Human THP-1 macrophages were incubated with methyl-β-cyclodextrin:cholesterol complexes (0.5 mg/mL) for 1 hr to cholesterol-load cells prior to incubation for 1 hr with 40 µg/mL apoA1 or PBS. Cells were then homogenized in a 0.2% Triton-X 100 containing buffer prior to 5–45% sucrose density gradient centrifugation. Fractions were collected from the top (fraction 1, lightest fraction) to the bottom (fraction 10, heaviest fraction), and cholesterol content of each fraction quantified. The sums of the cholesterol content in lipid raft fractions (fractions 2–4), and non-raft fractions (fractions 8–10), are shown in panels (A) and (B) respectively. Statistical analysis was conducted by using Student’s T test. *p<0.05 relative to loaded cells alone.
Author response image 1
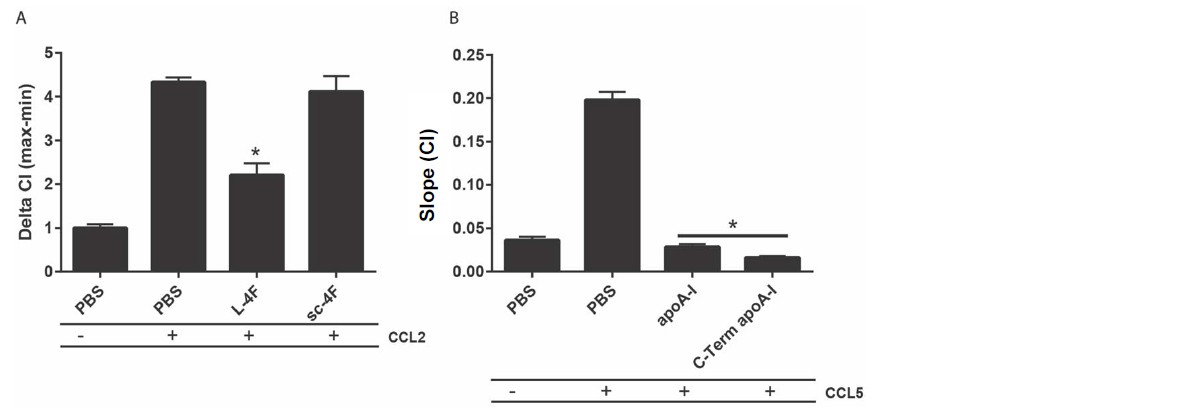
Peptides incorporating apoA1 amphipathic α-helices impair macrophage migration.
Biogel elicited macrophages were and incubated with either (A) 50 µg/mL L-4F (Ac-DWFKAFYDKVAEKFKEAF-NH2), 50 µg/mL scrambled peptide (sc-4F) (Ac-DWFAKDYFKKAFVEEFAK-NH2) or (B) 40 µg/mL apoA1, 40 µg/mL C-terminal deleted apoA1 (Δ185-243) or PBS as vehicle control, before being added to the upper chamber (4×10⁵/well) of a CIM-16 plate and allowed to migrate for 7-8 h toward 10 nM CCL2 or CCL5. Migration was measured by max-min or slope analysis. Data are expressed as mean + SEM, n = 2 biological replicates with 3-4 technical replicates per condition. Statistical analysis was conducted by one-way ANOVA with Dunnett’s multiple comparison post-test. * p,0.05 relative to 10 nM chemokine alone.
Author response image 2
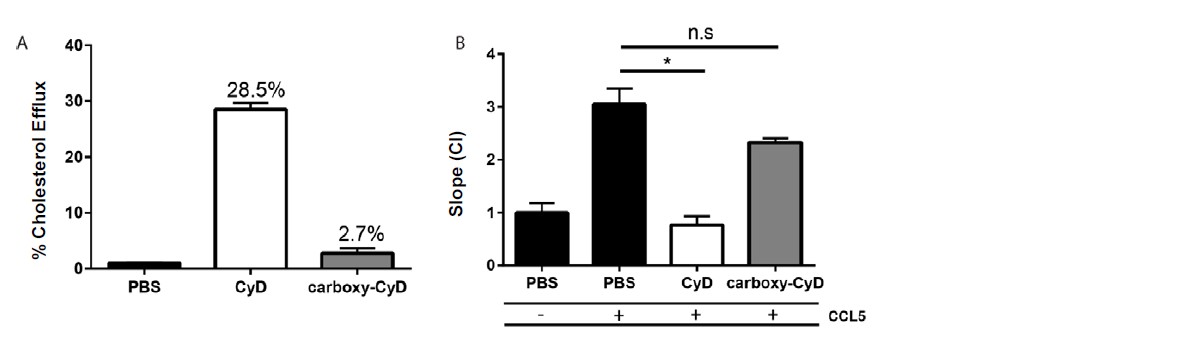
Macrophage cholesterol efflux impairs macrophage migration.
(A) Biogel elicited macrophages were trace labelled with [3H]cholesterol and incubated with either 1 mM methyl-β-cyclodextrin (CyD) or 1 mM carboxy-cyclodextrin (carboxy-CyD) and cholesterol efflux assessed over 4 h. (B) Biogel elicited macrophages were incubated with either 1 mM methyl-β-cyclodextrin (CyD) or 1 mM carboxy-cyclodextrin (carboxy-CyD) or PBS as vehicle control, before being added to the upper chamber (4×10⁵/well) of a CIM-16 plate and allowed to migrate for 7-8 h toward 10 nM CCL5. Migration was measured by slope analysis. Data are expressed as mean + SEM, n = 2 biological replicates with 3-4 technical replicates per condition. Statistical analysis was conducted by one-way ANOVA with Dunnett’s multiple comparison post-test. * p,0.05 relative to 10 nM CCL5 alone.
Author response image 3
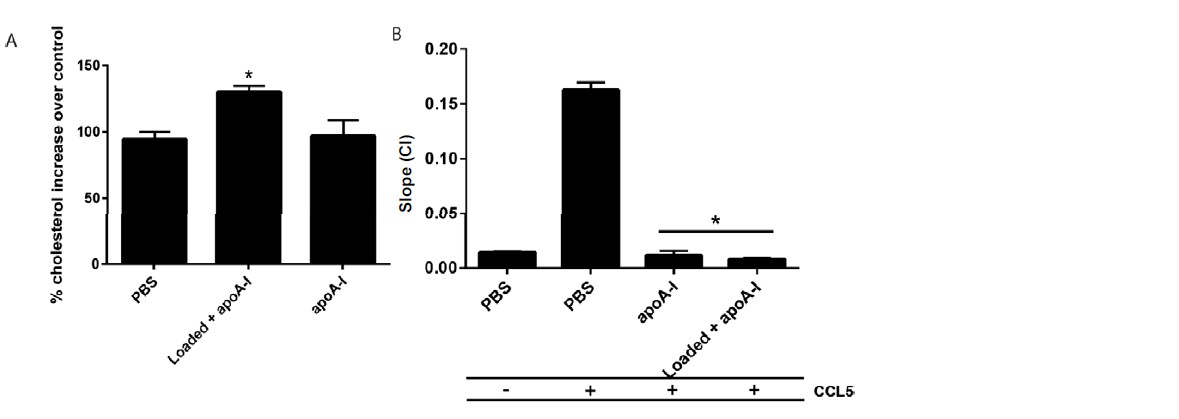
ApoA1 impairs the migratory capacity of cholesterol-loaded cells.
Biogel elicited macrophages were incubated with methy-β-cyclodextrin:cholesterol complexes (0.5 mg/mL) for 1 h to load cells, or PBS as vehicle control. Cholesterol quantification of cells confirmed that the macrophages were loaded (not shown). (A) Following incubation, cells were washed and then treated for 1 h with apoA1 (40 µg/ml) before being added to the upper chamber (4×10⁵/well) of a CIM-16 plate and allowed to migrate for 7-8 h toward 10 nM CCL5. Migration was measured by slope analysis (B). Data are expressed as mean + SEM, n = 3 biological replicates with 3-4 technical replicates per condition. Statistical analysis was conducted by one-way ANOVA with Dunnett’s multiple comparison post-test. * p,0.05 relative to PBS treated cells (for efflux studies) or 10 nM CCL5 alone (for migration studies).
Author response image 4

ApoA1 depletes membrane lipid rafts of cholesterol in cholesterol-loaded THP-1 cells.
Human THP-1 macrophages were incubated with methyl-β-cyclodextrin:cholesterol complexes (0.5 mg/mL) for 1 h to cholesterol-load cells prior to incubation for 1 h with 40 µg/mL apoA1 or PBS. Cells were then homogenized in a 0.2% Triton-X 100 containing buffer prior to 5-45% sucrose density gradient centrifugation. Fractions were collected from the top (fraction 1, lightest fraction) to the bottom (fraction 10, heaviest fraction), and cholesterol content of each fraction quantified. The sums of the cholesterol content in lipid raft fractions (fractions 2-4), and non-raft fractions (fractions 8-10), are shown in panels (A) and (B) respectively. Statistical analysis was conducted by using Student’s t-test, taking P < 0.05 as statistically significant.
Download links
A two-part list of links to download the article, or parts of the article, in various formats.
Downloads (link to download the article as PDF)
Open citations (links to open the citations from this article in various online reference manager services)
Cite this article (links to download the citations from this article in formats compatible with various reference manager tools)
Acute exposure to apolipoprotein A1 inhibits macrophage chemotaxis in vitro and monocyte recruitment in vivo
eLife 5:e15190.
https://doi.org/10.7554/eLife.15190


