Complexin induces a conformational change at the membrane-proximal C-terminal end of the SNARE complex
- Howard Hughes Medical Institute, Stanford University, United States
Figures
Figure 1
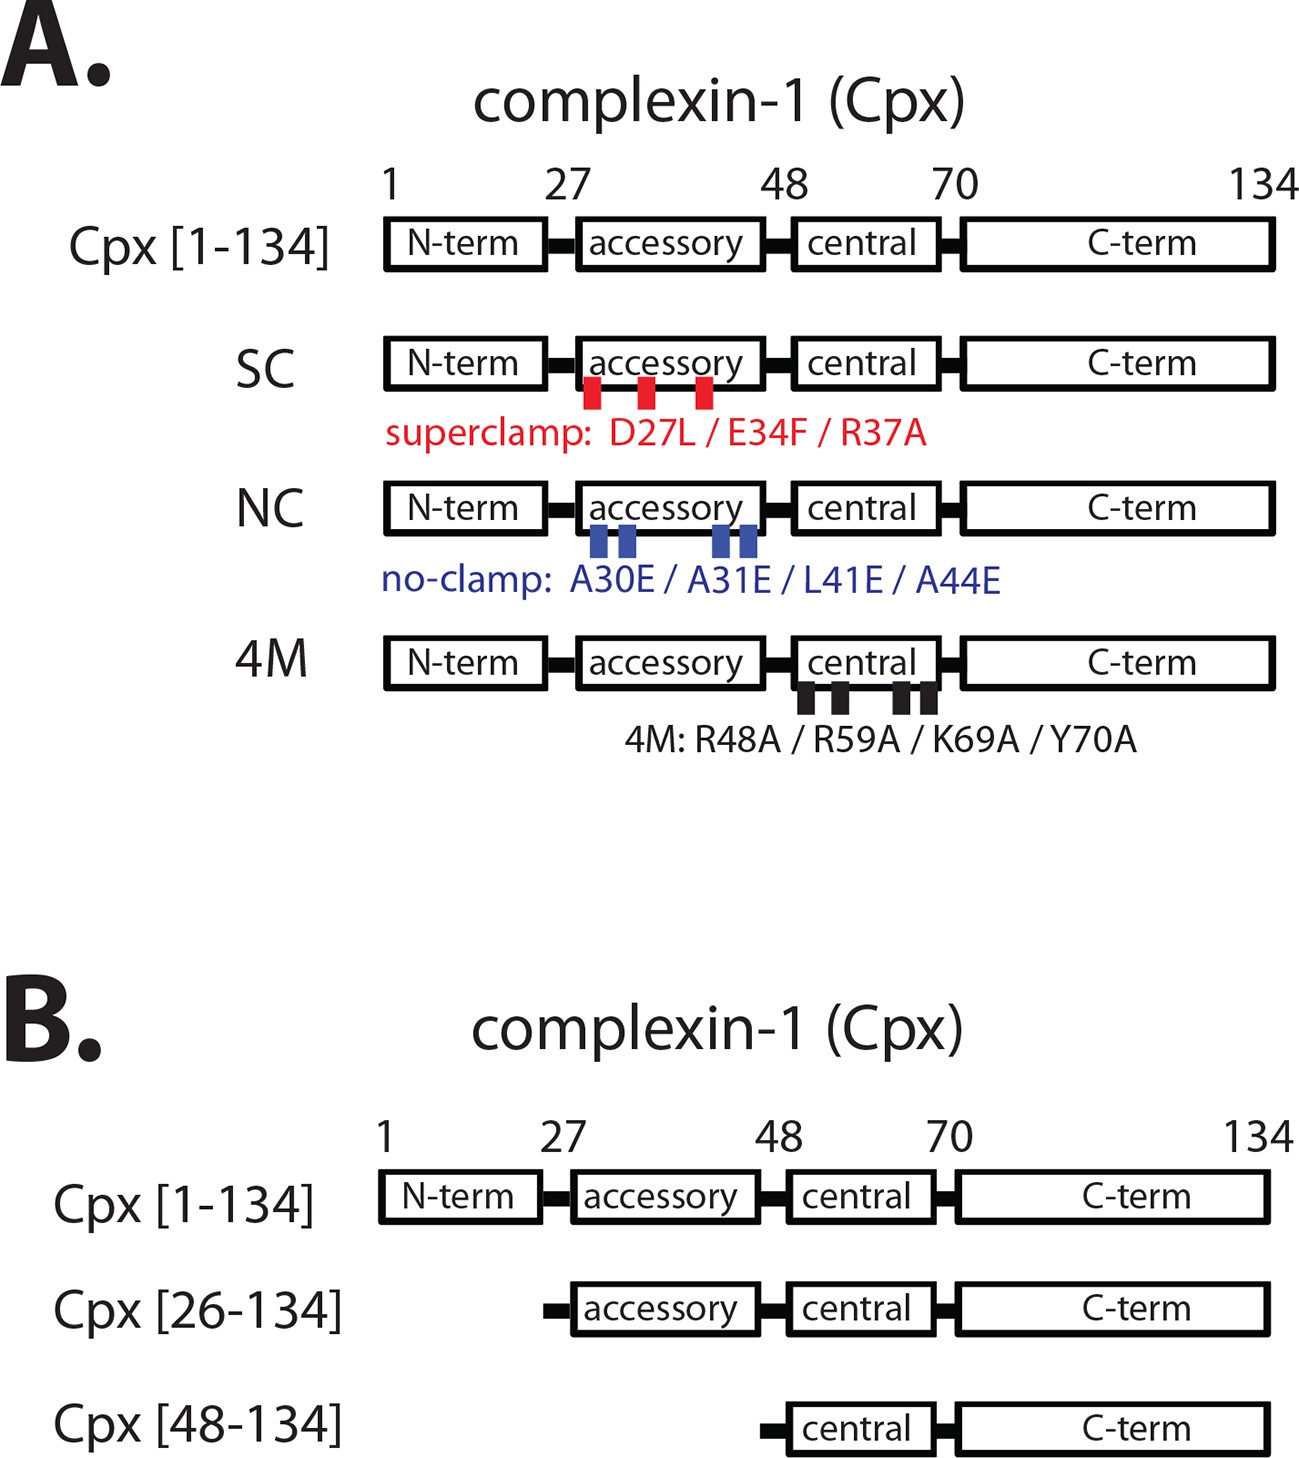
Domain diagram of complexin-1, mutants, and truncations.
(A) Domain diagram for full-length wildtype complexin-1 (Cpx [1–134]) and complexin-1 mutants (SC, superclamp; NC, no-clamp; 4M, mutation of the central helix that prevents binding to ternary SNARE complex). (B) Domain diagrams for truncation mutants of complexin-1 (Cpx [26–134], Cpx [48–134]).
Figure 2
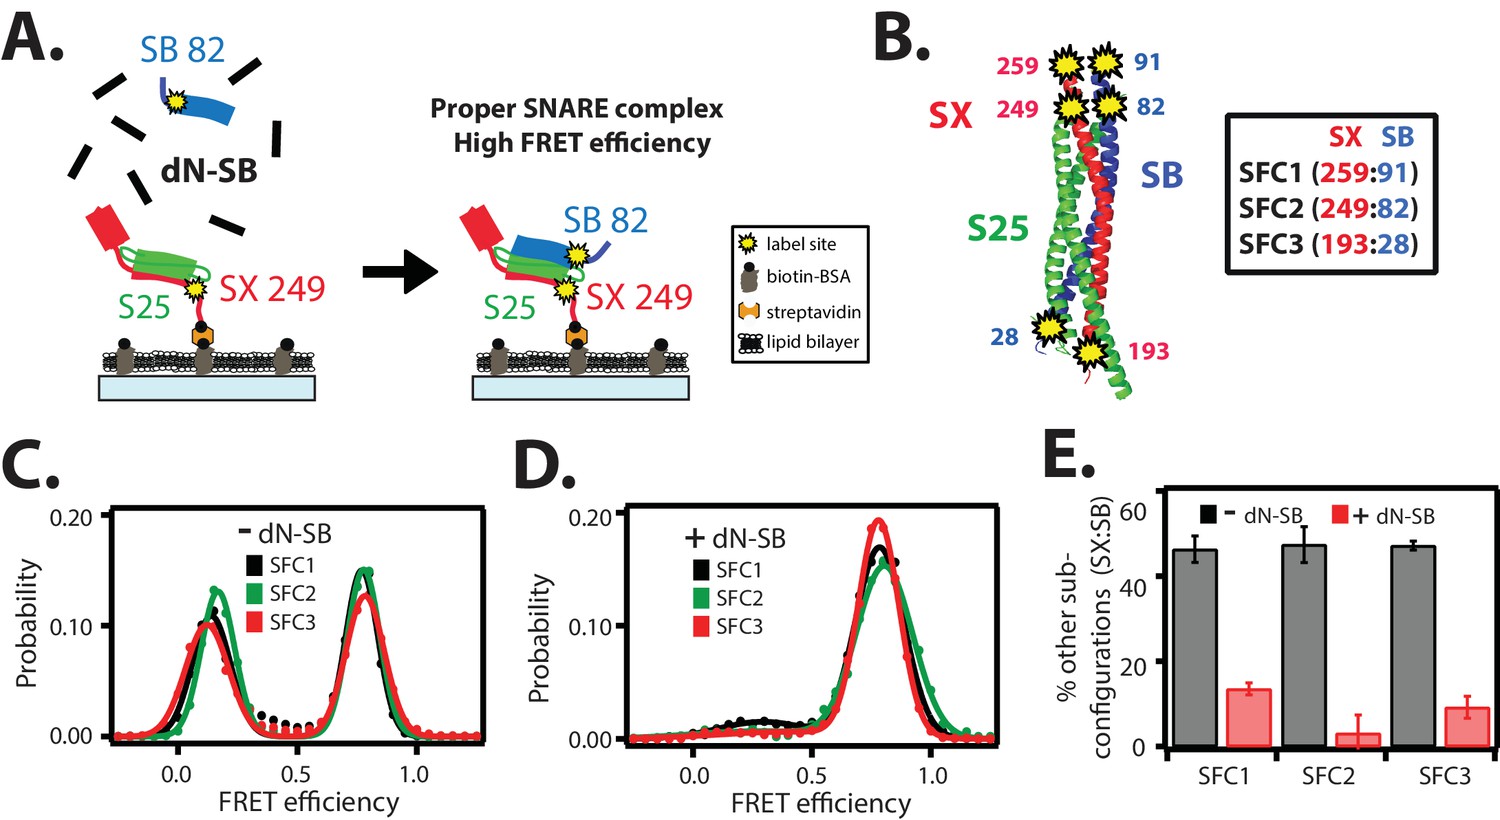
The dN-SB method achieves proper assembly of the ternary SNARE complex.
(A) Left panel: schematic of the dN-SB method for assembly of the ternary SNARE complex. The cytoplasmic domain of syntaxin-1A (SX, colored red) was surface-tethered through biotin-streptavidin (orange dot) linkage to a passivated microscope slide. Next, SNAP-25A (S25, colored green) was added. Subsequently, the cytoplasmic domain of synaptobrevin-2 (SB, colored blue) was added. For the dN-SB method, 10 μM dN-SB fragment was added concurrently with SB to the surface-tethered SX-S25 complex. Unbound proteins were washed away before smFRET measurements. Both SX and SB were labeled with fluorescent dyes (the SNARE label pair SFC2 is indicated by the yellow dots, SX 249 and SB 82). Right panel: properly assembled ternary SNARE complex is expected to produce high FRET efficiency for the SFC2 label pair. (B) Location of three SNARE label pairs (SFC1, SFC2, SFC3) in the crystal structure of the ternary SNARE complex (PDB ID: 1SFC), as defined in the legend. Separate experiments were performed for each of the three label pairs. Labeling of the two sites of a particular pair was performed separately with FRET donor and acceptor dyes (Alexa 555 and Alexa 647, respectively, Figure 2—source data 1) and the ternary SNARE complex was formed using the dN-SB method. The analysis was restricted to cases where FRET was observed, i.e., complexes that contain one donor and one acceptor dye. (C,D) smFRET efficiency histograms for the SNARE label pairs SFC1, SFC2, SFC3 for the surface-tethered ternary SNARE complex that was formed in the absence (C) and presence (D) of the dN-SB fragment. (E) Summary bar chart of the histograms shown in panels D,E, illustrating the effect of the dN-SB method in suppressing improper subconfigurations between SX and SB during the assembly of the ternary SNARE complex. “% other subconfigurations (SX:SB)” is calculated as the ratio of the areas under the two Gaussian functions that are fit to the low and high FRET efficiency states in the corresponding smFRET efficiency histograms, respectively. Shown are mean values ± SD for the two subsets of an equal partition of the data that are comprised of the observed FRET efficiency values for all molecules for each different condition (see data summary table in Figure 2—source data 1).
-
Figure 2—source data 1
Data summary table for the results shown in Figure 2E.
- https://doi.org/10.7554/eLife.16886.005
Figure 3
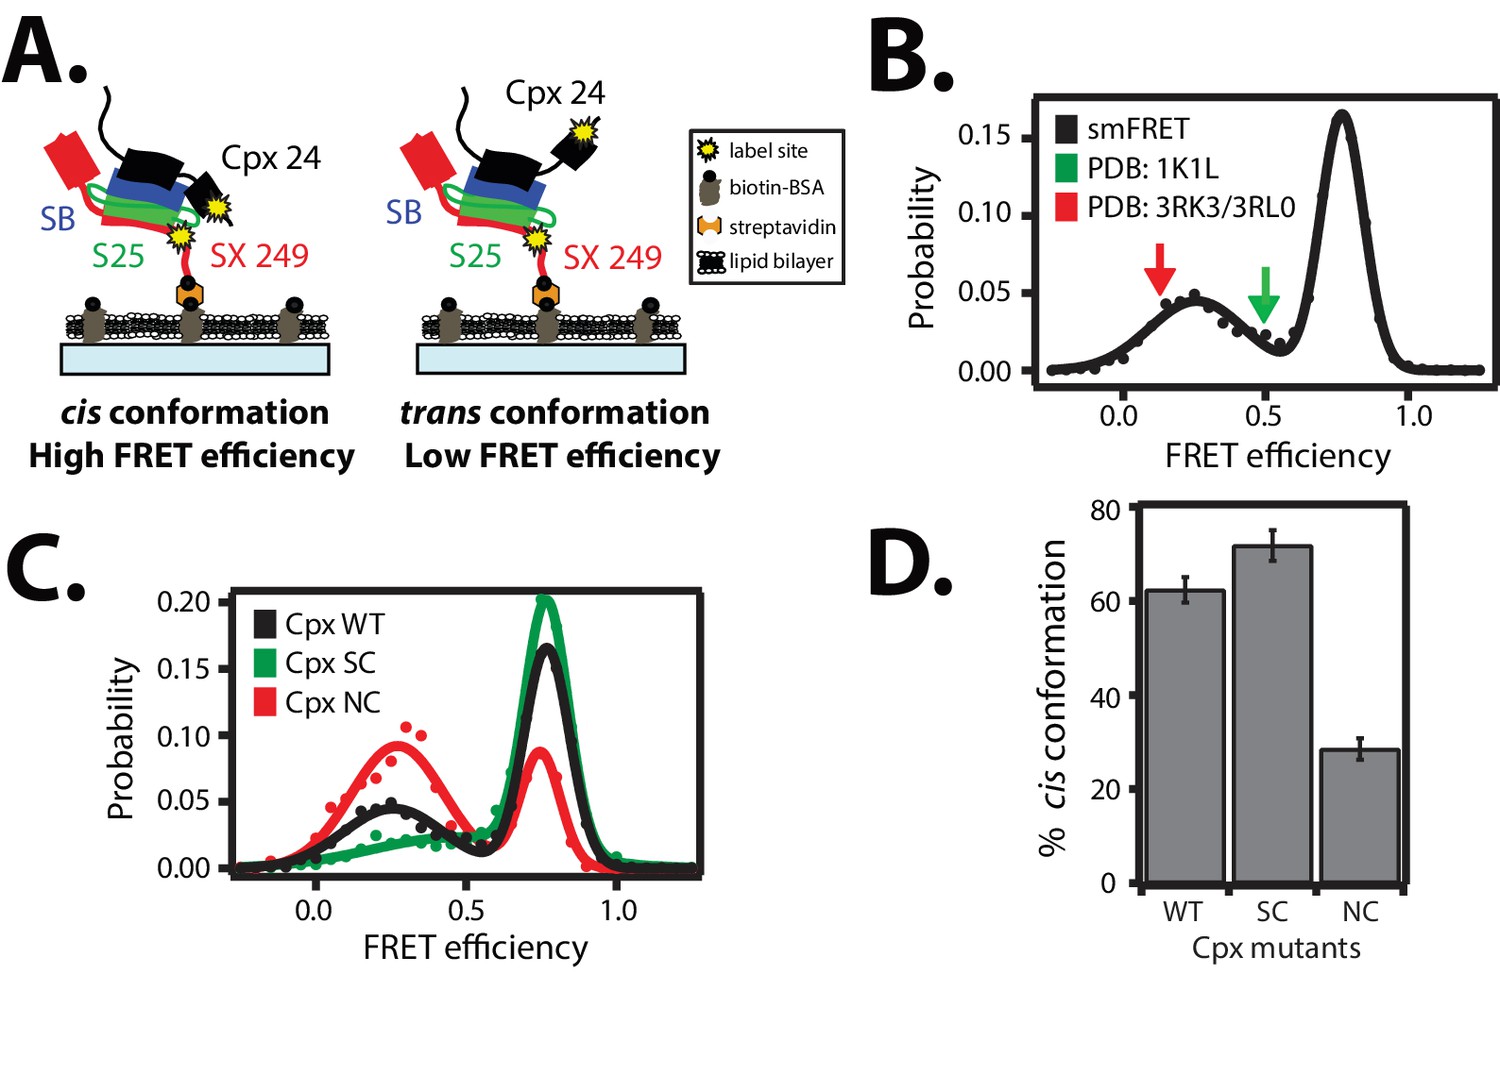
Cis and trans conformations of the accessory domain of complexin-1 when bound to ternary SNARE complex.
(A) Schematic of smFRET measurements with fluorescent labels attached to the accessory domain of complexin-1 and to the C-terminal end of the ternary SNARE complex. The cytoplasmic domain of syntaxin-1A (SX, colored red) was surface-tethered through biotin-streptavidin (orange dot) linkage to a passivated microscope slide. Prior to tethering SX was labeled with FRET acceptor dye (Alexa 647) at residue 249 (SX 249, yellow dot). Next, SNAP-25A (S25, colored green) was added. Subsequently the cytoplasmic domain of synaptobrevin-2 (SB, colored blue) and 10 μM dN-SB fragment were added concurrently to the surface-tethered SX-S25 complex (i.e., using the dN-SB method). Unbound proteins were then washed away. Full-length wildtype complexin-1 (Cpx, black) was labeled with FRET donor dye (Alexa 555) at residue position 24 (Cpx 24, yellow dot) and added to the surface tethered ternary SNARE complex at 0.01 μM Cpx concentration. Unbound Cpx was then washed away. (B) smFRET efficiency histogram for the label pairs described in panel A using wildtype Cpx. Arrows indicate the calculated FRET efficiencies for two crystal structures (red: 0.13 for PDB IDs 3RK3, 3RL0; green: 0.49 for PDB ID 1KIL). (C) smFRET efficiency histogram for the label pairs described in panel A using wildtype (WT) Cpx and the accessory domain mutants (SC, superclamp; NC, no-clamp) of Cpx. (D) Summary bar chart of the histograms shown in panel C, illustrating the percentage of cis conformations for Cpx and its mutants. The “% cis conformation” is calculated as the ratio of the areas under the two Gaussian functions that are fit to the high and low FRET efficiency states in the corresponding smFRET efficiency histograms, respectively. Shown are mean values ± SD for the two subsets of an equal partition of the data that are comprised of the observed FRET efficiency values for all molecules for each different condition (see data summary table in Figure 3—source data 1).
-
Figure 3—source data 1
Data summary table for the results shown in Figure 3D.
- https://doi.org/10.7554/eLife.16886.007
Figure 4 with 1 supplement
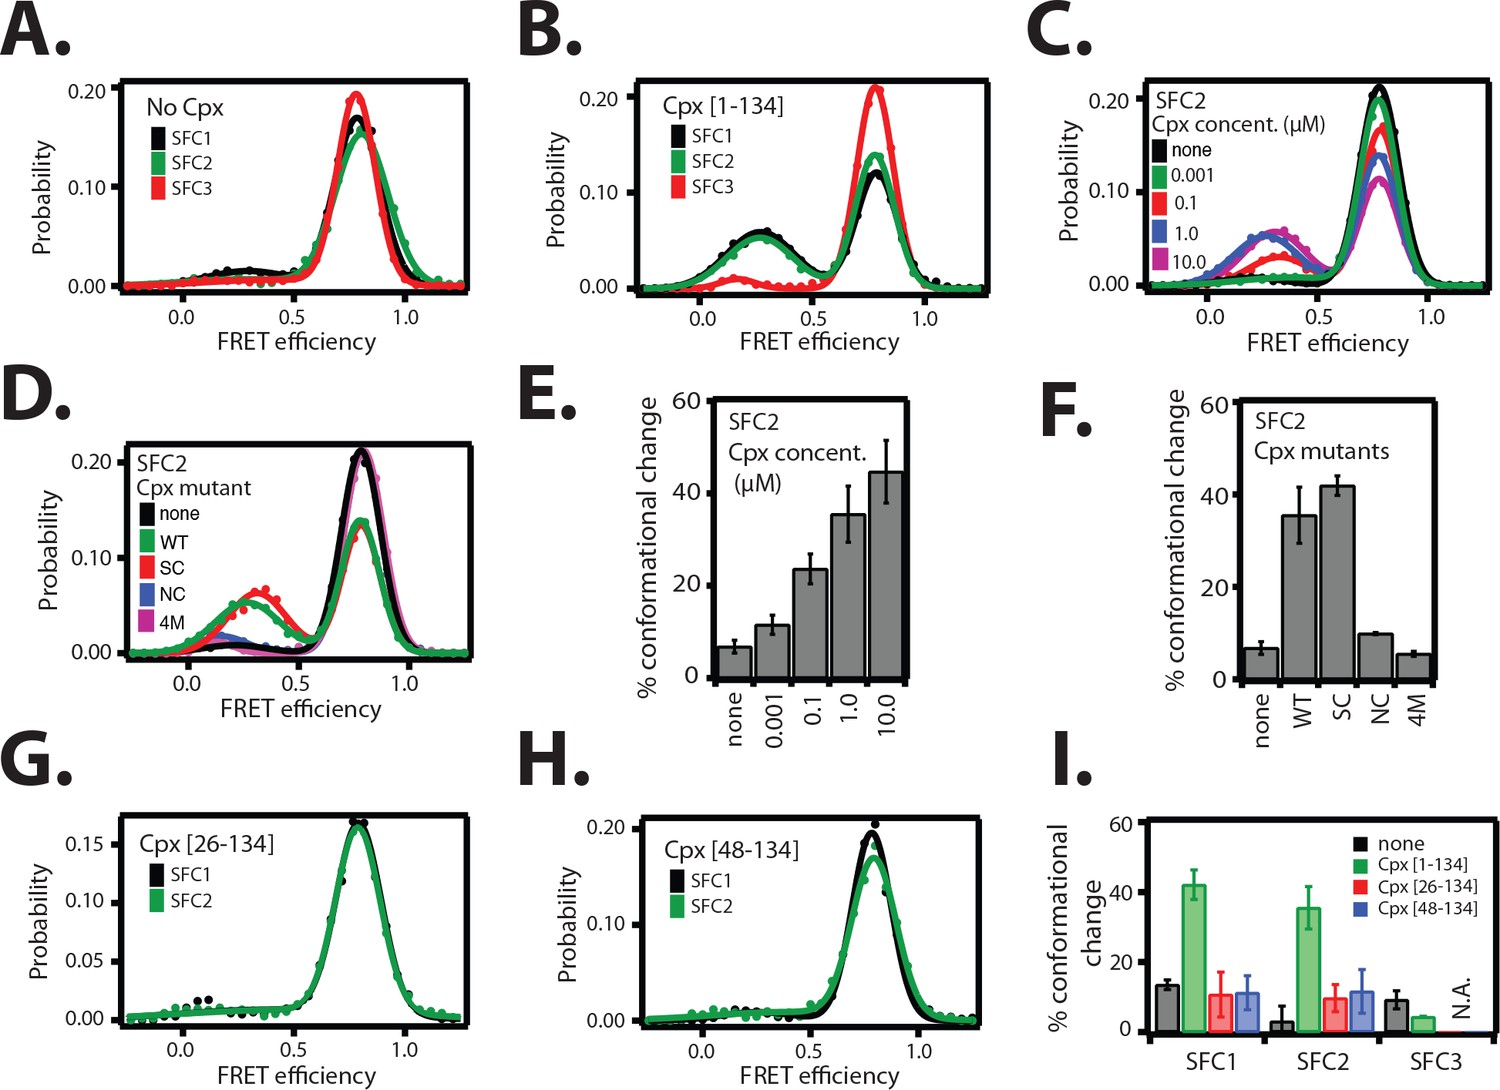
The cis conformation of complexin-1 induces a conformational change at the membrane-proximal C-terminal end of the ternary SNARE complex.
Surface-tethered ternary SNARE complexes were assembled using the dN-SB method as described in Figure 2A. The SNARE complex was labeled with each of the three SNARE label pairs SFC1, SFC2, SFC3 (as defined in Figure 2B) in separate experiments. Labeling of the two sites of a particular pair was performed separately with FRET donor and acceptor dyes (Alexa 555 and Alexa 647, respectively, Figure 4—source data 1) and the ternary SNARE complex was formed using dN-SB method. The analysis was restricted to cases where FRET was observed, i.e., complexes that contain one donor and one acceptor dye. Representative single molecule fluorescence intensity time traces for the SNARE label pair SFC2 are shown in Figure 4—figure supplement 1. A data summary table for all experiments in this figure is provided in Figure 4—source data 1. (A) smFRET efficiency histograms for SNARE label pairs SFC1, SFC2, SFC3 in the absence of full-length wildtype complexin-1 (Cpx [1–134]) (identical to Figure 2D). (B) smFRET efficiency histograms for SNARE label pairs SFC1, SFC2, SFC3 in the presence of full-length wildtype complexin-1 (Cpx [1–134]). 1 μM Cpx [1–134] was then added to form supercomplex with the ternary SNARE complex. (C) smFRET efficiency histograms for the SNARE label pair SFC2 in presence of wildtype full-length complexin-1 (Cpx [1-134]) at the specified concentrations. (D) smFRET efficiency histograms for SNARE label pair SFC2 in the presence of 1 μM full-length wildtype (WT) complexin-1 (Cpx) and its mutants (SC, superclamp; NC, no-clamp; and 4M mutation of the central domain that prevents binding to SNARE complex, Figure 1A). (E) Summary bar graph of the histograms shown in panel D. The “% conformational change” is calculated as the ratio of the areas under the two Gaussian functions that are fit to the low and high FRET efficiency states in the corresponding smFRET efficiency histograms, respectively. Shown are mean values ± SD for the two subsets of an equal partition of the data that are comprised of the observed FRET efficiency values for all molecules for each different condition (see data summary table in Figure 4—source data 1). (F) Summary bar graph of the histograms shown in panel E. The “% conformational change” is calculated as the ratio of the areas under the two Gaussian functions that are fit to the low and high FRET efficiency states in the corresponding smFRET efficiency histograms, respectively. Shown are mean values ± SD for the two subsets of an equal partition of the data that are comprised of the observed FRET efficiency values for all molecules for each different condition (see data summary table in Figure 4—source data 1). (G) smFRET efficiency histograms for SNARE label pairs SFC1 and SFC2 in the presence of 1 μM truncated complexin-1 (Cpx [26–134]) fragment (Figure 1B). (H) smFRET efficiency histograms for SNARE label pairs SFC1 and SFC2 in the presence of 1 μM truncated complexin-1 (Cpx [48–134]) fragment (Figure 1B). (I) Summary bar chart of the histograms in panels B,C,H, and I, illustrating the effect of WT complexin-1 and its truncation mutants on the conformation of the SNARE complex for the specified label pairs. Label pair SFC3 was not tested for the truncation mutants of complexin-1 since Cpx has no effect on the N-terminal end of the ternary SNARE complex. The “% conformational change” is calculated as the ratio of the areas under the two Gaussian functions that are fit to the low and high FRET efficiency states in the corresponding smFRET efficiency histograms, respectively. Shown are mean values ± SD for the two subsets of an equal partition of the data that are comprised of the observed FRET efficiency values for all molecules for each different condition (see data summary table in Figure 4—source data 1).
-
Figure 4—source data 1
Data summary table for the results shown in Figure 4A–D,G,H.
- https://doi.org/10.7554/eLife.16886.010
Figure 4—figure supplement 1
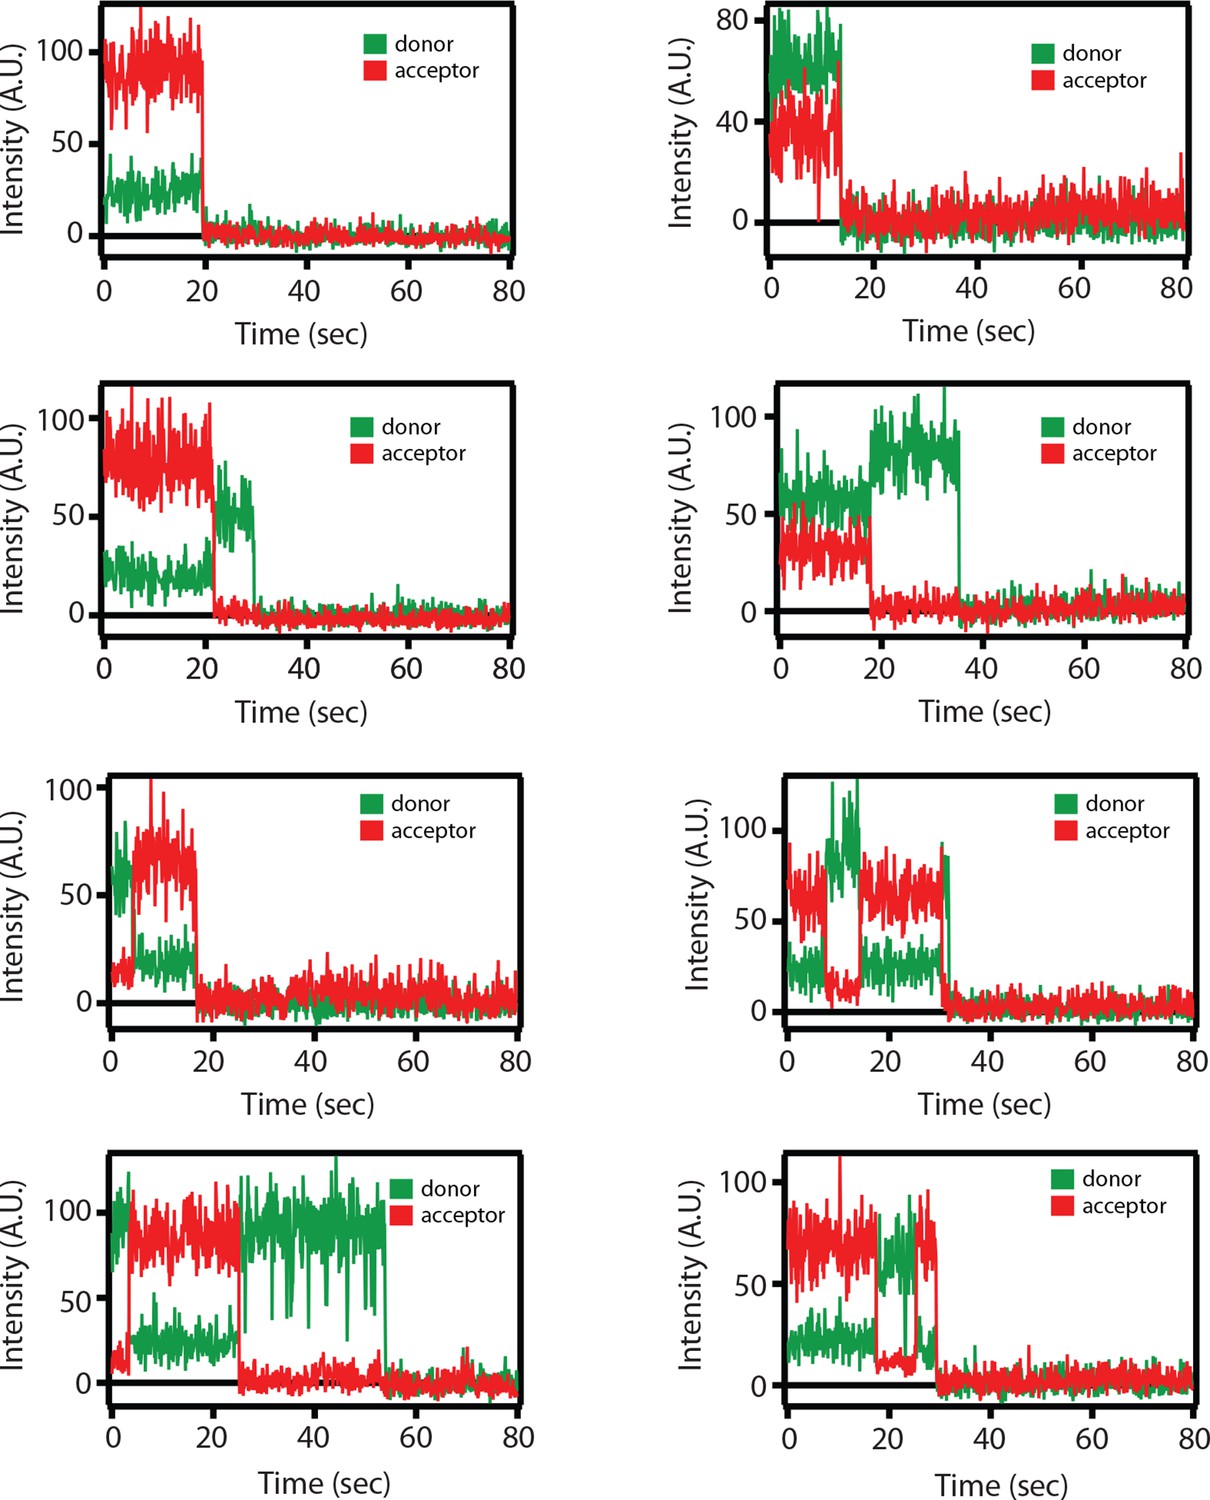
Representative single molecule fluorescence intensity time traces for the SNARE label pair SFC2 (Alexa 555 attached to residue 82 of the cytoplasmic domain of synaptobrevin-2 and Alexa 647 attached to residue 249 of the cytoplasmic domain of syntaxin-1A) in the presence of 1 μM full-length wildtype complexin-1 (Cpx [1-134]).
Occasional transitions between low and high FRET efficiency states were observed (characterized by a simultaneous increase of acceptor fluorescence and decrease of donor fluorescence intensity), as well as opposite translations from high FRET to low FRET efficiency states. Acceptor photobleaching is characterized by disappearance of acceptor fluorescence. Donor photobleaching is characterized by disappearance of donor fluorescence. FRET efficiencies were measured during the first 5 s (corresponding to 50 frames), i.e., well before such photobleaching events occurred.
Figure 5

Empirical γ-corrected smFRET efficiency histograms.
Empirical γ-corrected smFRET efficiency histograms for the SNARE label pairs SFC1 (A), SFC2 (B), in the presence (red) and absence (black) of 1 μM full-length wildtype complexin-1 (Cpx [1-134]). The FRET efficiency was calculated using Equation (4) as described in the Materials and methods. γ vs. FRET efficiency for the SFC1 (C) and SFC2 SNARE label pairs (D), in the presence (red) and absence (black) of 1 μM Cpx [1-134].
Figure 6
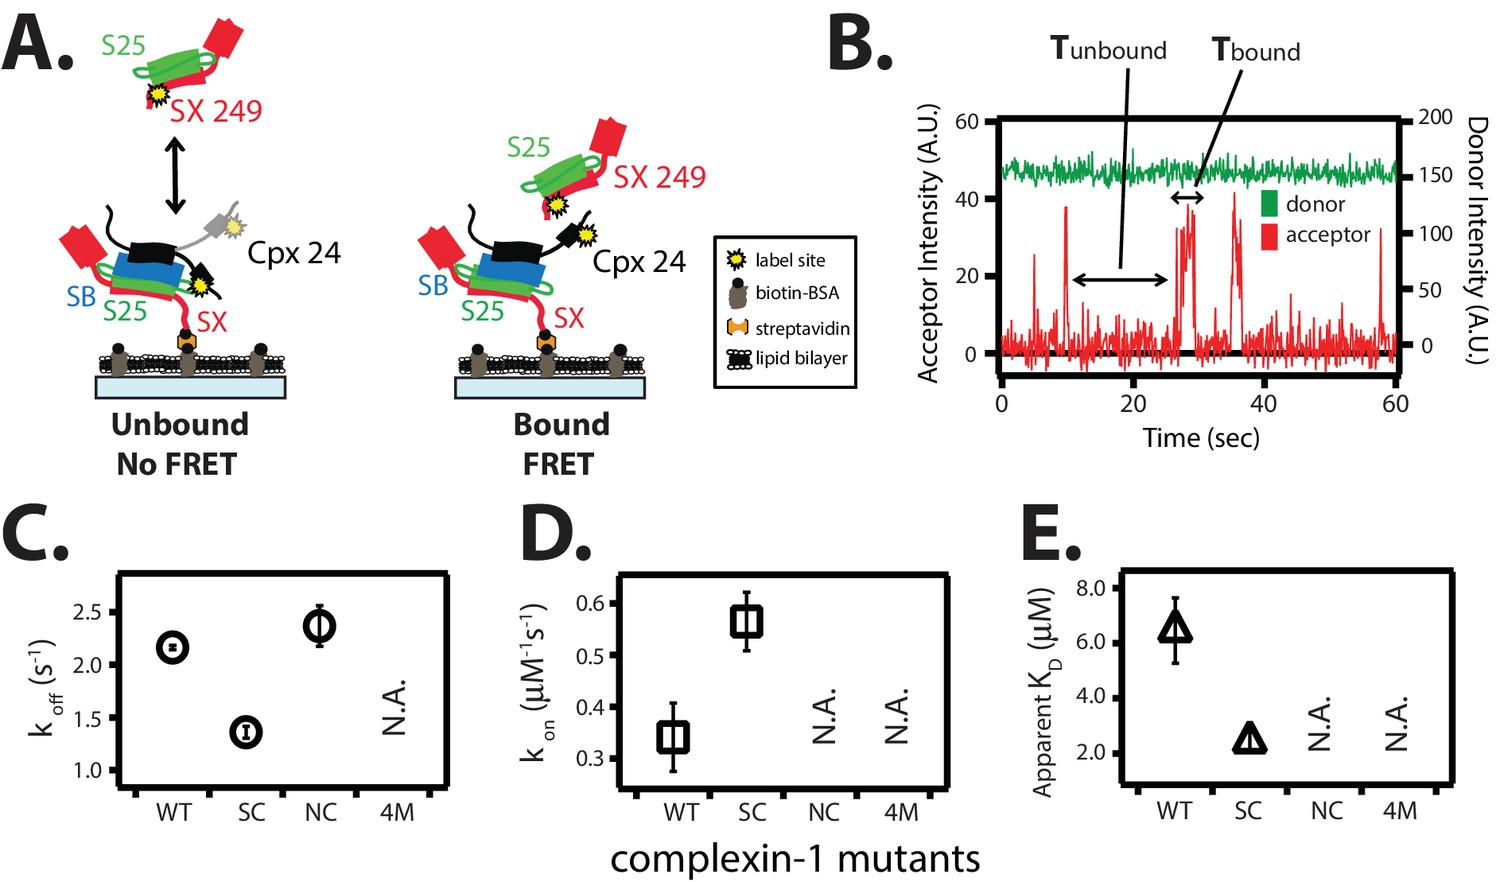
The trans conformation of complexin-1 can bridge a ternary and a binary SNARE complex through its central and accessory domains.
(A) Schematic of the single molecule binding experiment. The cytoplasmic domain of syntaxin-1A (SX) was surface-tethered through biotin-streptavidin (orange dot) linkage to a passivated microscope slide. Ternary SNARE complex (consisting of SX, the cytoplasmic domain of synaptobrevin-2 (SB), and SNAP-25A (S25)) was assembled using the dN-SB method. Full-length wildtype complexin-1 (Cpx [1-134]) was labeled with acceptor dye (Alexa 647) at residue position 24 (yellow dot). 50 nM of labeled complexin-1 was then incubated for 5 min to form complex with the surface-tethered ternary SNARE complexes. Unbound Cpx molecules were rinsed away. Next, purified binary SNARE complex (consisting of S25 and SX that was donor dye (Alexa 555) labeled at residue 249 of SX, yellow dot) was added at a concentration of 100 nM to the surface-tethered Cpx / ternary SNARE supercomplex. The appearance of acceptor dye fluorescence intensity indicates FRET from the binary SNARE complex and to the surface-tethered Cpx / ternary SNARE supercomplex. A data summary table for all experiments in this figure is provided in Figure 6—source data 1. (B) Representative single molecule fluorescence intensity time traces showing smFRET events between the complexin-1 accessory domain of complexin-1 / ternary SNARE supercomplex and a binary (syntaxin-1A / SNAP-25A) SNARE complex. The donor fluorescence intensity is colored green (scale on the right y-axis) and the acceptor fluorescence intensity (scale on the left y-axis) is colored red. Due to the high concentration of the donor labeled proteins in solution, there is no significant effect on the donor intensity upon FRET with an acceptor dye. The stepwise increase in acceptor fluorescence intensity represents bound states and the gaps in between bound states are unbound states. Tbound and Tunbound represent the dwell time of bound and unbound states, respectively. (C,D) Dissociation rates (C, open circles) and association rates (D, open squares) between binary SNARE complex and surface-tethered Cpx mutants (WT, wildtype; SC, superclamp mutant; NC, no clamp mutant, 4M, mutation of the central helix that prevents binding to ternary SNARE complex, see Figure 1A). Rates are calculated as described in Materials and methods. Error bars are standard deviations calculated from two subsets of an equal partition of the data (see data summary table in Figure 6—source data 1). (E) Apparent dissociation constant KD (= koff/kon) of binding between binary SNARE complex and Cpx or its mutants. Error bars are standard deviations calculated from two subsets of an equal partition of the data (see data summary table in Figure 6—source data 1).
-
Figure 6—source data 1
Data summary table for the results shown in Figure 6C–E.
- https://doi.org/10.7554/eLife.16886.017
Figure 7
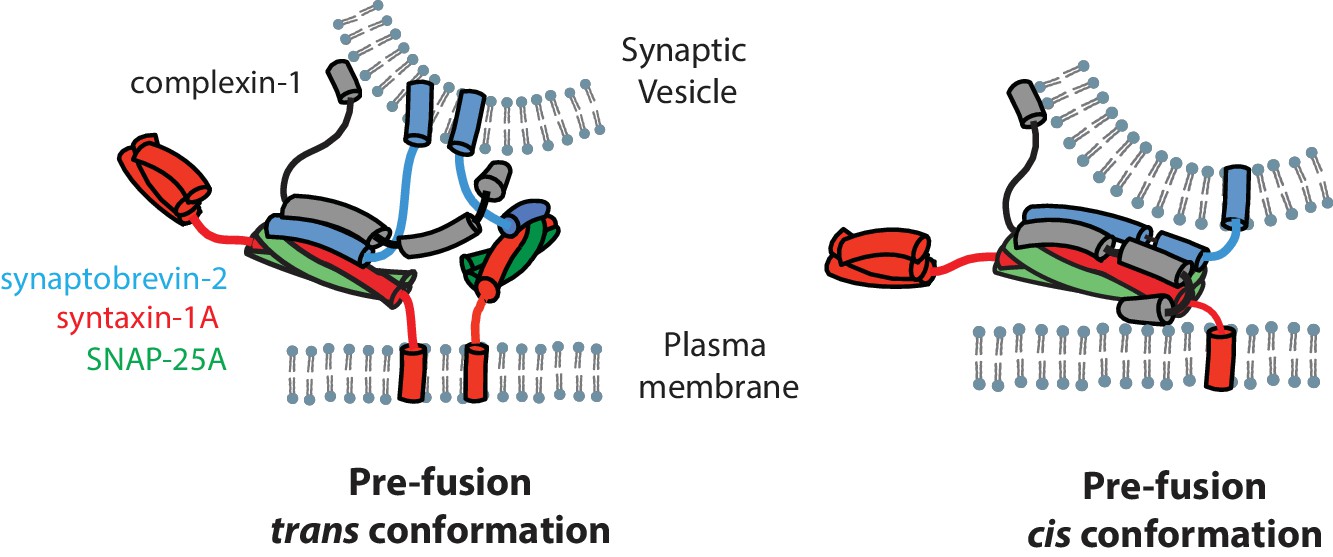
Models of the cis and trans conformations of complexin-1.
https://doi.org/10.7554/eLife.16886.018
Figure 8
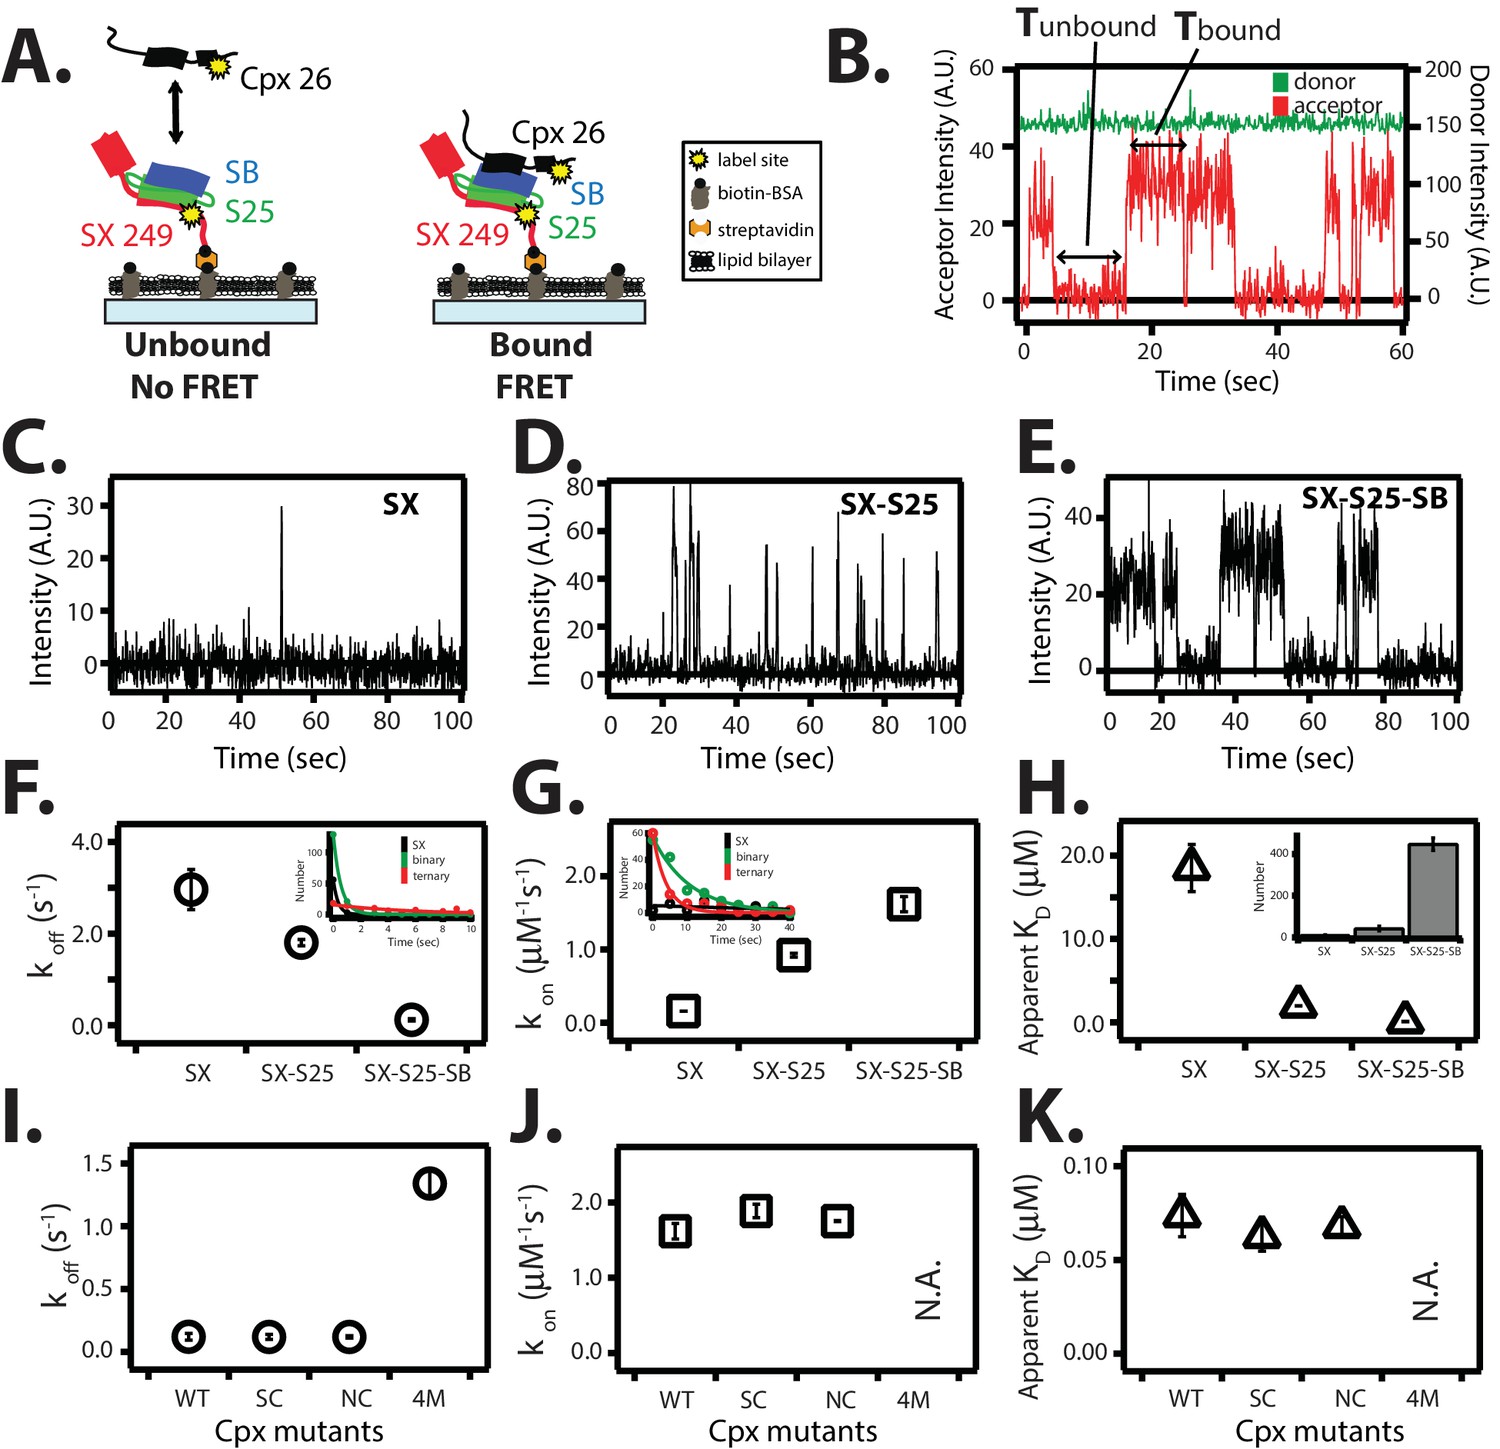
Single molecule detection of complexin-1 interacting with SNAREs.
(A) Schematic of the smFRET binding assay. The cytoplasmic domain of syntaxin-1A (SX) was labeled with acceptor dye (Alexa 647) at residue position 249 (yellow dot) and surface-tethered through biotin-streptavidin (orange dot) linkage on a passivated microscope slide. Surface-tethered and labeled syntaxin-1A was used in isolation, or as part of a binary SNARE complex with SNAP-25A (SX-S25), or as part of a ternary SNARE complex with S25 and the cytoplasmic domain of synaptobrevin-2 (SB). Complexin-1 (Cpx) was labeled with donor dye (Alexa 555) labeled at residue position 26 (yellow dot) and added at a concentration of 100 nM in TBS buffer (20 mM Tris, 150 mM NaCl, pH 7.5) to the sample chamber. smFRET is expected if Cpx interacts with the surface-tethered SNARE complexes. A data summary table for all experiments in this figure is provided in Figure 8—source data 1. (B) Representative single molecule fluorescence intensity time traces showing individual binding events between ternary SNARE complex and Cpx. The donor dye fluorescence intensity (scale on the right y-axis) is colored green and the acceptor dye fluorescence intensity (scale on the left y-axis) is colored red. Due to the high concentration of the donor labeled proteins in solution, there is no significant effect on the donor intensity upon FRET with an acceptor dye. The stepwise increase in acceptor fluorescence intensity represents a bound state and gaps in between bound states represents unbound states. Tbound and Tunbound represent the dwell times of bound and unbound states, respectively. (C–E) Acceptor dye fluorescence intensities of Cpx molecules interacting with surface-tethered SX alone (C), binary SNARE (SX-S25) complex (D), and ternary SNARE complex (SX-S25-SB) (E). (F,G) Dissociation rates koff (open circles) and association rates kon (open squares) between Cpx and surface-tethered SX, binary SNARE complex (SX-S25), and ternary SNARE complex (SX-S25-SB). The insets show single exponential fits to histograms of the unbound and bound dwell times. Rates are calculated as described in Materials and methods. Error bars are standard deviations calculated from two subsets of an equal partition of the data (see data summary table in Figure 8—source data 1). (H) Apparent dissociation constant KD (= koff/kon) of Cpx binding to SX alone, binary SNARE complex (SX-S25), and ternary SNARE complex (SX-S25-SB). The inset shows bar graphs of the number of spots quantified from snapshots of the field of view of the acceptor channel corresponding to FRET events when complexin-1 interacts with the three different surface conditions. Error bars are standard deviations calculated from two subsets of an equal partition of the data (see data summary table in Figure 8—source data 1). (I,J) Dissociation rates koff (G, open circles) and association rates kon (H, open squares) between Cpx and its mutants (WT, wildtype; SC, superclamp; NC, no-clamp; 4M, mutation of the central complex domain that prevents SNARE complex binding, see Fig, 1A) and surface-tethered ternary SNARE complex. Rates are calculated as described in Materials and methods. Error bars are standard deviations calculated from two subsets of an equal partition of the data (see data summary table in Figure 8—source data 1). (K) Apparent dissociation constant KD (= koff/kon) for binding between ternary SNARE complex and complexin-1 or mutants. Error bars are standard deviations calculated from two subsets of an equal partition of the data (see data summary table in Figure 8—source data 1).
-
Figure 8—source data 1
Data summary table for the results shown Figure 8F–K.
- https://doi.org/10.7554/eLife.16886.020
Tables
Table 1
γ-corrected smFRET efficiencies between fluorescent dye labels attached to complexin-1 (Cpx) mutants (WT, wildtype; SC, superclamp; NC, no-clamp) and ternary SNARE complex obtained from smFRET measurements. The γ-factors for the Cpx mutants (Cpx WT: 1.66, Cpx SC: 1.62, Cpx NC: 1.42) were empirically estimated, and the corresponding mean values were used to correct the corresponding smFRET efficiency histogram shown in Figure 3A,B using Equation (4) as described in the Materials and methods. The two FRET efficiencies shown in the table are the peak positions of two Gaussian functions that were fit to the γ-corrected smFRET efficiency histograms, and the error bounds are standard deviations of the peak positions. For comparison, FRET efficiencies were calculated from the specified crystal structures (PDB IDs: 3RK3, 3RL0, and 1KIL, see Materials and methods for the calculation of FRET efficiencies from crystal structures). Cpx was labeled with FRET donor dye (Alexa 555) molecule at residue position 24 and syntaxin-1A was labeled with FRET acceptor dye (Alexa 647) molecule at residue position 249.
| γ-corrected smFRET efficiency | FRET efficiency calculated from the specified crystal structures | |
|---|---|---|
| Cpx WT | 0.19 ± 0.12 (trans) 0.83 ± 0.15 (cis) | 0.13 (PDB ID: 3RK3, 3RL0) 0.49 (PDB ID: 1KIL) |
| Cpx SC | 0.28 ± 0.18 (trans) 0.83 ± 0.14 (cis) | |
| Cpx NC | 0.24 ± 0.13 (trans) 0.81 ± 0.12 (cis) |
Table 2
γ-corrected smFRET efficiencies between fluorescent labels attached to the ternary SNARE complex (label pairs SFC1 and SFC2 as defined in Figure 2B) obtained from smFRET measurements in the presence and absence of 1 μM full-length wildtype complexin-1 (Cpx [1-134]). Mean γ-factors (Table 2—source data 1) were used to correct the smFRET efficiency histograms shown in Figure 4A–B using Equation (4) as described in the Materials and methods. The FRET efficiencies shown in the table are the peak positions of one or two Gaussian functions that were fit to the γ-corrected smFRET efficiency histograms, and the error bounds are standard deviations of the peak positions. As explained in the text, the population of the low FRET efficiency state in the presence of Cpx likely corresponds to the cis conformation of bound complexin-1, whereas the population of the high FRET efficiency state likely corresponds to the trans conformation of bound complexin-1 or SNARE complex alone. For comparison, FRET efficiencies were calculated from the crystal structure of the ternary SNARE complex (PDB ID: 1SFC, see Materials and methods for the calculation of FRET efficiencies from the crystal structures).
| γ-corrected smFRET efficiency - Cpx | γ-corrected smFRET efficiency +Cpx | FRET efficiency calculated from the crystal structure (PDB ID: 1SFC) | |
|---|---|---|---|
| SFC1 | 0.85 ± 0.17 | 0.27 ± 0.11 0.85 ± 0.14 | 0.98 |
| SFC2 | 0.90 ± 0.18 | 0.31 ± 0.13 0.86 ± 0.12 | 0.98 |
-
Table 2—source data 1
The means of the empirical γ-factors for SNARE label pairs SFC1 and SFC2 in the presence and absence of 1 μM complexin-1 (Cpx [1-134]) for the data shown in Figure 5.
- https://doi.org/10.7554/eLife.16886.013
Table 3
Fluorescence anisotropy measurements of Alexa 555 or Alexa 647 dyes linked to the specified residues in the cytoplasmic domains of syntaxin-1 (SX) or synaptobrevin-2 (SB), either in isolation or as part of the ternary SNARE complex, in the presence and absence of 1 μM full-length wildtype complexin-1 (Cpx [1-134]). The numbers after 'SX' and 'SB' are the residue positions of the corresponding labeling sites. The formation of ternary SNARE complex and the presence of complexin-1 did not substantially affect the fluorescence anisotropy. Shown are means ± SD for n = 3 replicates.
| Constructs | Steady state anisotropy (r) |
|---|---|
| Alexa 555 | 0.20 ± 0.06 |
| Alexa 555 (linked to SB 91) | 0.26 ± 0.01 |
| Alexa 555 (linked to SB 91, in ternary complex) | 0.31 ± 0.01 |
| Alexa 555 (linked to SB 91, in ternary complex) + 1 μM Cpx | 0.32 ± 0.03 |
| Alexa 555 (linked to SB 82) | 0.27 ± 0.01 |
| Alexa 555 (linked to SB 82, in ternary complex) | 0.27 ± 0.02 |
| Alexa 555 (linked to SB 82, in ternary complex) + 1 μM Cpx | 0.28 ± 0.06 |
| Alexa 555 (linked to SB 82, in ternary complex) + 10 μM Cpx | 0.28 ± 0.1 |
| Alexa 555 (linked to SB 28) | 0.24 ± 0.03 |
| Alexa 555 (linked to SB 28, in ternary complex) | 0.32 ± 0.01 |
| Alexa 555 (linked to SB 28, in ternary complex) + 1 μM Cpx | 0.32 ± 0.004 |
| Alexa 647 | 0.15 ± 0.08 |
| Alexa 647 (linked to SX 259) | 0.24 ± 0.09 |
| Alexa 647 (linked to SX 259, in ternary complex) | 0.27 ± 0.1 |
| Alexa 647 (linked to SX 259, in ternary complex) + 1 μM Cpx | 0.27 ± 0.1 |
| Alexa 647 (linked to SX 249) | 0.24 ± 0.02 |
| Alexa 647 (linked to SX 249, in ternary complex) | 0.26 ± 0.1 |
| Alexa 647 (linked to SX 249, in ternary complex) + 1 μM Cpx | 0.27 ± 0.08 |
| Alexa 647 (linked to SX 249, in ternary complex) + 10 μM Cpx | 0.28 ± 0.1 |
| Alexa 647 (linked to SX 193) | 0.27 ± 0.1 |
| Alexa 647 (linked to SX 193, in ternary complex) | 0.26 ± 0.08 |
| Alexa 647 (linked to SX 193, in ternary complex) + 1 μM Cpx | 0.27 ± 0.08 |
Download links
A two-part list of links to download the article, or parts of the article, in various formats.
Downloads (link to download the article as PDF)
Open citations (links to open the citations from this article in various online reference manager services)
Cite this article (links to download the citations from this article in formats compatible with various reference manager tools)
Complexin induces a conformational change at the membrane-proximal C-terminal end of the SNARE complex
eLife 5:e16886.
https://doi.org/10.7554/eLife.16886


