Integration of light and metabolic signals for stem cell activation at the shoot apical meristem
- Centre for Organismal Studies, Heidelberg University, Germany
- Max Planck Institute for Developmental Biology, Germany
Figures
Figure 1 with 1 supplement
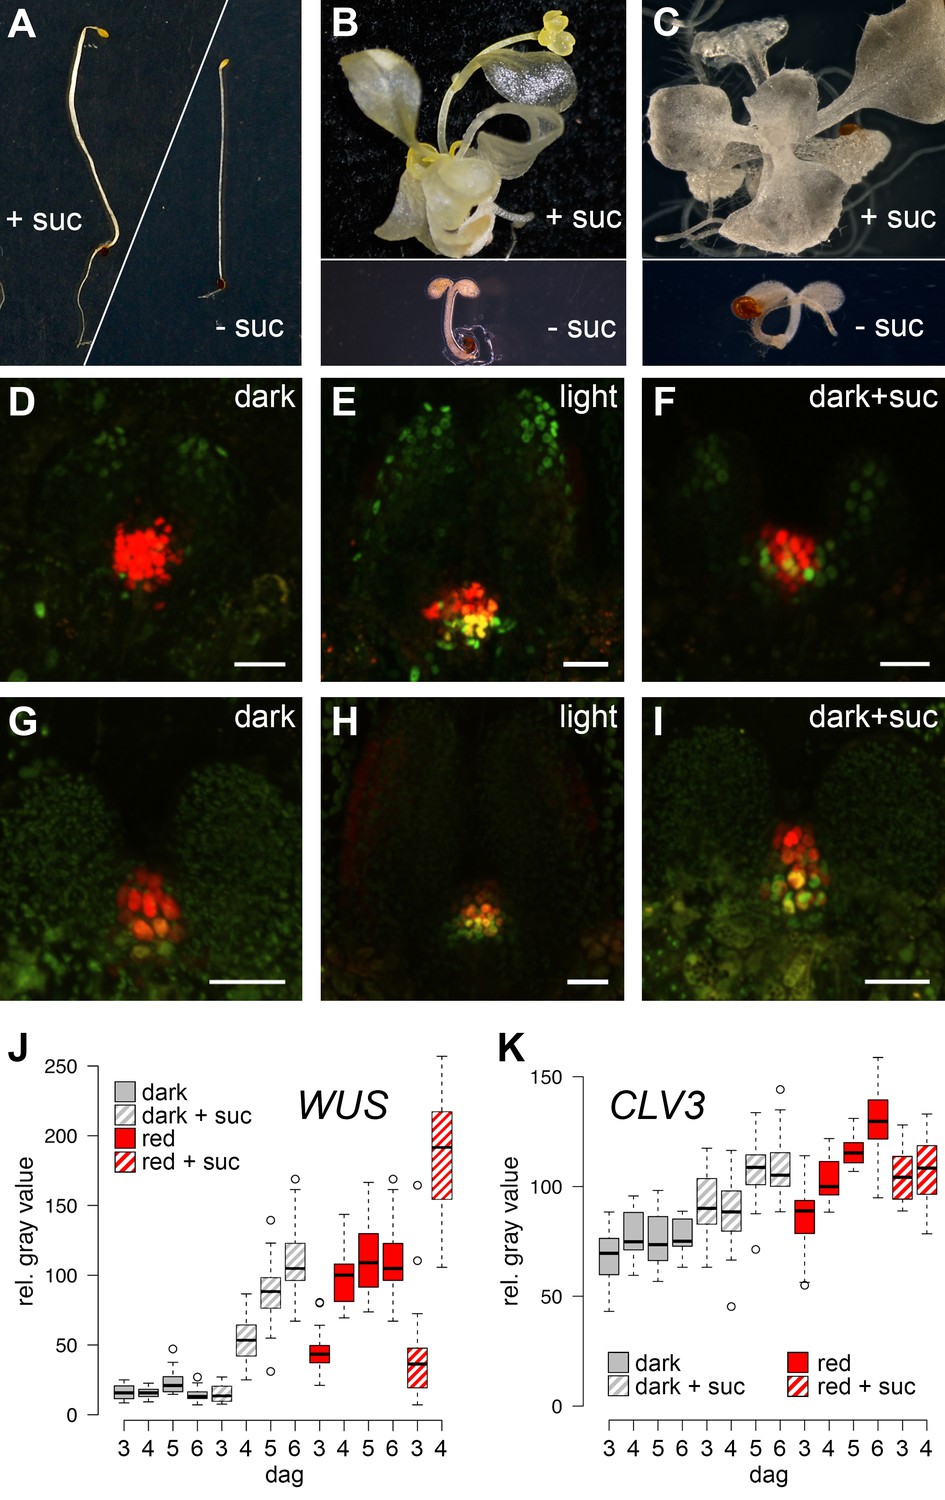
SAM development depends on light and sugar.
(A–C) Five week old plants grown on media with (+) or without (-) sucrose. (A) Wild-type plants grown in darkness, (B) cop1 mutant plants grown in darkness and (C) wild-type seedlings grown in light in the presence of 0.5 µM photosynthesis inhibitor norflurazon . (D–I) Maximum projections of SAMs of four day old seedlings; scale bar 20 µm. (D–F) pCLV3:mCHERRY-NLS (red) and pWUS:3xVENUS-NLS (green). (G–I) pCLV3:mCHERRY-NLS (red) and pWUS:WUS-linker-GFP (green). Quantification of pWUS:3xVENUS-NLS (J) and pCLV3:mCHERRY-NLS (K) expression by fluorescence intensity under different growth conditions (gray = darkness, red = red light (30 µmol*m−2*s−1), solid box = w/o sucrose, hatched box = 1% sucrose, dag = days after germination).
Figure 1—figure supplement 1
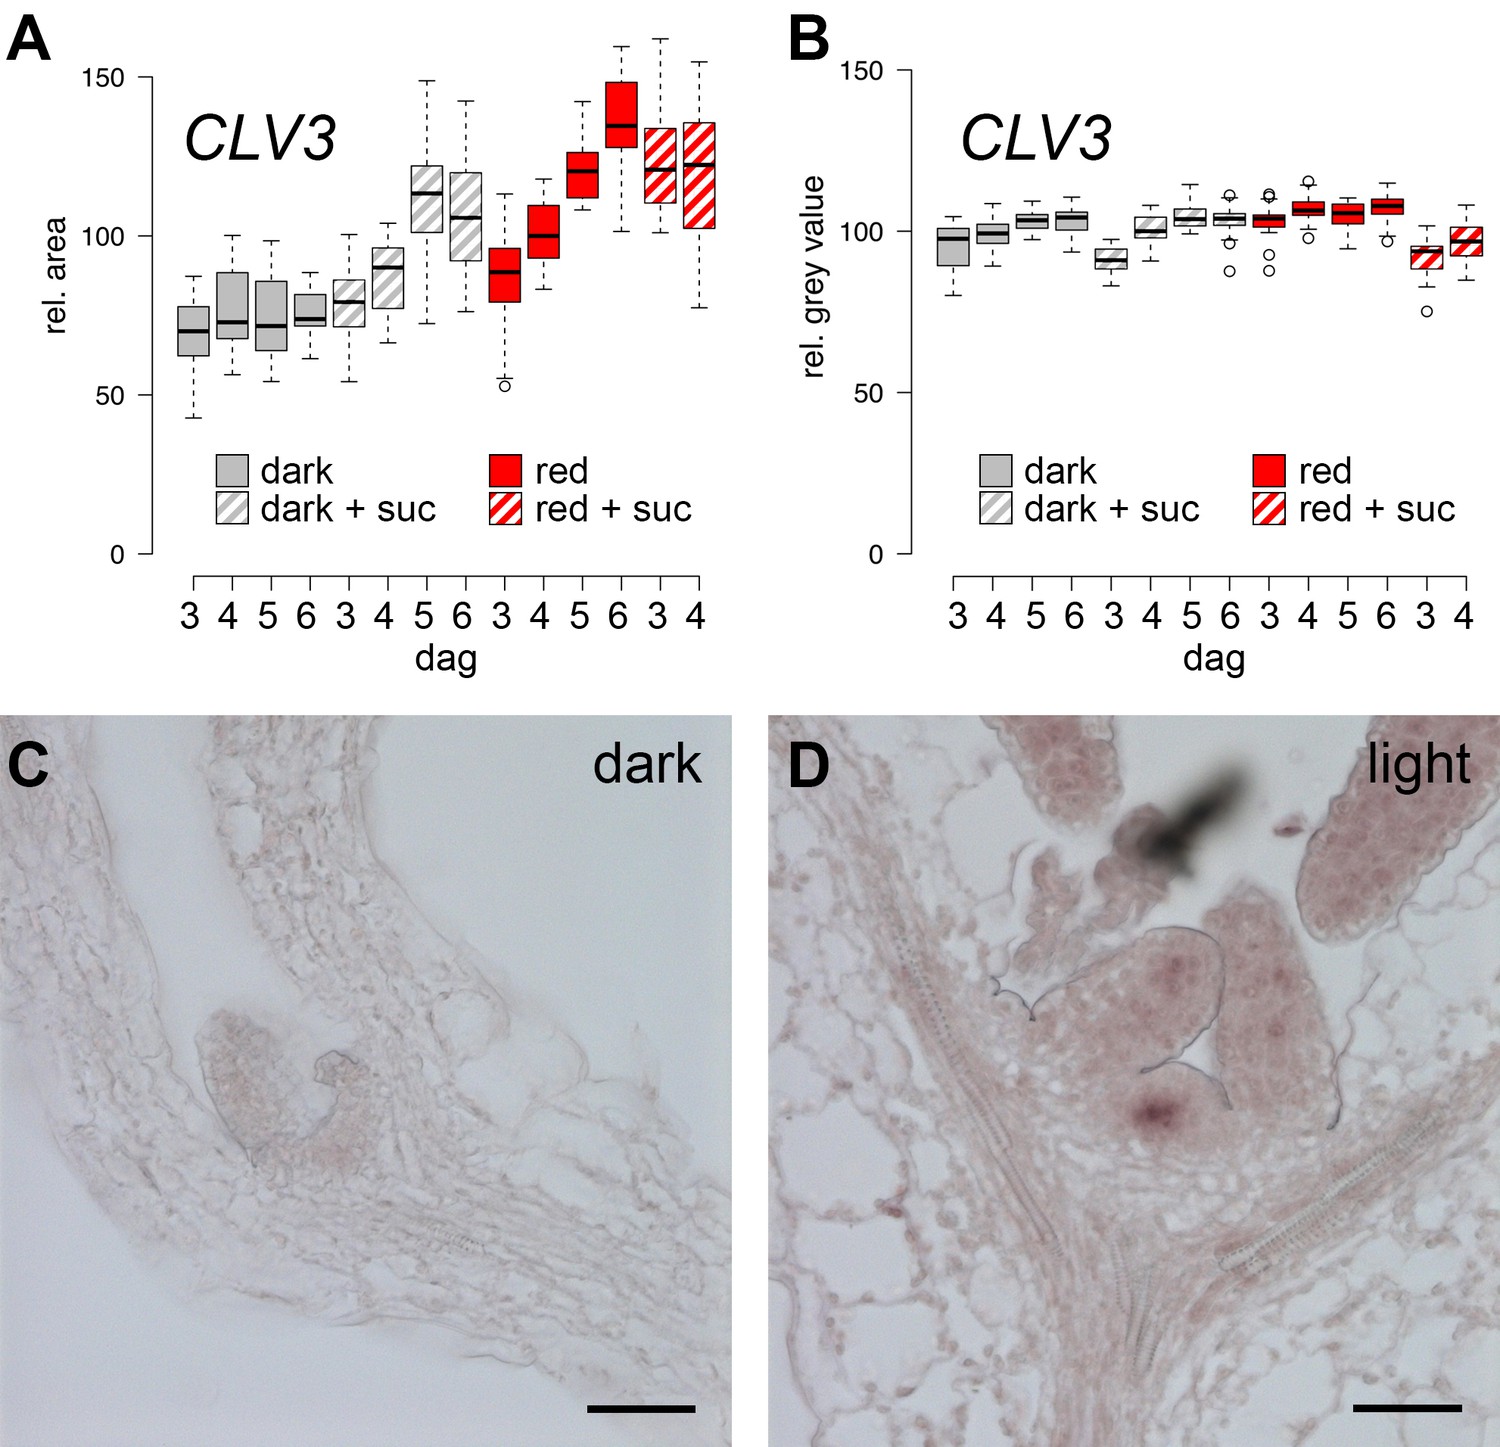
Expression of CLV3 and WUS during seedling development.
(A, B) CLV3 reporter signal in seedlings exposed to light and/or sucrose increases in size, but not intensity. Quantification of pCLV3:mCHERRY-NLS expression under different growth conditions (gray = darkness, red = red light (30 µmol*m−2*s−1), solid box = w/o sucrose, hatched box = 1% sucrose, dag = days after germination). (A) Quantification of the relative area above a consistent pCLV3:mCHERRY-NLS signal meristems above a consistent gray value. (B) Quantification of the mean gray value within the area determined in (A). (C, D) WUS mRNA in situ hybridization on meristems of six day old wild-type seedlings grown in darkness and white light (150 µmol*m−2*s−1), respectively (scale bar = 40 µm).
Figure 2 with 1 supplement
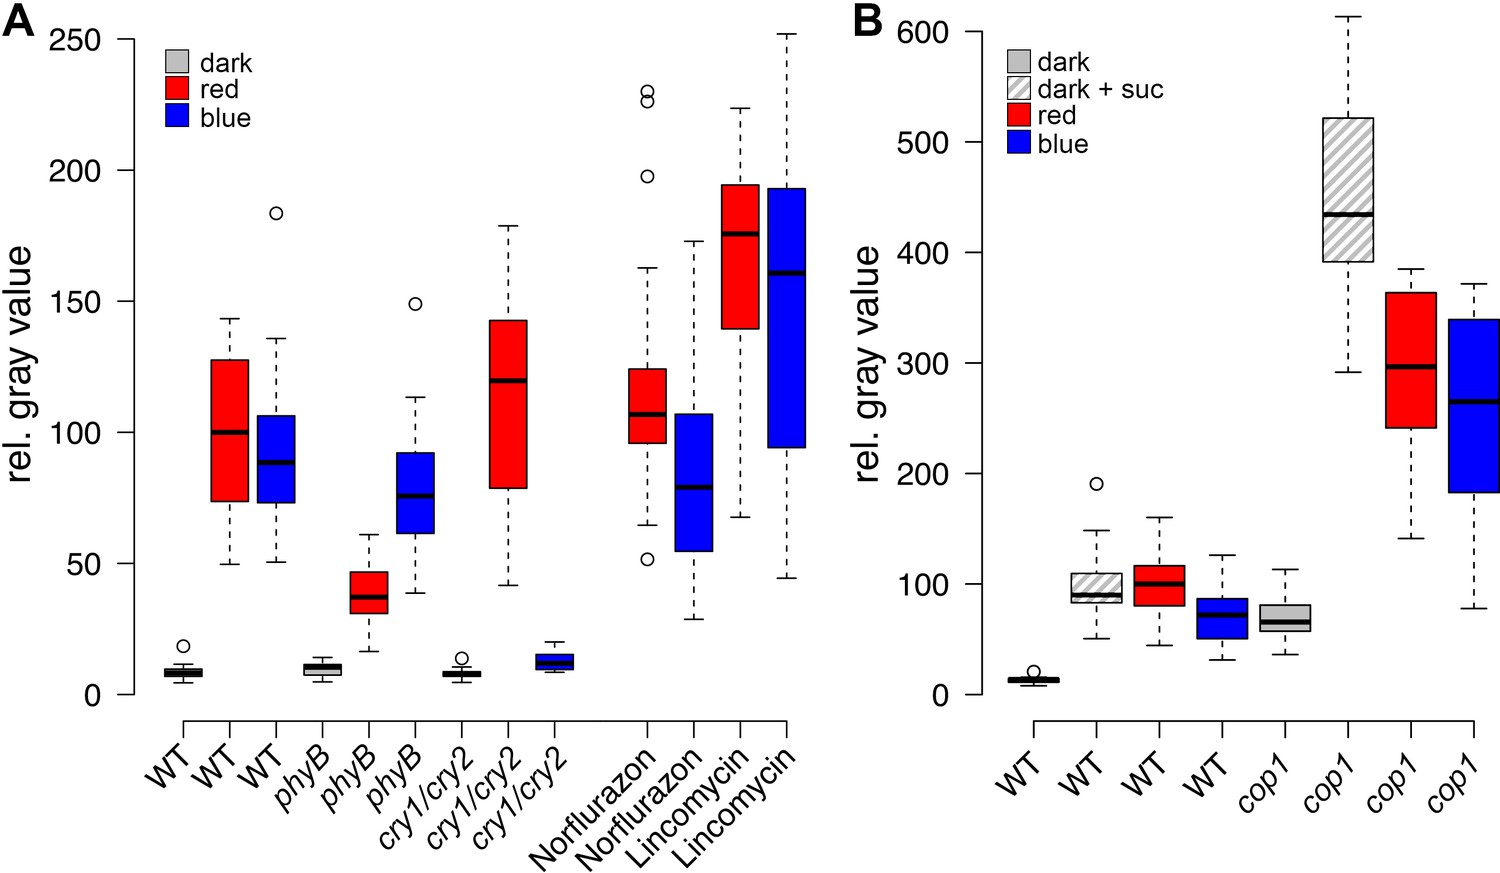
Light induced WUS expression depends on photoreceptors and is repressed by COP1.
Quantification of pWUS:3xVENUS-NLS expression by fluorescence intensity was measured in four day old wild-type (WT) or mutant seedlings (WT) or mutant background under different growth conditions (gray = darkness, red = red light (30 µmol*m−2*s−1), blue = blue light (30 µmol*m−2*s−1), solid box = w/o sucrose, hatched box = 1% sucrose). (A) 0.5 mM lincomycin and 5 µM norflurazon, respectively were applied to the growth media of wild-type seedlings. (B) Impact of cop1−4 mutation on WUS expression.
Figure 2—figure supplement 1
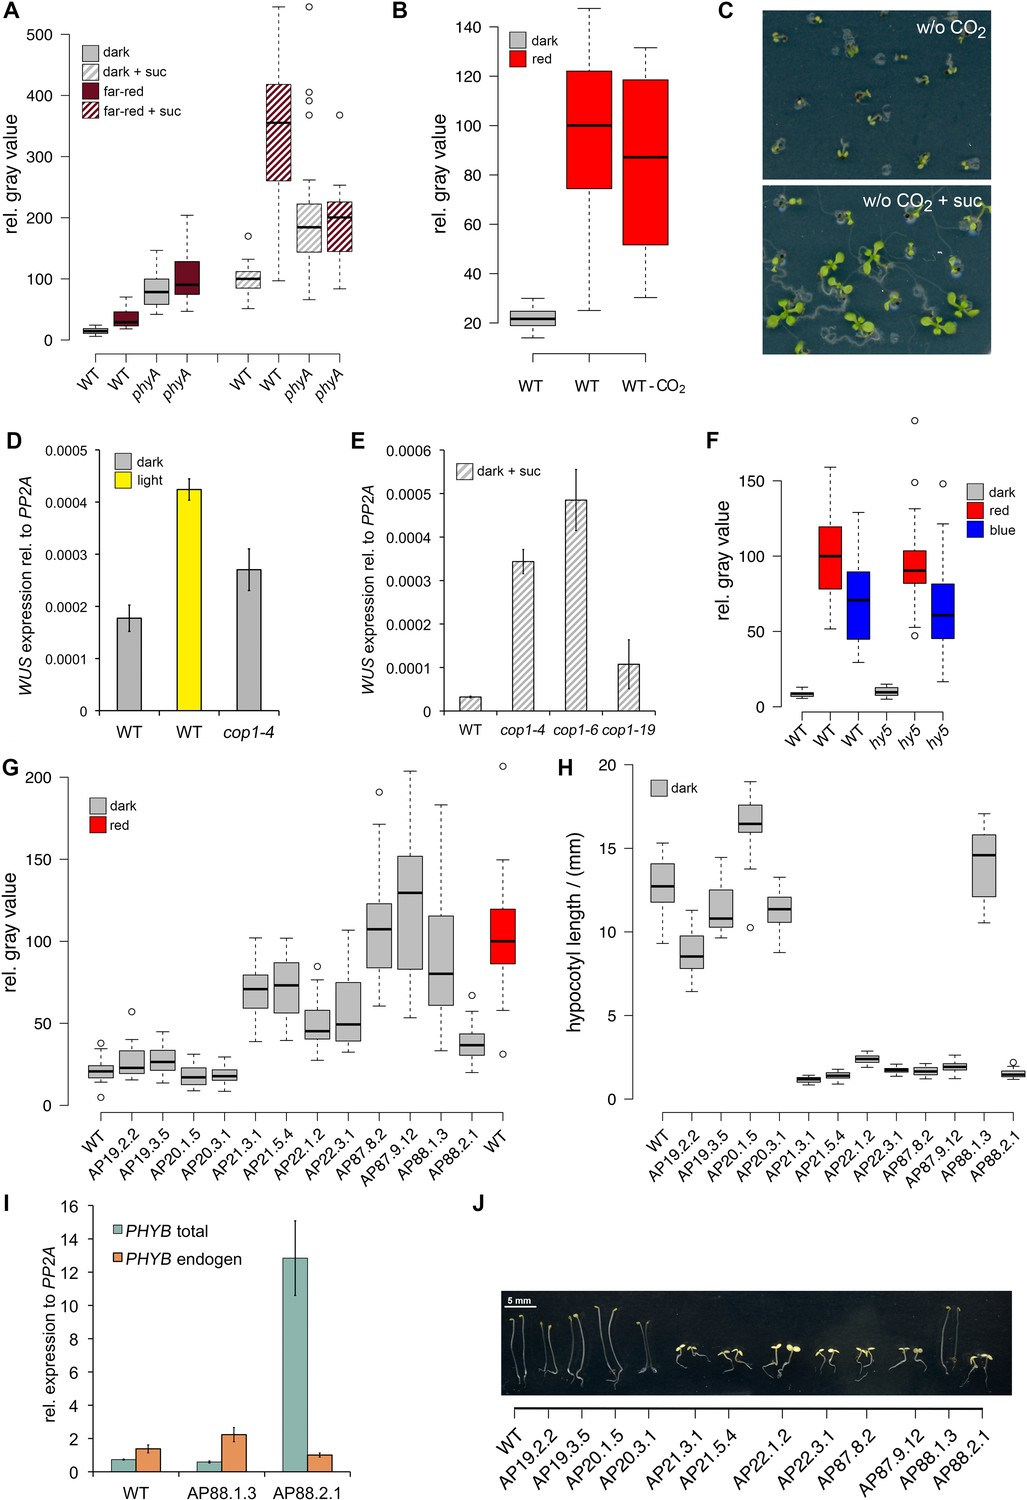
Light regulation of WUS expression.
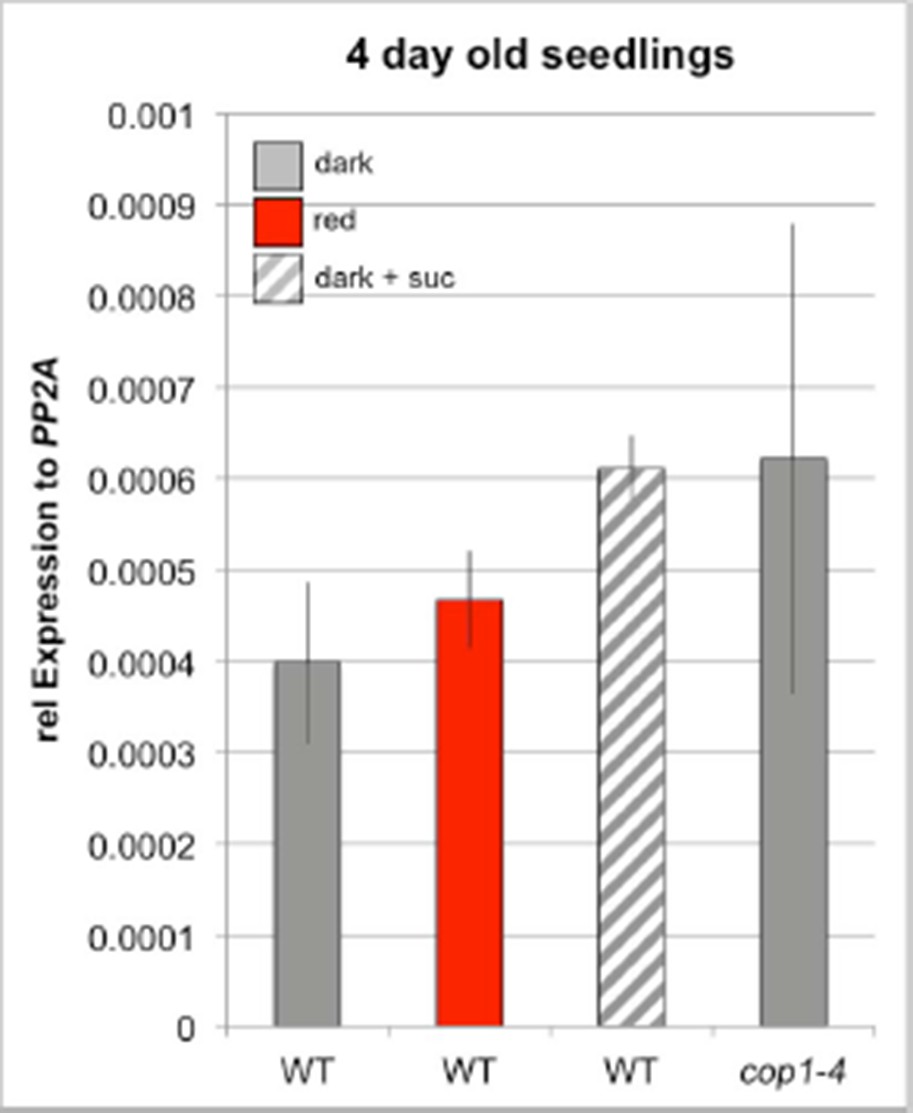
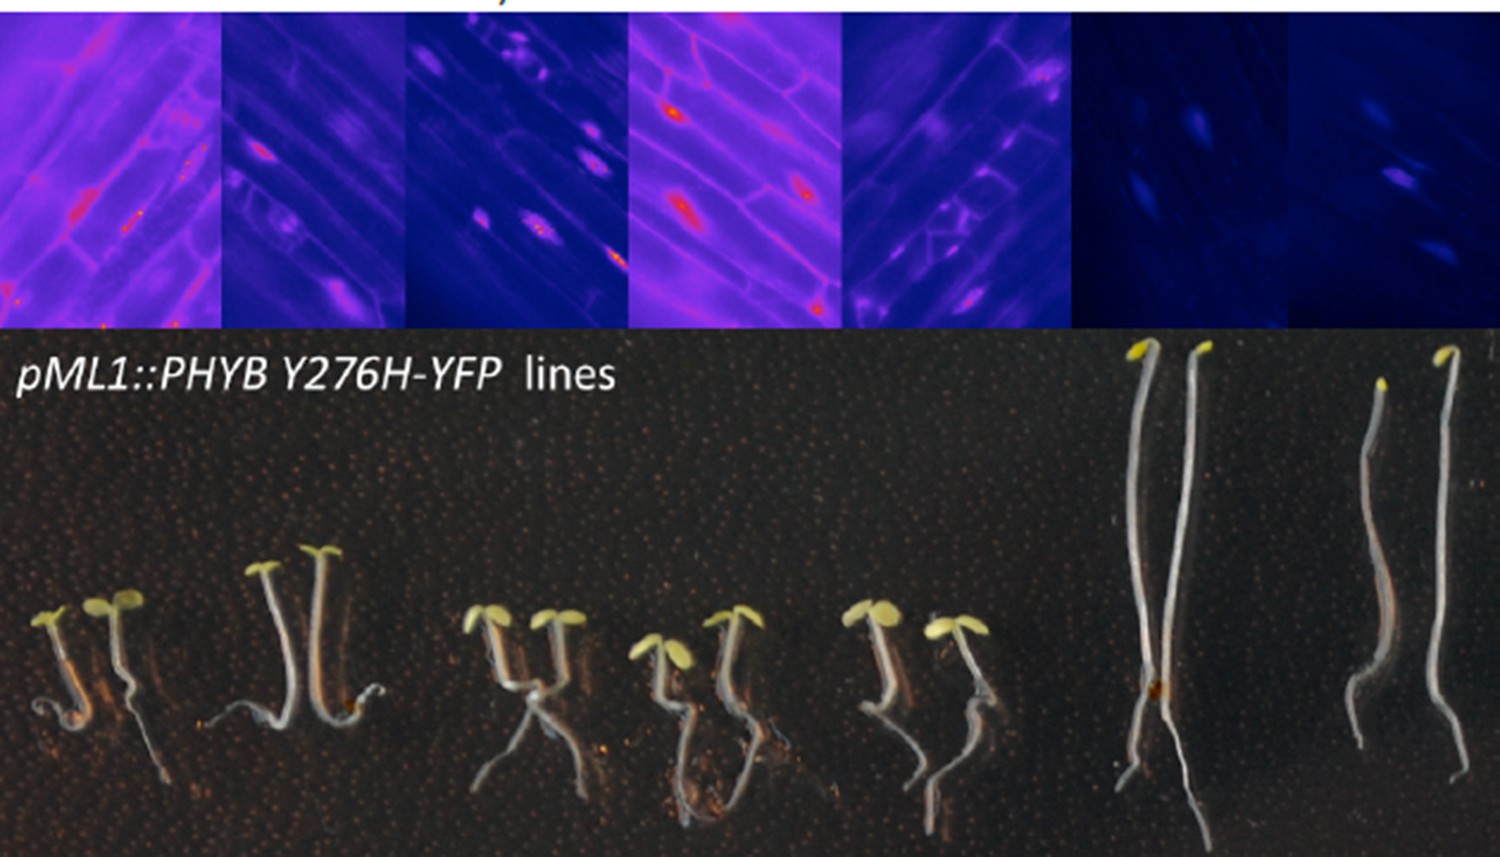
(A) Induction of WUS expression in far-red light depends on phyA. (B) Growth in CO2-deficient environment does not affect light induced WUS expression in four day old seedlings, but inhibits the development of the first leaves unless 1% sucrose is added to the growth medium (C). Seedlings in (C) were grown in white light (150 µmol*m−2*s−1) and in absence of CO2 for 11 days. (D and E) Quantification of WUS expression by qRT-PCR in seven day old seedlings grown in darkness (gray), 150 µmol*m−2*s−1 white light (yellow) or darkness in the presence of 1% sucrose (hatched gray). Expression levels were normalized to PP2A expression. Error bars show standard error of the mean of two biological replicates. (F) The hy5 mutation does not affect light induction of WUS expression. Tissue specific activation of light signaling outside the SAM can induce WUS expression in the meristem (G) and photomorphogenic growth (H,J) in dark-grown seedlings. Constitutively active phyB Y276H was expressed under different promoters: AP19: pAt1g26680; AP20: pAt3g59270; AP21: pSUC2; AP22: pUBQ10; AP87: pCAB3; AP88: pML1. Two independent lines for each construct were quantified. (I) Phenotypic differences of pML1:PHYB Y276H lines correlate with the expression level of PHYB. Expression of endogenous PHYB was determined by using a primer pair annealing in the 3' UTR of PHYB. Expression levels were normalized to PP2A expression. pWUS:3xVENUS-NLS expression (A,B,F and G) and hypocotyl length (H) were quantified in four day old seedlings exposed to different growth conditions (gray = darkness, red = red light (30 µmol*m−2*s−1), far red = far red light (30 µmol*m−2*s−1), blue = blue light (30 µmol*m−2*s−1), yellow = white light (150 µmol*m−2*s−1), solid box = w/o sucrose, hatched box = w/ 1% sucrose).
Figure 3 with 1 supplement
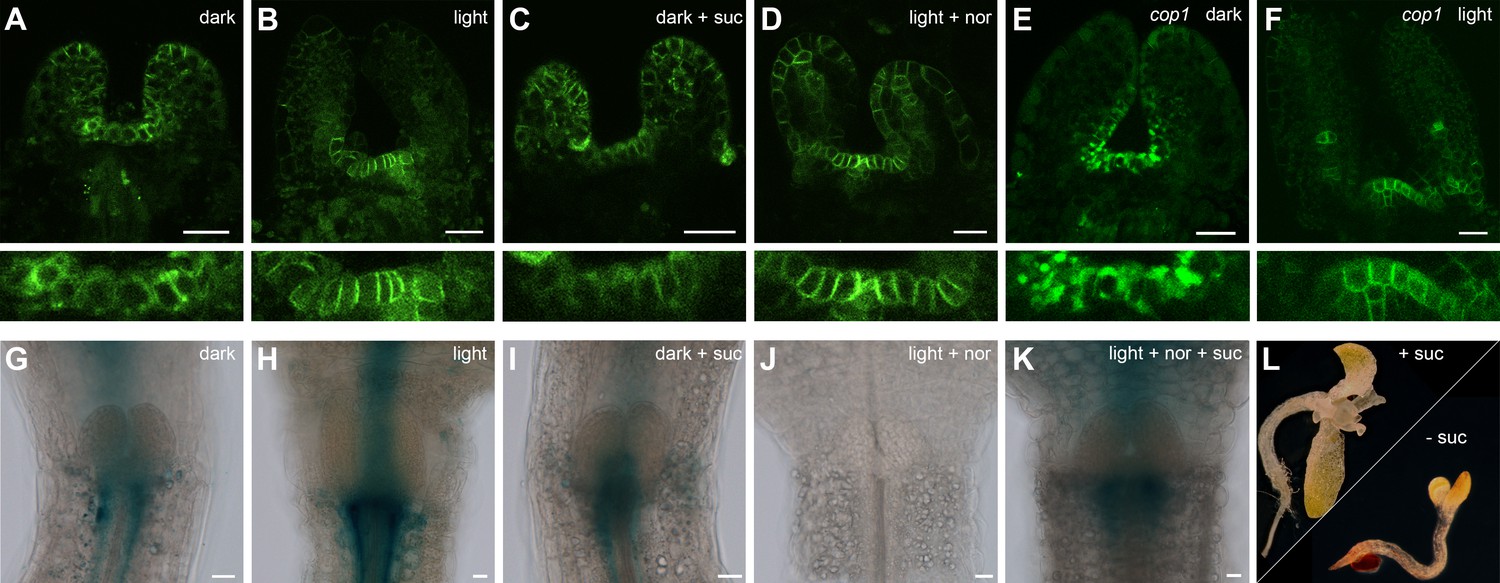
Hormonal control of the SAM.
(A–F) Confocal images of four day old seedlings expressing pPIN1:PIN1-GFP in WT (A–D) or cop1-4 (E,F) background under diverse growth conditions. The lower row shows a magnification of the meristem shown in the picture above. (G–K) GUS staining of four day old plants expressing pTCSn:GUS (light = white light (150 µmol*m−2*s−1), + suc = 1% sucrose, nor = 5 µM norflurazon, scale bar = 20 µm). (L) Wild-type seedlings after 20 days on plates containing CK (75 µM benzyladenine) supplemented with (+) or without (-) sucrose.
Figure 3—figure supplement 1
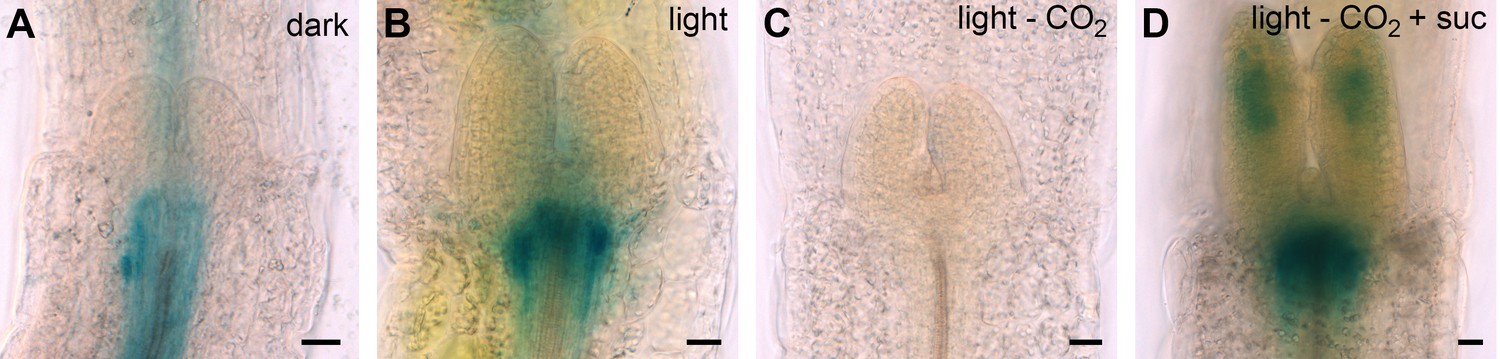
pTCSn:GUS activity in four day old seedlings grown under different conditions.
scale bar = 20 µm; light = white light (150 µmol*m−2*s−1); -CO2 = CO2-deficient; + suc = 1% sucrose
Figure 4 with 1 supplement
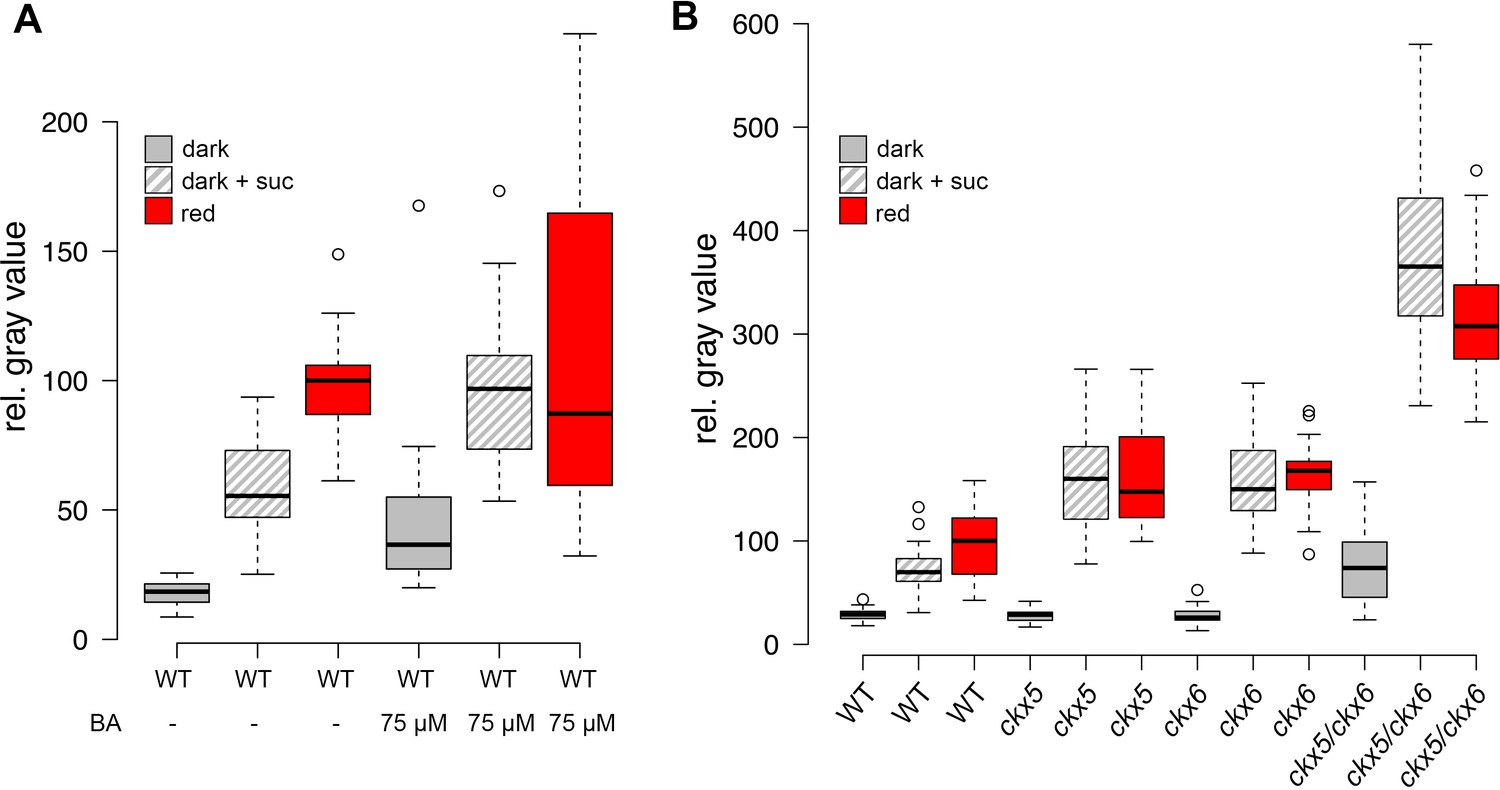
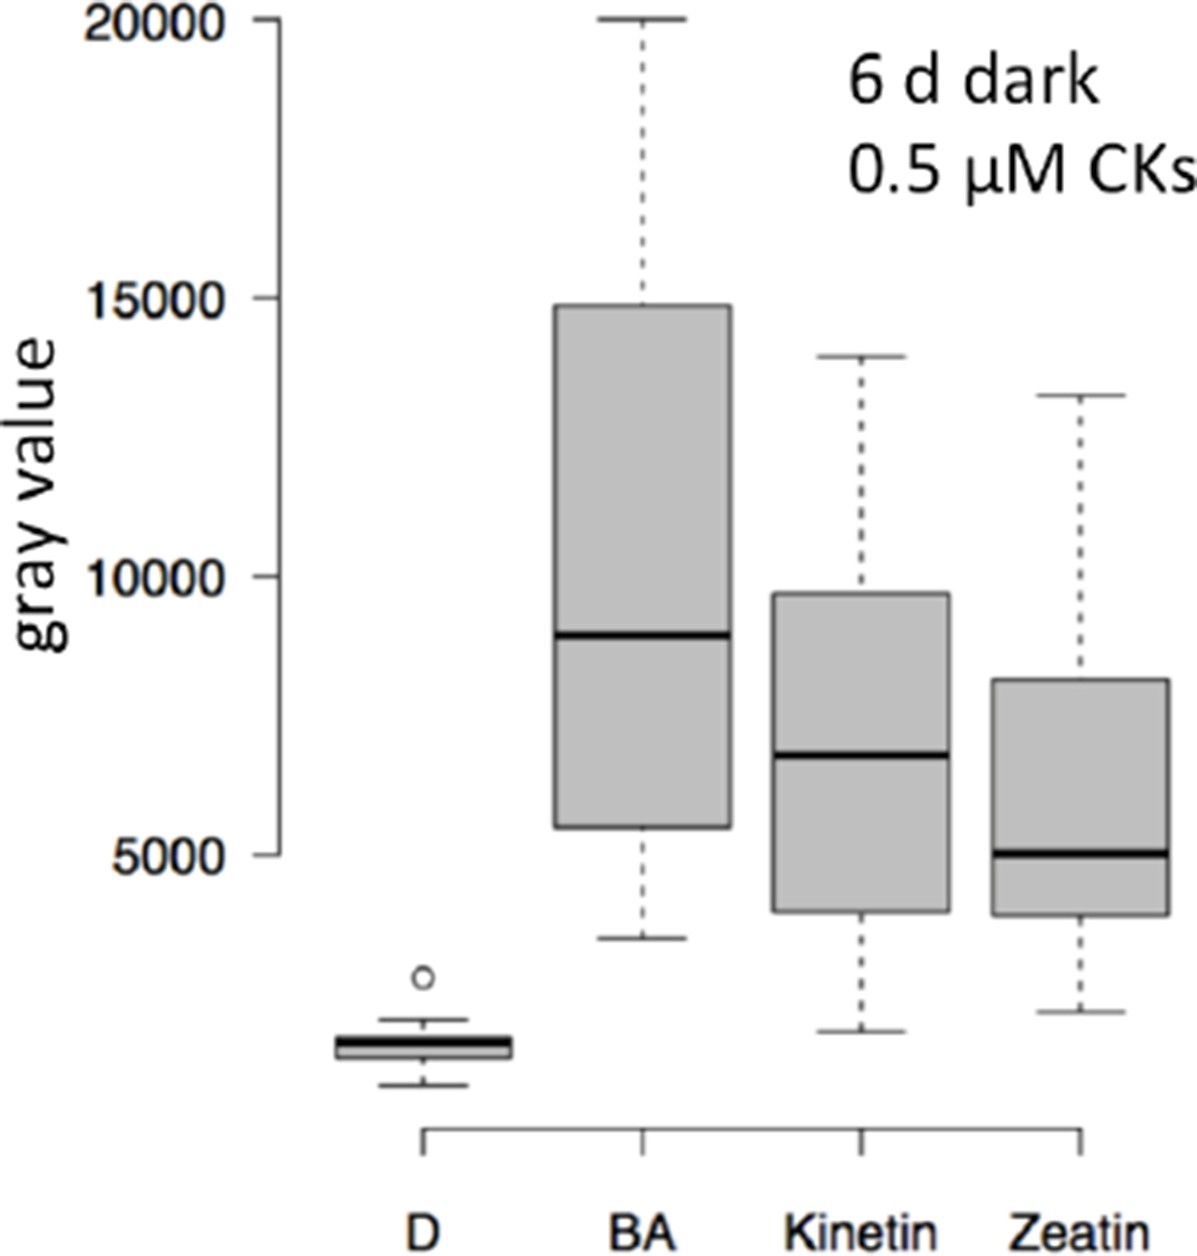
Role of cytokinin signaling in WUS activation.
Quantification of pWUS:3xVENUS-NLS expression in four day old seedlings. (A) Cytokinin was applied as 75 µM benzyladenine to wild-type (WT). (B) Ckx mutant lines display enhanced expression of the pWUS:3xVENUS-NLS reporter construct (growth conditions: gray = darkness, red = red light (30 µmol*m−2*s−1), solid box = w/o sucrose, hatched box = 1% sucrose).
Figure 4—figure supplement 1
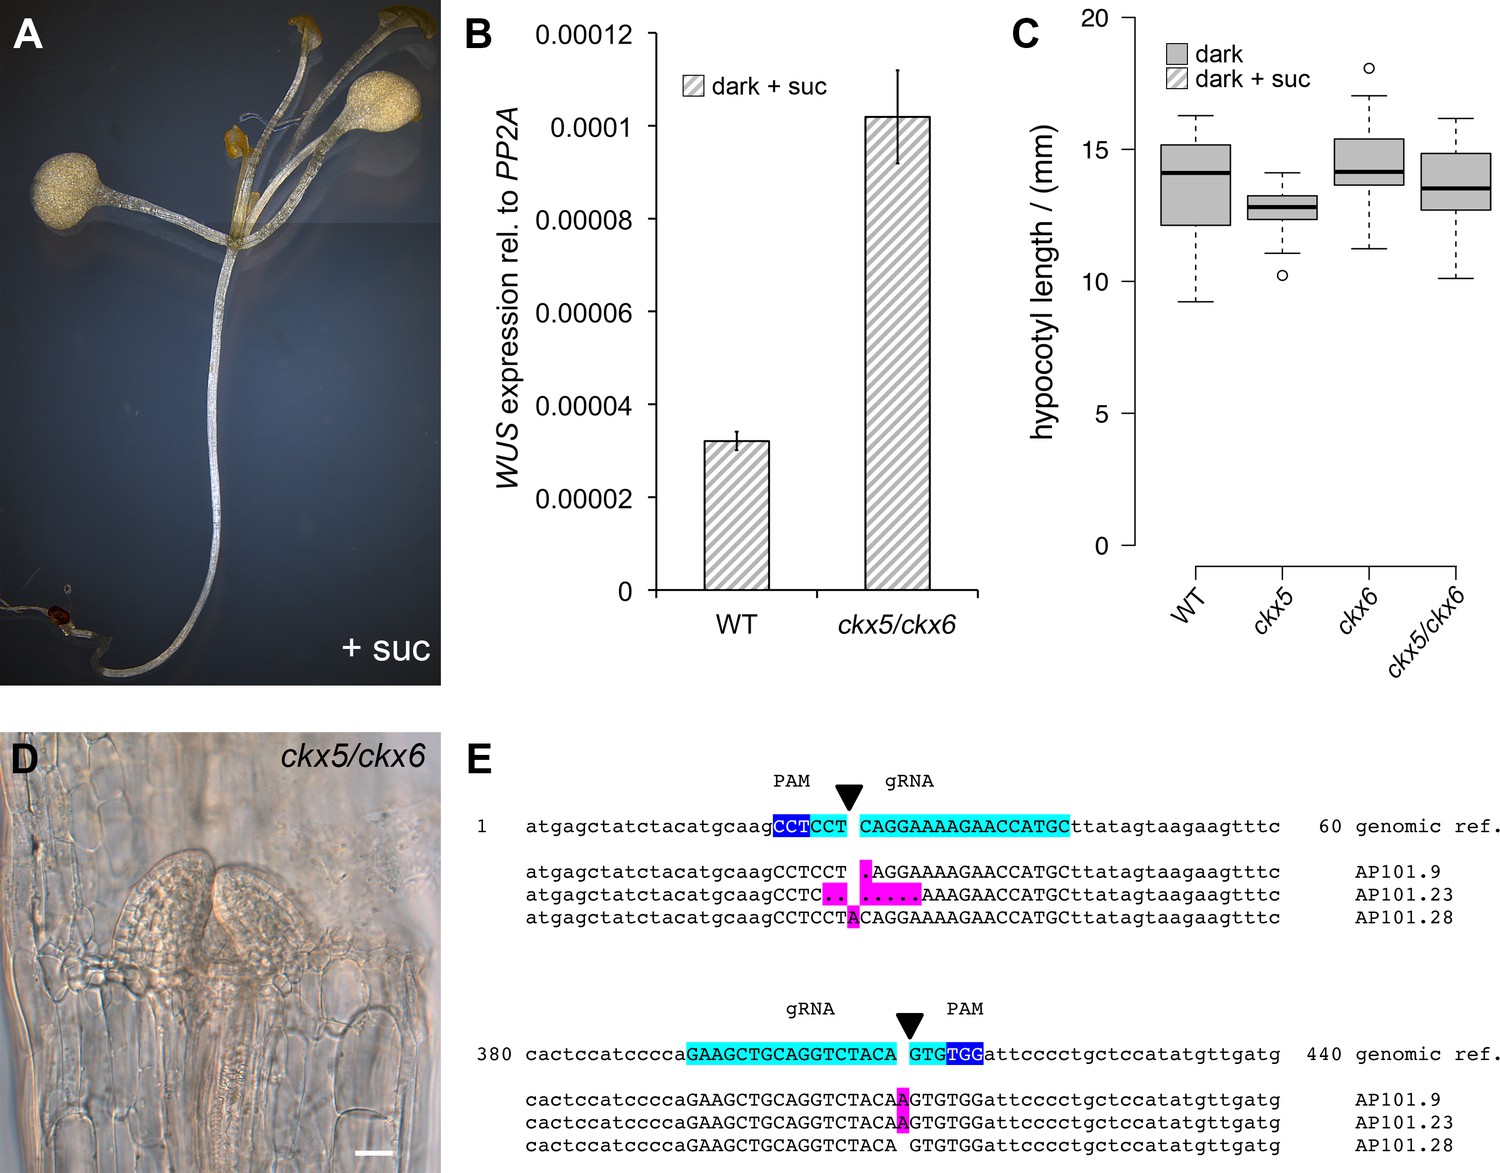
Role of PIF and CKX genes for stem cell activation.
(A) PIFs repress development in darkness similar to COP1. Four-week-old pifq seedlings grown on 1% sucrose develop leaves in darkness. (B) Quantification of WUS expression by qRT-PCR normalized to PP2A in seven day old seedlings grown in darkness on 1% sucrose. Error bars show standard error of the mean of two biological replicates. (C) CKX5 and CKX6 do not affect hypocotyl growth in darkness. Hypocotyl length of four day old etiolated ckx mutants analyzed in Figure 4B were compared to the corresponding background line. (D) ckx5/ckx6 double mutant grown on 1% sucrose in darkness for two weeks (scale bar = 20 µm). (E) Sequencing analysis of CKX6 locus in three homozygous T1 mutants induced by CRISPR-Cas9 (Reference genome in top row shows bases 1–60 and 380–440 of the CKX6 coding sequence. gRNA and PAM in capital letters are highlighted in turquoise and blue, respectively. Deletions are represented as dots. All mutations are highlighted in magenta).
Figure 5 with 1 supplement
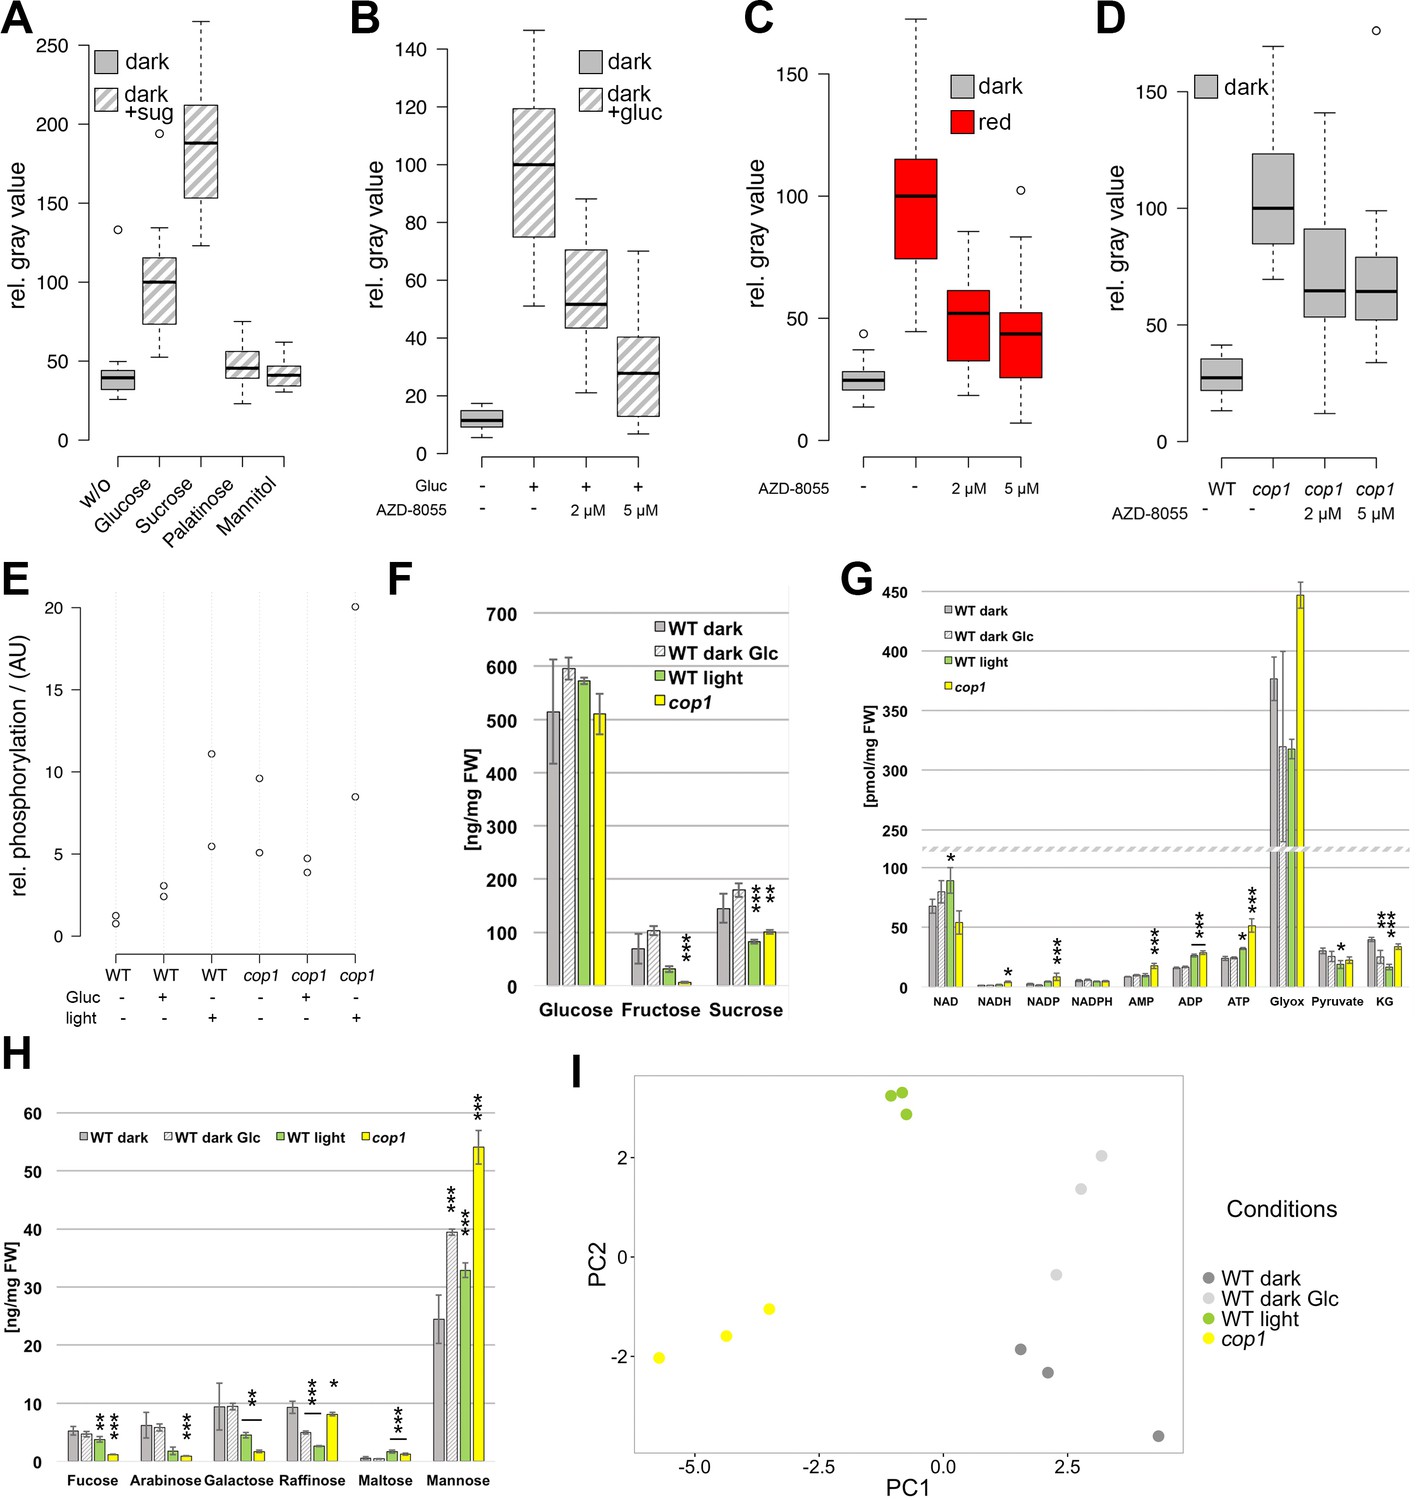
The TOR pathway integrates metabolic and light signals upstream of WUS.
(A) Activation of pWUS:3xVENUS-NLS in four day old dark-grown seedlings grown with 15 mM of diverse sugars (+sug). (B–D) Activation of pWUS:3xVENUS-NLS in seedlings grown in liquid culture. (B) Effect of AZD-8055 TOR inhibitor on glucose treatment. (C) Effect of AZD-8055 TOR inhibitor on light treatment. (D) Effect of AZD-8055 TOR inhibitor on cop1-4 mutant seedlings. (growth conditions: gray = darkness, red = red light (30 µmol*m−2*s−1), solid box = w/o sugars added, hatched box = with sugar) (E) Quantification of S6K phosphorylation relative to total S6K levels based on western blots shown in Figure 5—figure supplement 1B. (F–H) Metabolite measurements from four day old seedlings. Gray bars represent untreated seedlings; hatched bars represent 24 hr treatment with 15 mM glucose; green bars represent 24 hr light treatment (60 µmol*m−2*s−1 of red and blue light each); yellow bars represent cop1-4 mutant seedlings. Error bars show standard error of the mean; asterixs indicate significance tested by unpaired two-tailed oneway ANOVA Student-Newman-Keuls test: *p<0.05, **p<0.01, ***p<0.001; Glyox = glyoxylate; KG = ketoglutarate. (I) PCA based on metabolite measurements shown in Figure 5F–H and Figure 5—figure supplement 1D,E.
Figure 5—figure supplement 1
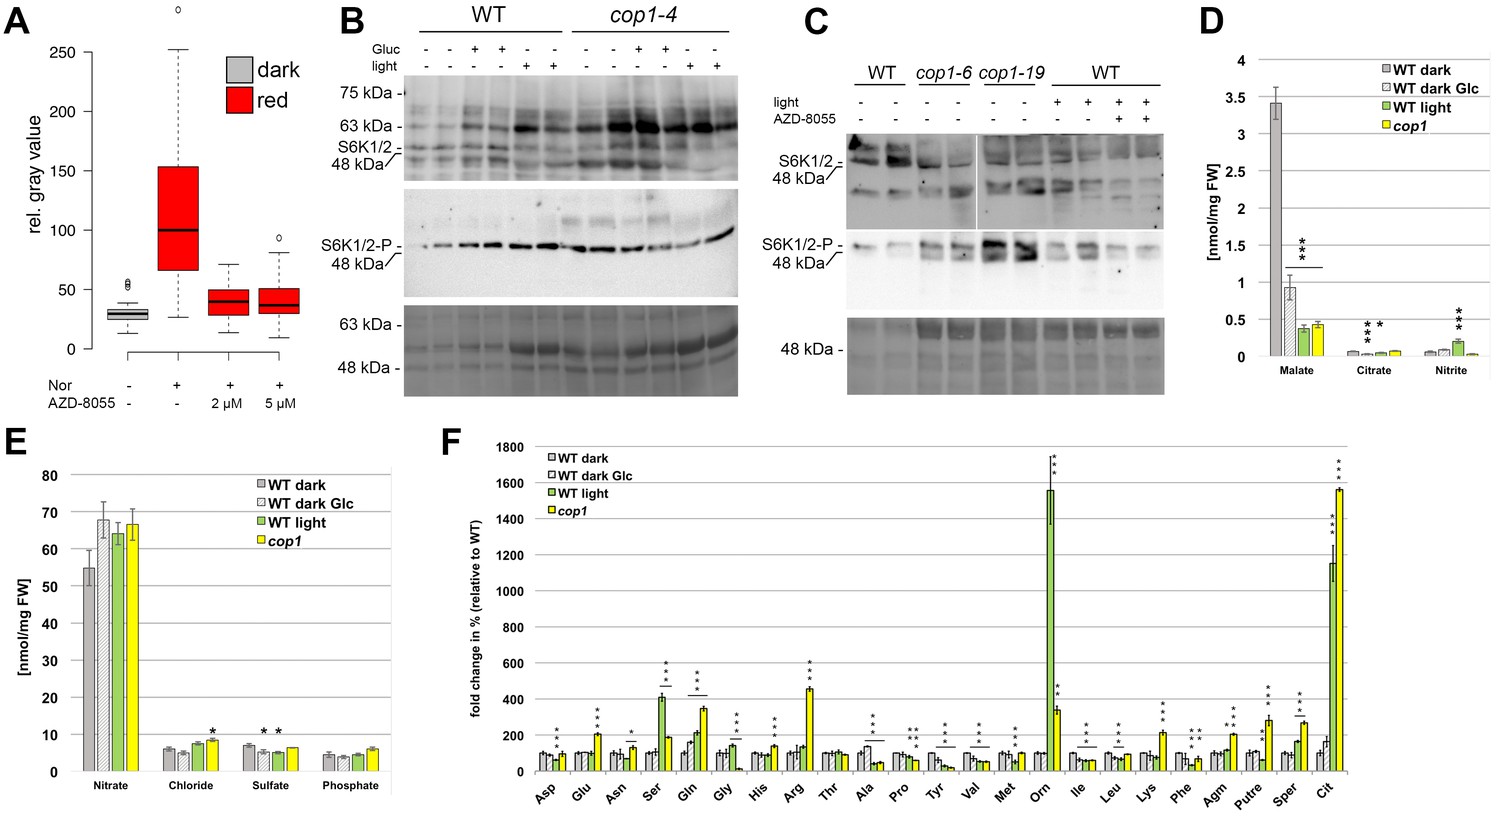
The TOR pathway is activated by light signal transduction.
(A) The experiment shown in Figure 5C was repeated in the presence of 5 µM norflurazon (growth conditions: gray = darkness, red = red light [30 µmol*m−2*s−1]). (B, C) Western blot of WT and cop1 mutant seedlings using Phospho-p70 S6 kinase (Thr(P)-389) antibody to detect S6K phosphorylation (top row) and S6K1/2 antibody to detect total S6K1 and S6K2 (middle row). Lowest row shows Coomassie stained membrane to visualize total protein loaded. The same growth conditions as for the metabolite measurements were used (see below). AZD-8055 was applied at a concentration of 2 µM in the growth medium while plants were treated with light for the last 24 hr only (C). (D–F) Metabolite measurements from four day old seedlings. Gray bars represent untreated seedlings; hatched bars represent 24 hr treatment with 15 mM glucose; green bars represent 24 hr light treatment (60 µmol*m−2*s−1 of red and blue light each); yellow bars represent cop1-4 mutant seedlings. Error bars show standard error of the mean; asterixs indicate significance tested by unpaired two-tailed oneway ANOVA Student-Newman-Keuls test: *p<0.05, **p<0.01, ***p<0.001.
Author response image 1

Author response image 2
Author response image 3
Author response image 4
Author response image 5

Additional files
-
Supplementary file 1
Results of metabolomic analysis.
- https://doi.org/10.7554/eLife.17023.013
-
Supplementary file 2
Description of constructs and oligonucleotides used in this study.
To generate new Green Gate module plasmids PCR was carried out with Phusion polymerase and the oligos listed on Arabidopsis genomic DNA, cDNA or diluted plasmids. PCR product were gel purified, digested with Eco31I and ligated in empty entry vectors that were Eco31I digested and gel purified. All modules were checked by sequencing.
- https://doi.org/10.7554/eLife.17023.014
Download links
A two-part list of links to download the article, or parts of the article, in various formats.
Downloads (link to download the article as PDF)
Open citations (links to open the citations from this article in various online reference manager services)
Cite this article (links to download the citations from this article in formats compatible with various reference manager tools)
Integration of light and metabolic signals for stem cell activation at the shoot apical meristem
eLife 5:e17023.
https://doi.org/10.7554/eLife.17023


