Protein arginine methylation facilitates KCNQ channel-PIP2 interaction leading to seizure suppression
- Sungkyunkwan University School of Medicine, Korea
- Seoul National University College of Medicine, Korea
- Seoul National University Medical Research Center, Korea
- Korea Advanced Institute of Science and Technology, Korea
- Korea University, Korea
- College of Medicine, Kangwon National University, Korea
- Institute for Basic Science, Korea
- Seoul National University Hospital, Korea
- Advanced Neural Technologies, Republic of Korea
Figures
Figure 1
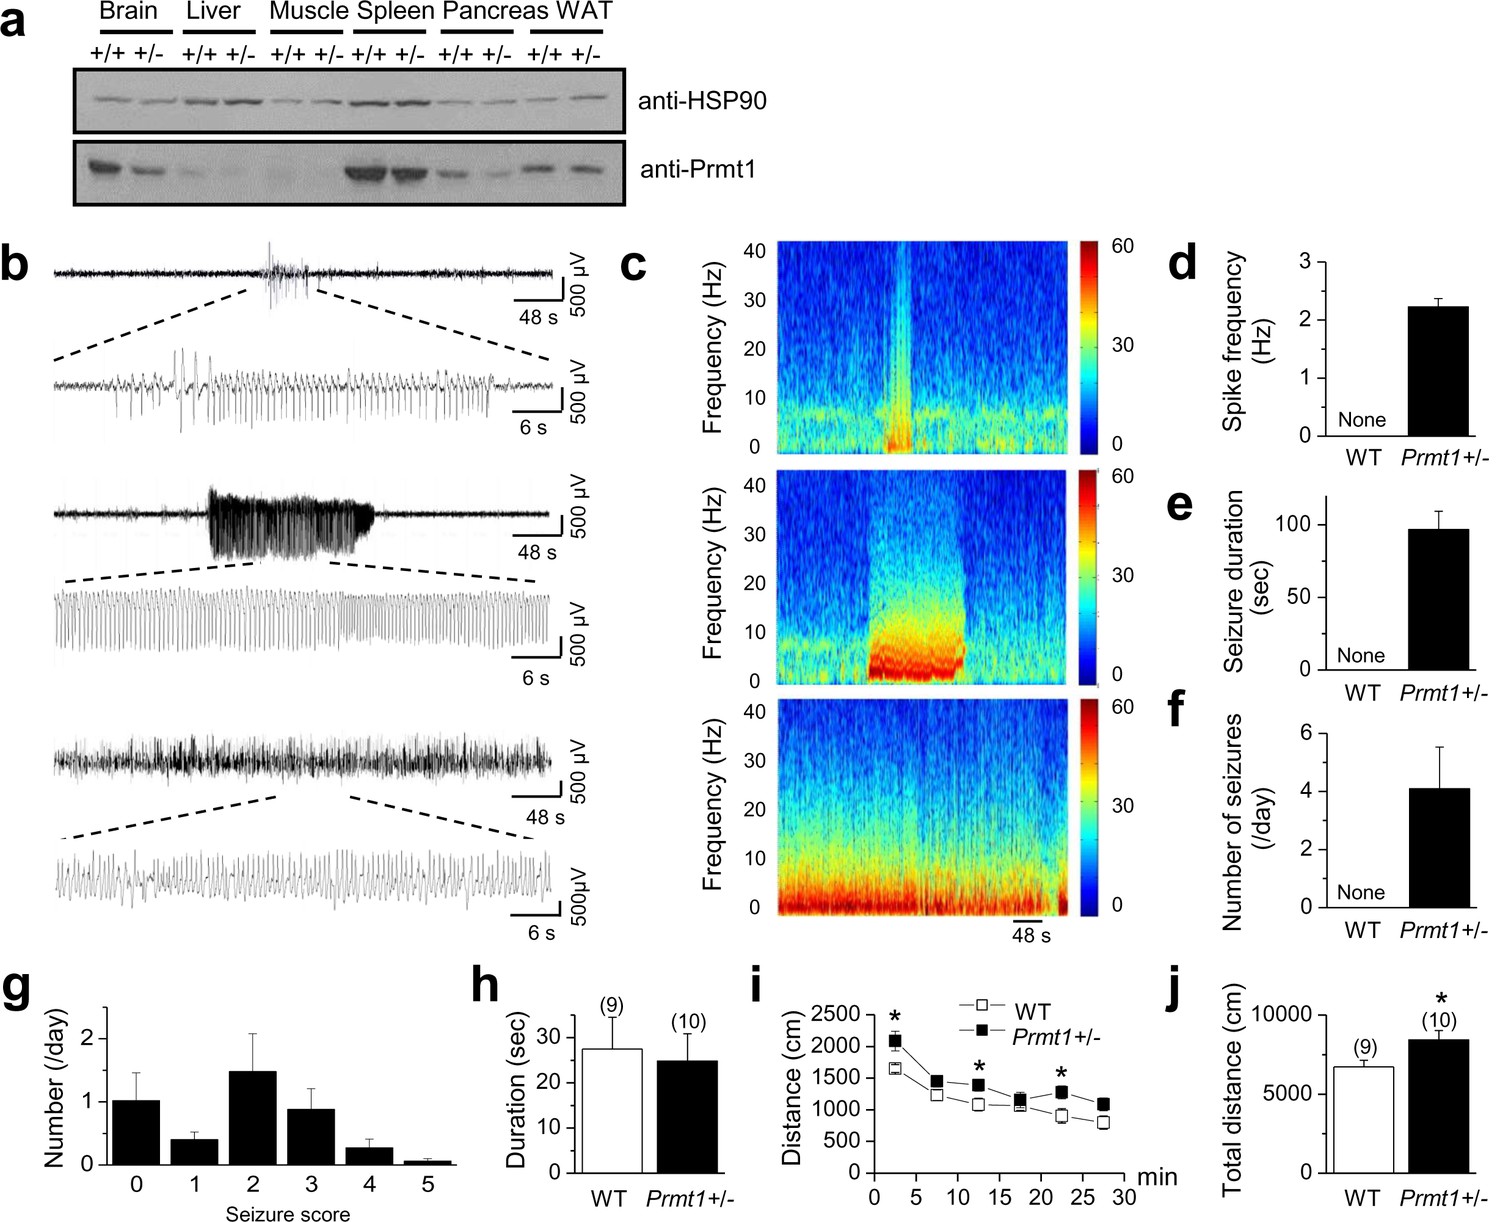
Spontaneous seizures and increased locomotor activities in Prmt1+/- mice.
(a) reduced expression of Prmt1 in Prmt1+/- mice, compared to WT control mice. (b) Representative traces of seizure activities: short (upper) or long (middle and lower) duration of epileptiform activity. (c) A colored power spectrum of the trace shown in b. (d–g) The mean bar graphs of seizure spike frequency (d) duration (e), number of seizures per day (f), and seizure scores (g) in WT (n = 6) and Prmt1+/- mice (n = 8). (h) The WT and the Prmt1+/- mice spent similar amounts of times in the center of the open-field box. (i) The Prmt1+/- mice moved a longer distance than did the WT mice. (j) Total distance moved for 30 min. *p<0.05 by Student’s t-test.
-
Figure 1—source data 1
Source data for Figure 1.
- https://doi.org/10.7554/eLife.17159.004
Figure 2
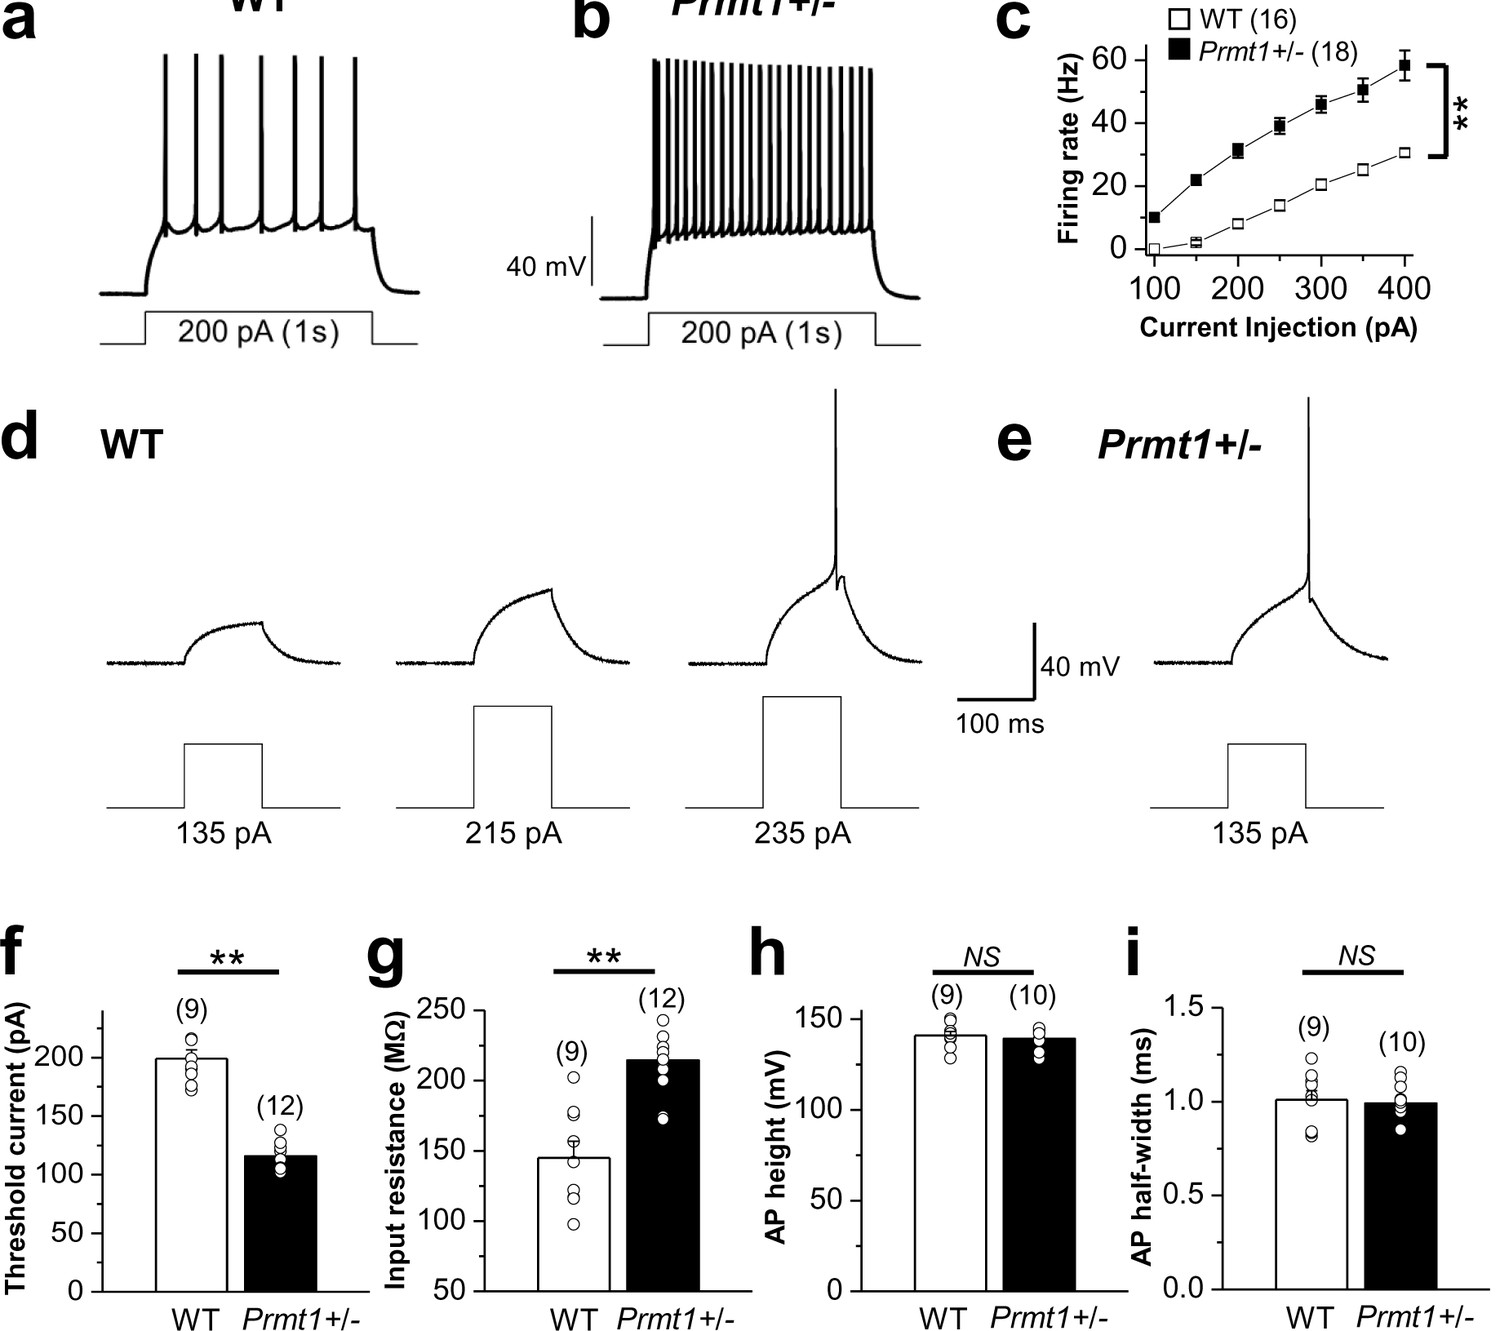
Comparison of neuronal excitability in WT and Prmt1+/- mice.
(a–b) a and b panels show representative trace in the whole-cell current-clamp recording from WT (a) and Prmt1+/- (b) mature dentate GCs in response to 1-s depolarizing current injection (200 pA), respectively. (c) the mean number of action potentials (AP No.) plotted against the eliciting currents (from 100 pA to 400 pA, + 50 pA increment, during 1-s). At all amplitudes, the Mean ± S.E.M. AP No. is significantly higher in Prmt1+/- (■; n = 18, seven mice) than WT dentate GCs (□; n = 16, seven mice; p<0.01). (d–e) the threshold current for single AP elicited by a short depolarizing (100 ms) step pulse of various amplitude in WT (d) and Prmt1+/- (e) dentate GCs. (f–i) the mean value of threshold current for AP generation (100 ms duration; f), input resistance (g), AP height (h), and AP half-width (i) from WT and Prmt1+/- mature dentate GCs.
-
Figure 2—source data 1
Source data for Figure 2.
- https://doi.org/10.7554/eLife.17159.006
Figure 3 with 1 supplement
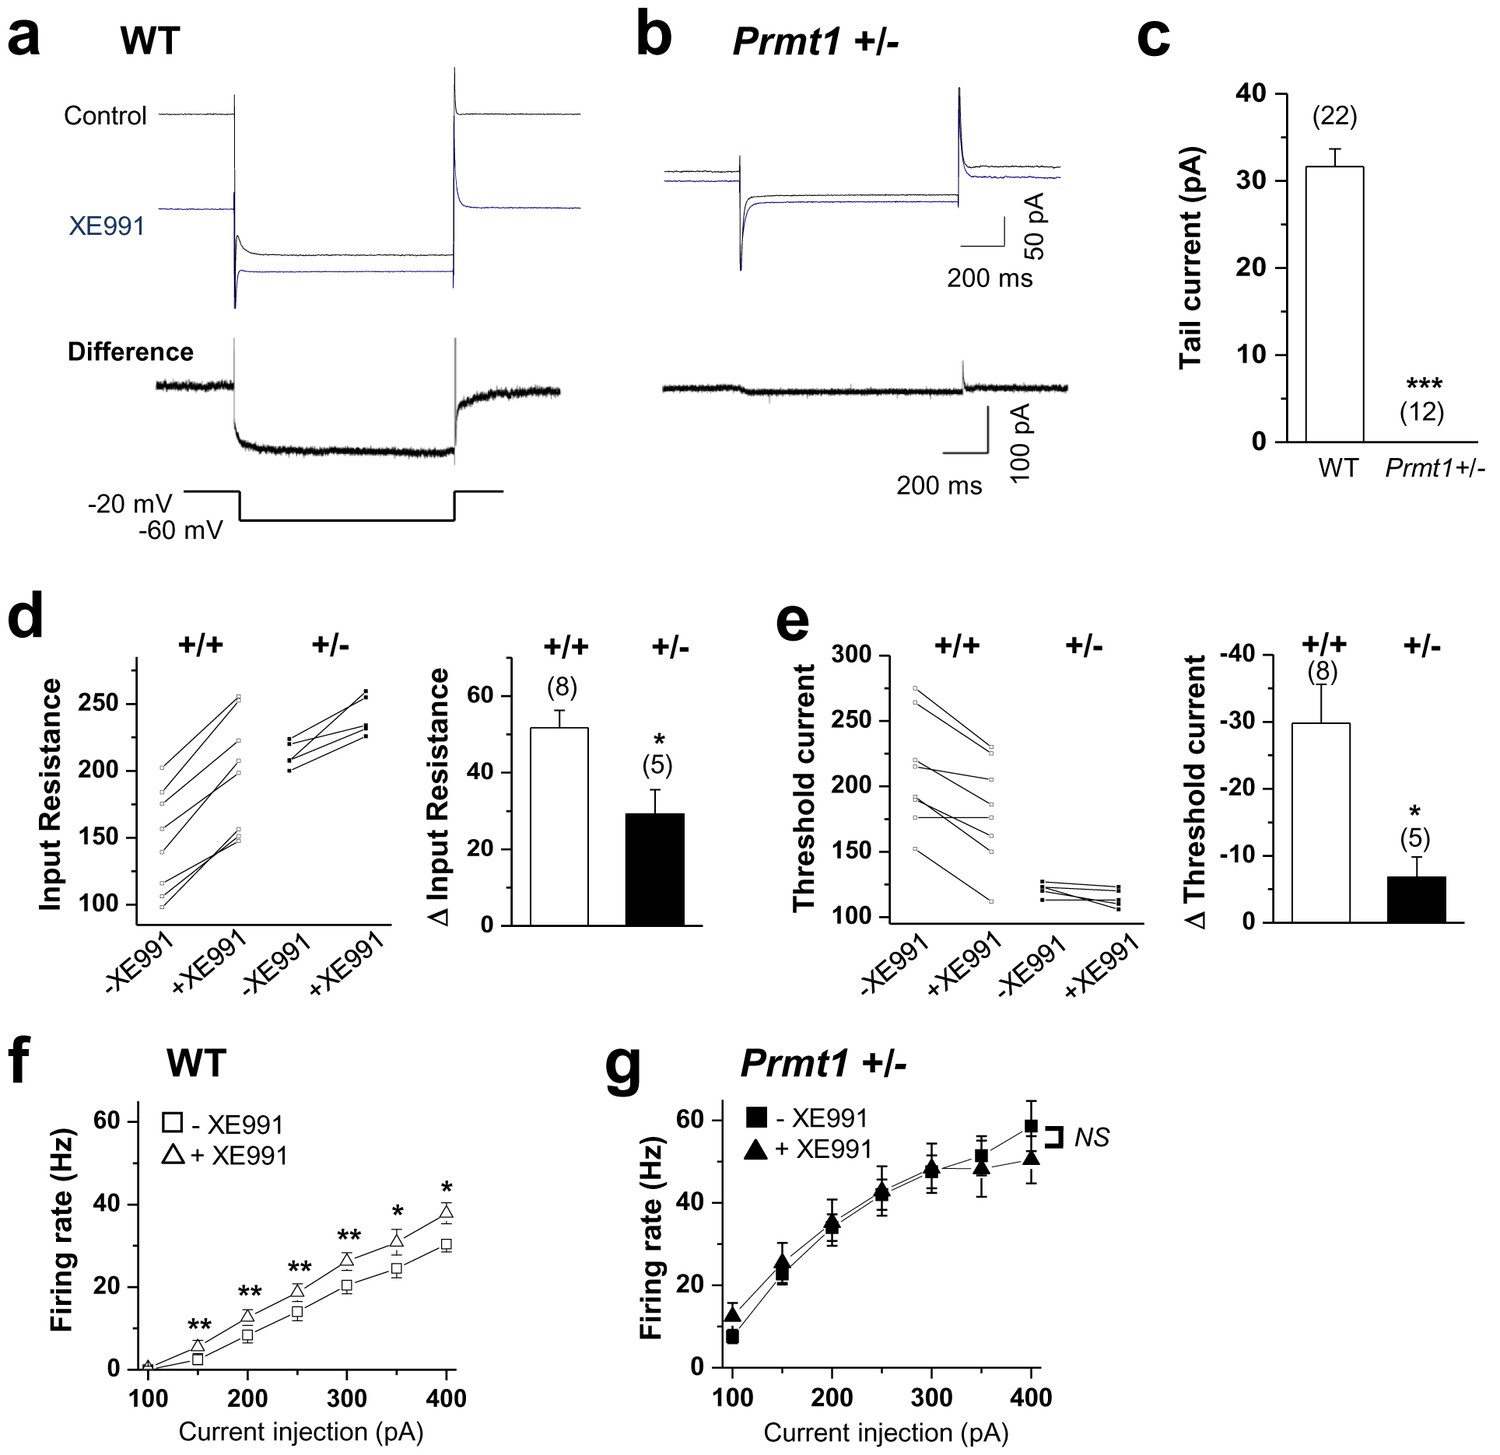
KCNQ current deficiency contributed to the persistent hyperexcitability in Prmt1+/- mice.
(a–b) Representative current traces of voltage clamp recordings from WT (a; n = 22, seven mice) and Prmt1+/- (b; n = 12, four mice) mature dentate GCs in response to the voltage protocol depicted below. The upper panel shows the overlay of currents in the absence (black) or presence (blue) of 10 μM XE991. To illustrate the kinetic components of M-current relaxation and activation, the corresponding difference current is shown in an expanded scale below each current trace. (c) Summary statistics from experiments shown in a–b reveal loss of M-current in Prmt1+/- mice. Error bars, S.E.M. ***p<0.001 by Student’s t-test. (d–e) Changes in input resistance (d) and threshold current (e) in WT (+/+) and Prmt1+/- GCs (+/-) in response to 10 μM XE991. Each connected line represents an individual neuron. Right panel displays the summary of changes in input resistance or threshold current upon application of 10 μM XE991. XE991 was less effective in mutants than in WT. (f–g) Average numbers of APs generated during incremental 1-s depolarizing current steps before and after application of XE991 in WT (f) and Prmt1+/- GCs (g). XE991 produced a substantial change in firing rate of WT GCs (f; n = 7~11, seven mice), whereas little change in firing rate occurred with XE991 in Prmt1+/- GCs (g; n = 9, seven mice). *p<0.05; **p<0.01 by paired Student’s t-test.
-
Figure 3—source data 1
Source data for Figure 3.
- https://doi.org/10.7554/eLife.17159.008
Figure 3—figure supplement 1
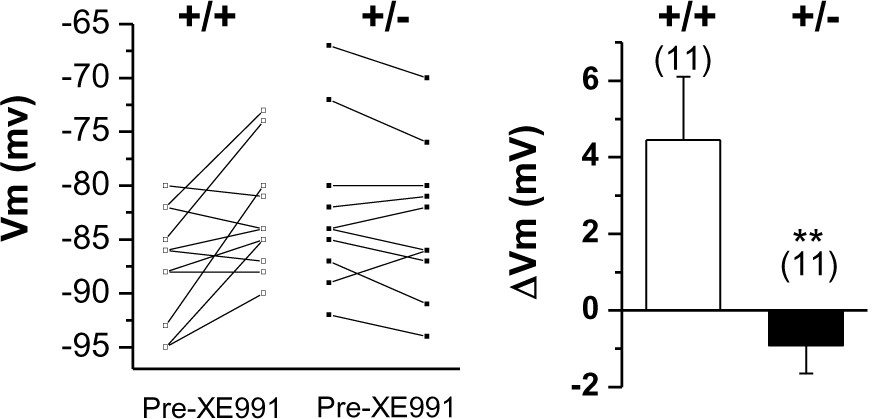
Changes in membrane potential in WT (+/+) and Prmt1+/- GCs (+/-) in response to 10 μM XE991.
Each connected line represents an individual neuron. Right panel gives the averaged changes. XE991 was less effective in mutants than in WT.
-
Figure 3—figure supplement 1—source data 1
Source data for Figure 3—figure supplement 1.
- https://doi.org/10.7554/eLife.17159.010
Figure 4
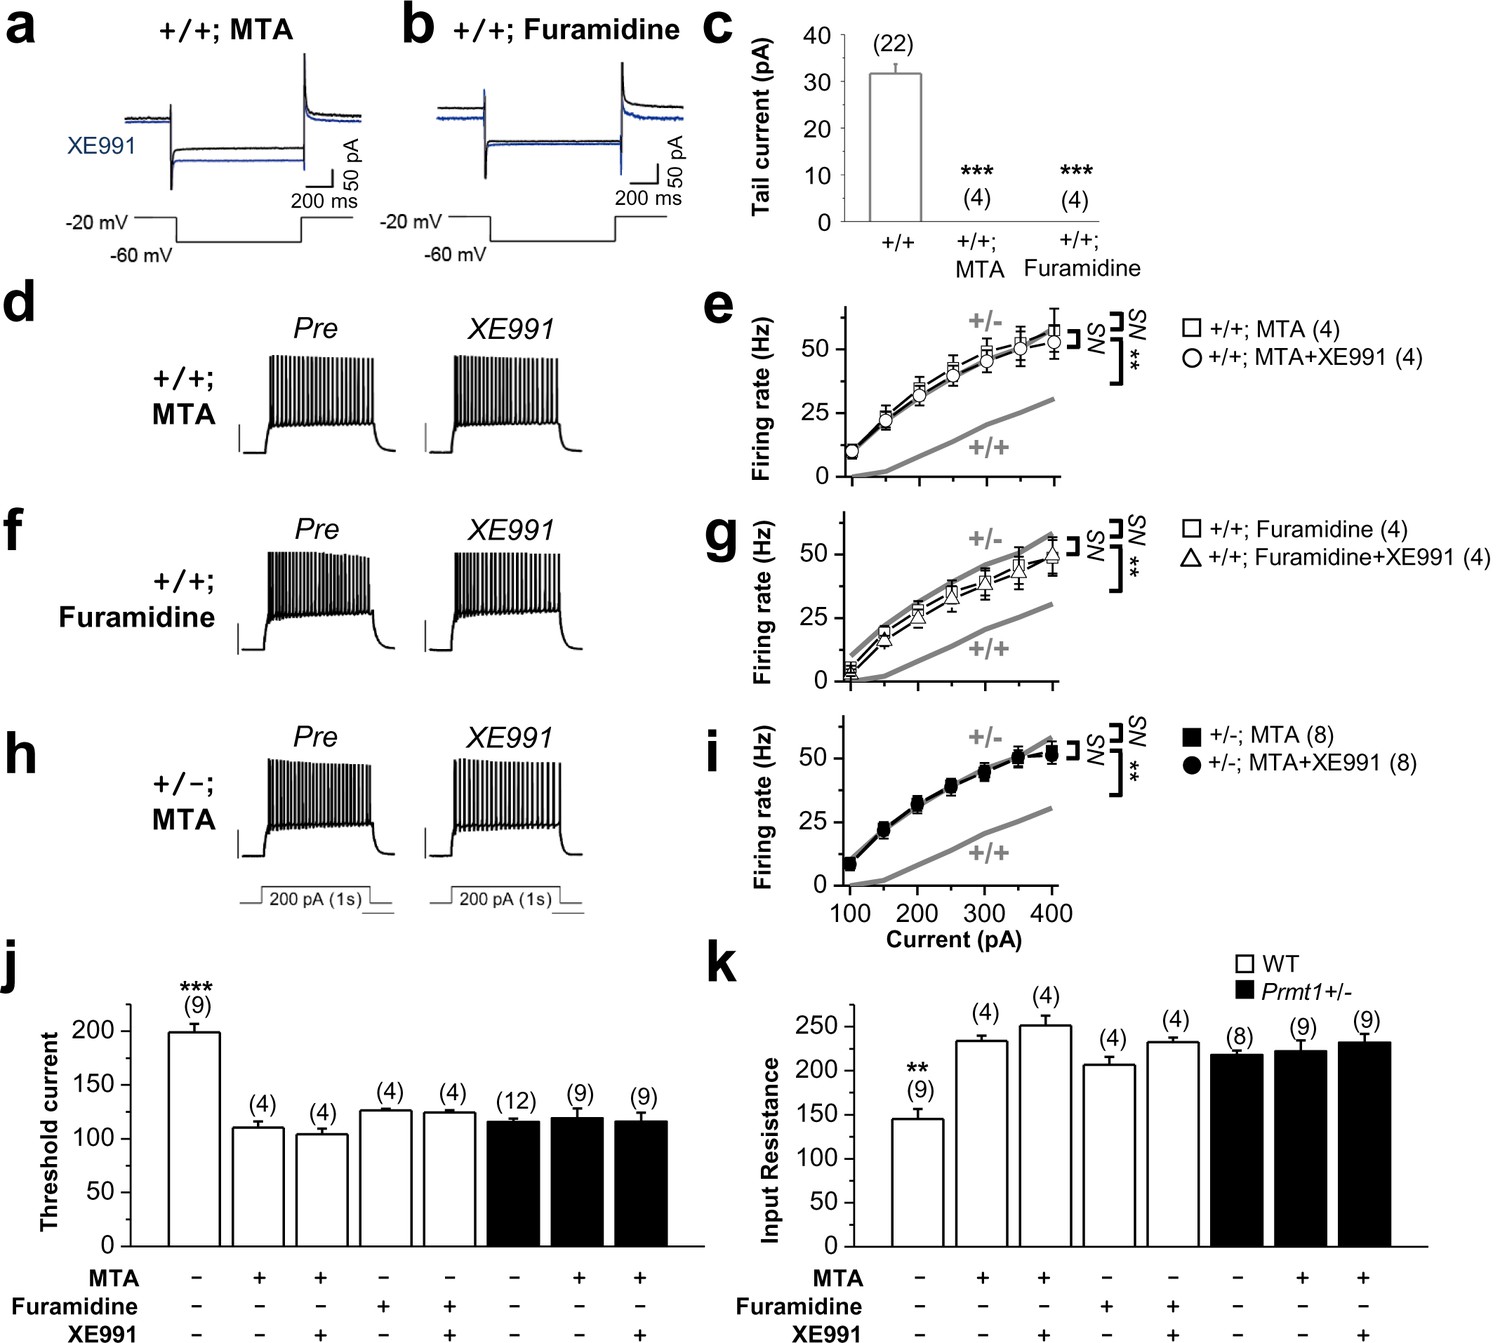
Methylation suppression with MTA or furamidine, increases neuronal excitability via KCNQ channel.
(a–b) Representative current traces recorded from MTA- (a) or furamidine- (b) pretreated WT GCs using the voltage protocol depicted below in the absence (black) or presence (blue) of 10 μM XE991. (c) Summary of M-currents from experiments shown in a–b. Data for M-currents of WT control shown in Figure 3c is also shown as a reference. ***p<0.001 by Student’s t-test. (d–i) APs were evoked by applying 1-s depolarizing current pulses of different intensities (100–400 pA) in WT (d–g) or Prmt1+/- (h–i) neurons. Panel d, f, and h illustrate representative traces after incubation for 1 hr with 100 μM MTA (d and h) or 20 μM furamidine (f). The effect of applying XE991 once the maximal effect of MTA or furamidine is achieved was shown in right. Scale bar indicate 40 mV. Summarized data compare the number of APs before and after application of XE991 in MTA-pretreated WT (e), furamidine-pretreated WT (g), and MTA-pretreated mutants (i). The gray lines shows the number of APs observed in untreated WT and Prmt1+/- neurons. Genotypes are given on each line. Firing rate in MTA-treated WT cells (□; n = 4, two mice) or furamidine-treated WT cells (□; n = 4, three mice) increased to the level of Prmt1+/- cells (gray line). Further, XE991 had no effect in MTA-treated WT cells (○; n = 4, paired Student’s t tests) or furamidine-treated WT cells (△; n = 4, paired Student’s t tests). MTA had no further effects on Prmt1+/- neurons. NS, not significantly different. (j–k) the mean value of threshold current for AP generation (j) and input resistance (k). ANOVA Tukey test. **p<0.02; ***p<0.001.
-
Figure 4—source data 1
Source data for Figure 4.
- https://doi.org/10.7554/eLife.17159.012
Figure 5 with 5 supplements
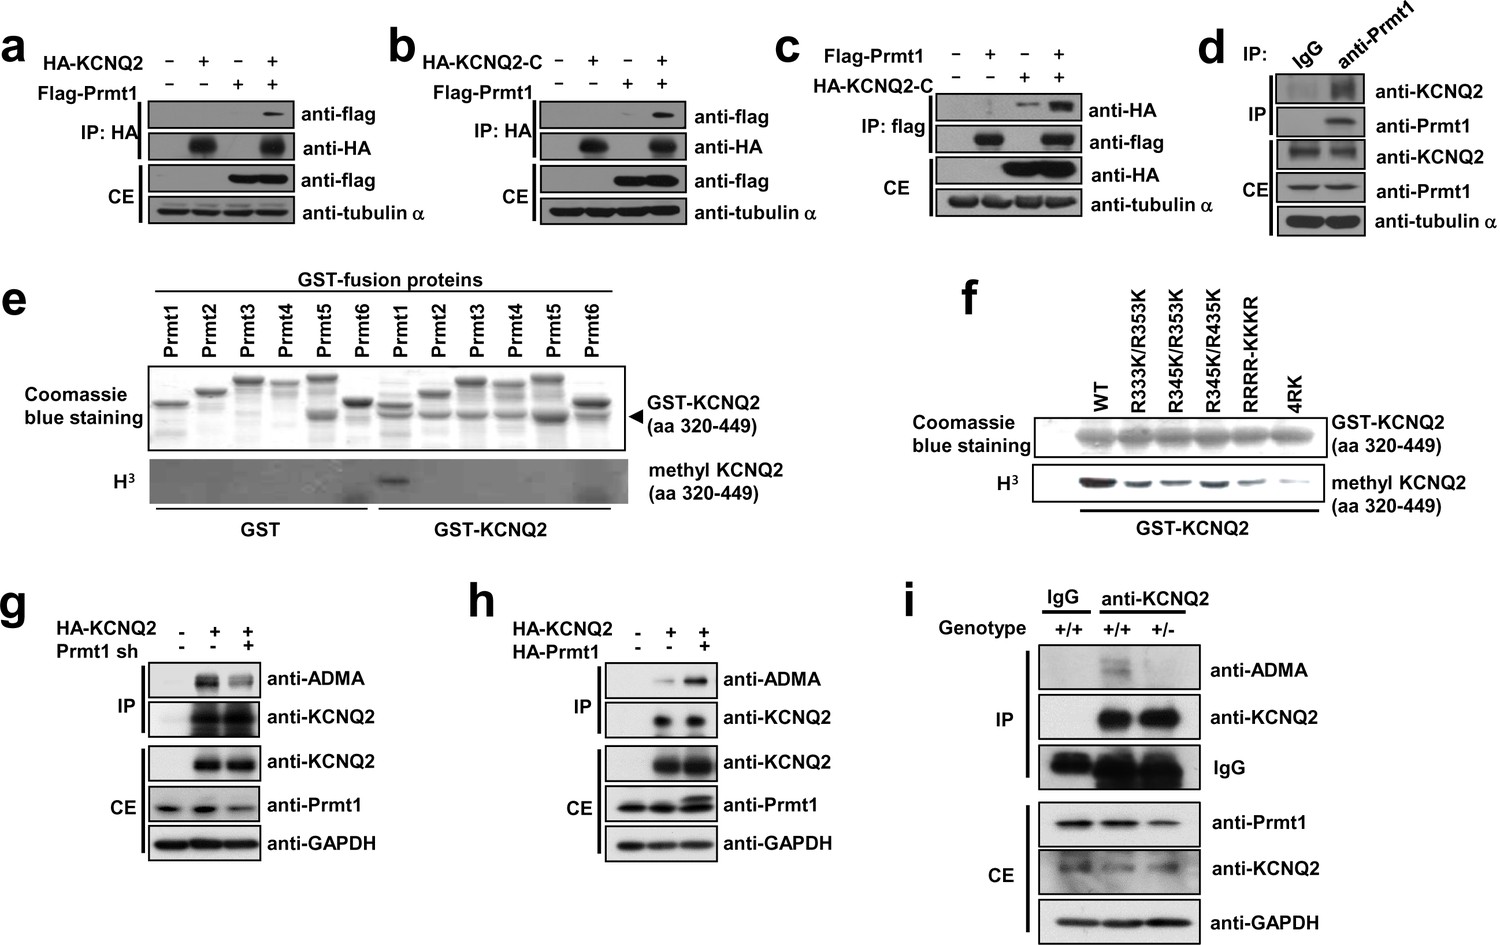
Prmt1 binds to and methylates KCNQ2 at R333, R345, R353, and R435.
(a–c) Immunoblotting analysis showing the physical association of KCNQ2 and Prmt1. HEK293T cells were transfected with expression vectors, as indicated. Whole-cell lysates were immunoprecipitated and immunoblotted by either anti-flag or anti-HA antibody. Representative data from at least three independent experiments are shown. (d) Western blotting analysis showing endogenous interaction of KCNQ2 and Prmt1. Cell lysates from mouse hippocampus were immunoprecipitated with anti-Prmt1 antibody and were immunoblotted with anti-KCNQ2 antibody or anti-Prmt1 antibody. Representative data from at least three independent experiments are shown. (e) In vitro methylation assays with GST-KCNQ2 (amino acids 320–449) and a series of GST-Prmts (1–6) in the presence of [3H]S-adenosylmethionine (SAM). Total amounts of GST-KCNQ2 (arrowhead) and GST-Prmts are shown by Coomassie brilliant blue staining. (f) In vitro methylation assays with GST-Prmt1 together with GST-KCNQ2 (amino acids 320–449) WT, R333K/R353K, R345K/R353K R345K/R435K. R333K/R345K/R353K (RRRR-KKKR), or R333K/R345K/R353K/R435K (4RK) in the presence of [3H]SAM. (g) Immunoblotting analysis showing the decreased asymmetric dimethylation of KCNQ2 in Prmt1 knockdown cells. HEK293T cells were transfected with control or HA-KCNQ2 in combination with control or Prmt1 shRNA expression vectors, followed by immunoprecipitation with KCNQ2 antibodies and immunoblotting with antibodies to ADMA, KCNQ2, Prmt1 and GAPDH. (h) Immunoblotting analysis showing the enhanced asymmetric dimethylation of KCNQ2 in Prmt1 overexpressing cells. HEK293T cells were transfected with control or HA-KCNQ2 in combination with control or Prmt1 expression vectors, followed by immunoprecipitation with KCNQ2 antibodies. (i) Immunoblotting analysis showing decreased asymmetric dimethylation of KCNQ2 in Prmt1+/- brain, compared to the WT control. Brain lysates from Prmt1+/+ and Prmt1+/- mice were immunoprecipitated with anti-KCNQ2 antibodies or control IgG.
Figure 5—figure supplement 1
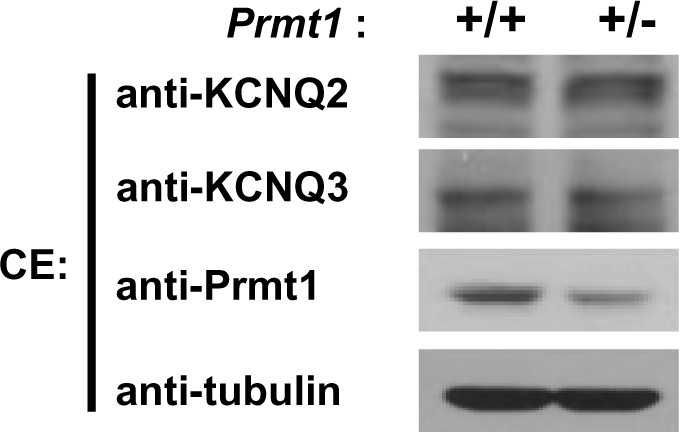
Expression of KCNQ2 and KCNQ3 in the hippocampus of WT and Prmt1+/- mice.
https://doi.org/10.7554/eLife.17159.014
Figure 5—figure supplement 2
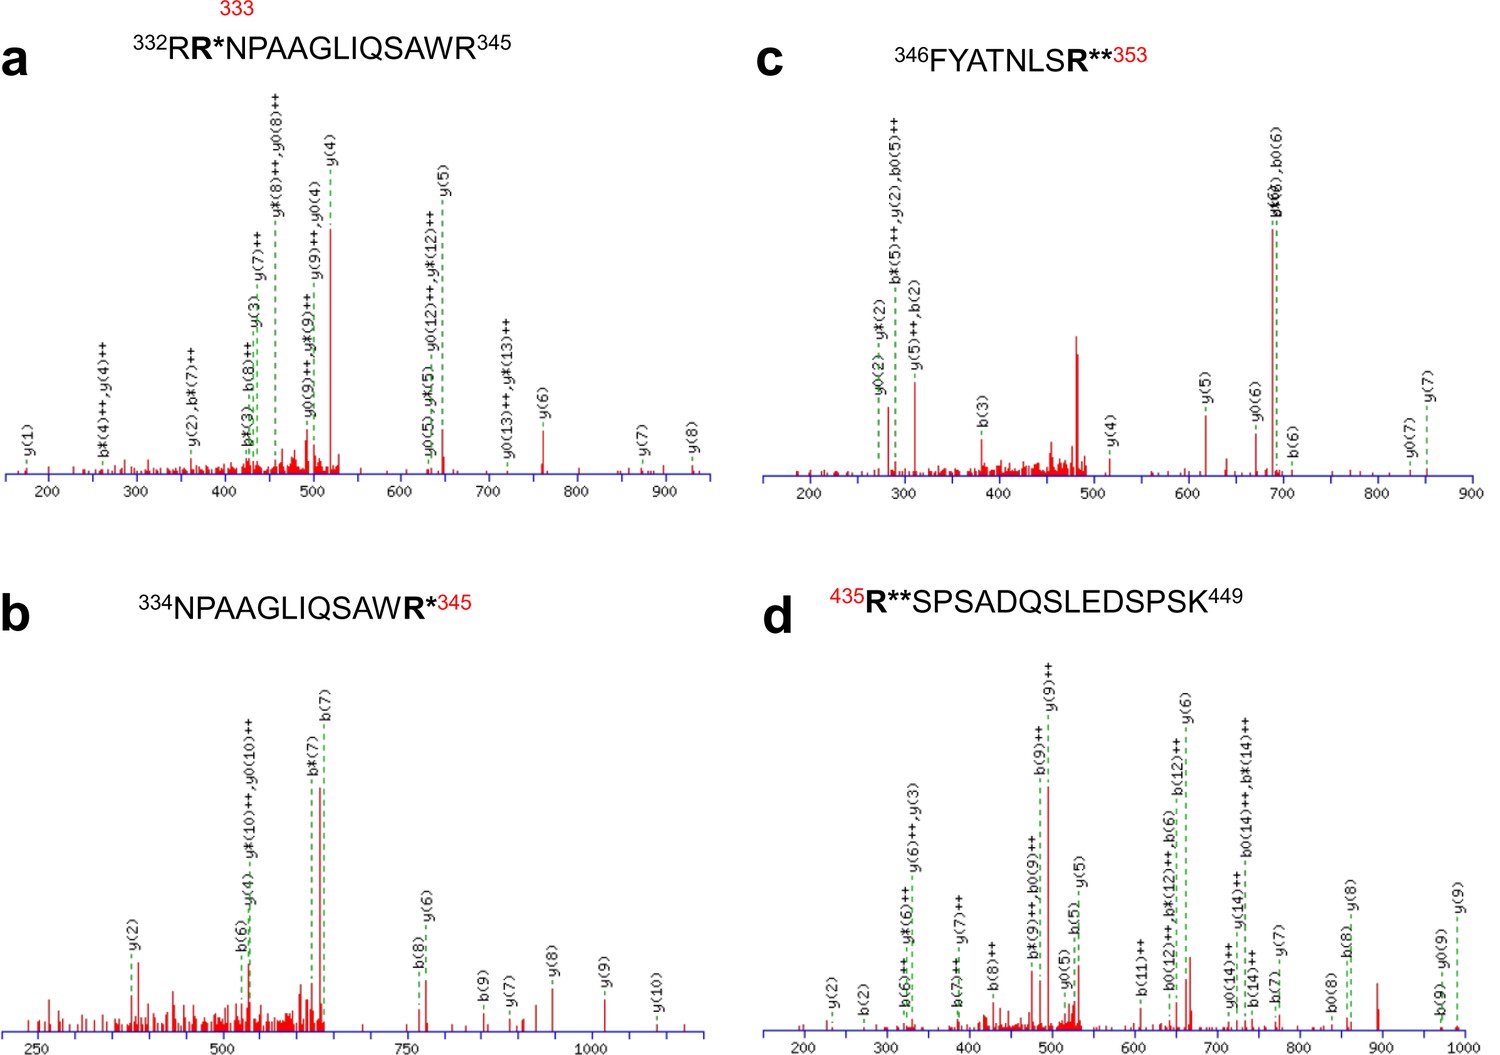
Identification of in vivo arginine methylation sites of KCNQ2 MS/MS spectra of the methylated peptides.
(a) 332RRNPAAGLIQSAWR345, (b) 334NPAAGLIQSAWR345, (c) 346FYATNLSR353 and (d) 435RSPSADQSLEDSPSK449. R* represents monomethylated arginine and R** represents dimethylated arginine.
Figure 5—figure supplement 3
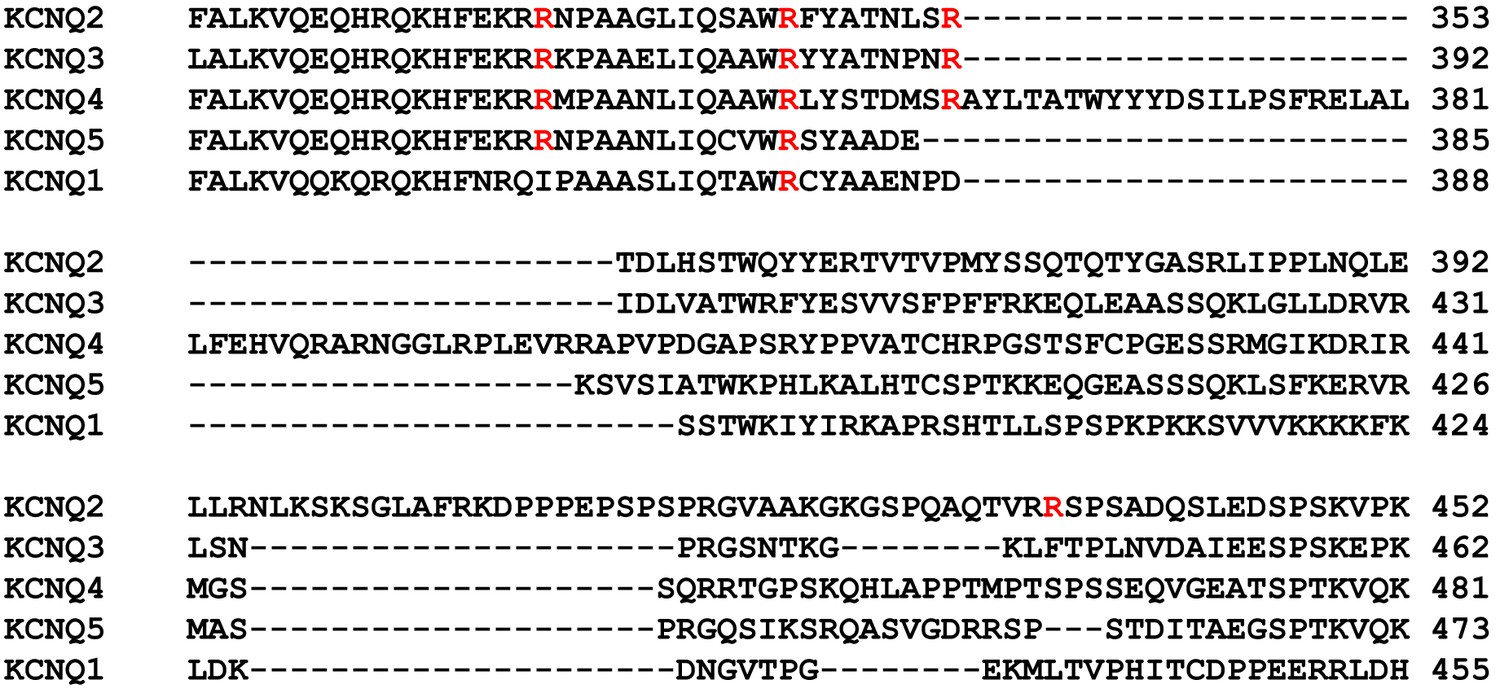
The sequence alignment of 5 difference human KCNQ isoforms.
The arginine residues critical for methylation in KCNQ2 are marked in red. KCNQ3 and KCNQ4 have 3 conserved arginine residues while KCNQ5 and KCNQ1 have two or one conserved arginine residues, respectively. Note that KCNQ2 and KCNQ3 form M currents in brain.
Figure 5—figure supplement 4

In vitro methylation assays with GST-Prmt1 or myc-Prmt5 together with GST-KCNQ2 (320-449 aa).
In vitro methylation assays with myc-Prmt5 purified from HEK293T cells and GST-Prmt1 by using GST-KCNQ2 (aa 320–449) as a substrate and histone as a positive control. Coomassie blue stainings show the loading controls for each protein.
Figure 5—figure supplement 5
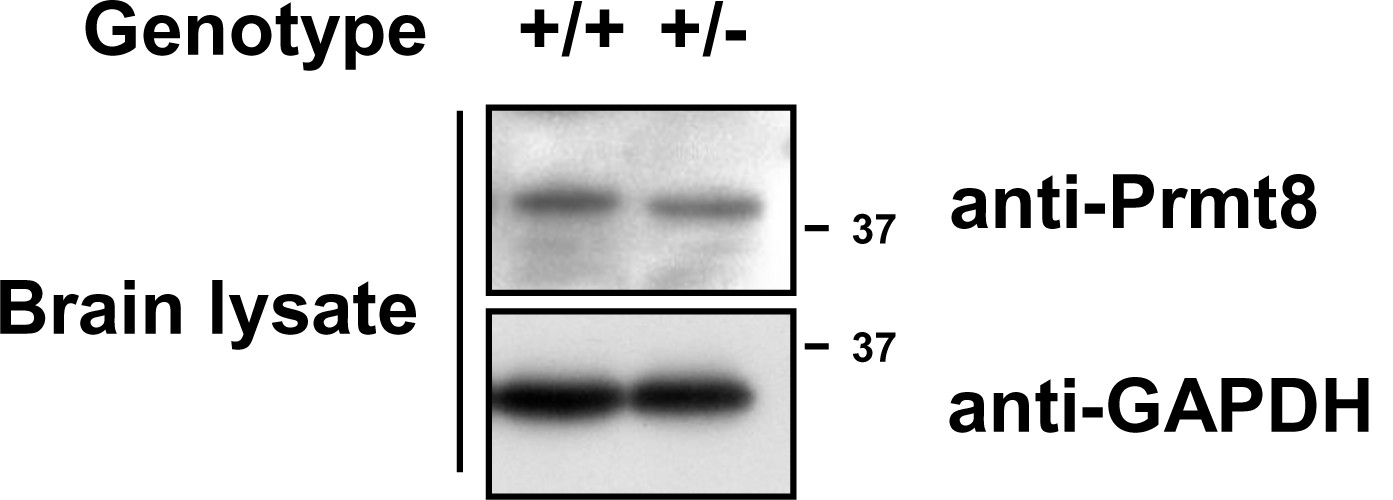
Expression of Prmt8 in Prmt1+/+ and Prmt1+/- brain lysates.
https://doi.org/10.7554/eLife.17159.018
Figure 6
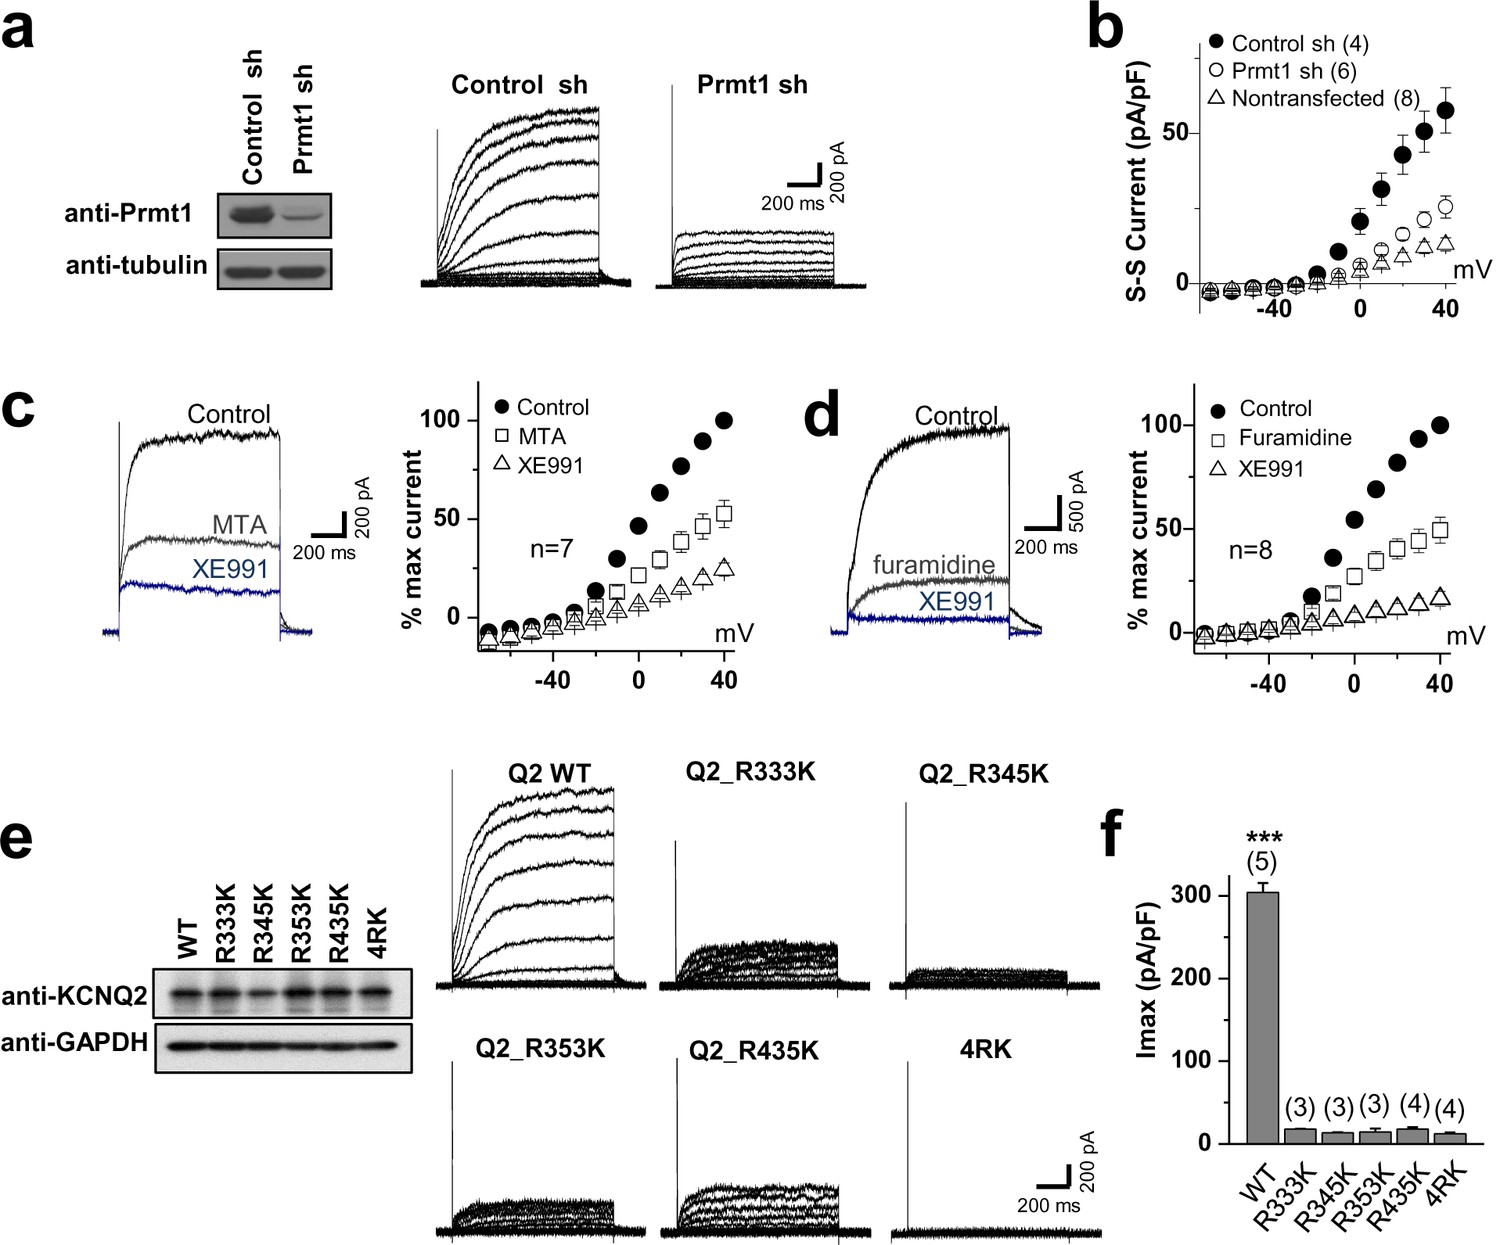
Methylation of KCNQ2 regulates its channel activity.
(a) Representative current recordings from HEK293T cells expressing KCNQ2 with control shRNA vector (left) or a Prmt1 shRNA (Prmt1 sh) (right). Currents were elicited by voltage steps from -70 mV to +40 mV with a subsequent step to -60 mV. (inset) Control immunoblotting for Prmt1 expression. (b) I-V relationships in control cells (●) or Prmt1 knockdown cells (○) or nontransfected cells (△) are shown. (c–d) Treatment of MTA (c) or furamidine (d) induces a reduction of KCNQ2 currents (left). Both of them suppress KCNQ2 currents without altering shape of I-V curves (right). XE991, KCNQ channel blocker. (e) Representative current recordings from cells expressing WT and methylation defective mutants. (inset) The control western blot shows the expression of various KCNQ vectors. (f) The current density of KCNQ2 at +40 mV for each mutant shown in e. ANOVA Tukey test, ***p<0.001.
-
Figure 6—source data 1
Source data for Figure 6.
- https://doi.org/10.7554/eLife.17159.021
Figure 7 with 5 supplements
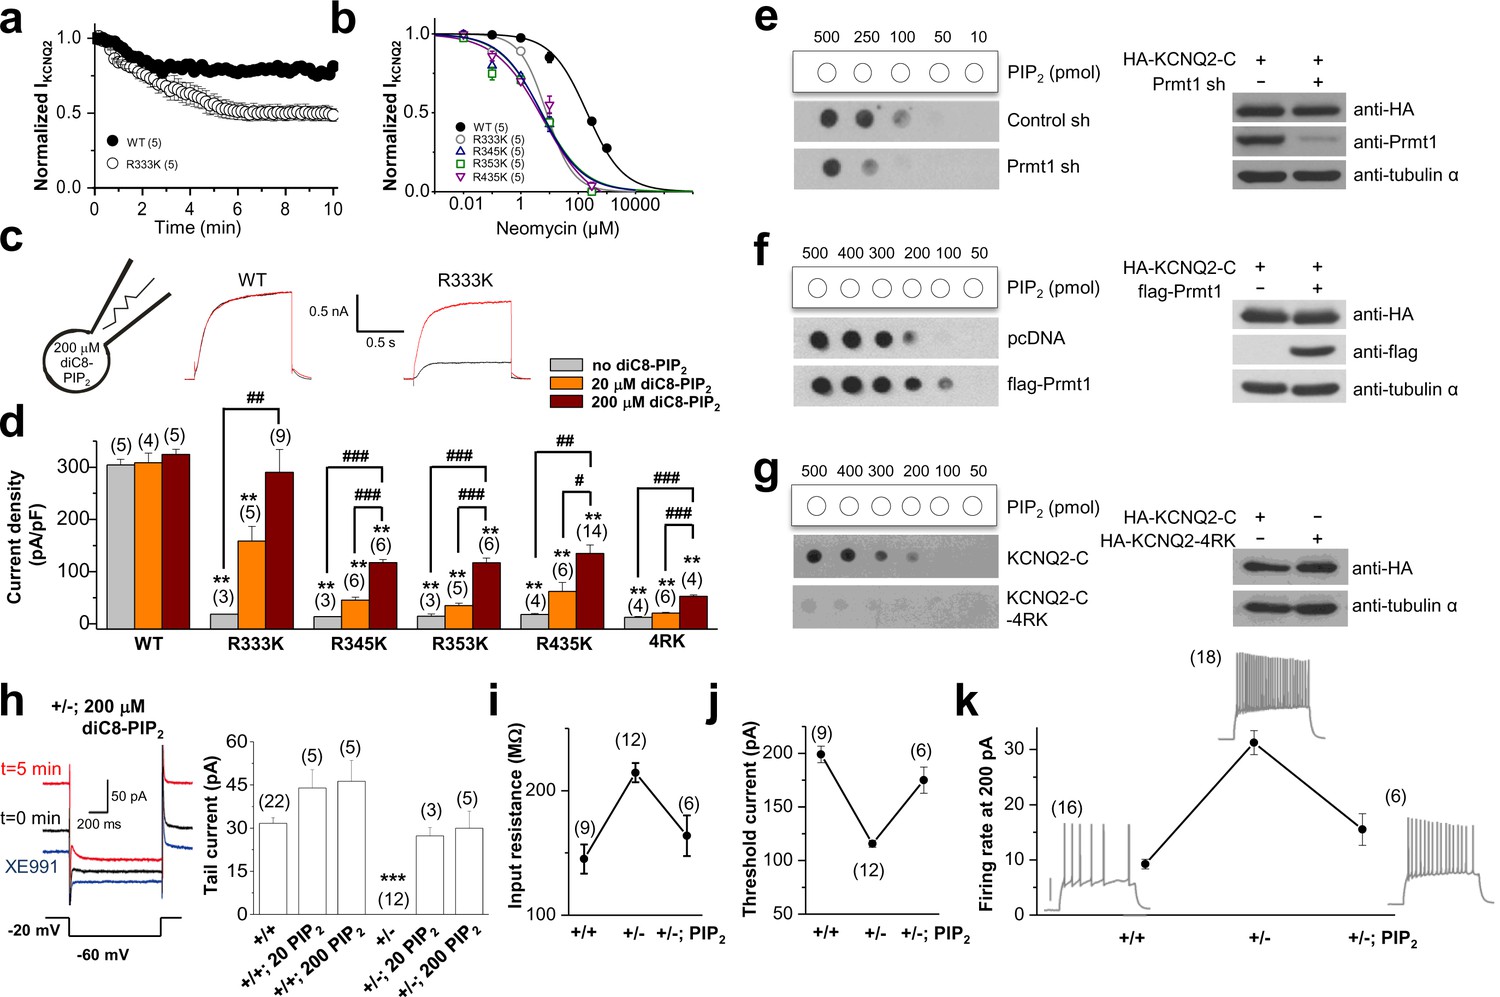
Methylation of KCNQ2 determines its PIP2 affinity.
(a) Pooled data show 10 μM neomycin-induced rundown of WT (●) and R333K (○) KCNQ2 currents. KCNQ2 currents were normalized to KCNQ2 current at t = 0. (b) Dose-response curves for neomycin measured at 10 min after rupturing the plasma membrane. Indicated concentration of neomycin was included in the patch pipette. Solid lines are Hill fits to the mean data for WT, R333K, R345K, R353K, and R435K giving IC50 values of 59.1 ± 8.3, 9.2 ± 4.2, 5.2 ± 0.2, 5.4 ± 3 and 6.2 ± 8 μM and slopes of 0.8 ± 0.05, 0.8 ± 0.3, 0.6 ± 0.1, 0.6 ± 0.2, and 0.5 ± 0.2, respectively. (c) Representative traces showing a significant increase in R333K KCNQ2 mutant by 200 μM diC8-PIP2 addition to patch pipette (red line) compared to controls (black line). KCNQ2 (WT) did not show apparent augmentations. Currents were elicited by voltage steps from -60 mV to +40 mV. (d) from data such as shown in c current densities for 0, 20, and 200 μM diC8-PIP2 in the recording pipette were determined and plotted as bars with S.E.M. Currents were measured at >20 min after rupturing the plasma membrane. The numbers in parentheses indicate the number of cells. ANOVA Tukey test. **p<0.01 versus corresponding concentration to WT. #p<0.05; ##p<0.01; ###p<0.001. (e–g) Effects of Prmt1 (e-f) or 4RK mutation (g) on the binding of KCNQ2 and PIP2. Different amounts (10–500 pmol) of PIP2 were spotted onto nitrocellulose membranes and analyzed by a protein-lipid overlay procedure using cell lysate prepared from HEK293T cells transfected with indicated expression vectors or the control pcDNA vector (left panels). The control western blots are shown in right panels. (h) Left, representative traces show augmentation of M-current by 200 μM diC8-PIP2 in the patch pipette. Right, summary of M-current density from WT neurons and Prmt1+/- neurons with 0, 20, and 200 μM diC8-PIP2 in the recording pipette. Mean ± S.E.M. ANOVA Tukey test, ***p<0.001. (i–j) the mean value of input resistance (i), and threshold current for AP generation (100 ms duration; j) from WT (+/+) neurons, mutants (+/-), and mutants loaded with 20 μM diC8-PIP2 (+/-; PIP2). (k) the mean number of APs in response to 1-s depolarizing current injection (200 pA) from a WT (+/+) neuron, a mutant (+/-), and a mutant loaded with 20 μM diC8-PIP2 (+/-; PIP2).
-
Figure 7—source data 1
Source data for Figure 7.
- https://doi.org/10.7554/eLife.17159.023
Figure 7—figure supplement 1
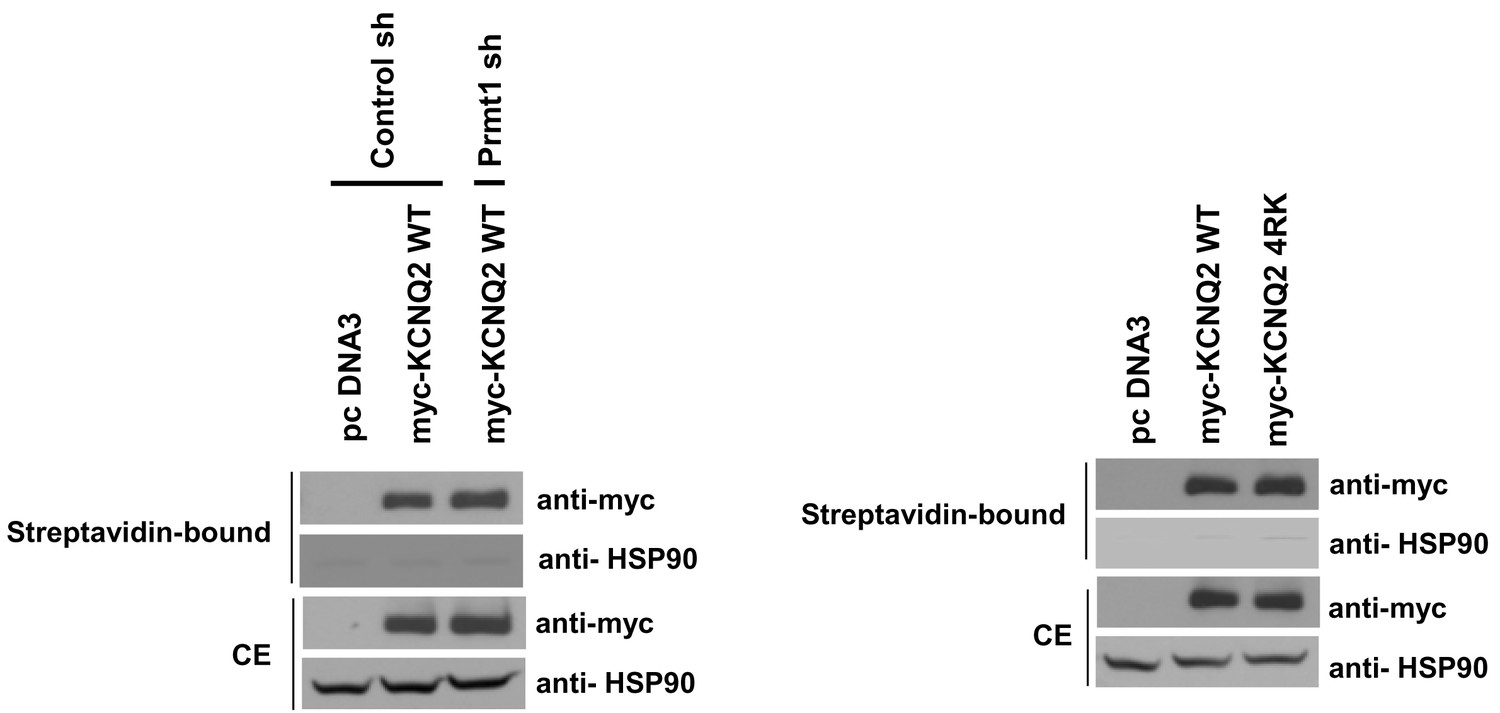
Surface expression of KCNQ channels was not affected by Prmt1 knockdown or 4RK mutation.
Membrane surface biotinylation assays show that the ratio of channels on the membrane to those in the total lysates was not significantly different in control cells and Prmt1 knockdown cells (left). Also, 4RK (R333K/R345K/R353K/R435K) substitution in KCNQ2 does not affect the correct trafficking of channel to the plasma membrane (right).
Figure 7—figure supplement 2
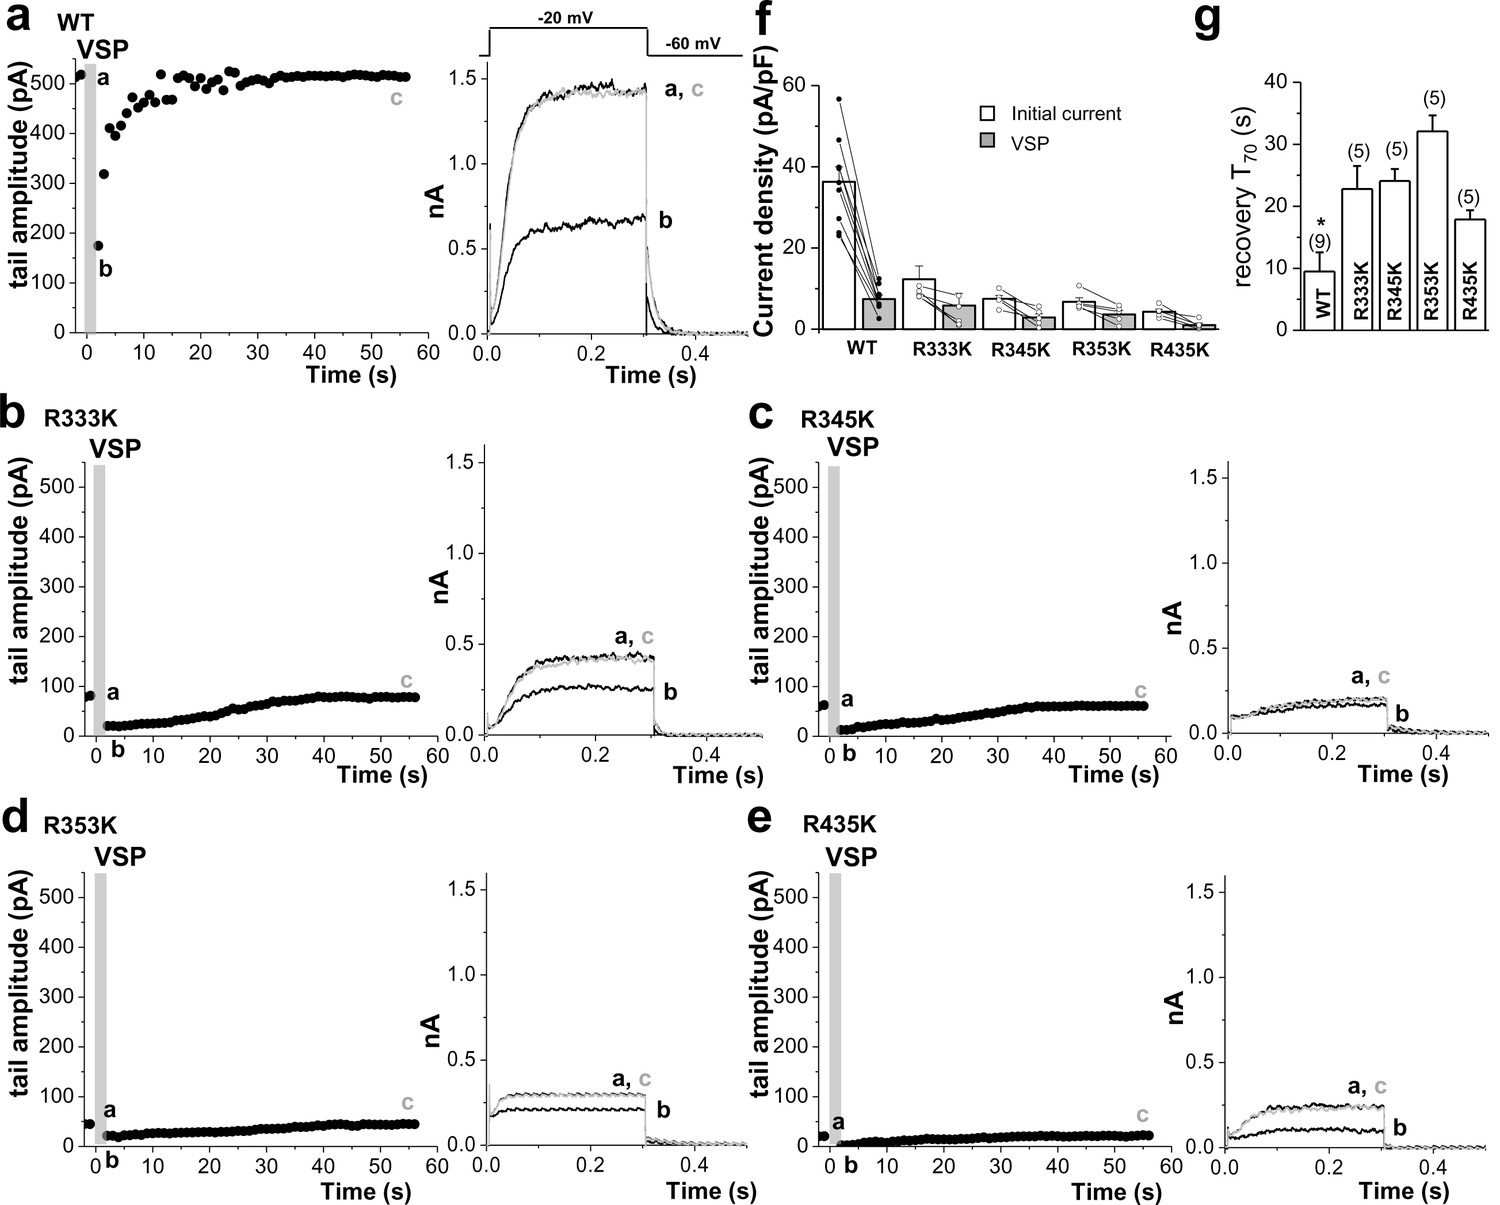
Quantitative determination of the sensitivity of KCNQ2 channels to activation of Dr-VSP in HEK293T cells.
Tail current amplitudes were used to measure current inhibition by Dr-VSP activation and its recovery. (a–e) Time course of tail current amplitude in a cell transfected with Dr-VSP and WT KCNQ2 (a), R333K (b), R345K (c), R353K (d), or R435K (e). Membrane was held at -60 mV and depolarized to -20 mV for 300 ms every 1 s, except for shaded area where membrane was held at +100 mV for 2 s. Tail currents were measured during slow channel deactivation at -60 mV. Right, superimposed currents at time points before VSP activation (a), after VSP activation (b), and during recovery (c). (f) Summary of tail current density at baseline (initial current) and right after VSP activation (VSP). (g) time to the 70% maximum current amplitude (T70) after VSP activation was measured for indicated WT KCNQ2 and RK mutants for recovery kinetics comparison (n = 5–9). Mean ± SEM shown. ANOVA Holm-Sidak test. *p<0.05 versus WT.
-
Figure 7—figure supplement 2—source data 1
Source data for Figure 7—figure supplement 2.
- https://doi.org/10.7554/eLife.17159.026
Figure 7—figure supplement 3
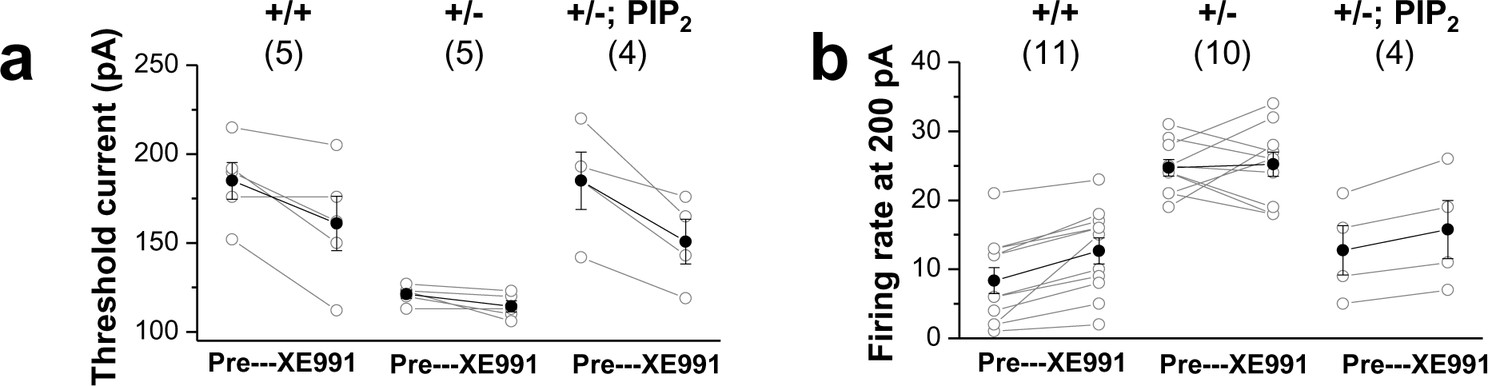
Comparison of XE991 sensitivity in GCs.
Changes in firing rate (a) and threshold current (b) in WT (+/+) neurons, mutants (+/-), and mutants loaded with 20μM diC8-PIP2 (+/-; PIP2) in response to 10 μM XE991. Each connected line represents an individual neuron. Closed circles give the averaged changes. No change in input resistance and firing rate occurred with 10 μM XE991 in mutants, whereas addition of 10 μM XE991 to mutants after PIP2 dialysis produced a substantial decrease in threshold current and increase in firing rate, as in WT GCs.
-
Figure 7—figure supplement 3—source data 1
Source data for Figure 7—figure supplement 3.
- https://doi.org/10.7554/eLife.17159.028
Figure 7—figure supplement 4
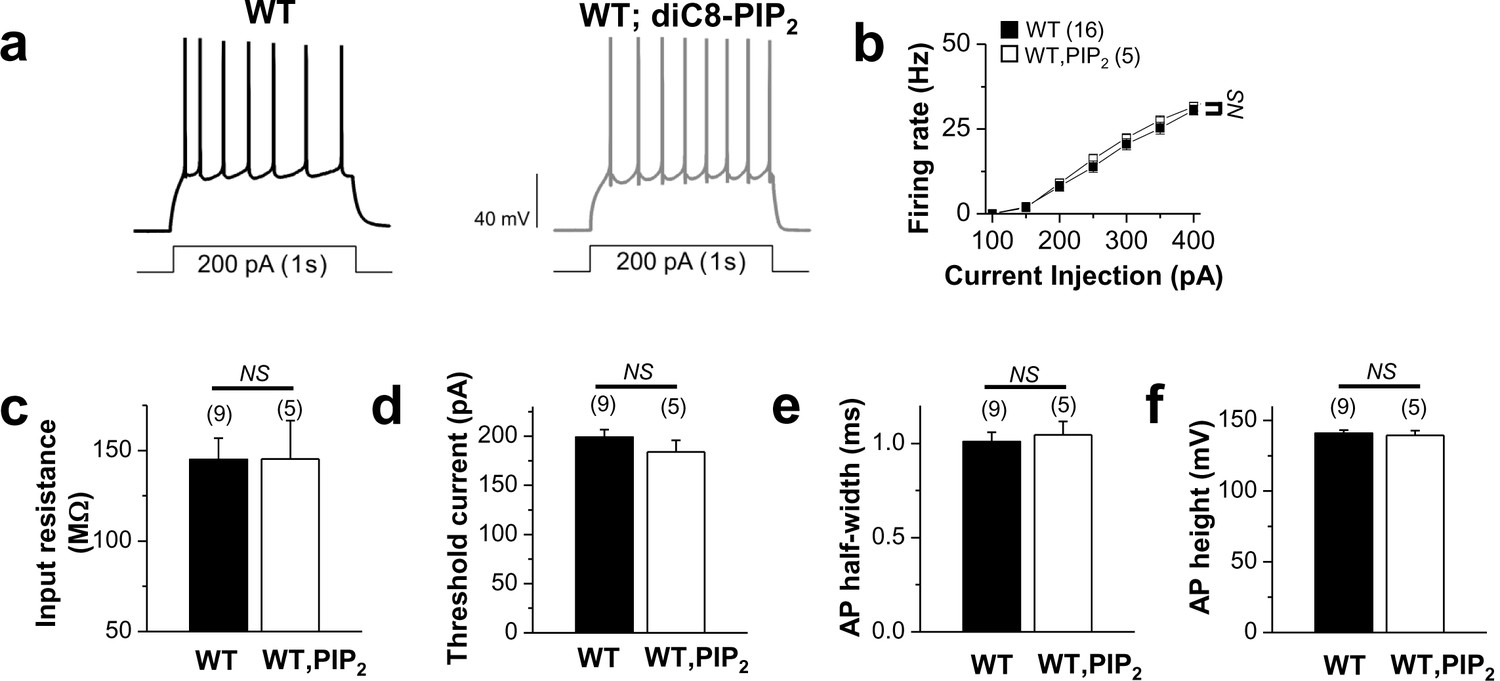
Application of exogenous PIP2 had little effect on the excitability in WT neurons.
(a) representative trace in the whole-cell current-clamp recording from WT GCs with no PIP2 (left) or 20 μM diC8-PIP2 in the patch pipette (right) in response to 1-s depolarizing current injection (200 pA). (b) the mean number of action potentials (AP No.) plotted against the eliciting currents (from 100 pA to 400 pA, + 50 pA increment, during 1-s). (c–f) summary of input resistance (c), threshold current for AP generation (100 ms duration; d), AP half-width (e), and AP height (f) from WT mature dentate GCs when loaded with no PIP2 or 20 μM diC8-PIP2. Mean ± S.E.M. The numbers in parentheses indicate the number of cell tested.
-
Figure 7—figure supplement 4—source data 1
Source data for Figure 7—figure supplement 4.
- https://doi.org/10.7554/eLife.17159.030
Figure 7—figure supplement 5
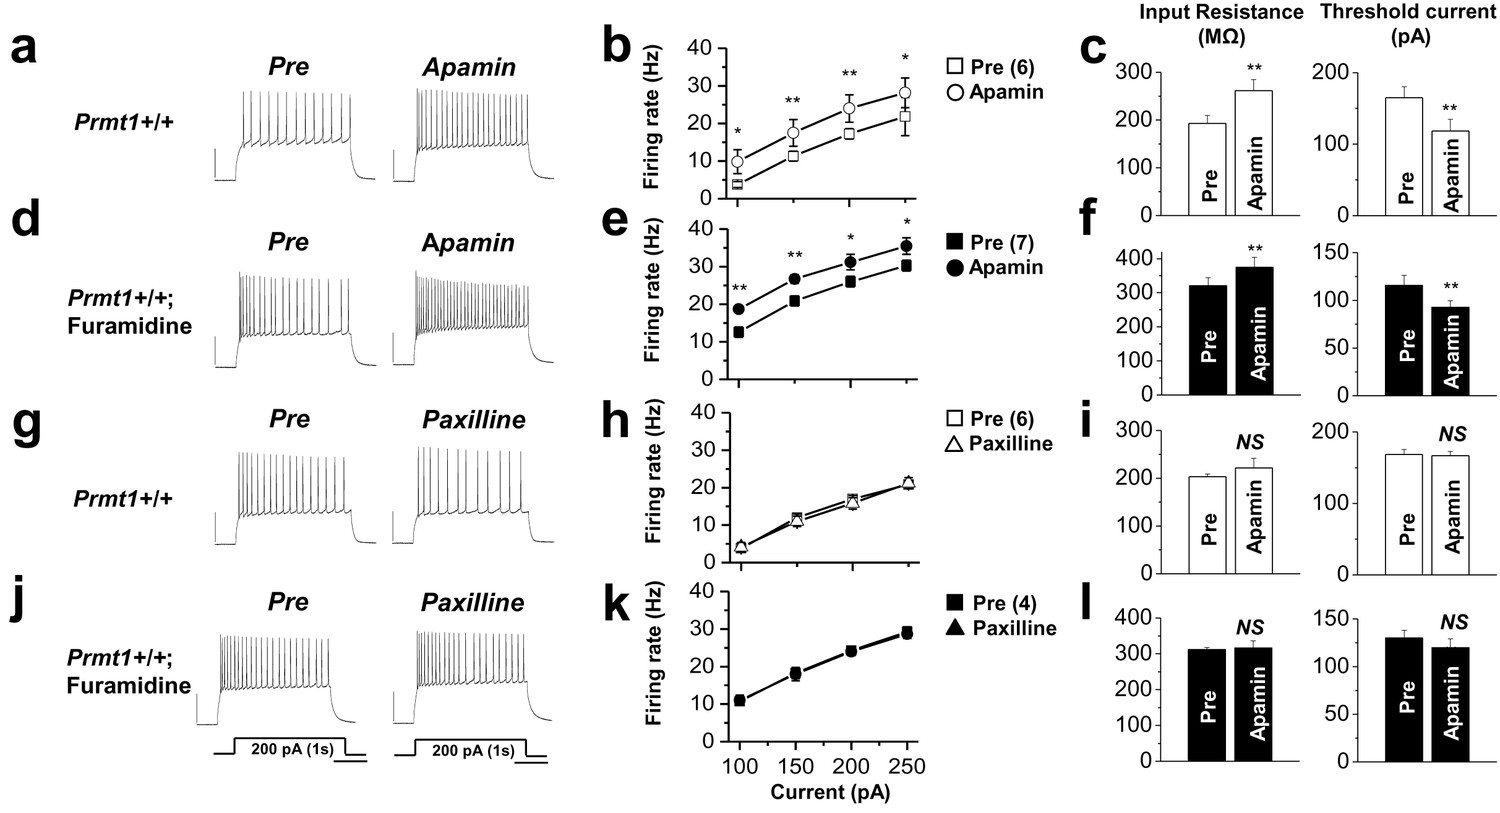
The effects of SK channel block and BK channel block on neuronal excitability of control or furamidine-pretreated GCs.
Spike trains were evoked by injecting 1-s depolarizing current pulses of different intensities (100–250 pA) into the cell before and after application of apamin (a–f) or paxilline (g–l) in control or furamidine (20 μM, 1 hr)-pretreated GCs. Examples of APs during 200-pA current injection without (left) and with the SK channel blocker apamin (100 nM) or the BK channel blocker paxilline (5 μM) (a,d,g,j). Number of APs evoked after injection of different currents (b,e,h,k). Apamin increases the firing frequency in both control and furamidine-pretreated GCs. Paxilline has little effect on firing frequency in both control and furamidine-pretreated GCs. The mean value of input resistance (left) and threshold current for AP generation (100 ms duration; right) (c,f,i,l). Error bars, S.E.M. scale bar; 40 mV, 300 msec. *p<0.05; **p<0.01 by paired Student’s t-test.
-
Figure 7—figure supplement 5—source data 1
Source data for Figure 7—figure supplement 5.
- https://doi.org/10.7554/eLife.17159.032
Figure 8
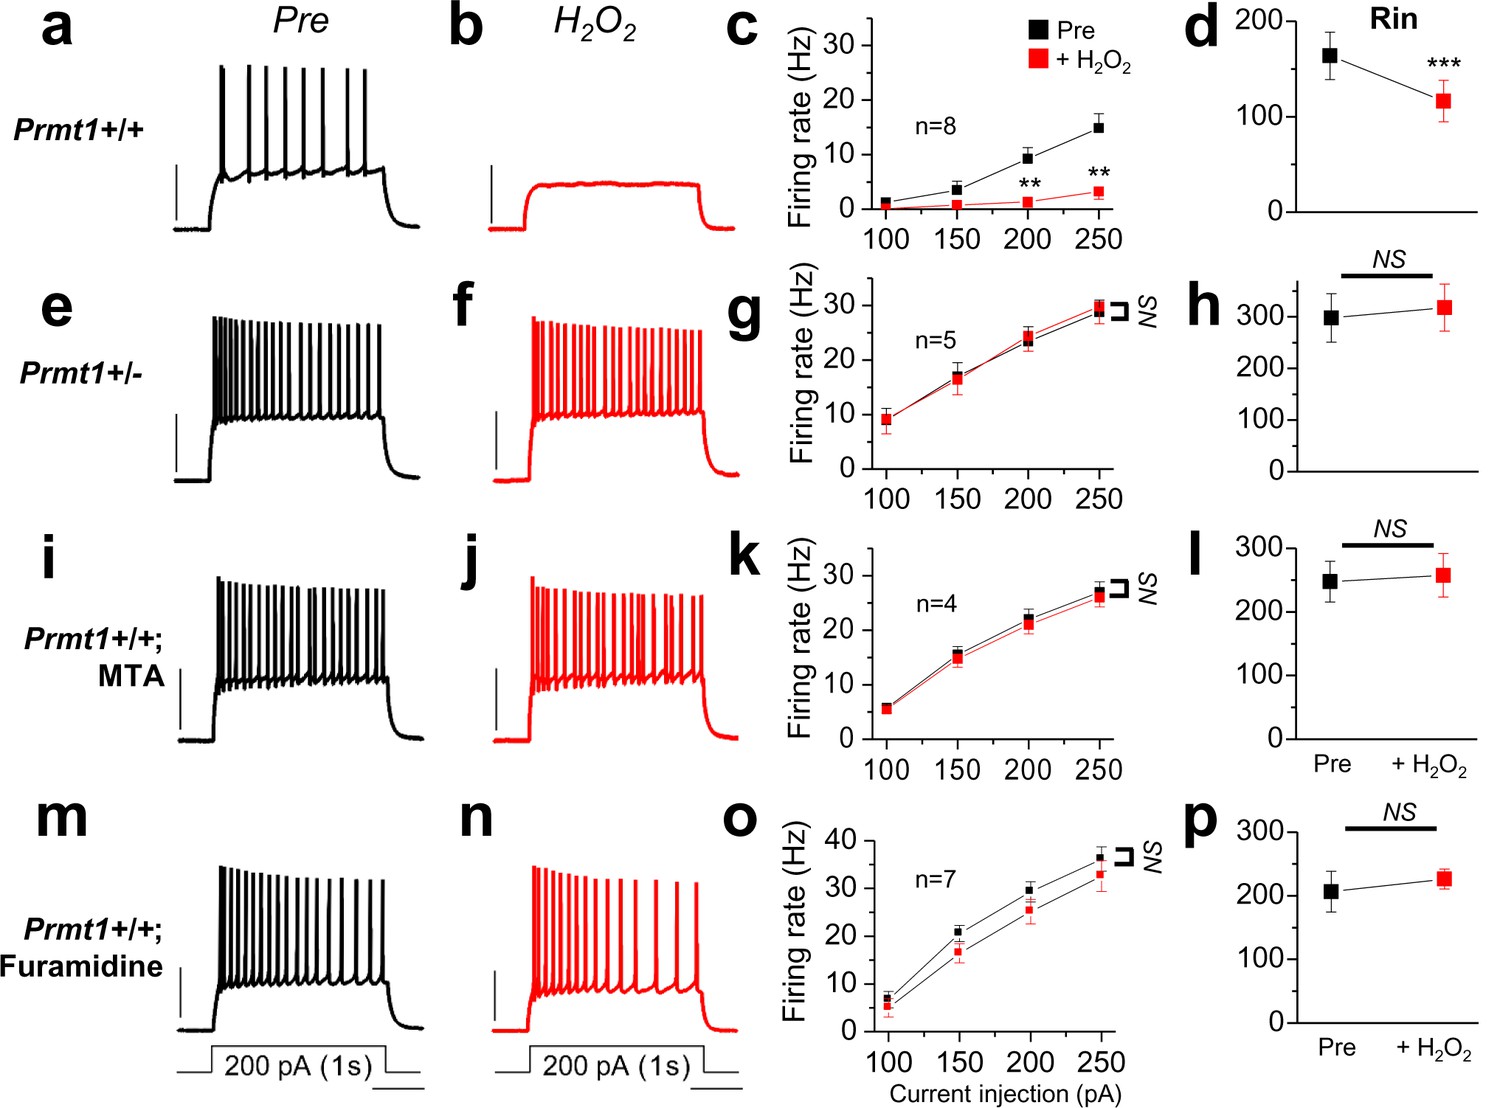
Prmt1 is involved in Oxidative stress-induced silencing of neurons.
Spike trains were evoked by injecting 1-s depolarizing current pulses of different intensities (100–250 pA) into the cell before (black) and after (red) application of H2O2. Left panels show representative recordings in normal extracellular medium (a,e,i,m) and middle panels after application of 500 μM H2O2 for 10 min (b,f,j,n). H2O2 had little effect on firing rates in Prmt1+/- GCs (f; n = 5, four mice), MTA (j; n = 4, four mice)- or furamidine (n; n = 7, four mice)-treated WT GCs than in untreated WT GCs (b; n = 8, four mice). Summary diagrams (right column) compare firing rates or input resistance before (black) and after (red) application of H2O2 in WT (c,d), Prmt1+/- (g,h), MTA (k,l)- or furamidine (o,p)-treated WT dentate GCs. **p<0.01; ***p<0.001 by Student’s t-test.
-
Figure 8—source data 1
Source data for Figure 8.
- https://doi.org/10.7554/eLife.17159.034
Figure 9 with 1 supplement
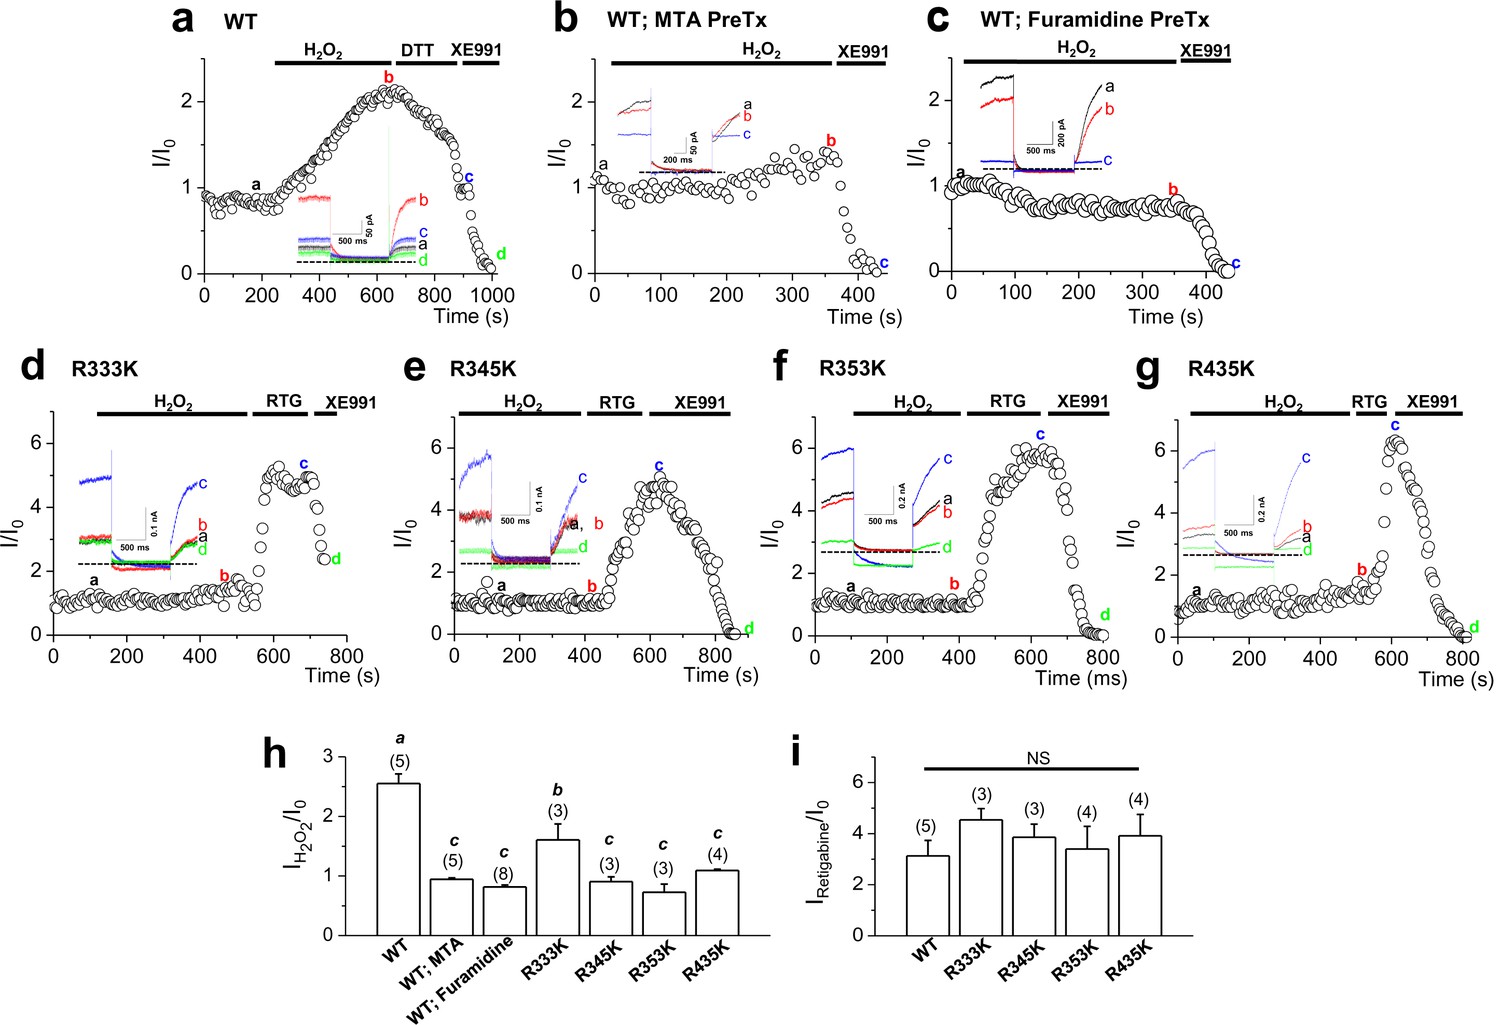
Activation of KCNQ2 channels by H2O2 is sensitive to methylation.
(a–g) Time course for the effect of 500 μM H2O2 on KCNQ2 currents. WT KCNQ2 (a-c), R333K (d), R345K (e), R353K (f) or R435K (g) were expressed in HEK293T cells. For experiment (b) & (c), cells were pretreated with MTA (100 μM) or furamidine (20 μM), respectively. Whole-cell currents were monitored by 1-s hyperpolarizing steps to -60 mV from a holding potential of -20 mV at 5-s intervals. H2O2 (500 μM), DTT (2 mM), the M-channel blocker, XE991 (50 μM), and M-channel activator, retigabine (RTG; 10 μM), were applied during the periods indicated by the bars. Plotted are normalized current amplitudes versus time during the experiment. Representative current traces from each experiment (not normalized) are depicted in the insets. (h) Summarized data for KCNQ2 activation induced by H2O2. Letters indicate statistically distinct groups (ANOVA Tukey, p<0.01). (i) Summarized data for KCNQ2 activation induced by retigabine.
-
Figure 9—source data 1
Source data for Figure 9.
- https://doi.org/10.7554/eLife.17159.036
Figure 9—figure supplement 1
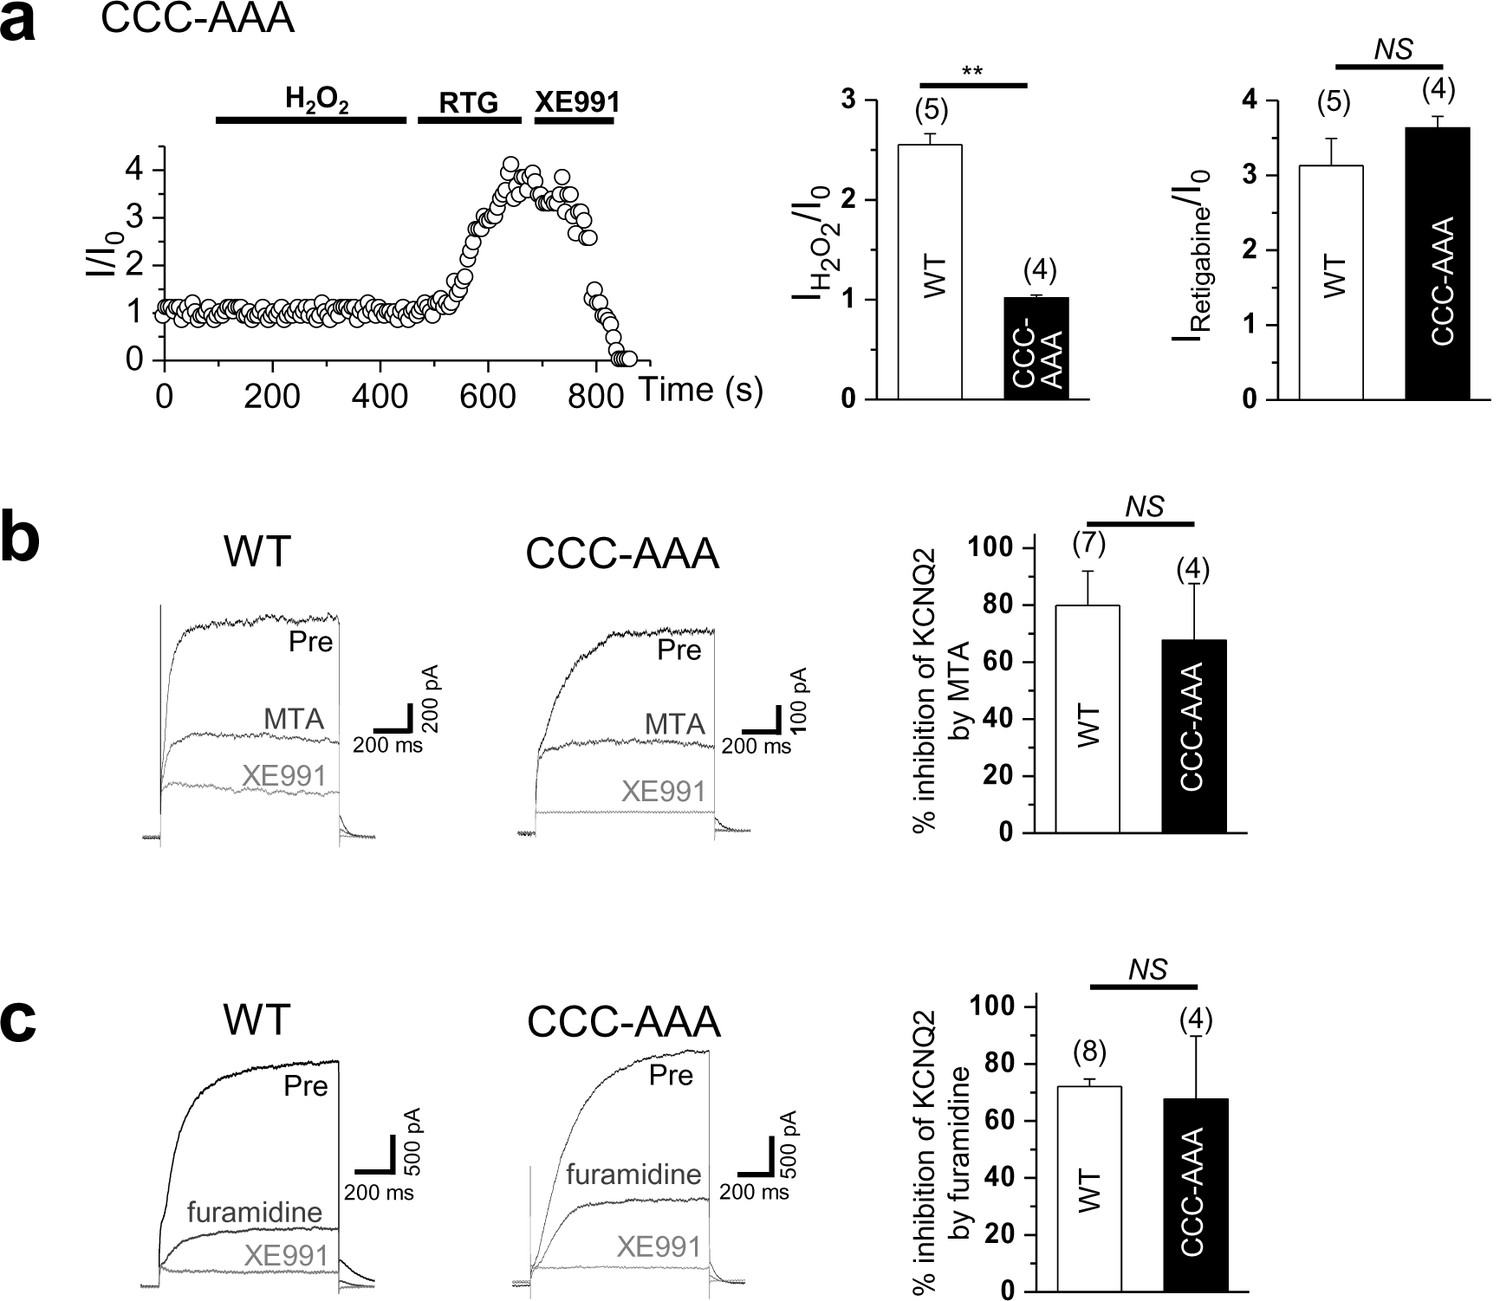
Time course for the effect of 500 μM H2O2 on Triple-Cys mutant of KCNQ2 currents (left).
Summarized data for Triple-Cys mutant of KCNQ2 currents activation induced by H2O2 or retigabine (right). (b) Treatment of MTA induces a reduction of KCNQ2(WT) and Triple-Cys mutant of KCNQ2 currents (left). Both of them suppress KCNQ2 currents without altering inhibition levels by MTA (right). XE991, KCNQ channel blocker. (c) Treatment of furamidine induces a reduction of KCNQ2(WT) and Triple-Cys mutant of KCNQ2 currents (left). Both of them suppress KCNQ2 currents without altering inhibition levels by furamidine (right).
-
Figure 9—figure supplement 1—source data 1
Source data for Figure 9—figure supplement 1.
- https://doi.org/10.7554/eLife.17159.038
Tables
Table 1
Mono- and dimethylated peptides identified from KCNQ2.
| Peptide* | Modification | Charge state |
|---|---|---|
| 332RRNPAAGLIQSAWR345 | Mono-methylated R333 | +3 |
| 334NPAAGLIQSAWR345 | Mono-methylated R345 | +2 |
| 346FYATNLSR353 | Di-methylated R353 | +2 |
| 435RSPSADQSLEDSPSK449 | Di-methylated R435 | +3 |
-
*Methylated amino acid residues are highlighted in bold.
Download links
A two-part list of links to download the article, or parts of the article, in various formats.
Downloads (link to download the article as PDF)
Open citations (links to open the citations from this article in various online reference manager services)
Cite this article (links to download the citations from this article in formats compatible with various reference manager tools)
Protein arginine methylation facilitates KCNQ channel-PIP2 interaction leading to seizure suppression
eLife 5:e17159.
https://doi.org/10.7554/eLife.17159


