Definition of two agonist types at the mammalian cold-activated channel TRPM8
- University of Leuven, Belgium
Figures
Figure 1
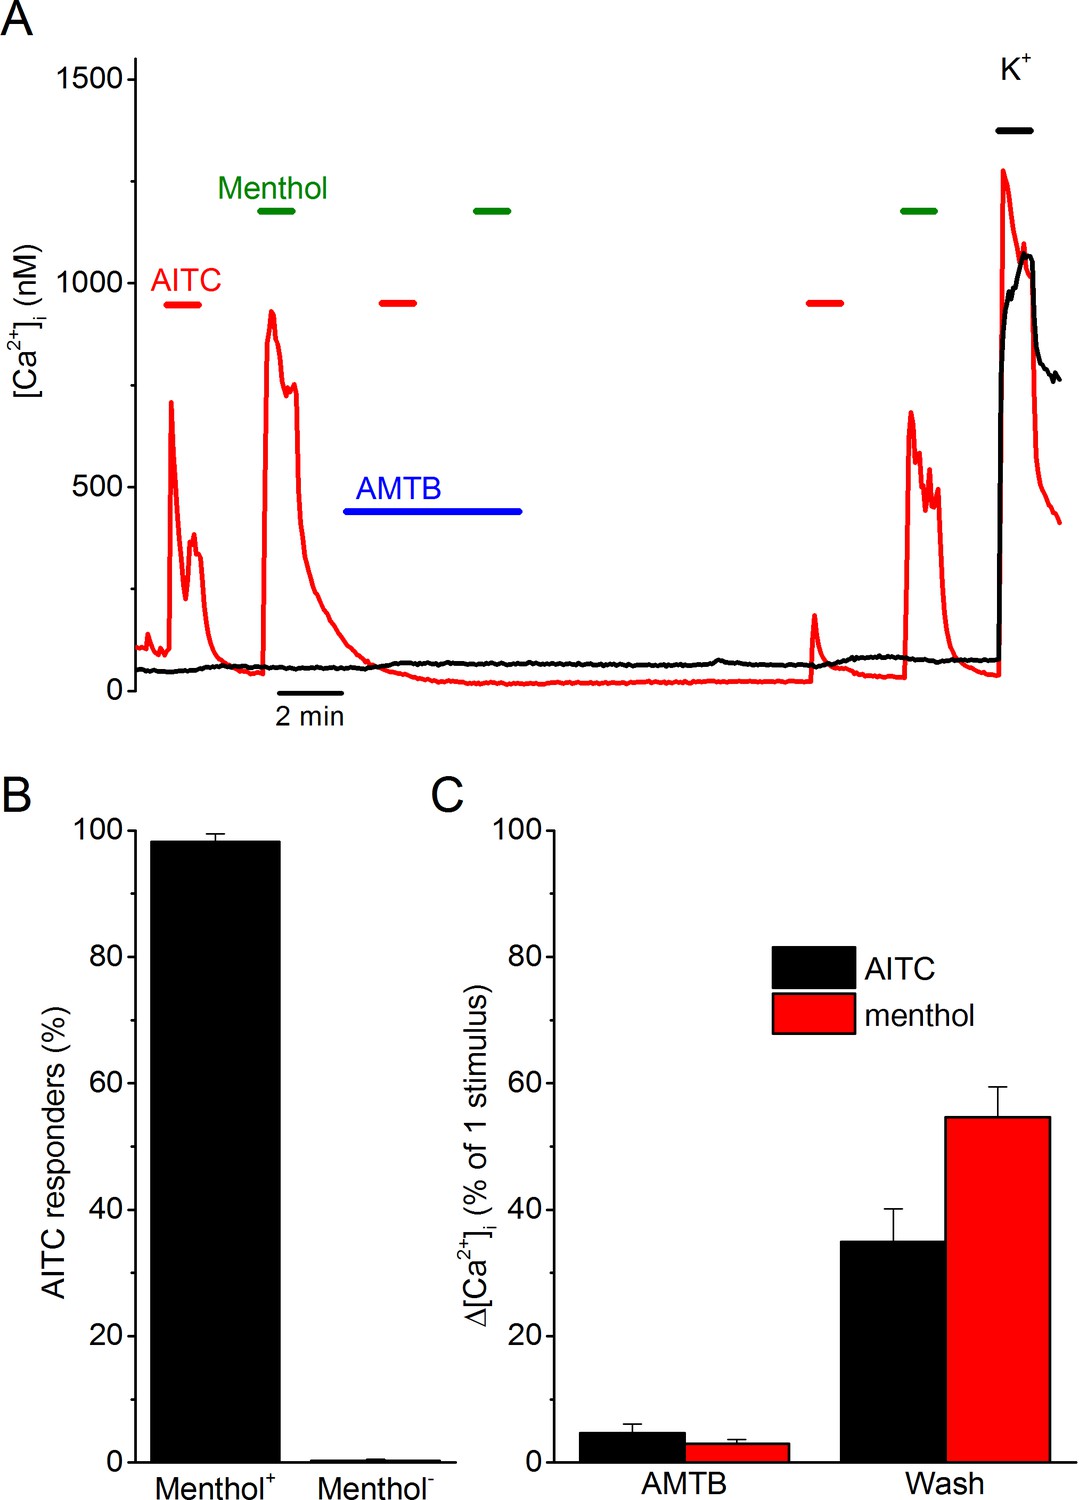
AITC excites trigeminal neurons in a TRPM8-dependent manner.
(A) Examples of fura-2-based intracellular calcium measurements in trigeminal neurons from TRPV1/TRPA1 double knockout mice. The red trace represents a neuron that shows responses to AITC (3 mM) and menthol (50 µM), which can be reversible inhibited by AMTB (2 µM). The black trace represents a non-responder. A high K+-solution (50 mM K+) was used at the end of the experiments to identify neurons from non-neuronal cells. In total, 578 neurons from 6 different mice were analyzed. (B) Percentage of AITC-responsive neurons in menthol-sensitive (n = 55) and menthol-insensitive (n = 523) neurons. (C) Quantification of the reversible inhibition by AMTB of responses to AITC and menthol (n = 54).
Figure 2
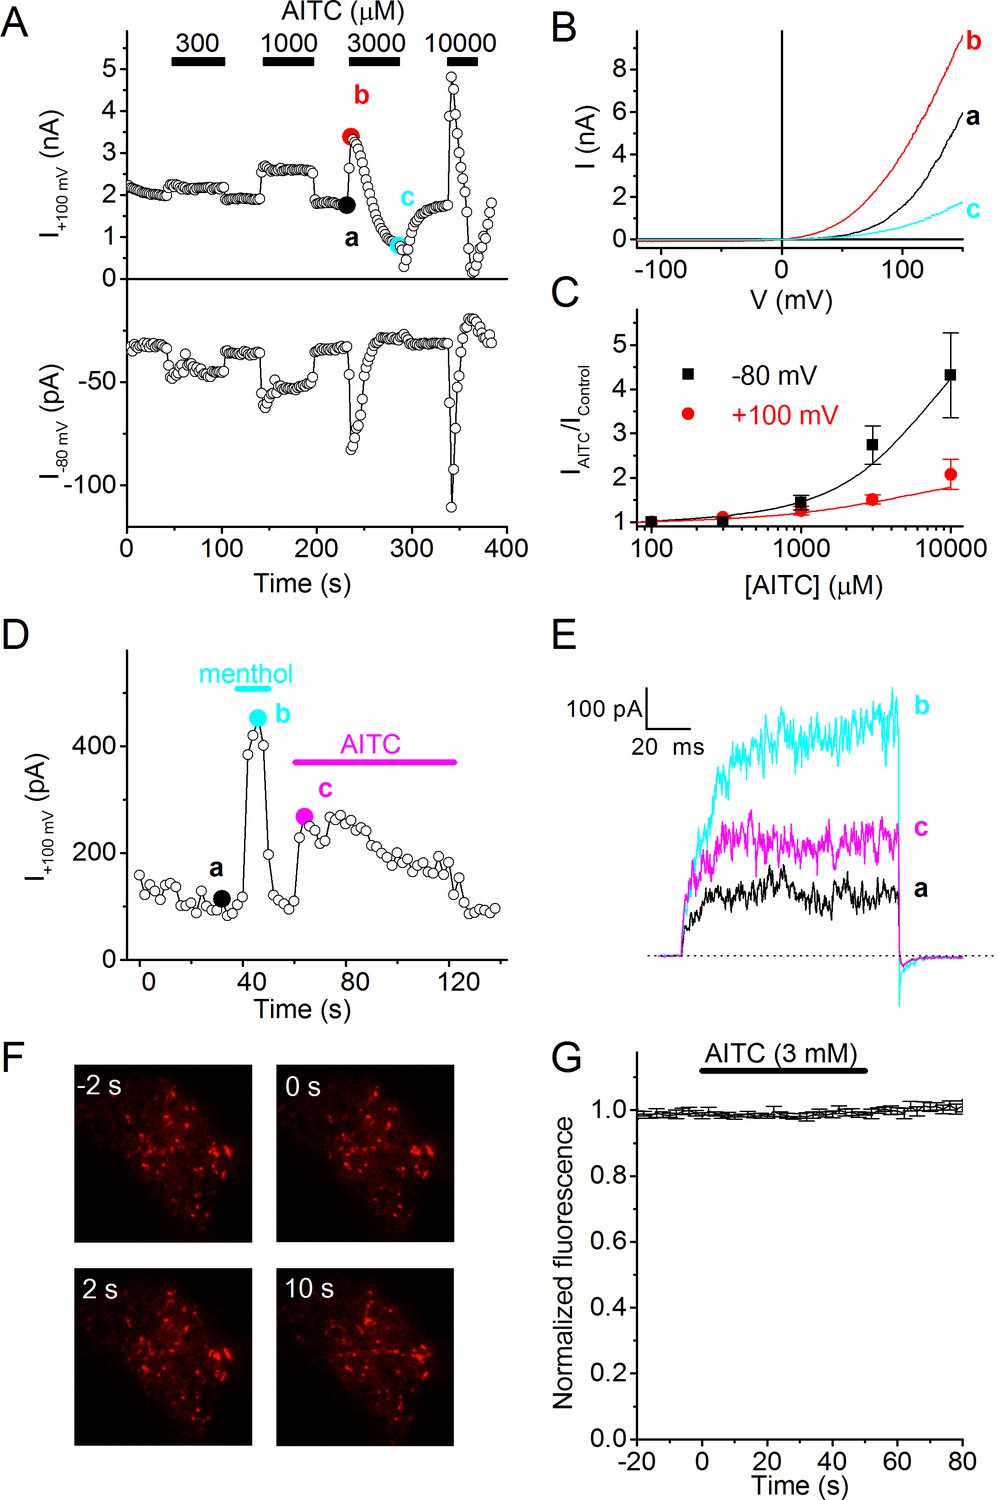
AITC activates human TRPM8.
(A) Time course of whole-cell currents at +100 and −80 mV in HEK293 cells expressing human TRPM8, upon stimulation with the indicated concentrations of AITC. (B) Current-voltage relations recorded at the time points indicated in (A). (C) Relative AITC-induced current increase at +100 and −80 mV (n = 9). (D) Menthol (50 µM) and AITC (3 mM) activate TRPM8 in cell-free inside-out patches during repetitive 100-ms voltage steps to +100 mV. Comparable current activation was measured in 5 out of 5 inside-out patches. (E) Current traces recorded at the time points indicated in (D). (F) TIRF images showing mCherry-tagged human TRPM8 in the perimembrane region before and during stimulation with 3 mM AITC. Micrographs are 20 × 20 μm. (G) Lack of change in perimembrane mCherry-fluorescence during stimulation with AITC (n = 6). Fluorescence was normalized to the total fluorescence before adding AITC to the bath solution.
Figure 3
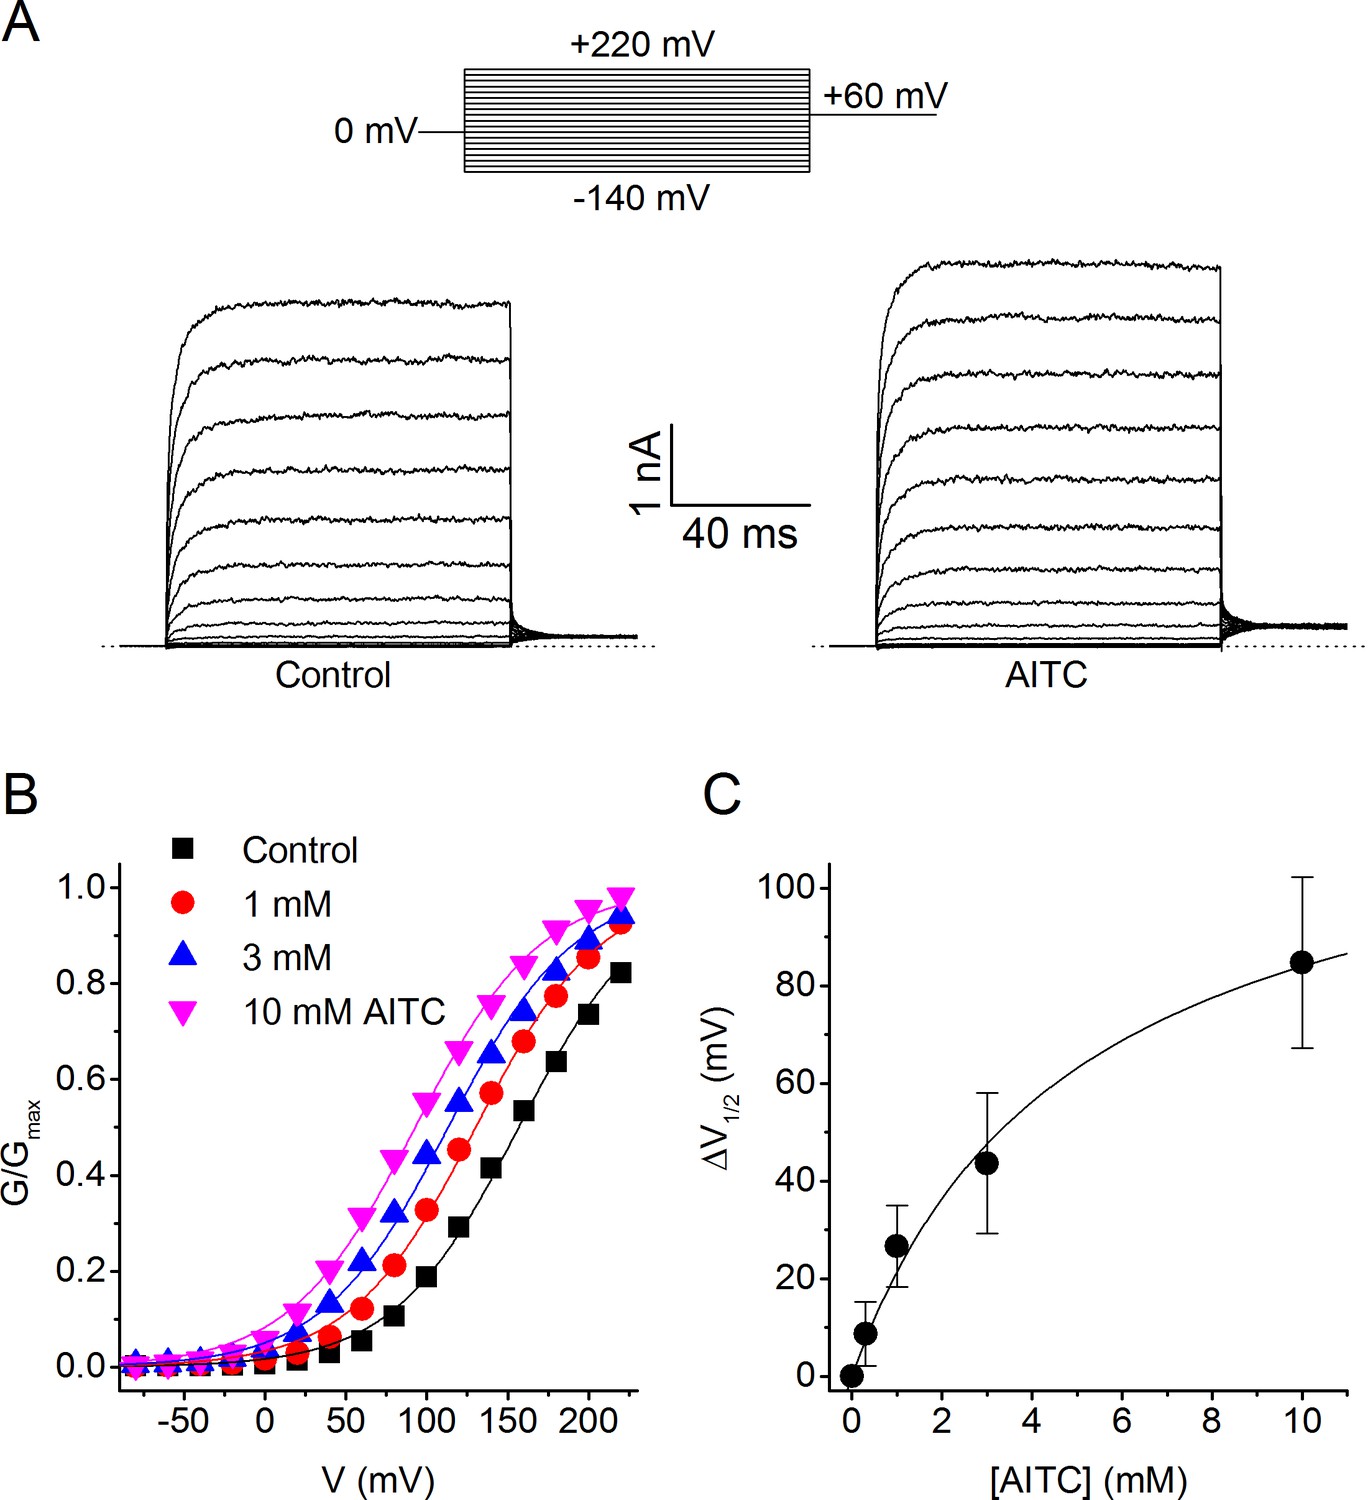
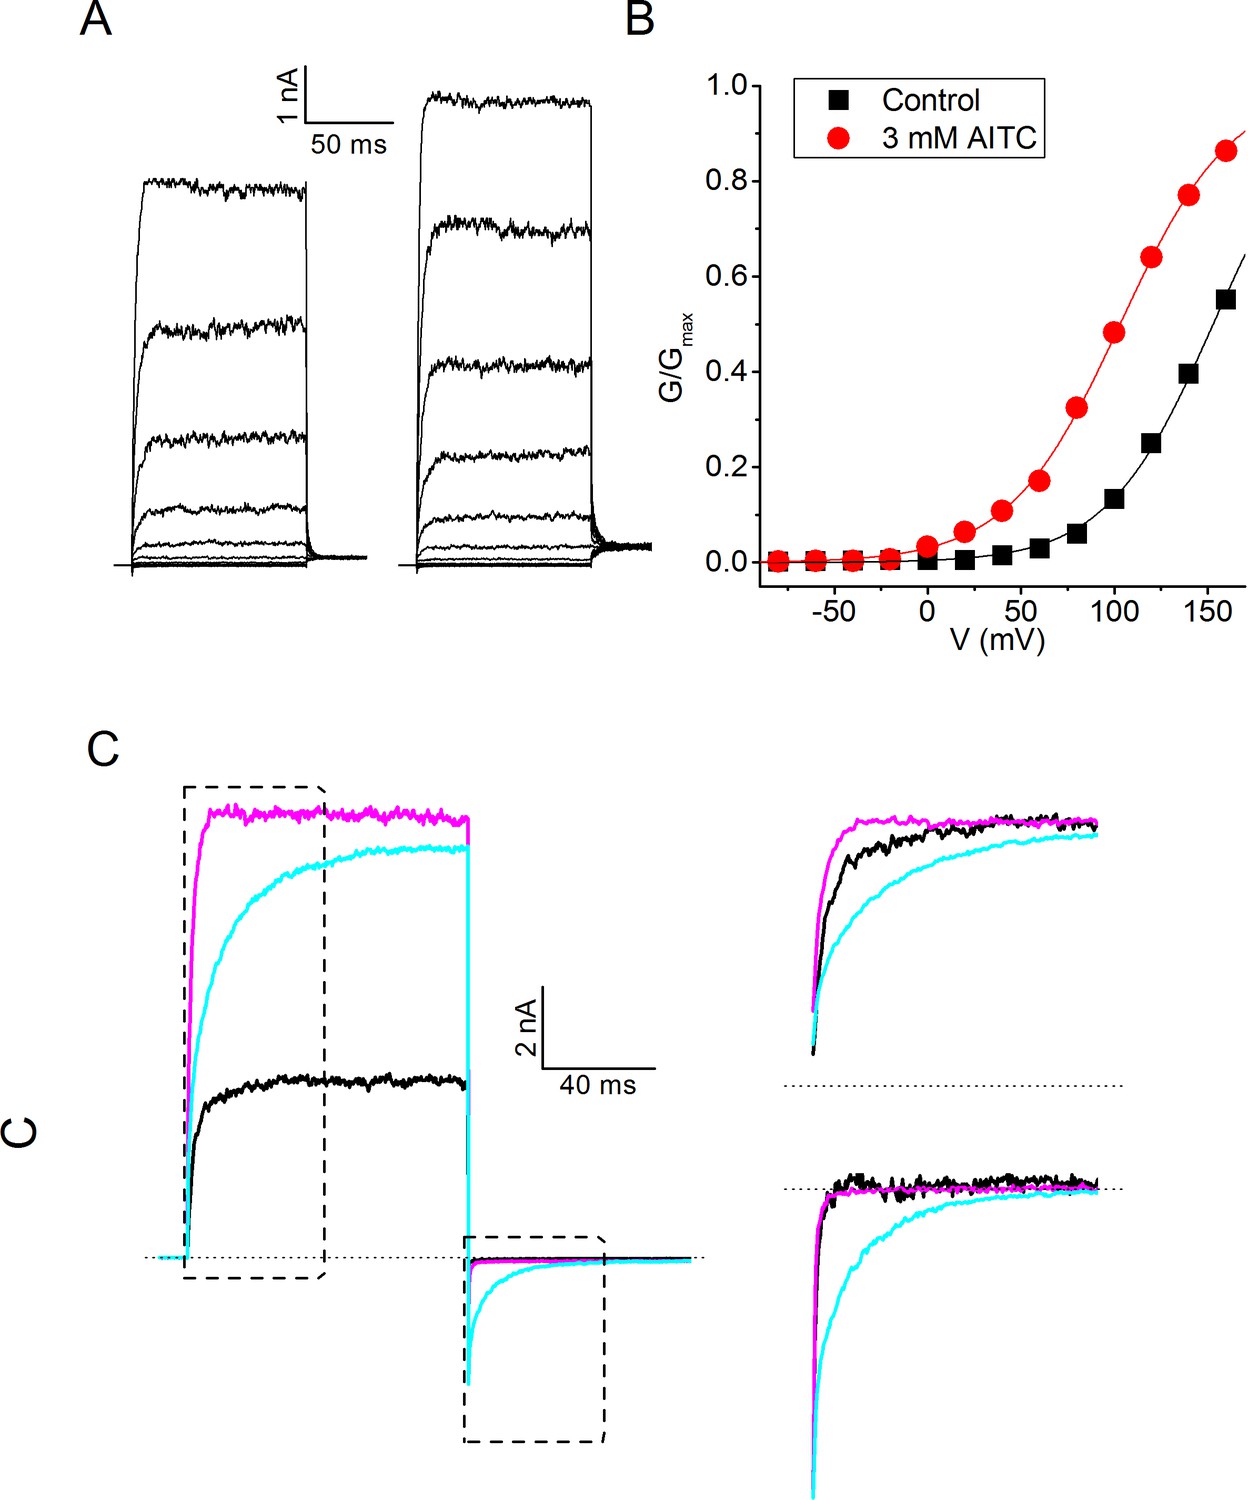
Voltage dependence of the activating effect of AITC on human TRPM8.
(A) TRPM8 currents in response to the indicated voltage step protocol in the absence and presence of AITC (1 mM). (B) Voltage-dependent activation curves in control and in the presence of the indicated AITC concentrations, for the cell shown in (A). Steady-state conductance (G) was determined as steady-state current divided by test voltage, and normalized to the estimated maximal conductance (Gmax), which was obtained by fitting a Boltzmann function to the curve in the presence of 10 mM AITC. (C) Concentration dependence of the shift of voltage-dependent activation curves (n = 7).
Figure 4 with 2 supplements
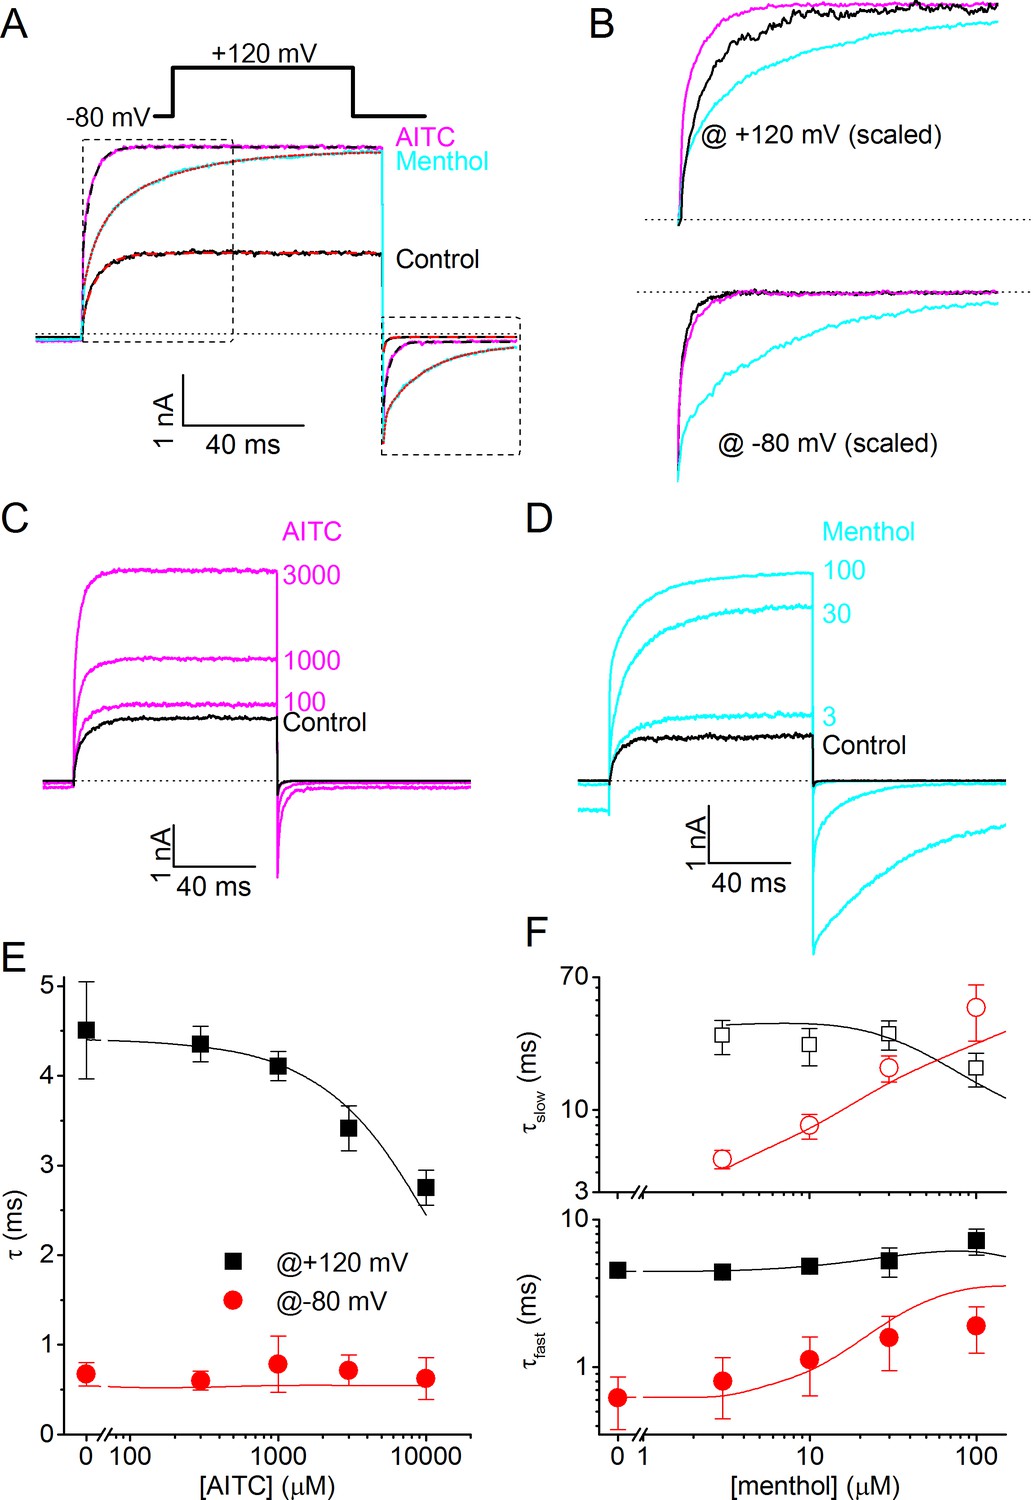
Differential effects of AITC and menthol on gating kinetics of human TRPM8.
(A) Current traces in response to the indicate voltage protocol in control condition and in the presence of menthol (30 μM) and AITC (3 mM). The dashed lines overlaying the control and AITC traces represent single exponential fits, the dotted line overlaying the menthol trace represents a double exponential fit. (B) Scaled and expanded currents corresponding to the boxed areas in (A). (C,D) Current traces in response to the voltage protocol from (A) in control condition and the indicated concentrations (in μM) of AITC and menthol. (E) Mono-exponential time constants for current relaxation at +120 and −80 mV in the presence of indicated concentrations of AITC (n = 8). Solid lines represent model predictions, obtained by fitting a mono-exponential function to simulated currents like those shown in Figure 5D. (F) Fast and slow exponential time constants for current relaxation at +120 mV and −80 mV in the presence of indicated concentrations of menthol (n = 5). Solid lines represent model predictions, obtained by fitting a double exponential function to simulated currents like those shown in Figure 5E. See Figure 4—figure supplement 1 for more details on the curve fitting.
Figure 4—figure supplement 1
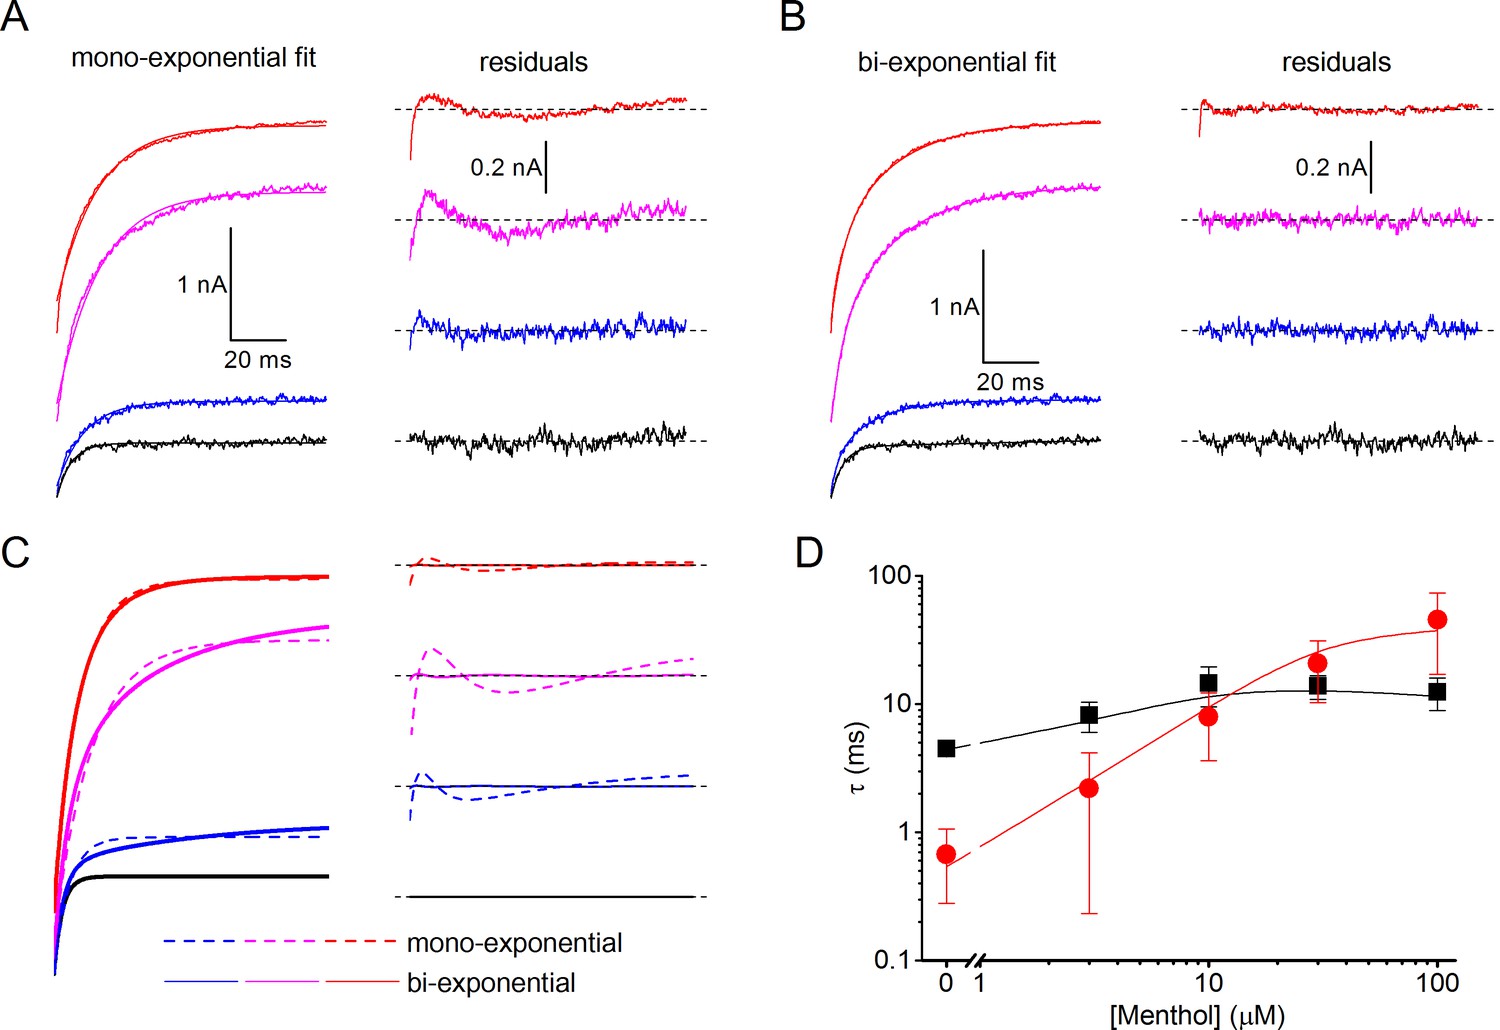
Mono- and bi-exponential fits of experimental and modeled current relaxation time courses of human TRPM8.
(A,B) Examples of mono-exponential (A) and bi-exponential (B) fits to experimental relaxation time courses in the presence of different concentrations of menthol (left), along with the corresponding residual plots (right). The data are from Figure 4D, relaxation time course at +120 mV. (C) Mono-exponential and bi-exponential fits to modeled relaxation time courses at +120 mV as in Figure 5E (left). Bi-exponential fits virtually overlap with the modeled data, as can be appreciated from the corresponding residual plots (right). (D) Comparison of mono-exponential time constants at −80 mV (red) and =120 mV (black) obtained from fits to experimental (symbols) and modeled (lines) relaxation time courses.
Figure 4—figure supplement 2

Effects of thymol, icilin and linalool on gating kinetics of human TRPM8.
(A–C) Same approach as in Figure 4, showing the effects of thymol (A; 500 μM), icilin (B; 10 μM) and linalool (C; 500 μM). (D) Effect of thymol, icilin and linalool on the time constant of current relaxation at +120 and −80 mV; n = 5 for each ligand, obtained by fitting a monoexponential function to the data.
Figure 5 with 2 supplements
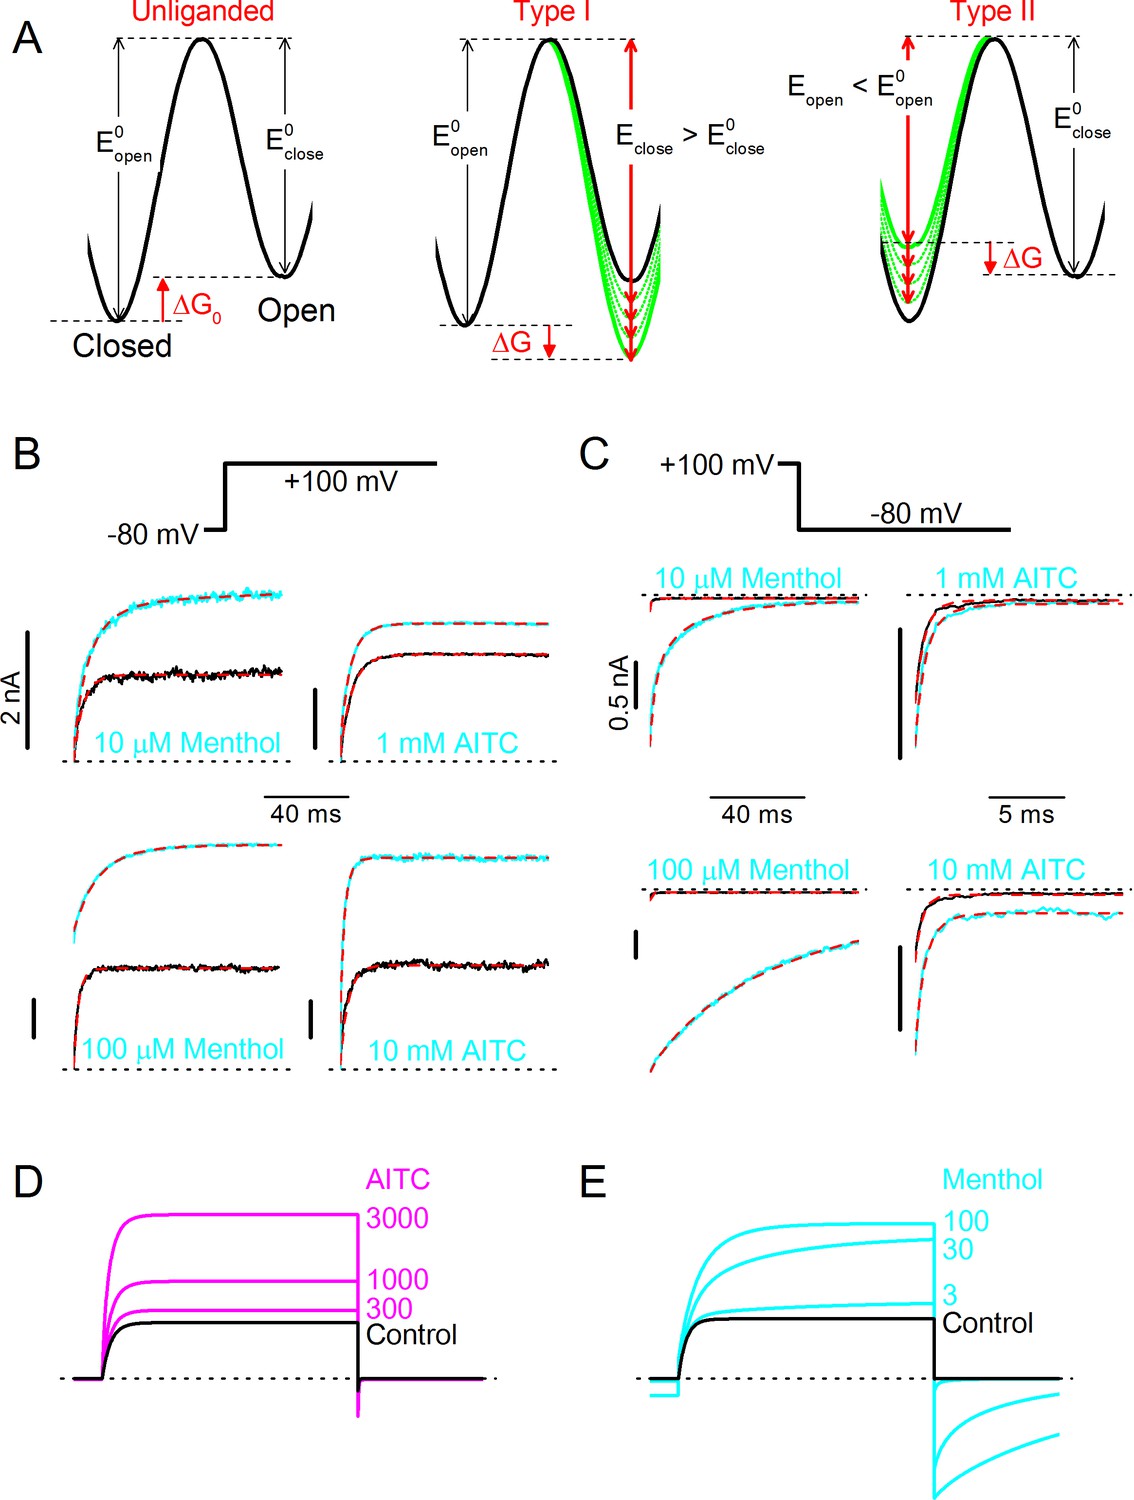
Type I (menthol-like) versus Type II (AITC-like) TRPM8 agonists.
(A) (left) Energy diagram for the transition between the closed and open channel conformation in a non-liganded channel. Steady-state equilibrium is determined by ΔG0, whereas Eopen and Eclose determine the opening and closing rates, respectively. (right) Alteration in the energy profile upon binding of Type I and Type II ligands. The black line represents the non-liganded channel, whereas the green lines represent channels with 1–4 bound ligands. The corresponding kinetic schemes are provided in Supplementary Figure 2. (B,C) Activation (B) and deactivation (C) time courses in the absence and presence of the indicated concentrations of menthol or AITC. Overlaid dashed lines represent global fits to the control and ligand-activated current traces. (D,E) Model predictions corresponding to the experimental data shown in Figure 4C,D.
Figure 5—figure supplement 1

Kinetic schemes of the MWC model, depicting the differential effects of Type I and Type II ligands.
https://doi.org/10.7554/eLife.17240.010
Figure 5—figure supplement 2
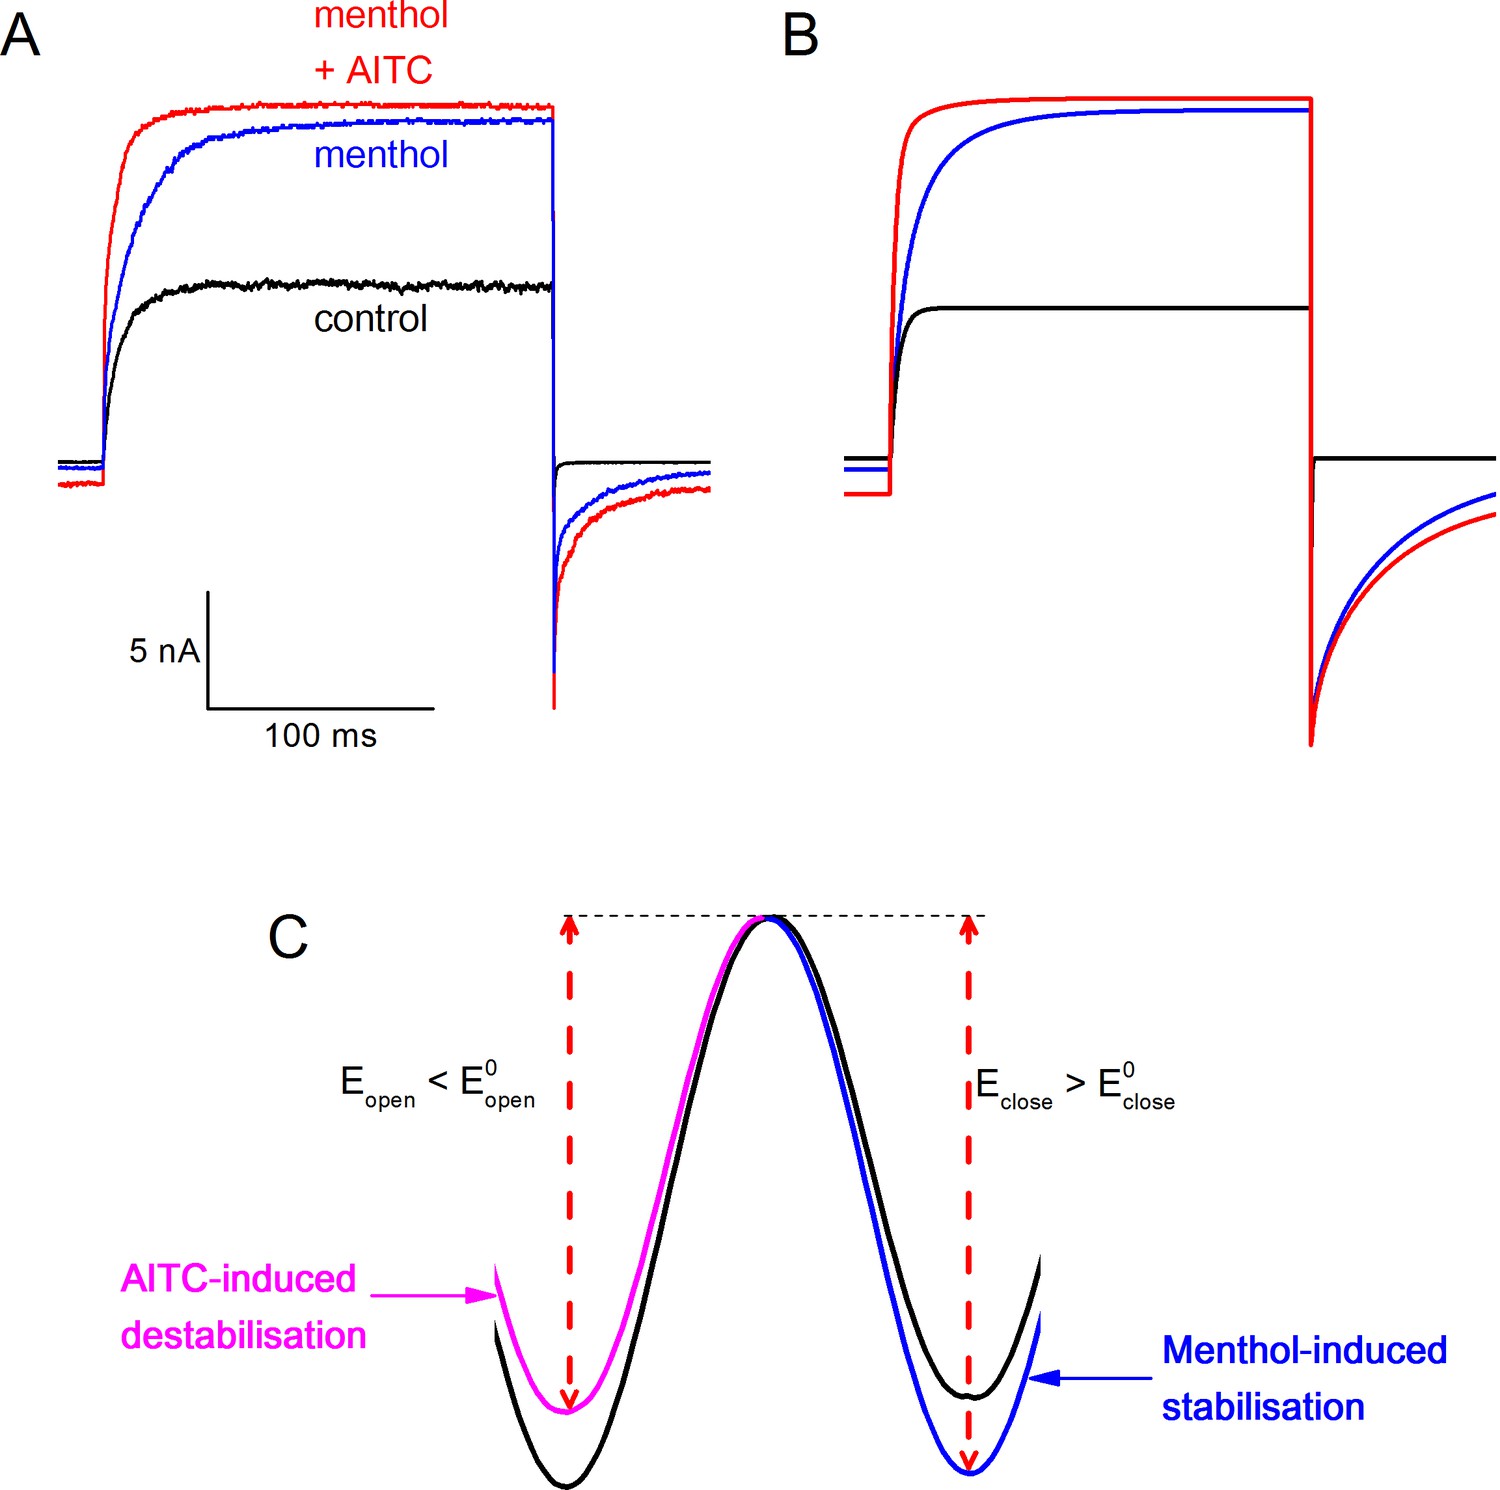
Combining Type I and Type II agonists.
(A) Combined effect of menthol and AITC on TRPM8 gating kinetics, using the voltage protocol shown in Figure 4A. (B) Model simulation of the combined effect menthol and AITC. To obtain these traces, the effect of AITC was modeled as a fixed decrease of ΔG0mVα†. (C) Energy profiles upon simultaneous binding of Type I (top) and Type II (bottom) ligands.
Figure 6
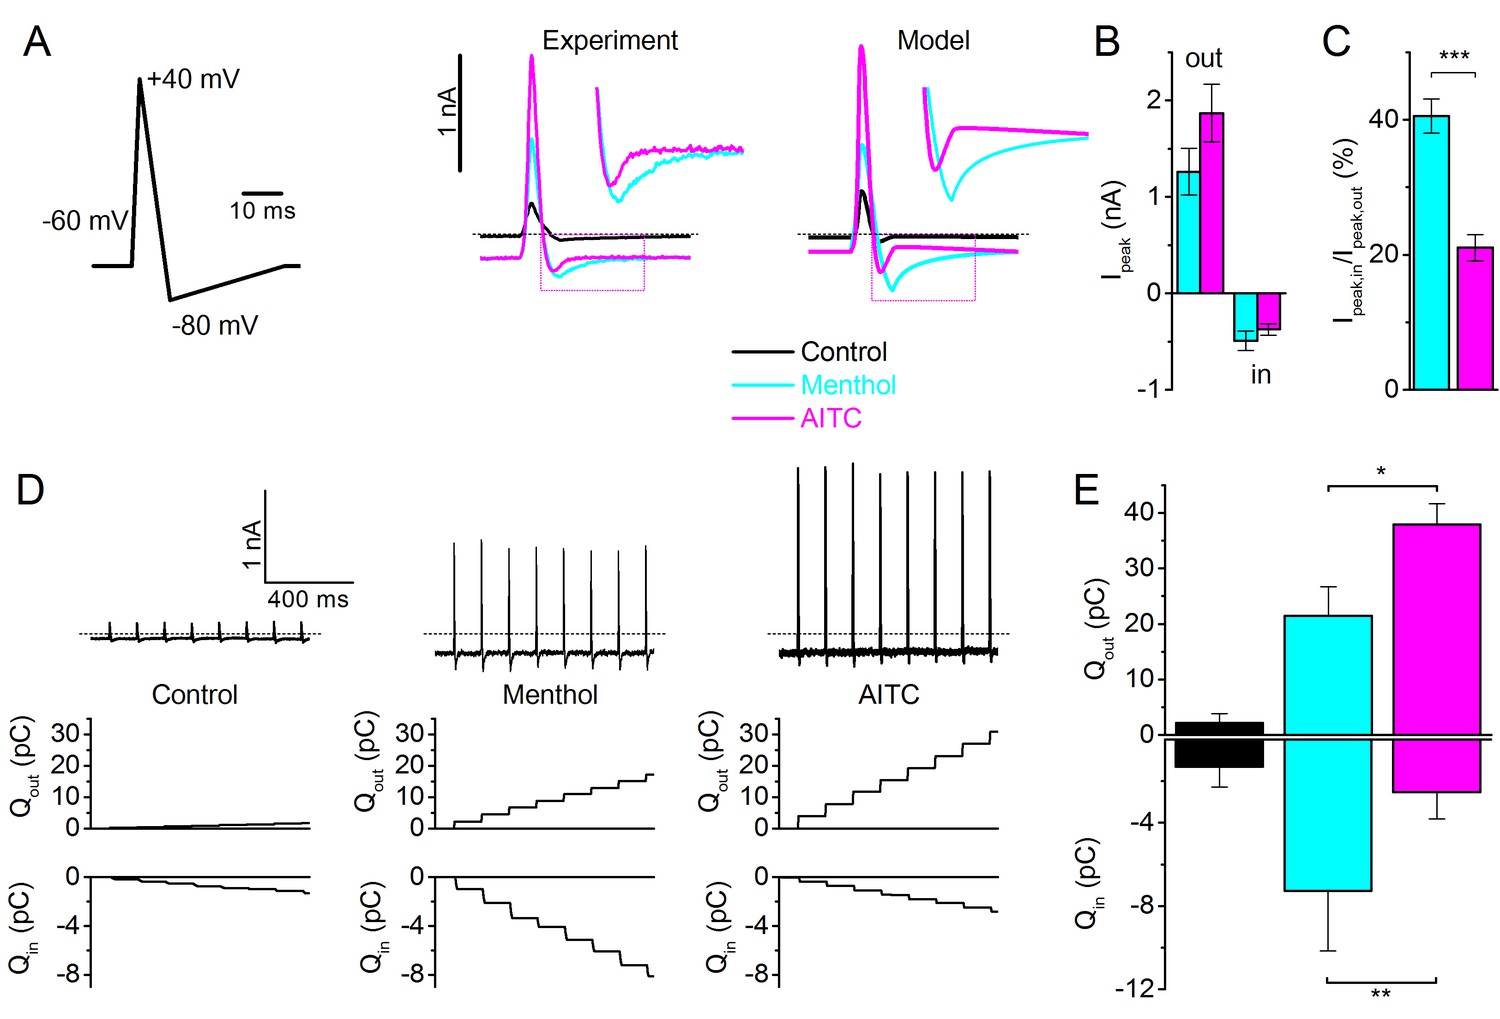
TRPM8 gating during an action potential – Type I versus Type II ligands.
(A) Voltage protocol simulating a sensory neuron action potential (left); TRPM8 currents in HEK293 cells in response to the action potential waveform in control condition and during application of menthol (30 μM) and AITC (3 mM) (middle); and corresponding model simulation (right). Boxed areas are expanded in the inset. (B) Peak outward and inward currents during the action potential waveform in the presence of menthol (cyan) and AITC (magenta; n = 6). (C) Ratio between peak inward and peak outward current in the presence of menthol or AITC. ***p<0.001. (D) TRPM8 current responses during a train of action potentials (1 s; 8Hz) in control condition and during application of menthol and AITC (top); outward (middle) and inward (bottom) charge displacement during the action potential train, determined as the integrated current after subtraction of the holding current. (E) Mean inward and outward charge displacement for the two ligands (n = 5). *p<0.05; **p<0.01.
Figure 7 with 2 supplements
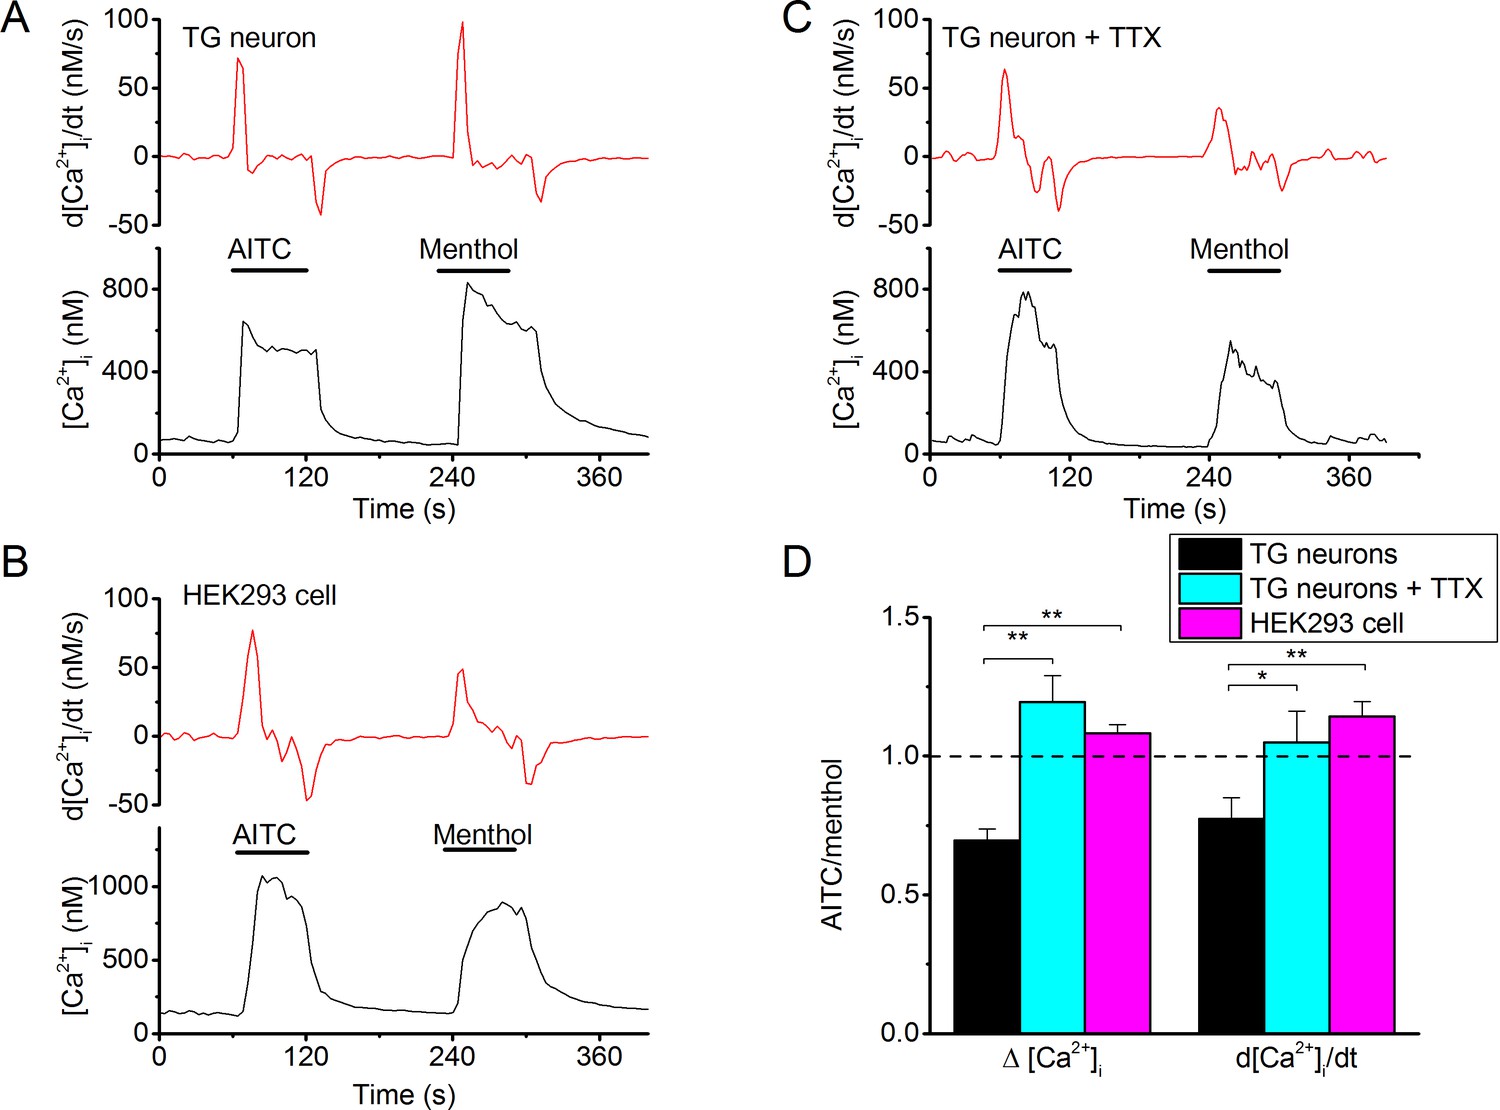
Differential effectiveness of Type I and Type II agonists in excitable versus non-excitable cells.
(A) Fura-2-based intracellular calcium measurements in mouse trigeminal neurons from TRPV1/TRPA1 double knockout mice showing increases in intracellular calcium in response to AITC (3 mM) and menthol (30 µM). The upper trace shows the time differential of the intracellular calcium concentration, which represents a measure of net calcium influx/extrusion mechanisms. The TRPM8-dependence of the responses was ensured based on full block by AMTB (as in Figure 1; not shown). (B) Same as (A), but in the presence of TTX (1 μM) to block neuronal action potentials. (C) Same as (A), but in a HEK293 cell expressing mouse TRPM8. Non-transfected cells did not show any detectable response to AITC or menthol. (C) Relative stimulatory effect of menthol and AITC in control trigeminal neurons (n = 81 from 9 different mice), trigeminal neurons treated with 1 μM TTX (n = 3 from 3 different mice) and HEK293 cells (n = 448). *, **, ***: p<0.05, 0.01 and 0.001, respectively, in paired t-test comparing the response to AITC and menthol within individual cells. ###: P<0.001 in unpaired t-tests comparing TG neurons and HEK293 cells.
Figure 7—figure supplement 1
Activation of mouse TRPM8 by AITC.
(A) TRPM8 currents in response to the voltage step protocol shown in Figure 3A in the absence and presence of AITC (3 mM). (B) Voltage-dependent activation curves corresponding to the currents shown in (A). (C) Current traces in response to the voltage protocol shown in Figure 4A, in control condition and in the presence of menthol (30 μM) and AITC (3 mM). (right) Scaled and expanded currents corresponding to the boxed areas.
Figure 7—figure supplement 2

AITC-induced current inhibition in human versus mouse TRPM8, as well as in chimeric channels.
(A,B) Time courses of whole-cell currents at +100 and −80 mV in HEK293 cells expressing human (left) or mouse (right) TRPM8, upon sequential (A) or simultaneous (B) stimulation with menthol (50 µM) and AITC (3 mM). (C,D) Quantification of the AITC-induced current inhibition in mouse and human TRPM8, as well as in the depicted chimeric channels containing all possible combinations of transmembrane region and N and C termini of both orthologues. In (C) inhibition was quantified as I60s/Ipeak, which represents the remaining current after a 60-s application of 3 mM AITC divided by the peak AITC-induced current. In (D) inhibition was quantified as I60s/Imenthol, which represents the remaining current after a 60-s application of 3 mM AITC divided by the peak current induced by menthol (50 µM). Mean ± SEM for 5–8 cells for each chimeric channel.
Tables
Table 1
Experimentally derived model parameters describing the action of menthol and AITC on TRPM8 gating.
| Parameter | Value | Source |
|---|---|---|
| z | 0.82 | (Voets et al., 2007) |
| −2.7 ± 0.4 kJ mol−1 | Steady-state activation curves (n = 7) | |
| −4.5 ± 0.4 kJ mol−1 | Steady-state activation curves (n = 6) | |
| Kd,AITC | 2.9 ± 0.6 mM | Steady-state activation curves (n = 7) |
| Kd,menthol | 21 ± 4 μM | Steady-state activation curves (n = 6) |
| 10.4 ± 1.2 s−1 | Global kinetic fit (n = 14) | |
| 1.11 ± 0.15 ×10³ s−1 | Global kinetic fit (n = 14) | |
| kon,AITC | 95 ± 35 ×103 M−1 s−1 | Global kinetic fit (n = 7) |
| kon,menthol | 551 ± 210 ×103 M−1 s−1 | Global kinetic fit (n = 7) |
-
Displayed are values for the different parameters that determine the MWC model. For the global kinetic fits, cells were included for which current traces were fit at minimally tree ligand concentrations and two voltages. More details are provided in the text.
Download links
A two-part list of links to download the article, or parts of the article, in various formats.
Downloads (link to download the article as PDF)
Open citations (links to open the citations from this article in various online reference manager services)
Cite this article (links to download the citations from this article in formats compatible with various reference manager tools)
Definition of two agonist types at the mammalian cold-activated channel TRPM8
eLife 5:e17240.
https://doi.org/10.7554/eLife.17240


